


Abstract
Environmentally friendly (green) stock investment has evolved into a global trend over the past few decades, including in the Indonesian capital market. However, the process of selecting sustainability-oriented stocks involves various complex criteria that are often qualitative, subjective, and uncertain. Therefore, an analytical tool is needed to support the decision-making process more adaptively and objectively. This study proposes the Criteria Importance Through Inter-criteria Correlation–Weighted Fuzzy Soft Set (CRITIC-WFSS) integration model, a decision-making method that combines WFSS with the objective, data-driven weighting mechanism of the CRITIC method. In the proposed model, parameter weights are determined by considering data variation (standard deviation) and inter-criteria correlation, ensuring that more discriminative and informative parameters receive higher weights. The model was applied to data on environmentally friendly stocks in the SRI-KEHATI Index, obtained from the Indonesia Stock Exchange (IDX) official website, to evaluate and identify stocks with optimal performance. The model’s performance is evaluated through a comparative study with the AHP-WFSS and Entropy–WFSS methods, complemented by a sensitivity analysis. The results show that UNVR ranked highest with a perfect score of 1, indicating an optimal balance between financial performance and sustainability. Furthermore, a comparative study demonstrated that CRITIC-WFSS can generate rankings that are more reliable, appropriate, and logical than those generated by two comparison methods. Meanwhile, the results of the sensitivity analysis indicate that the CRITIC-WFSS model demonstrates strong robustness to variations in input parameters, ensuring stable rankings. The model shows significant potential to support more accurate and transparent investment decision-making by generating consistent stock rankings based on a balanced integration of financial, and sustainability (environmental, social, and governance (ESG)) aspects. This research was conducted in order to support the achievement of various goals through SDG 8 (Decent Work and Economic Growth).
Keywords:
CRITIC method; weighted fuzzy soft sets; objective weighting; investment decision-making; sustainable stock investment (SDG 8) MSC:
03E72; 90B50; 91B06; 91G80
1. Introduction
In recent decades, the global investment paradigm has undergone a fundamental shift. Investors are no longer solely focused on financial performance but are increasingly emphasizing Environmental, Social, and Governance (ESG) aspects. This paradigm has emerged as a reflection of the growing awareness among investors of climate change issues, regulatory pressures, and the demands of stakeholders to implement ethical and sustainable business practices. In Indonesia, the emergence of stock indices such as the SRI-KEHATI Index provides clear evidence of this trend, creating a demand for analytical tools capable of evaluating investment viability from a more holistic perspective.
It is important to acknowledge that sustainable investment evaluation confronts two principal challenges. First, its inherently multi-criteria nature necessitates the simultaneous consideration of financial metrics (e.g., ROI, financial ratios) and non-financial dimensions (e.g., environmental impact, social responsibility). Second, data about non-financial aspects are predominantly qualitative and ambiguous, complicating objective measurement and comparison. Conventional evaluation methods that depend on subjective weighting, such as the Analytic Hierarchy Process (AHP) [1], are often susceptible to bias and lack the robustness required to manage the intricate characteristics of this data.
To address these limitations, various alternative theories have been developed. One of them is the fuzzy set theory introduced by Zadeh [2]. This set is characterized by a membership function that determines the degree of membership of each element, with values ranging between zero and one. Since its introduction, the theory has been widely applied to address uncertainty problems in various decision-making systems, including multi-criteria decision-making (MCDM) [3,4,5,6]. However, the application of fuzzy sets (FS) in MCDM still faces several challenges, one of which is the difficulty in defining the membership function accurately and objectively for a given case. In addition, Molodtsov [7] introduced the Soft Set (SS) theory as a new approach to handle uncertainty that numerical values or single variables cannot represent. This theory can accommodate and integrate various criteria, both quantitative and qualitative, making it highly suitable for complex decision-making processes, such as evaluating sustainable or green stocks, which consider not only financial performance but also environmental, social, and governance (ESG) aspects [3,4,5,6,7].
Since its introduction in 1999, soft set theory has become a significant focus in the fields of mathematical modeling and decision-making due to its effectiveness in handling uncertainty. Numerous studies have been conducted to advance its theoretical and practical aspects in decision-making [8,9,10,11,12]. Furthermore, the SS theory has been further extended through various modifications to address different analytical needs, including the weighted soft sets (WSS) [13], N-soft set [14], paraconsistent soft set [15], bipolar hypersoft set [16], and the most widely used variant, the fuzzy soft set (FSS) [17].
The FSS theory is an integrated concept that combines the theories of SS and FS into a unified framework. This concept enables the application of fuzzy membership degrees within the parameterization process of the soft set, representing the degree to which an object satisfies each parameter, thereby providing greater flexibility in evaluation compared to classical methods such as AHP or probability theory. Similar to the SS theory, this approach has also been widely applied in various decision-making domains, including investment analysis, business decision-making, corporate performance evaluation, and risk management [18,19,20]. In the context of environmentally friendly (green) stocks, the FSS framework facilitates the integration of financial and ESG criteria to generate a ranking of stock investment alternatives that reflects a balance between profitability and sustainability.
However, the FSS still has certain limitations, one of which is that each parameter is assumed to have the same level of importance without considering its relative contribution to the decision-making process. In reality, each parameter may have a different degree of importance; for instance, financial aspects often carry greater weight than sustainability aspects. This condition may lead to ranking results that are less accurate and do not fully reflect the actual contribution of each parameter. This reason underlies the introduction of the WFSS, in which each parameter is assigned a specific weight to represent its level of importance in the decision-making process [21]. The weighting process makes the WFSS more sensitive to the influence of each criterion and capable of producing more representative ranking results. Although this method addresses some of the limitations of FSS, the subjective determination of weights remains vulnerable to bias and inconsistency. Therefore, a hybrid approach that integrates WFSS with an objective, data-driven weighting method is necessary.
Among the various objective weighting methods in MCDM, the Entropy and Standard Deviation (SD) methods are among the most widely used. The Entropy Method determines weights by measuring the amount of information each criterion provides; a smaller entropy value indicates greater dispersion and thus higher weight [22]. Zhu et al. [23] emphasize that this method focuses solely on internal variation and ignores relationships between variables. In addition, Wang et al. [24] note that entropy-based weights are highly sensitive to changes in data distribution. Meanwhile, the SD method assigns weights directly based on the dispersion of data under each criterion, where a larger standard deviation signifies greater discriminative power and receives a higher weight [25]. While straightforward, it does not account for the relationships between criteria. Jolliffe and Cadima [26] explain that measures based solely on variance cannot represent underlying relationships between variables without considering covariance. Furthermore, Wang et al. [24] point out that standard-deviation-based weights in decision models can be sensitive to outliers and extreme values, potentially distorting the final evaluation when data distributions are skewed.
In contrast, the Criteria Importance Through Inter-criteria Correlation (CRITIC) method is a more comprehensive technique that determines objective weights by simultaneously considering two key aspects of the data: the contrast intensity, measured by the standard deviation, and the conflict between criteria, measured by the correlation coefficient [27]. This dual consideration allows CRITIC to identify and assign higher weights to criteria that not only have high variation (are more discriminative) but are also less redundant (less correlated with others). Compared to the Entropy and SD methods, which focus solely on data dispersion, CRITIC provides a more balanced and rational weighting scheme by filtering out redundant information. This makes it especially suitable for evaluating sustainable stocks, where financial and ESG criteria often exhibit complex interrelationships. For instance, a company’s high revenue growth might be correlated with its community engagement efforts, and CRITIC can objectively discount the weight of such correlated criteria to avoid double-counting their influence. The integration of the CRITIC method with the WFSS, known as CRITIC-WFSS, enables objective determination of parameter weights, resulting in more stable, consistent, and accountable alternative rankings in investment decision-making processes, including within the context of sustainable stock investments.
In recent decades, research in the field of soft set theory has evolved from its basic concepts toward integration with various advanced weighting methods and the application of models to more specific problem domains. A recent study by Carnia et al. [28] integrated the theory of Generalized Interval-Valued Hesitant Intuitionistic Fuzzy Soft Sets (GIVHIFSS) with the AHP weighting method and applied it to complex and uncertain investment decision-making problems. Another study by Subramanian et al. [29] integrated the Fuzzy HyperSoft Set (FHSS) with a Weight-Based Support Vector Machine (WSVM) to address uncertainty, ambiguity, and data complexity in medical decision-making problems. The resulting integrated model is referred to as FHSS-WSVM. Furthermore, Rehman et al. [30] developed a weighted trustworthiness ranking model based on soft set theory to reduce the risk of fraudulent transactions by identifying the most trustworthy nodes within a system. Zulqarnain et al. [31] introduced the Pythagorean Fuzzy Soft Einstein-Ordered Weighted Geometric (PFSEOWG) operator, focusing on the development of a more robust method for solving Multi-Attribute Group Decision-Making (MAGDM) problems. The study also includes the mathematical proofs of the proposed operator’s properties, such as idempotency and boundedness.
Although these studies have made significant contributions to the advancement of knowledge in the field of soft set-based decision-making, they can still be developed. The integration of weighting methods such as CRITIC with the WFSS model and its application in the context of investment decision-making, particularly for sustainable or green stock investments in Indonesia, has not been widely explored. This indicates the need for further research focusing on the development of an adaptive model that aligns with the characteristics of Indonesia’s sustainable stock market.
To address this gap, this study proposes developing a CRITIC–WFSS-based decision-making model to evaluate sustainable stock investments in Indonesia. The model combines the objectivity of the CRITIC weighting method with the flexibility of the WFSS framework to improve the accuracy of stock ranking. The findings of this study are expected to make significant contributions in several areas. First, from a methodological perspective, the developed CRITIC–WFSS model offers a more objective and adaptive approach to investment decision-making, particularly by reducing subjectivity in determining criterion weights. Second, from a practical standpoint, this model provides a useful analytical tool for investors to assess the performance of sustainable stocks, thereby supporting responsible portfolio selection. Third, from a sustainability perspective, implementing this model could encourage increased investment in companies with strong Environmental, Social, and Governance (ESG) performance. Thus, the results of this research not only strengthen sustainable investment practices in Indonesia but also contribute to achieving the Sustainable Development Goals (SDGs).
The structure of this paper is organized as follows: Abstract, Introduction, Preliminaries, Materials and Methods, Results and Discussion, and Conclusions.
2. Preliminaries
2.1. CRITIC Method
The CRITIC method is one of the approaches to MCDM used to determine the objective weights of criteria. This method considers two main aspects: the contrast intensity among criteria and the correlation level between them. Accordingly, the resulting weights reflect the relative importance of each criterion in the decision-making process [27]. The main steps for applying the CRITIC method are as follows [32].
- (1)
- Construction of the decision matrix
The first step in the CRITIC method is to construct a decision matrix. This matrix is a numerical representation of the performance of alternatives against each established criterion. In general, this matrix is arranged in rows and columns, where rows represent alternatives to be evaluated. In contrast, columns represent criteria used as the basis for assessment. The general form of the decision matrix for alternatives and criteria is given by Equation (1).
where the element indicates the performance value of alternative against criterion , for each and . These values are derived from sources such as empirical data, survey results, or expert evaluations.
- (2)
- Construction of the normalized decision matrix
The normalization process of the decision matrix aims to transform all criteria values onto a standard scale, allowing for objective comparison. The normalized matrix is calculated using Equations (2) and (3), where each element is defined for every and .
if criterion is a benefit criterion (where a higher value is better), and
if criterion is a cost criterion (where a smaller value is better), with
- (3)
- Calculation of the standard deviation for each criterion
The standard deviation measures the variability of the alternative ratings for a given criterion. Therefore, criteria with higher dispersion are considered more informative because the differences between alternatives are more apparent. The standard deviation for each criterion is calculated using Equation (6).
where is the average value of the -th criterion.
- (4)
- Creation of correlation matrix
The correlation matrix is constructed to assess the relationships among the criteria using Pearson’s correlation coefficient. To calculate the correlation coefficient between criteria and , the following Equation (7) is used.
The output generated from this process is an correlation matrix.
- (5)
- Calculation of H-index
The H-index represents the relative importance level of each criterion, determined by considering two main aspects: the variability of the criterion, measured using the standard deviation, and the degree of correlation between that criterion and the other criteria. The H-index for criterion is calculated using Equation (8).
- (6)
- Calculation of the final weight
The final step in the CRITIC method is to determine the final weight of each criterion by normalizing the H-index values of all criteria so that the resulting weights fall within the range , and the sum of all weights equals 1. The formula for calculating the final weight is given in Equation (9).
2.2. Fuzzy Soft Set
The concept of the soft set, initially introduced by Molodtsov, was later extended into the Fuzzy Soft Set (FSS), where each element in the universal set is assigned a fuzzy membership degree for every parameter. This extension enables a more flexible and detailed representation of uncertainty compared to the classical soft set, making FSS widely applicable in decision-making, classification, and data analysis involving vague or uncertain information. Before the formal definition of FSS, Definition 1 regarding Soft Sets (SS) is first presented.
Definition 1
([7]). Let be the universal set and the parameter set. A pair is called a soft set (over ) if is a mapping defined by:
where is the power set of
.
For a universal set and a parameter set , the soft set can be written as in Equation (11), and it can be represented in tabular representation as shown in Table 1.
Table 1.
Tabular Representation of the SS .
The value of for each and is defined as in Equation (12).
Example 1.
Given a universal set representing four alternatives, and a parameter set . Soft Set can be defined as:
Next, the definition of FSS is given as follows.
Definition 2
([17]). Let be the universal set, the parameter set, and . A pair is a fuzzy soft set over , where is a mapping from to the set , that is:
where is the collection of all fuzzy sets of .
For a universal set and a parameter set , the fuzzy soft set can be written as in Equation (14), and it can be represented in tabular representation as shown in Table 1, with , where is the membership degree of in criterion .
Example 2.
Recall the universal set and the parameter set from Example 1. Let . The FSS can be defined as follows:
with
The FSS can be represented in tabular form as shown in Table 2.
Table 2.
Tabular Representation of the FSS .
The FSS has been widely applied to address various problems involving uncertainty, particularly in decision-making contexts [33,34,35,36,37]. Roy and Maji [38] introduced an FSS-based decision-making algorithm, as presented in the following Algorithm 1.
| Algorithm 1. Roy and Maji’s Algorithm |
|
Let be a universal set and be a set of parameters. The comparison table is a square table where the number of rows and columns is equal, both being . Each row and column are labeled with the objects from the universal set. An entry in the table, denoted as for each , represents the number of parameters for which the membership degree of object is greater than or equal to the membership degree of object . Subsequently, the rows and columns are summed. The row sum for , denoted by , is obtained using Equation (15).
Similarly, the number of columns of , denoted , is obtained by Equation (16).
Next, the total value of , is given by the following Equation (17).
Example 3.
Table 3.
Comparison Table of the FSS .
Based on Table 3, the number of rows , the number of columns , and the total value for each alternative are obtained as presented in Table 4.
Table 4.
Score Table of the FSS .
Based on Table 4, it is clear that the maximum value of is , which is held by , and the decision supports selecting as the optimal alternative choice.
Beyond theoretical [39] and applied advancements, FSS has also evolved into numerous variants to enhance its representational capability and effectiveness in handling uncertainty. Notable extensions include Hesitant Fuzzy Soft Sets [40], Trapezoidal Fuzzy Soft Sets [41], Intuitionistic Fuzzy Soft Sets [42], Interval-Valued Intuitionistic Fuzzy Soft Sets [43], Effective Fuzzy Soft Sets [44], Spherical Fuzzy Soft Sets [45], and Weighted Fuzzy Soft Set (WFSS) [21].
2.3. Weighted Fuzzy Soft Set
The Weighted Fuzzy Soft Set concept extends the FSS by incorporating the importance (weight) of each parameter in the decision-making process. It was introduced to address a key limitation of the classical FSS, which treats all parameters as equally important. Before the formal definition of WFSS, the definition of a level soft set with respect to a threshold fuzzy set is presented as follows.
Definition 3
([21]). Given a universal set and a parameter set , with . Let be an FSS over and be a threshold fuzzy set. Then the level soft set of the FSS with respect to a threshold fuzzy set is the crisp soft set defined by the following Equation (18).
Here, the value is interpreted as a threshold for the membership degree.
Example 4.
Reconsider the FSS in Example 2. Let be the threshold fuzzy set. Then the level soft set of with respect to , denoted by , is given as follows.
Furthermore, can be represented in tabular form as shown in Table 5.
Table 5.
Tabular Representation of .
Next, the definition of WFSS is given as follows.
Definition 4
([21]). Given a universal set and a parameter set , with . Let denote the set of all fuzzy sets on . A WFSS is defined as a triple , where is an FSS over , and is a weighting function that assigns a weight for each .
The WFSS concept has undergone various developments and has been widely applied to solve diverse problems involving uncertainty, particularly in decision-making contexts [46,47]. Fengs et al. [21] introduced a WFSS-based decision-making algorithm, as presented in Algorithm 2.
| Algorithm 2. Feng’s Algorithm |
|
Example 5.
Reconsider the level soft set as given in Example 4. If the weight vector is set, then the weighted choice value for each alternative is obtained as presented in Table 6.
Table 6.
Tabular Representation of with Weighted Choice Value.
Based on Table 6, it is clear that the maximum value of is , which is owned by and , and the decision maker can choose or as the optimal alternative choice.
In general, to calculate the weighted choice value of alternative , the formula in Equation (19) is used.
where is an entry from the tabular representation as defined in Equation (12) and is the weight of parameter .
2.4. Environmentally Friendly Stocks
Environmentally friendly stocks refer to shares of companies whose operational activities, products, and business models have a positive environmental impact. Investing in such stocks represents a form of capital allocation that incorporates Environmental, Social, and Governance (ESG) considerations into the investment decision-making process. This kind of investment aims to take into account the long-term effects on the environment and nearby communities in addition to financial returns.
In Indonesia, there is growing interest in green investing in environmental stocks, driven by the development of appropriate financial products and indexes. One example of this is the Sustainable and Responsible Investment (SRI) KEHATI Index, launched by the Indonesia Stock Exchange (IDX) in association with the KEHATI Foundation. The index tracks companies that have demonstrated a strong commitment to environmental protection, social responsibility, and good corporate governance.
The environmental aspect of ESG studies involves a company’s efforts to minimize environmental impacts, such as carbon emissions management and the use of renewable energy. The social aspect examines how a company treats its employees and communities, such as evaluation of employee safety performance and corporate social responsibility (CSR). Simultaneously, the governance aspect examines corporate governance, such as transparency and independent boards.
3. Materials and Method
3.1. Materials
This study focuses on environmentally friendly stocks listed on the Indonesian SRI-KEHATI Index. The green index uses the United Nations Principles for Responsible Investment (PRI) and selects companies based on SRI and ESG principles. At the time of this study, 25 publicly traded companies were listed on the SRI-KEHATI Index, as noted on the official website of the Indonesia Stock Exchange. The entire list of these stocks is given in Appendix A (Table A1).
This research aims to develop and implement an investment decision-making model using an integrative approach that combines the CRITIC and WFSS methods. The approach is designed not only from a theoretical perspective but also applied empirically to a case study for evaluating and ranking stocks listed on the SRI-KEHATI Index. The analysis is supported by secondary data collected from the Indonesia Stock Exchange website (https://www.idx.co.id/id, accessed on 25 August 2025) and other relevant sources. The collected data include corporate financial reports and sustainability reports of the companies whose stocks constitute the research objects.
The use of the SRI-KEHATI Index as a sample in this study was a deliberate choice and is consistent with the study’s objectives. Since the aim is to develop a model for sustainable stock investment, the relevant population for testing is companies that have already met a recognized sustainability performance baseline. This index provides a curated universe of such firms, ensuring consistent ESG data for analysis. It is acknowledged that this pre-screened sample is not representative of the broader Indonesian stock market, which includes companies with minimal or no sustainability practices. Consequently, the findings and the model’s performance are contextualized within the domain of sustainable investment options, and generalizability to the entire market is not claimed.
3.2. Method
This study employs a quantitative method with a mathematical approach, integrating the CRITIC and WFSS methods to analyze and model investment decision-making for environmentally friendly stocks in Indonesia. The main concepts and supporting methodologies have been elaborated in Section 2.
This research was conducted through three main steps, as follows:
Step 1: Determining Factors for Environmentally Friendly Stock Investment Decision-Making. The procedures carried out are as follows:
- Identifying factors that impact the environmentally friendly stock investment decision based on the review of literature and empirical studies. The factors are classified under four aspects: financial, environmental, social, and governance.
- Collecting all necessary data, including a list of environmentally friendly stocks in Indonesia that were listed on the SRI-KEHATI Index and additional related data (such as financial reports and sustainability reports for all included stocks).
- Defining the selected factors as a set of parameters for the WFSS. The parameters reflect investors’ preferences regarding sustainability criteria and investment performance.
- Determining the degree of membership of each company with respect to each set of defined parameters.
Step 2: Constructing the Integrated CRITIC-WFSS Model.
This model is built using the framework described in Algorithm 2, with the addition of integrating the CRITIC method to calculate objective weights for each parameter and with necessary adjustments. The procedures carried out are as follows:
- Constructing the decision matrix based on the predetermined alternatives and parameters, which serves as the foundation for computations in the proposed model.
- Applying the CRITIC method to obtain the objective weight of each parameter through six calculation steps as described in Section 2.1.
- In parallel, constructing the FSS using the same set of alternatives and parameters, based on the fuzzy values derived in Step 1.
- Integrating the objective weights produced by CRITIC into the FSS framework to apply the weighting mechanism, resulting in the CRITIC-WFSS decision-making model.
- Formulating the integrative CRITIC-WFSS model in the form of a decision-making algorithm that can be used for evaluating and ranking the alternatives.
Step 3: Applying the CRITIC-WFSS Algorithm to Sustainable Stock Data in Indonesia.
In this step, the sustainable stock data is processed using the CRITIC-WFSS Algorithm constructed in the second step. The procedures carried out are as follows:
- Processing the financial and sustainability data of each company considered in the decision-making process.
- Applying the CRITIC-WFSS algorithm, which includes calculating the objective weights of the parameters and constructing the WFSS structure according to the procedure in Step 2.
- Setting the threshold fuzzy set according to the preferences used in the evaluation.
- Constructing the level soft sets of the CRITIC-WFSS model based on the specified threshold fuzzy set values.
- Constructing a tabular representation of the level soft sets as the basis for the evaluation calculations.
- Calculating the weighted choice value for each alternative using the formula in Equation (19).
- Ranking the company alternatives in descending order based on the obtained weighted choice values.
- Producing the final company ranking list and investment decision recommendations.
4. Results and Discussion
4.1. Investment Decision Parameters for Sustainable Stocks
Having well-defined evaluation criteria is essential for making investment decisions, particularly for green stocks. The selection of criteria in this study was guided by a comprehensive review of the literature on sustainable investing and aligned with internationally recognized frameworks, such as the Global Reporting Initiative (GRI) and the Sustainability Accounting Standards Board (SASB). These frameworks are widely recognized for identifying material ESG issues that influence long-term firm value and investor decision-making [48], ensuring that the selected parameters reflect what matters most from both sustainability and financial perspectives. To provide a balanced, holistic assessment, the criteria were organized into four key pillars of sustainable investing: Financial Performance, Environmental Stewardship, Social Responsibility, and Governance. In this study, we used selected criteria as parameters in the decision-making model. Furthermore, the fuzzy membership degrees for each parameter were processed from IDX data and the Annual Reports and Sustainability Reports of each company. Membership functions are designed to transform a company’s performance on each parameter into a value between 0 and 1. The procedure for determining the membership degrees of each parameter is discussed below.
4.1.1. Financial Aspects
The financial decision-making parameters consist of Return on Equity (ROE) and the stability of a company’s revenue growth. ROE was selected not only as a direct indicator of profitability but also for its role as a moderating factor that amplifies the positive impact of sustainability practices on firm value. As demonstrated by Indrawan et al. [49], companies with higher ROE levels exhibit a stronger correlation between their sustainability efforts and increases in firm value. Hou et al. [50] establish that revenue growth has a positive and significant effect on firm value. Therefore, this study uses revenue growth stability as one of its parameters, positing that growth that is not only positive but also consistent over time provides a more reliable foundation for investor confidence and sustainable value creation.
- Return on Equity (ROE)
To assess a company’s profitability, Return on Equity (ROE) is employed as an indicator of how efficiently the company uses its shareholders’ equity. This measure shows the company’s ability to generate profit from the invested capital. For this study, the ROE values for 2024 were taken from each company’s 2024 Annual Report. The fuzzy membership degree for ROE is then determined using the function provided in Equation (20).
which transforms the actual ROE values to a normalized scale. The 30% benchmark was guided by insights from the financial performance literature, which indicates that ROE levels substantially above industry averages are generally associated with superior profitability and competitive advantage [51]. To apply a more stringent criterion within the sustainability-focused SRI-KEHATI context, we set the threshold at 30% to capture firms demonstrating exceptional performance. Table 7 displays each company’s ROE and corresponding membership values.
Table 7.
Company ROE Value and Membership Degrees.
- Revenue Growth Stability
The stability of a company’s revenue growth is quantified by calculating the standard deviation of its annual growth rates from 2020 to 2024. This metric serves as an indicator of the consistency and sustainability of its financial performance. A lower calculated deviation signifies a more stable and predictable growth trajectory. The annual revenue data used in this calculation were obtained from each company’s Annual Report, provided in Appendix A (Table A2). The membership degree for revenue growth stability is determined through min-max normalization of the revenue growth standard deviation values. Since stability is a cost criterion, the normalization process follows Equation (3), where the lowest standard deviation value receives the highest membership degree, and vice versa. The standard deviation values for each company and their corresponding membership degrees are presented in Table 8.
Table 8.
Company Standard Deviation Values and Membership Degrees.
4.1.2. Environmental Aspects
The environmental decision-making parameters, carbon emission intensity and renewable energy usage were chosen due to their central role in global sustainability standards and their proven influence on firm valuation. Its relevance is underlined by empirical evidence; for example, Indrawan et al. [49] affirm that carbon emission disclosure positively and significantly influences firm value, meaning that transparent and efficient carbon management increases investor confidence and market valuation. Additionally, Sitompul et al. [52] found that using renewable energy improves firm performance by increasing operational efficiency, lowering environmental risks, and boosting corporate reputation. While carbon intensity characterizes the efficiency of current operations, renewable energy usage signals a commitment to future sustainability and qualifies it as a comprehensive and representative core indicator for global ESG performance assessment.
- Carbon Intensity
The carbon intensity parameter is measured as the ratio between total carbon emissions and company revenue (ton CO2 per billion rupiah). This value reflects the company’s efficiency in generating revenue relative to its emissions output. The carbon emission data used in this calculation were obtained from each company’s 2024 Sustainability Report, provided in Appendix A (Table A3). The membership degree for carbon intensity is then calculated using the function specified in Equation (21):
for each . The threshold values were developed with reference to the accounting framework of the GHG Protocol Corporate Standard and an examination of the carbon-intensity patterns reported in Indonesian sustainability disclosures. A threshold of 50 tons CO2 per billion Rupiah in revenue is used to represent an excellent level of performance, reflecting the more progressive practices observed among low-emitting firms. Conversely, an upper bound of 500 tons CO2 per billion Rupiah was derived from the distribution of high-emitting sectors in the dataset and is treated as a level at which membership in the fuzzy set becomes negligible. The carbon intensity values for each company, along with their membership degrees, are presented in Table 9.
Table 9.
Company Carbon Intensity and Membership Degrees.
- Renewable Energy Usage
The renewable energy usage parameter is measured as the proportion of renewable energy to the company’s total energy consumption (in percentage). This value represents the company’s level of adoption and commitment to supporting the transition towards clean energy. Data on the renewable energy usage were obtained from each company’s 2024 Sustainability Report. Subsequently, the membership degree for renewable energy usage is calculated using the function specified in Equation (22) below:
for each . The 10–50% membership thresholds correspond to transition benchmarks commonly used in sustainability reporting, where 10% reflects early-stage adoption and 50% reflects substantial alignment with clean-energy commitments. These thresholds are informed by the disclosure themes of GRI 302, although GRI does not prescribe specific benchmark values. The membership degree representing each company’s adoption of renewable energy, calculated from their usage data, is summarized in Table 10.
Table 10.
Company Renewable Energy Usage and Membership Degrees.
4.1.3. Social Aspects
Parameters in decision-making from the social aspect consist of employee safety performance and community engagement. Employee safety performance reflects a company’s ability to protect its workforce from occupational hazards, aligning with GRI 403. Meanwhile, community involvement captures the extent to which a company contributes to social development and maintains positive relations with local stakeholders, aligning with GRI 413. Empirical evidence reinforces its importance, for example, Mwangangi et al. [53] found that community-related Corporate Social Responsibility (CSR) activities have a positive and significant impact on firm performance, indicating that stronger community engagement enhances stakeholder trust and organizational value. Therefore, both parameters serve as essential indicators of a company’s social responsibility and long-term sustainability performance.
- Employee Safety Performance
The weighting structure for employee safety performance is designed in line with the proactive risk management principles of ISO 45001 [54]. Safety Reporting (35%) and Safety Programs (30%) receive the largest portions as they form the foundation of prevention, while Incident Management (25%), which is more reactive, is given a lower weight. Occupational Health and Safety (OHS) Certification (10%) serves as a basic assurance of the system, making it the smallest yet still essential component. The score is based on information in each company’s 2024 Sustainability Report. The overall score is calculated by assigning proportional weights to these factors and is used immediately as the fuzzy membership degree to display the firm’s overall employee safety performance. The resulting employee safety performance scores are shown in Table 11.
Table 11.
Company Employee Safety Performance Scores.
- Community Engagement
The measurement of the community engagement parameter is based on the principles outlined in the Global Reporting Initiative (GRI 413), which emphasizes community involvement, local development, and transparency. Based on these themes, this assessment uses a weighted composite index consisting of four parts: CSR Programs (35%), Local Stakeholder Engagement (30%), Local Economic Development (25%), and Reporting Transparency (10%). The weight assigned to each component reflects strategic priorities. CSR Programs receive the highest weight because they reflect the company’s most direct contributions to social welfare. Local Stakeholder Engagement is also strongly weighted to highlight the value of meaningful collaboration with surrounding communities. Local Economic Development contributes to local job creation, even indirectly. Reporting Transparency, though weighted lower, remains essential for ensuring accountability and building trust. The score is based on information in each company’s 2024 Sustainability Report. The overall score is calculated by assigning proportional weights to these factors and is used immediately as the fuzzy membership degree to display the firm’s overall community engagement. Community engagement scores are illustrated in Table 12.
Table 12.
Company Community Engagement Scores.
4.1.4. Governance Aspects
The ESG score reflects the parameters for decision-making from a governance perspective. According to Indrawan et al. [49], ESG performance is substantial enough to contribute to company value, meaning that with better governance practices embodied in the ESG assessment, there is significant improvement in investor confidence and a reduction in organizational risk. Thus, the ESG Risk Score becomes an appropriate and representative indicator of governance performance in sustainable investment decision-making.
- ESG Risk Score
The data used consists of ESG risk scores obtained from the official IDX website, accessed on 26 August 2025. Morningstar Sustainalytics conducted the ESG assessment. This institution assesses ESG risk using a risk decomposition approach, which evaluates companies based on two primary dimensions of ESG issues: exposure and management. Exposure represents the material ESG risks a company encounters, directly affecting its overall ESG risk rating. Management indicates the company’s commitment and concrete efforts to address ESG-related challenges through various corporate policies and programs. Based on the calculated ESG risk scores, companies are classified into five categories, as shown in Table 13.
Table 13.
Risk Score Categories.
The higher the ESG risk level, the lower the firm value in the eyes of investors. Conversely, good ESG performance with a low ESG risk level tends to enhance the firm’s value. Subsequently, the membership degree of the ESG risk score is calculated using the function presented in Equation (23):
which is used to convert the ESG risk score (where a lower value is better) into an ESG performance score (where a higher value is better). The conversion methodology is grounded in the investment principle that superior ESG performance positively influences corporate valuation. A complete listing of the ESG scores and their corresponding membership degrees can be found in Table 14.
Table 14.
Company ESG Risk Score and Membership Degrees.
4.2. The CRITIC–WFSS Algorithm
Before constructing the CRITIC–WFSS algorithm, several definitions are introduced to establish the mathematical foundation of the model.
Definition 5.
Let be the universal set and the parameter set. Let be the decision matrix, where denotes the performance rating of alternative with respect to criterion . The vector is the CRITIC weight vector for the criteria set , where each and . These weights are derived by applying the CRITIC method to the matrix .
Definition 6.
Let be the universal set, the parameter set, and be the CRITIC weight vector with respect to . A CRITIC-WFSS is defined as a triple , where is an FSS over , and for each . Furthermore, is given as in Equation (24).
where is the membership degree of alternative in criterion .
Definition 7.
Let be the CRITIC-WFSS over and is a function that assigns a threshold for each . The level soft set of with respect to is the crisp soft set , defined by Equation (25).
The CRITIC–WFSS algorithm was developed through three main steps as presented in Algorithm 3.
| Algorithm 3. CRITIC-WFSS Algorithm |
| Step 1. Determining Weights using the CRITIC Method Input: and . Process This step implements the CRITIC concept described in Section 2.1 through six technical steps, i.e.,:
Step 2. Implementation of the CRITIC-WFSS Model Input: , , and . Process:
Step 3. Alternative Evaluation and Ranking Input: The WFSS model and a threshold fuzzy set . Process:
|
4.3. Application of CRITIC–WFSS Algorithm
Let the universal set , represent the 25 environmentally friendly stocks comprising the SRI-KEHATI index, where , , respectively, indicate ANTM (), ASII (), AUTO (), AVIA (), BBCA (), BBNI (), BBRI (), BBTN (), BMRI (), DSNG (), EMTK (), ICBP (), INCO (), INDF (), INTP (), JSMR (), KLBF (), MTEL (), PGEO (), SIDO (), SMGR (), SMSM (), SSMS (), UNTR (), and UNVR (). Furthermore, a set of parameters , is defined, representing seven criteria for assessing environmentally friendly stocks, namely:
- : ROE.
- : Revenue Growth Stability.
- : Carbon Intensity (ton CO2/Rp billion revenue).
- : Renewable Energy Usage.
- : Employee Safety Performance.
- : Community Engagement.
- : ESG Risk Score.
Step 1: To obtain the weight of each parameter, this study uses the CRITIC method. The calculation steps can be explained as follows.
- (1)
- Construction of the decision matrix
The decision matrix was compiled by quantitatively evaluating the seven parameters, as detailed in Section 4.1. The resulting matrix is presented in Table 15.
Table 15.
Decision Matrix for Sustainable Stock Investment.
- (2)
- Construction of the normalized decision matrix
After constructing the decision matrix, the next step is normalization to equalize the measurement scales among parameters, ensuring that all values fall within the same range, i.e., between zero and one. This process is carried out under the following conditions:
- For parameters , , , and , the benefit criteria, as defined in Equation (2), are applied, indicating that a higher value represents better performance; and
- For parameters , , and , the cost criteria, as defined in Equation (3), are applied, indicating that a smaller value represents better performance.
Previously, the minimum and maximum parameter values obtained from the calculation results of the 25 companies are presented in Table 16, and were used as the basis for the normalization process.
Table 16.
Minimum and Maximum Values for Each Parameter.
Table 17 presents the normalized decision matrix for the seven parameters.
Table 17.
Normalized Decision Matrix for the Seven Parameters.
As an illustration of the normalization process, the following section presents the calculations for the benefit criterion () and the cost criterion () for companies and .
- Parameter (benefit criterion)
- Parameter (cost criterion)
The entry is denoted , , corresponding to the element in row , column of the normalized matrix in Table 17.
- (3)
- Calculation of the standard deviation for each parameter
The standard deviation is calculated to measure the variability of the normalized scores for each parameter. This calculation begins by computing the mean for each parameter in the normalized data in Table 17. Next, the standard deviation is calculated using Equation (6). A higher standard deviation indicates that the parameter has greater power to discriminate between various stock alternatives. The means and standard deviations calculated for each of the seven parameters are presented in Table 18.
Table 18.
Mean and Standard Deviation of Each Parameter.
- (4)
- Creation of correlation matrix
A correlation matrix was constructed at this step to measure the linear association between parameters using Equation (7). The resulting matrix is presented in Table 19.
Table 19.
Correlation Coefficients.
- (5)
- Calculation of H index
The H-index for each parameter was calculated using Equation (8), based on the correlation matrix presented in Table 19. Prior to this calculation, the dissimilarity between parameters was computed as , where denotes an element of the correlation matrix for each . These dissimilarity values are presented in Table 20.
Table 20.
Inter-Parameter Dissimilarity Matrix.
The H-index calculation for each parameter is presented in Equation (28).
where is the standard deviations of , for each , taken from Table 18. The values represent the total dissimilarity of with all other parameters, as provided in Table 20. Next, the H-index values for each parameter are shown in Table 21.
Table 21.
The H index.
- (6)
- Calculation of the final weight
After obtaining , for each , the final parameter weights are determined. These weights are calculated by normalizing each value against the total , as shown in Equation (9). This process yields an objective weight for each parameter, representing its relative importance. The calculated weights are as follows:
Table 22 presents the final parameter weights.
Table 22.
The Final Parameter Weights.
Step 2: An FSS is defined as a mapping , where denotes the collection of all fuzzy subsets of . For each parameter , corresponds to the fuzzy set of stock alternatives satisfying criterion . This is characterized by a membership degree , which indicates the extent to which stock fulfills parameter , with and . The membership degrees for each parameter were determined based on the criteria fulfillment detailed in Section 4.1. This FSS can be represented in tabular form, as shown in Table 23.
Table 23.
Tabular Representation of the FSS .
By integrating the objective weights from Table 21, the CRITIC-WFSS was constructed, as shown in Table 24.
Table 24.
Tabular Representation of the CRITIC-WFSS .
Step 3. Differential threshold values () were established for each parameter, considering the distinct characteristics of each evaluation aspect. For the profitability dimension, ROE was assigned a threshold of ( ROE) as a baseline for adequate returns, while revenue growth stability received a higher threshold () to prioritize firms exhibiting consistent long-term expansion. Within the environmental dimension, the carbon-emission intensity adopted a stringent threshold () to reflect the critical importance of carbon management in sustainable investing, while renewable energy usage adopted a moderate threshold () to balance meaningful transition efforts and practical sectoral constraints. Employee safety carried a stringent requirement (), consistent with a zero-tolerance approach to workplace safety in sustainable investing, while community engagement used a moderate threshold () to recognize companies making basic efforts in community relations while allowing differentiation for those with more substantial programs. The ESG risk threshold was set at to ensure only companies with superior ESG risk management (low or negligible risk scores) qualify as viable sustainable investments. Subsequently, the level soft set was constructed. Then, the weighted choice value for each alternative was computed using Equation (19), as shown in Table 25.
Table 25.
Tabular Representation of the Level Soft Set .
Table 25 shows that UNVR obtained the highest weighted choice value of 1, indicating the best performance among all alternatives evaluated. Thus, this company can be considered the optimal investment option based on the integration of the CRITIC–WFSS method, as it successfully meets all financial and sustainability criteria with high consistency.
Figure 1 shows the weighted choice value of the 25 stocks evaluated. Based on the analysis, there is significant variation in performance across companies. In general, the weighted scores range from 0.45 to 1.00, indicating variations in company performance across a combination of financial and sustainability (ESG) aspects. There are no companies with extremely low scores (close to 0), indicating that all alternatives have a basic level of feasibility and can be considered sustainable investments. UNVR achieved the highest ranking with a perfect weighted choice value of 1, indicating that the company demonstrates optimal consistency in meeting all evaluation criteria, encompassing both sustainability and financial performance. Several other firms, such as SIDO and INDF, also performed well with scores above 0.85, suggesting that they have successfully maintained a balanced approach between financial growth and sustainable practices.
Figure 1.
Weighted Choice Value of Companies Based on the CRITIC–WFSS Model.
In contrast, companies such as BBTN, INCO, and INTP obtained relatively lower scores below 0.55, implying the need for improvement in specific areas, particularly environmental efficiency and financial stability. The overall pattern demonstrates that strong sustainability integration is not limited to specific sectors; rather, it depends on how effectively each firm implements environmental, social, and governance (ESG) principles. Thus, the CRITIC–WFSS model successfully identifies companies that exhibit a well-rounded performance profile and highlights those requiring further strategic improvement to enhance their sustainable investment potential.
Based on these final results, investors can consider UNVR for invest, given its stable financial performance and strong commitment to sustainability. Other stocks, such as PGEO, SIDO, INDF, and SMSM, can also be considered among the top five based on this model’s assessment.
4.4. Comparative Study
To validate the effectiveness of the CRITIC-WFSS model, it was compared against other methodological approaches: the AHP-WFSS (Algorithm 2 with subjective weighting integration based on the AHP method [55]), and Entropy-WFSS (Algorithm 2 with objective weighting based on the entropy framework [56]). These two models were selected as benchmarks because they represent two fundamentally different weighting paradigms, subjective expert judgment (AHP) and objective data-driven variation (entropy). By comparing CRITIC-WFSS against both, the evaluation ensures the proposed model is tested with a range of weightings.
The AHP-WFSS and Entropy-WFSS models use the same dataset as the proposed model (see Table 25), but apply different weights determined by AHP and Entropy, respectively. The results of the comparative study, including the weighted choice value () and the corresponding ranking for each stock alternative, are presented systematically in Table 26.
Table 26.
Comparison of scores and rankings of alternatives by different ranking methods.
Furthermore, a visual summary of the score distribution across the three models is shown in Figure 2.
Figure 2.
Comparative Rankings of 25 Stocks using Different Models.
Table 26 and Figure 2 illustrate the score and ranking comparisons for 25 stocks based on the AHP-WFSS, Entropy-WFSS, and CRITIC-WFSS methods. The results clearly show variations in the score patterns across the three models, indicating differences in how each method interprets and weights the evaluation criteria. UNVR consistently ranks at the top across all three methods, demonstrating strong, stable performance in both financial and sustainability aspects. This persistent dominance across different weighting approaches underscores the company’s robust and balanced performance. Similarly, INDF and SIDO maintain strong positions with scores above 0.87 in all methodologies, indicating their stable performance profiles. In contrast, stocks such as BBTN, INTP, and SMGR remain in lower positions across the three methods, indicating consistently weaker performance in both financial and ESG aspects. This reinforces the proposed model’s validity in identifying truly superior performers.
While all three methods consistently identify the same top-tier and bottom-tier performers, CRITIC-WFSS offers a more comprehensive and balanced approach. Unlike AHP-WFSS, which relies on subjective expert judgments and tends to produce compressed score distributions, and Entropy-WFSS, which is overly sensitive to raw data dispersion resulting in extreme score variations, CRITIC-WFSS successfully integrates two key evaluation aspects: contrast intensity and conflict relationships between criteria.
This advantage is reflected in its ability to capture more nuanced performance profiles, as demonstrated by the case of MTEL, whose performance is better accommodated in CRITIC-WFSS because this method can consider inter-criteria interdependencies undetected by other approaches. Furthermore, CRITIC-WFSS produces more measured and less extreme score distributions compared to Entropy-WFSS, while providing better differentiation than AHP-WFSS for mid-category stocks. Thus, CRITIC-WFSS not only maintains consistency in identifying superior performance but also offers a more robust and comprehensive evaluation framework for sustainable investment decision-making that considers the complex relationships between various financial and ESG criteria.
To quantitatively validate ranking consistency and provide robust statistical evidence, Spearman’s rank correlation analysis was conducted using the standard formula as presented in [57].
The Spearman’s rank correlation analysis in Table 27 shows strong positive correlations among all model pairs, indicating a fundamental consensus in the overall stock rankings. The highest correlation ( = 0.875) between AHP-WFSS and CRITIC-WFSS demonstrates that the proposed objective method closely aligns with the subjective expert judgments embedded in AHP, thereby validating the logical consistency and reliability of CRITIC-WFSS outcomes. This high agreement, coupled with CRITIC’s objectivity and reproducibility, underscores its advantage over both the AHP-WFSS and other objective methods, such as Entropy-WFSS. The slightly lower correlation between Entropy-WFSS and CRITIC-WFSS ( = 0.757) further underscores CRITIC’s greater ability to capture inter-criteria conflicts, thereby yielding a more robust weighting mechanism.
Table 27.
Spearman’s Rank Correlation Matrix.
4.5. Sensitivity Analysis
A sensitivity analysis was conducted by comparing the stock rankings generated under different threshold settings for each criterion. Various combinations of threshold values, representing different minimum acceptance levels for each parameter, were applied to assess the stability of stock rankings in the CRITIC-WFSS model. The threshold set is used as a reference to compare the results with the other threshold combinations. This set represents the baseline evaluation condition, in which no adjustments or modifications are made to the threshold values for each criterion. Figure 3 presents the ranking comparisons under several specified conditions.
Figure 3.
Stability of Stock Rankings under Threshold Variation in the CRITIC–WFSS Model.
In general, the results show that the ranking structure is relatively stable, although there are slight fluctuations in some stocks.
- UNVR consistently ranks first across nearly all threshold combinations, indicating strong and stable performance in both financial and sustainability aspects. Even when different threshold combinations are applied, this stock remains among the top performers. However, when the threshold for parameter (ESG Risk Score) is set above 0.8, UNVR’s ranking slightly declines, although it remains within the top five. Overall, UNVR maintains its position as a leading stock.
- PGEO also demonstrates high stability, with its ranking between 1 and 3 across all threshold combinations. This indicates the company’s resilience to changes in evaluation parameters and demonstrates strong contributions to ESG aspects, along with adequate financial performance.
- Several companies, such as AUTO, JSMR, and SSMS, exhibit significant changes under specific threshold settings, indicating that their performance is susceptible to variations in the applied threshold values.
- Meanwhile, stocks such as BBTN and SMGR consistently ranked low across all threshold scenarios, indicating relatively weak competitiveness in both financial and sustainability performance, as well as minimal influence of threshold variations on their evaluation outcomes.
Overall, changes in the threshold values in the CRITIC-WFSS model shifted the rankings of several stocks but did not significantly alter the extreme positions (highest and lowest). This indicates that the CRITIC-WFSS model demonstrates strong robustness to variations in input parameters, ensuring stable, reliable rankings.
4.6. Limitations of the Proposed Model
Despite its strengths in generating more objective and stable rankings, the CRITIC-WFSS model has some limitations that need to be noted:
- Dependence on ESG Data Quality: The performance and reliability of the CRITIC-WFSS model depend on the quality of its input data. A significant consideration here is the model’s reliance on self-reported corporate sustainability disclosures for the ESG parameters. Although we obtained data from official reports following frameworks such as the GRI, this data can still be subject to reporting bias, differences in interpretation, and greenwashing. These issues with ESG data can affect the accuracy of calculated membership degrees and the model’s final rankings. This is a common issue in ESG-based analytical models.
- Structural limitation in modeling criterion interactions: The model is built upon the soft set theoretical framework, which is highly effective for handling vagueness and parameterizing qualitative data. However, a structural limitation of this framework is that it does not inherently model interactions or non-linear dependencies between criteria. The CRITIC method accounts for linear correlation to reduce redundancy in weights. However, the overall CRITIC-WFSS decision process treats criteria as essentially independent during fuzzy aggregation and choice-value calculation. In problems where criterion interactions are a critical factor, this could be a constraint.
- Complexity of computation: The CRITIC-WFSS model performs complex calculations, requiring more time and computational effort than the standard FSS or an intuitive subjective WFSS approach, especially with a larger dataset.
- The threshold for each criterion is subjective: The determination of thresholds for criterion classification in CRITIC-WFSS remains subjective, relying on researcher judgment or conventional values, which can influence outcomes and model consistency.
4.7. Future Research Directions
The limitations and findings of this study reveal several opportunities to enhance the CRITIC-WFSS model in future research.
- Computational Optimization: To address computational complexity challenges, future research could focus on developing more efficient algorithms to accelerate the CRITIC method’s calculation process, particularly for large-scale datasets, ensuring the model remains practical for big data applications.
- Extension to Model Criterion Interactions: To address the structural limitation related to criterion interdependencies, future work could extend the CRITIC-WFSS model to handle criterion interactions by integrating its objective weights with operators from fuzzy measure theory, such as the Choquet integral, into the aggregation process. This would create a more powerful version of the CRITIC-WFSS model suitable for complex decision environments where criteria are not independent.
- Developing Adaptive Thresholding Mechanisms: Future studies could focus on developing an adaptive threshold determination mechanism, possibly by integrating machine learning or statistical optimization techniques. This would minimize subjectivity, improve consistency, and enhance the robustness of the CRITIC-WFSS model in various decision-making contexts.
- Application in Diverse Contexts: To strengthen the model’s external validity, future research should test CRITIC-WFSS in more complex decision-making contexts, such as supply chain management or medical diagnosis.
5. Conclusions
In this study, the CRITIC-WFSS integration model is proposed as an evaluation method in decision-making. This model combines the strengths of WFSS with the data-based objective weighting mechanism of the CRITIC method. The proposed model is applied through three main steps. First, parameter weighting is determined using the CRITIC method. Second, the weights obtained are then implemented in the WFSS model. Third, the results of the CRITIC-WFSS implementation are then used in the ranking and evaluation of alternatives to produce the optimal choice as the final recommendation.
Next, the model was applied in the context of investment decision-making for sustainable stocks in Indonesia. This application considers financial factors and ESG aspects in an integrated manner. The data source used is stocks included in the SRI-KEHATI Index. The degree of membership of each stock is determined based on quantitative data taken from the company’s Annual Report and Sustainability Report, which reflects the level of compliance with each parameter. The weight of each parameter is calculated objectively using the CRITIC method, which considers data variation and conflicts between parameters. This method automatically gives higher weight to parameters that are more discriminative and informative. The analysis results place UNVR in an optimal position with a perfect score of 1, indicating its best performance in balancing financial and sustainability aspects. In addition, four other stocks, PGEO, SIDO, INDF, and SMSM, also demonstrated strong performance, achieving scores above 0.80 and ranking among the top five stocks.
The comparative analysis reveals notable differences in stock rankings between the proposed CRITIC-WFSS model, the AHP-WFSS, and the Entropy-WFSS. Overall, CRITIC-WFSS provides more objective and balanced results, with UNVR consistently maintaining top positions, while BBTN and SMGR remain at the lower end. Sensitivity analysis further confirms the model’s robustness: variations in threshold values slightly affect rankings but do not alter the top or bottom positions, indicating stable, reliable outcomes.
Although it makes a significant contribution, this model has limitations; it is highly dependent on the quality of input data, requires more complex calculations than conventional methods, and the threshold for each criterion is subjective. Further research can be directed toward computational efficiency optimization, developing adaptive thresholding mechanisms, or application in various decision-making domains to strengthen the external validity and generalization of the model.
Author Contributions
Conceptualization, M.L., E.C. and S.; methodology, M.L., E.C. and S.; software, M.L.; validation, M.L.; formal analysis, M.L.; investigation, M.L., E.C. and S.; resources, E.C. and S.; data curation, M.L., E.C. and S.; writing—original draft preparation, M.L.; writing—review and editing, M.L., E.C. and S.; visualization, M.L.; supervision, E.C. and S.; project administration, E.C.; funding acquisition, S. All authors have read and agreed to the published version of the manuscript.
Funding
This research was supported by the Academic Leadership Grant (ALG) (Number: 4494/UN6.D/PT.00/2025).
Data Availability Statement
The original contributions presented in this study are included in the article. Further inquiries can be directed to the corresponding author.
Acknowledgments
Thank you to Universitas Padjadjaran (Unpad) for providing Article Processing Charge (APC) support. This APC is funded by Unpad through the Indonesian Endowment Fund for Education (LPDP) on behalf of the Indonesian Ministry of Higher Education, Science and Technology, and managed under the EQUITY Program (Contract No. 4303/B3/DT.03.08/2025 and 3927/UN6.RKT/HK.07.00/2025).
Conflicts of Interest
The authors declare no conflicts of interest.
Appendix A. Data
Table A1.
Sustainable Companies in the SRI-KEHATI Index.
Table A2.
Revenue of Sustainable Companies in the SRI-KEHATI Index.
Table A3.
Carbon Emissions Data for Companies in the SRI-KEHATI Index.
References
- Darko, A.; Chan, A.P.C.; Ameyaw, E.E.; Owusu, E.K.; Pärn, E.; Edwards, D.J. Review of application of analytic hierarchy process (AHP) in construction. Int. J. Constr. Manag. 2019, 19, 436–452. [Google Scholar] [CrossRef] [Scilit]
- Zadeh, L.A. Fuzzy sets. Inf. Control 1965, 8, 338–353. [Google Scholar] [CrossRef] [Scilit]
- Dursun, M.; Karsak, E.E. A fuzzy MCDM approach for personnel selection. Expert Syst. Appl. 2010, 37, 4324–4330. [Google Scholar] [CrossRef] [Scilit]
- Çolak, M.; Kaya, İ. Prioritization of renewable energy alternatives by using an integrated fuzzy MCDM model: A real case application for Turkey. Renew. Sustain. Energy Rev. 2017, 80, 840–853. [Google Scholar] [CrossRef] [Scilit]
- Thao, N.X. Similarity measures of picture fuzzy sets based on entropy and their application in MCDM. Pattern Anal. Appl. 2020, 23, 1203–1213. [Google Scholar] [CrossRef] [Scilit]
- Riaz, M.; Hashmi, M.R.; Pamucar, D.; Chu, Y.M. Spherical linear Diophantine fuzzy sets with modeling uncertainties in MCDM. Comput. Model. Eng. Sci. 2021, 126, 1125–1164. [Google Scholar] [CrossRef] [Scilit]
- Molodtsov, D. Soft Set Theory—First Results. Comput. Math. Appl. 1999, 37, 19–31. [Google Scholar] [CrossRef] [Scilit]
- Ali, M.I.; Feng, F.; Liu, X.; Min, W.K.; Shabir, M. On some new operations in soft set theory. Comput. Math. Appl. 2009, 57, 1547–1553. [Google Scholar] [CrossRef] [Scilit]
- Çağman, N.; Enginoğlu, S. Soft set theory and uni–int decision making. Eur. J. Oper. Res. 2010, 207, 848–855. [Google Scholar] [CrossRef] [Scilit]
- Danjuma, S.; Herawan, T.; Ismail, M.A.; Chiroma, H.; Abubakar, A.I.; Zeki, A.M. A Review on Soft Set-Based Parameter Reduction and Decision Making. IEEE Access 2017, 5, 4671–4689. [Google Scholar] [CrossRef] [Scilit]
- Alcantud, J.C.R.; Khameneh, A.Z.; Santos-García, G.; Akram, M. A systematic literature review of soft set theory. Neural Comput. Appl. 2024, 36, 8951–8975. [Google Scholar] [CrossRef] [Scilit]
- Zahedi Khameneh, A.; Kılıçman, A. Multi-attribute decision-making based on soft set theory: A systematic review. Soft Comput. 2019, 23, 6899–6920. [Google Scholar] [CrossRef] [Scilit]
- Balami, H.H.M.; Dzarma, A.G.; Mohammed, M.A. Weighted soft set and its application in parameterized decision making processes. Int. J. Dev. Math. 2025, 2, 131–144. [Google Scholar] [CrossRef] [Scilit]
- Fatimah, F.; Rosadi, D.; Hakim, R.F.; Alcantud, J.C.R. N-soft sets and their decision making algorithms. Soft Comput. 2018, 22, 3829–3842. [Google Scholar] [CrossRef] [Scilit]
- Dong, Y.; Hou, C. A useful method for analyzing incomplete and inconsistent information: Paraconsistent soft sets and corresponding decision making methods. J. Intell. Fuzzy Syst. 2019, 37, 901–912. [Google Scholar] [CrossRef] [Scilit]
- Musa, S.Y.; Asaad, B.A. Bipolar hypersoft sets. Mathematics 2021, 9, 1826. [Google Scholar] [CrossRef] [Scilit]
- Maji, P.K.; Biswas, R.; Roy, A.R. Fuzzy soft set theory. J. Fuzzy Math. 2001, 9, 589–602. [Google Scholar]
- Alcantud, J.C.R.; Cruz Rambaud, S.; Muñoz Torrecillas, M. Valuation fuzzy soft sets: A flexible fuzzy soft set based decision making procedure for the valuation of assets. Symmetry 2017, 9, 253. [Google Scholar] [CrossRef] [Scilit]
- Das, A.K.; Granados, C. An innovative approach to fuzzy soft set based investment framework using machine learning algorithm. In Intelligent Systems for Social Good: Theory and Practice; Springer: Berlin/Heidelberg, Germany, 2022; pp. 151–159. [Google Scholar] [CrossRef] [Scilit]
- Wang, Z.; Hu, M.; Zhang, P.; Li, X.; Yin, S. Dynamic Risk Assessment of High Slope in Open-Pit Coalmines Based on Interval Trapezoidal Fuzzy Soft Set Method: A Case Study. Processes 2022, 10, 2168. [Google Scholar] [CrossRef] [Scilit]
- Feng, F.; Jun, Y.B.; Liu, X.; Li, L. An adjustable approach to fuzzy soft set based decision making. J. Comput. Appl. Math. 2010, 234, 10–20. [Google Scholar] [CrossRef] [Scilit]
- Şahin, M. A comprehensive analysis of weighting and multicriteria methods in the context of sustainable energy. Int. J. Environ. Sci. Technol. 2021, 18, 1591–1616. [Google Scholar] [CrossRef] [Scilit] [PubMed]
- Zhu, Y.; Tian, D.; Yan, F. Effectiveness of entropy weight method in decision-making. Math. Probl. Eng. 2020, 2020, 3564835. [Google Scholar] [CrossRef] [Scilit]
- Wang, Y.M.; Luo, Y. Integration of correlations with standard deviations for determining attribute weights in multiple attribute decision making. Math. Comput. Model. 2010, 51, 1–12. [Google Scholar] [CrossRef] [Scilit]
- Diakoulaki, D.; Mavrotas, G.; Papayannakis, L. Determining objective weights in multiple criteria problems: The critic method. Comput. Oper. Res. 1995, 22, 763–770. [Google Scholar] [CrossRef] [Scilit]
- Jolliffe, L.T.; Cadima, J. Principal component analysis: A review and recent developments. Philos. Trans. R. Soc. A Math. Phys. Eng. Sci. 2016, 374, 20150202. [Google Scholar] [CrossRef] [Scilit]
- Lotfi, F.H.; Allahviranloo, T.; Pedrycz, W.; Shahriari, M.; Sharafi, H.; Razipour-GhalehJough, S. Fuzzy Decision Analysis: Multi Attribute Decision Making Approach; Springer: Berlin/Heidelberg, Germany, 2023. [Google Scholar]
- Carnia, E.; Sukono; Saputra, M.P.A.; Lestari, M.; HS, A.A.S.I.; Azahra, A.S.; Chek, M.Z.A. Integrated Framework of Generalized Interval-Valued Hesitant Intuitionistic Fuzzy Soft Sets with the AHP for Investment Decision-Making Under Uncertainty. Mathematics 2025, 13, 3188. [Google Scholar] [CrossRef] [Scilit]
- Subramanian, B.; Duraisamy, S.; Kaliyaperumal, S.A.; Yesuraj, R.; Balakrishnan, S.; Sagayaraj, S. Hypersoft sets with weight-based SVM for medical uncertainty modeling: A case study in heart disease diagnosis. J. Fuzzy Ext. Appl. 2025, 6, 572–596. [Google Scholar] [CrossRef]
- Rehman, A.U.; Jiang, A.; Rehman, A.; Paul, A. Weighted Based Trustworthiness Ranking in Social Internet of Things by using Soft Set Theory. In Proceedings of the 2019 IEEE 5th International Conference on Computer and Communications (ICCC), Chengdu, China, 6–9 December 2019; pp. 1644–1648. [Google Scholar] [CrossRef] [Scilit]
- Zulqarnain, R.M.; Siddique, I.; Ahmad, S.; Iampan, A.; Jovanov, G.; Vranješ, Đ.; Vasiljević, J. Pythagorean Fuzzy Soft Einstein Ordered Weighted Average Operator in Sustainable Supplier Selection Problem. Math. Probl. Eng. 2021, 2021, 2559979. [Google Scholar] [CrossRef] [Scilit]
- Mohamadghasemi, A.; Hadi-Vencheh, A.; Hosseinzadeh Lotfi, F. The multiobjective stochastic CRITIC–TOPSIS approach for solving the shipboard crane selection problem. Int. J. Intell. Syst. 2020, 35, 1570–1598. [Google Scholar] [CrossRef] [Scilit]
- Çelik, Y.; Yamak, S. Fuzzy soft set theory applied to medical diagnosis using fuzzy arithmetic operations. J. Inequalities Appl. 2013, 2013, 82. [Google Scholar] [CrossRef] [Scilit]
- Tripathy, B.K.; Sooraj, T.R.; Mohanty, R.K. A new approach to fuzzy soft set theory and its application in decision making. In Computational Intelligence in Data Mining—Volume 2: Proceedings of the International Conference on CIDM, 5–6 December 2015; Springer: Berlin/Heidelberg, Germany, 2015; pp. 305–313. [Google Scholar]
- Sooraj, T.R.; Mohanty, R.K.; Tripathy, B.K. Fuzzy soft set theory and its application in group decision making. In Advanced Computing and Communication Technologies: Proceedings of the 9th ICACCT, 2015; Springer: Berlin/Heidelberg, Germany, 2016; pp. 171–178. [Google Scholar]
- Unni, A.; John, S.J.; Baiju, T. Circular Intuitionistic Fuzzy Soft Set Theoretic Approach to Decision Making Problems. IEEE Access 2024, 12, 144818–144836. [Google Scholar] [CrossRef] [Scilit]
- Singh, R.; Bhardwaj, N. Fuzzy soft set theory applications in medical diagnosis: A comprehensive review and the roadmap for future studies. New Math. Nat. Comput. 2025, 21, 597–619. [Google Scholar] [CrossRef] [Scilit]
- Roy, A.R.; Maji, P.K. A Fuzzy Soft Set Theoretic Approach to Decision Making Problems. J. Comput. Appl. Math. 2007, 203, 412–418. [Google Scholar] [CrossRef] [Scilit]
- Acharjee, S.; Medhi, S. The correct structures in fuzzy soft set theory. arXiv 2024, arXiv:2407.06203. [Google Scholar] [CrossRef] [Scilit]
- Suo, C.; Li, Y.; Li, Z. A series of information measures of hesitant fuzzy soft sets and their application in decision making. Soft Comput. 2021, 25, 4771–4784. [Google Scholar] [CrossRef] [Scilit]
- Khalil, A.M.; Hassan, N. A note on the paper The trapezoidal fuzzy soft set and its application in MCDM. Appl. Math. Model. 2017, 48, 731–735. [Google Scholar] [CrossRef] [Scilit]
- Çağman, N.; Karataş, S. Intuitionistic fuzzy soft set theory and its decision making. J. Intell. Fuzzy Syst. 2013, 24, 829–836. [Google Scholar] [CrossRef] [Scilit]
- Zulqarnain, R.M.; Xin, X.L.; Saqlain, M.; Khan, W.A. TOPSIS Method Based on the Correlation Coefficient of Interval-Valued Intuitionistic Fuzzy Soft Sets and Aggregation Operators with Their Application in Decision-Making. J. Math. 2021, 2021, 6656858. [Google Scholar] [CrossRef] [Scilit]
- Alkhazaleh, S. Effective Fuzzy Soft Set Theory and Its Applications. Appl. Comput. Intell. Soft Comput. 2022, 2022, 6469745. [Google Scholar] [CrossRef] [Scilit]
- Güner, E.L.I.F.; Aygün, H.A.L.I.S. Spherical fuzzy soft sets: Theory and aggregation operator with its applications. Iran. J. Fuzzy Syst. 2022, 19, 83–97. [Google Scholar] [CrossRef]
- Das, A.K. Weighted fuzzy soft multiset and decision-making. Int. J. Mach. Learn. Cybern. 2018, 9, 787–794. [Google Scholar] [CrossRef] [Scilit]
- Wen, X. Correction to: Weighted hesitant fuzzy soft set and its application in group decision making. Granul. Comput. 2023, 8, 1607. [Google Scholar] [CrossRef] [Scilit]
- Khan, M.; Serafeim, G.; Yoon, A. Corporate sustainability: First evidence on materiality. Account. Rev. 2016, 91, 1697–1724. [Google Scholar] [CrossRef] [Scilit]
- Indrawan, A.; Himawan, I.S.; Eriswanto, E.; Rahmadini, S.A. ROE as A Moderating Influence of ESG, Green Innovation and Carbon Emission Disclosure on Firm Value. BALANCE Econ. Bus. Manag. Account. J. 2025, 22, 205–222. [Google Scholar] [CrossRef] [Scilit]
- Hou, A.; Djohan, D.; Nabella, S.D.; Harianto, A. The Influence of Revenue Growth and Operating Expenses on Company Value. J. Ilm. Manaj. Kesatuan 2025, 13, 1827–1838. [Google Scholar] [CrossRef] [Scilit]
- Damodaran, A. Investment Valuation: Tools and Techniques for Determining the Value of Any Asset; John Wiley & Sons: Hoboken, NJ, USA, 2012. [Google Scholar]
- Sitompul, H.; Saifi, M.; Hutahayan, B.; Sunarti. Use of renewable energy to enhance firm performance: A systematic review. Sustainability 2024, 16, 9157. [Google Scholar] [CrossRef] [Scilit]
- Mwangangi, A.S.; Atikiya, D.R.; Nzulwa, D.J.; Odhiambo, R.R. Effect of community related CRS on performance of manufacturing firms in Kenya. Eur. J. Bus. Manag. 2017, 9, 68–79. [Google Scholar]
- ISO 45001:2018; Occupational Health and Safety Management Systems: Requirements with Guidance for Use. International Organization for Standardization: Geneva, Switzerland, 2018.
- Saaty, T.L. Decision making with the analytic hierarchy process. Int. J. Serv. Sci. 2008, 1, 83–98. [Google Scholar] [CrossRef] [Scilit]
- Banadkouki, M.R.Z. Selection of strategies to improve energy efficiency in industry: A hybrid approach using entropy weight method and fuzzy TOPSIS. Energy 2023, 279, 128070. [Google Scholar] [CrossRef] [Scilit]
- Ali Abd Al-Hameed, K. Spearman’s correlation coefficient in statistical analysis. Int. J. Nonlinear Anal. Appl. 2022, 13, 3249–3255. [Google Scholar]
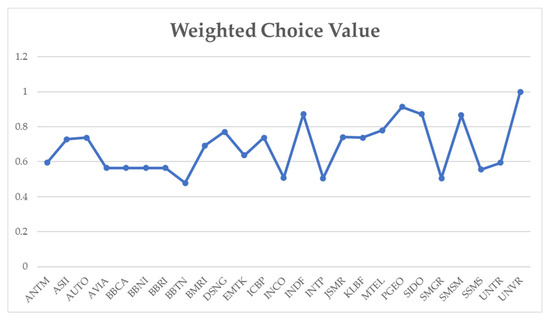
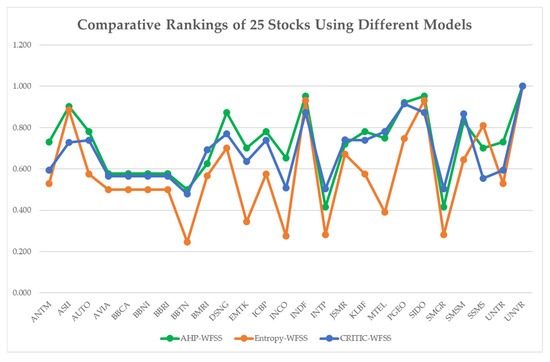
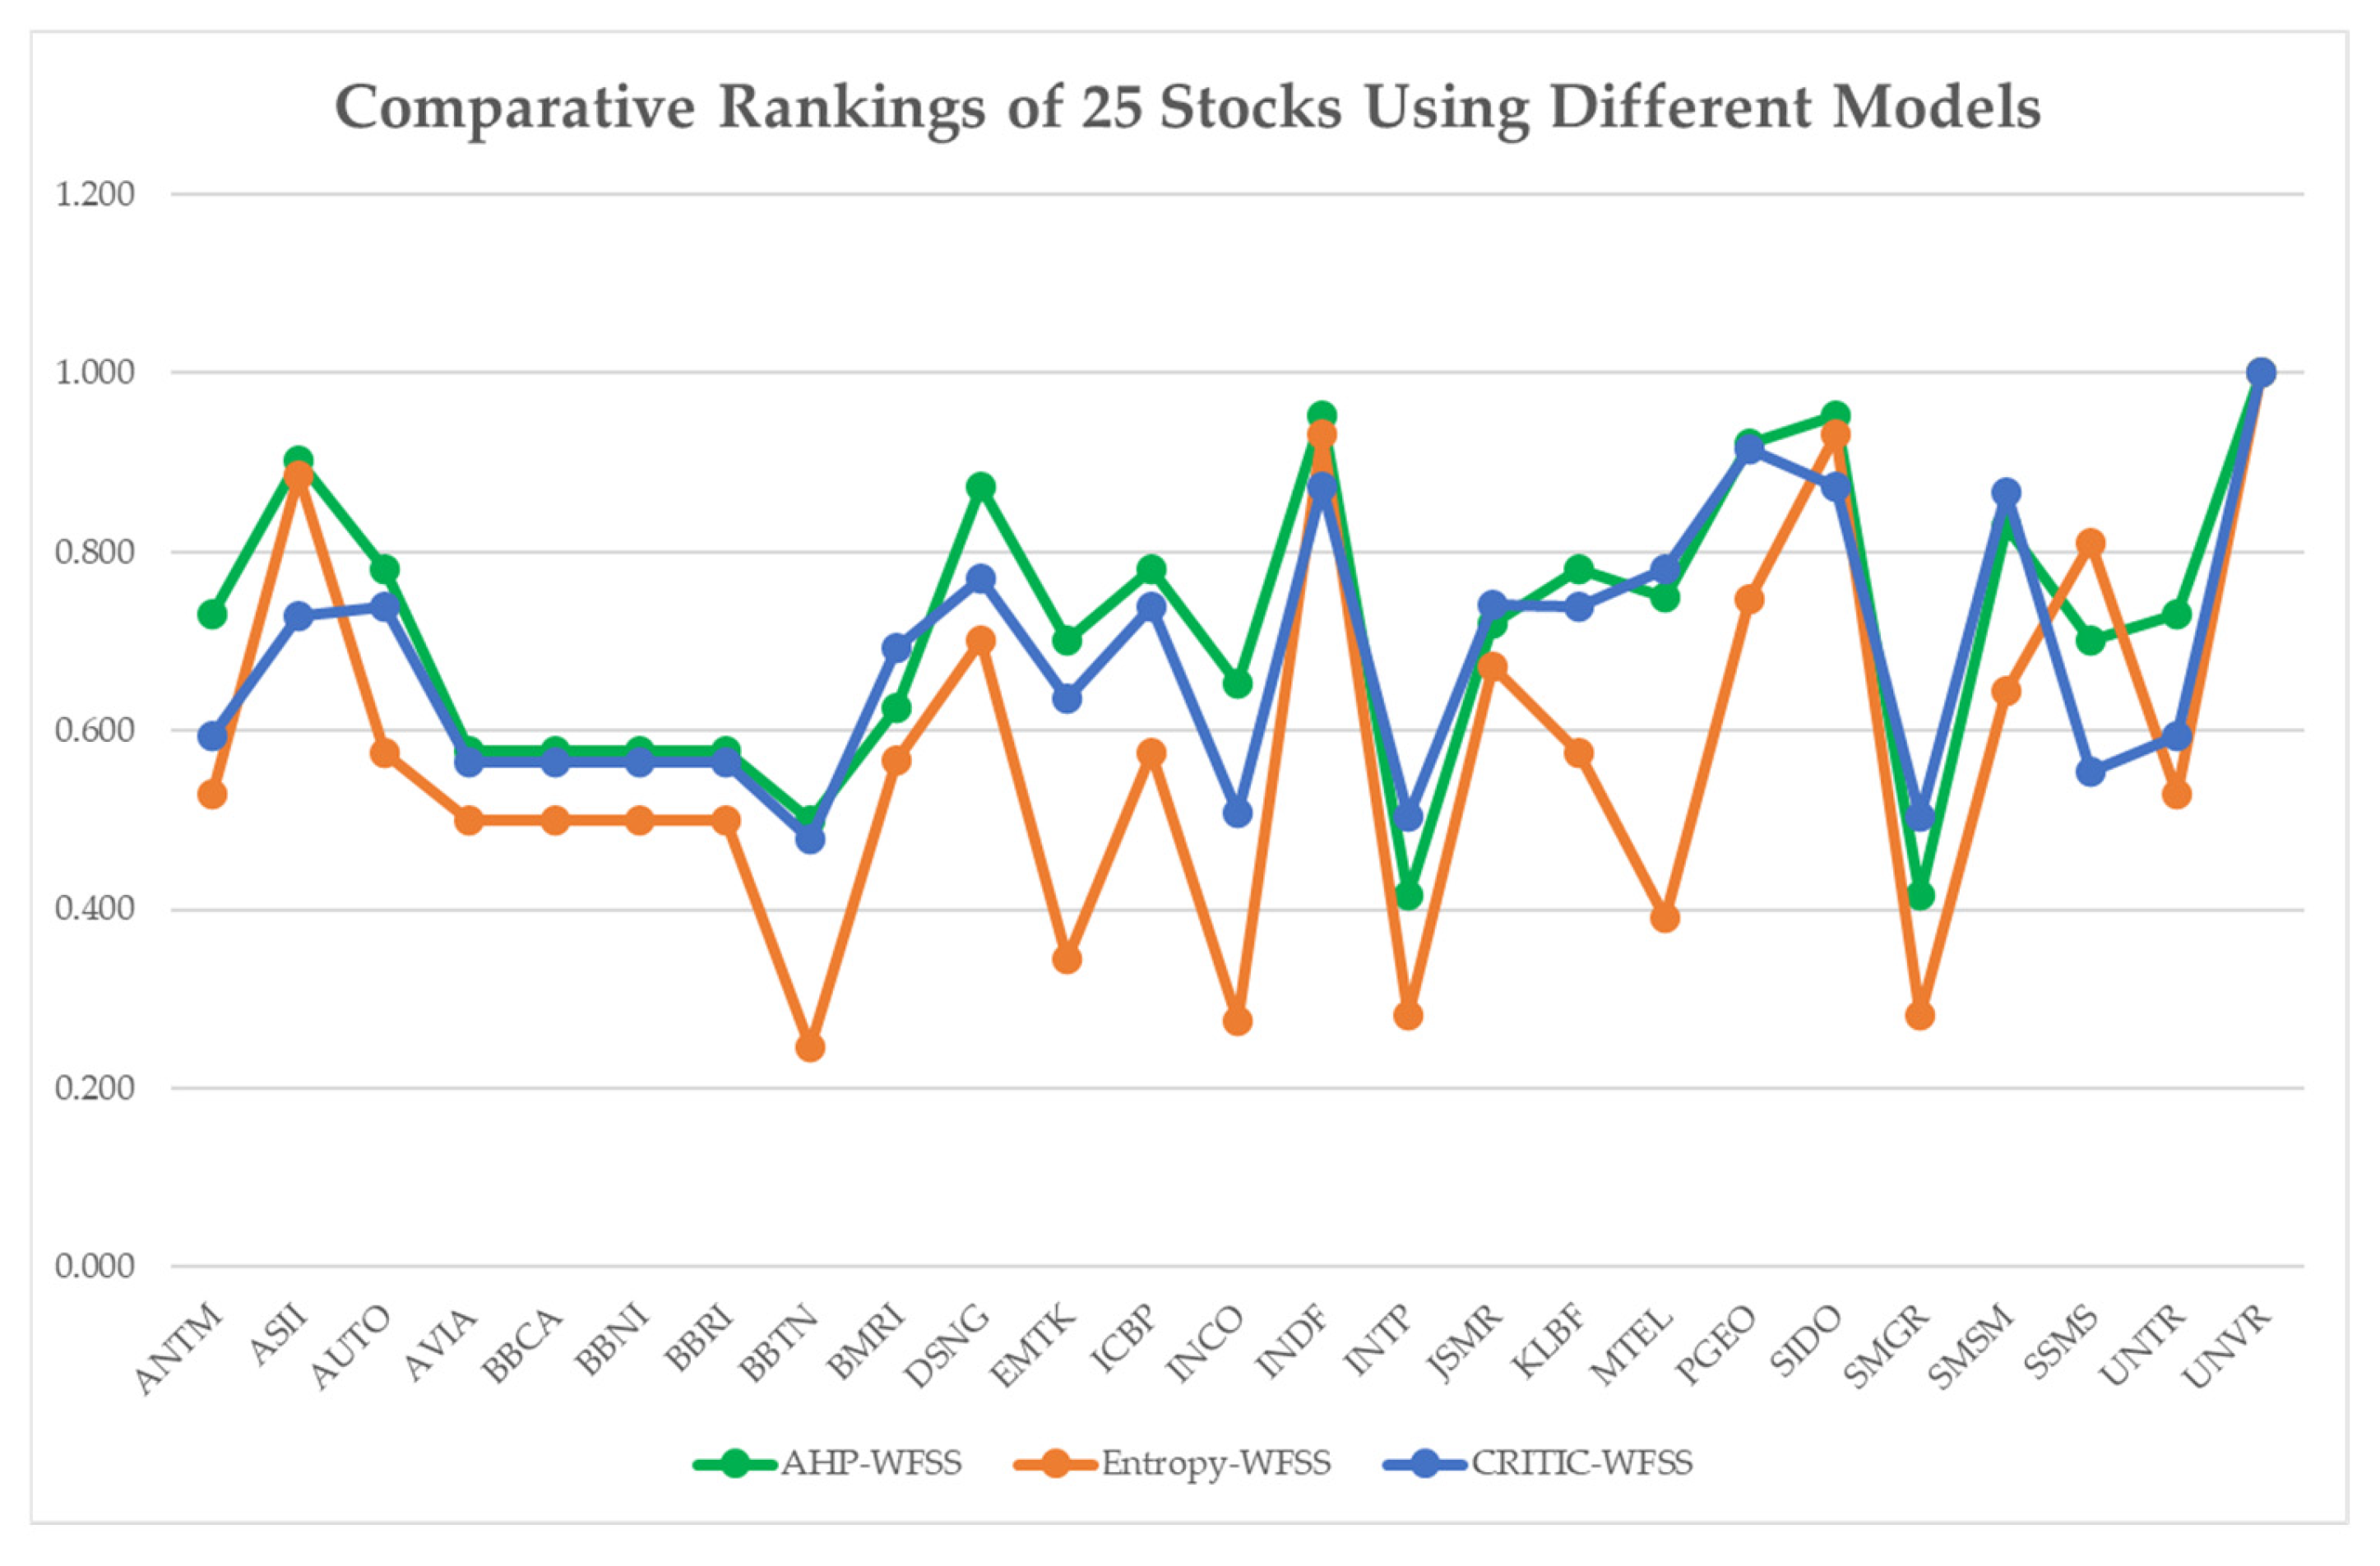
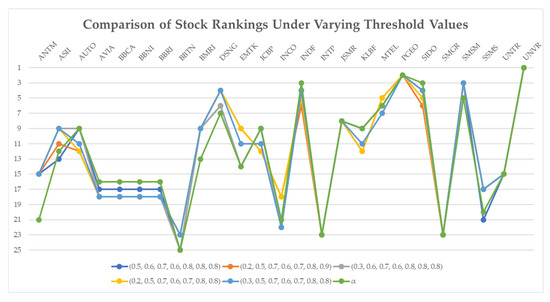
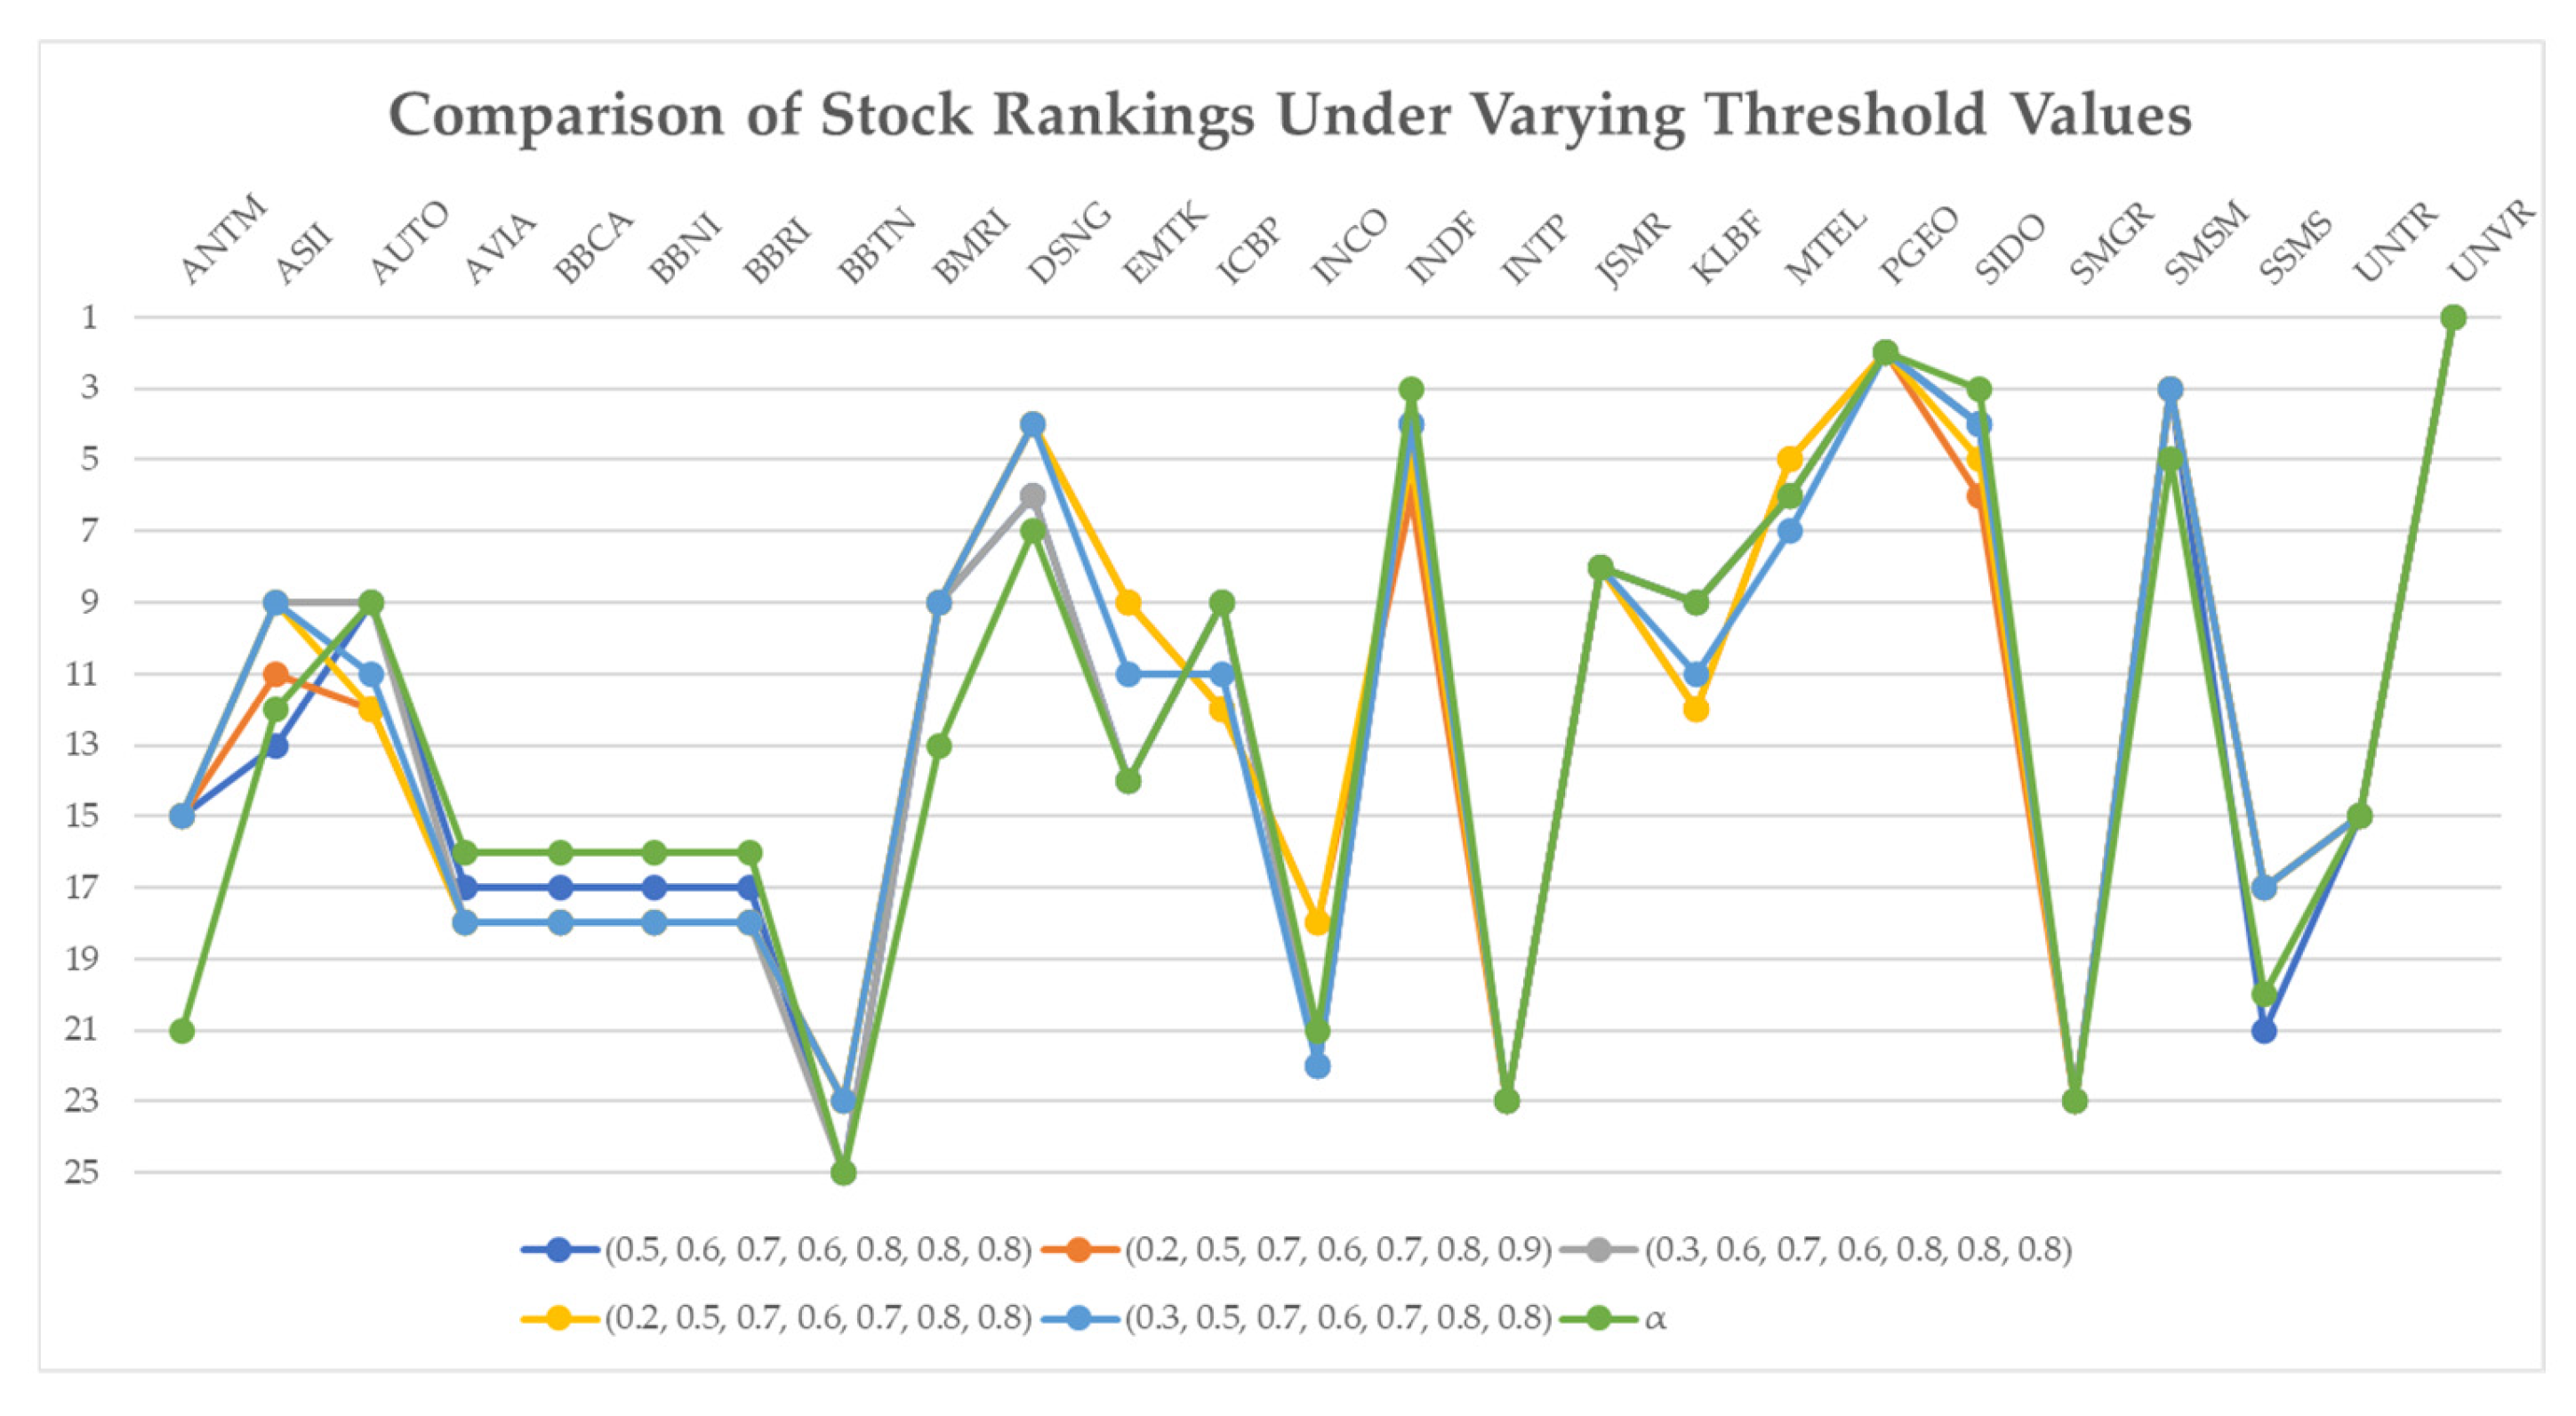

Disclaimer/Publisher’s Note: The statements, opinions and data contained in all publications are solely those of the individual author(s) and contributor(s) and not of MDPI and/or the editor(s). MDPI and/or the editor(s) disclaim responsibility for any injury to people or property resulting from any ideas, methods, instructions or products referred to in the content. |
© 2025 by the authors. Licensee MDPI, Basel, Switzerland. This article is an open access article distributed under the terms and conditions of the Creative Commons Attribution (CC BY) license (https://creativecommons.org/licenses/by/4.0/).