Abstract
This paper investigates a service-oriented hybrid supply chain involving a manufacturer, a service provider, and an integrator, where product demand is jointly influenced by service level and retail price. To address the increasing dominance of service providers in value creation, we construct two Stackelberg game models under different power structures: manufacturer-dominant and service-provider dominant. The models characterize the equilibrium pricing and service decisions across supply chain members considering service sensitivity. Analytical results indicate that the service-provider dominant structure outperforms in high-sensitivity markets, resulting in higher service levels, demand, and overall supply chain profits. Numerical experiments further validate the theoretical findings and offer managerial insights into the design of power structures in service-integrated supply chains. The results offer guidance for optimizing pricing and service strategies in complex, service-sensitive environments.
MSC:
91A65
1. Introduction
With the rapid development of the manufacturing industry, consumer demand is shifting increasingly towards higher-quality, personalized, and integrated products. This represents a transition from focusing solely on traditional product functionality to emphasizing experiential and customized needs. When traditional manufacturing methods fail to meet these demands, there is an urgent need for new production approaches to satisfy such customer requirements [1]. Service-oriented manufacturing is a new model driven by diversifying customer demands, where “manufacturing and services are integrated.” It expands manufacturing into services and allows services to permeate manufacturing through networked collaboration. Ultimately, it provides customers with a “product + service” product-service system [2]. As a result, the traditional “product-dominant” manufacturing model is gradually shifting towards a service-oriented manufacturing model led by “product-service systems”. The traditional supply chain operation model is no longer suitable for service-oriented manufacturing hybrid supply chains. Against this backdrop, various stakeholders, such as manufacturers, service providers, and integrators, form a new collaborative framework around product manufacturing, service delivery, and system integration. This gives rise to an increasing service-shifting towards a higher-quality oriented manufacturing hybrid supply chain characterized by multi-role participation and complementary functions. In this hybrid supply chain, manufacturers remain responsible for producing the products, while service providers are in charge of offering value-added services. Integrators are responsible for bundling the products and services, ultimately creating a complete product-service system and selling it to customers.
As service factors increasingly influence consumer decision-making, the power structure within supply chains is undergoing a profound transformation. The role of service providers has gradually shifted from that of a supporter to that of a leader, evolving from a supplementary participant into a key driver of value creation. To further explain this diversified power configuration, Kretschmer et al. [3] proposed the “meta-organization theory”, This theoretical framework provides valuable insights into the heterogeneous sources of power among participants in hybrid supply chains—manufacturers derive power from controlling technological standards, service providers gain influence through direct connections with end-users, and integrators obtain dominance by establishing coordination mechanisms and governance rules. Consequently, the mechanisms through which power is formed among different participants vary significantly, and these differences directly determine their strategic positions and behavioral choices within the supply chain. As service factors play an increasingly dominant role in shaping consumer preferences, the center of power within the supply chain is progressively shifting from the manufacturing end toward the service end. The power interactions among manufacturers, service providers, and integrators lead to complex dynamics in pricing strategies, service levels, and profit distribution. In response to these evolving dynamics, this study aims to establish a systematic theoretical model that captures the influence of different power structures on pricing mechanisms, service decisions, and overall supply chain performance. Such an approach not only elucidates the operational logic of service-oriented hybrid supply chains but also provides theoretical support for enterprises seeking to optimize decision-making in complex and dynamic market environments.
Building on this analytical motivation, the study constructs a hybrid supply chain framework comprising a manufacturer, a service provider, and an integrator. The manufacturer produces the product, the service provider delivers value-added services, and the integrator markets the product–service system to end customers. We investigate the equilibrium behavior of members in service-oriented manufacturing hybrid supply chains under alternative power structures. Specifically, we examine how equilibrium outcomes change when the manufacturer versus the service provider acts as the channel leader. Against the backdrop of rising consumption levels and growing demand for high-quality services, service sensitivity—defined as consumers responsiveness to service quality—has become a pivotal driver shaping market dynamics and supply chain decision-making. From a mechanism perspective, an increase in service sensitivity exerts a dual, interactive influence on supply chain operations. On the one hand, it amplifies the service provider’s incentive to enhance service levels, as improved service quality can more effectively capture consumer preferences and boost actual market demand for the product-service system. On the other hand, this sensitivity-driven demand shift triggers a sequential transmission effect along the supply chain: Starting from the service provider’s service adjustments, it prompts the integrator to optimize retail prices (to align with willingness to pay for better services) and the manufacturer to recalibrate product wholesale prices (to adapt to the changed demand scale and profit distribution logic). These pricing and service adjustments, in turn, form a feedback loop—further influencing the service provider’s subsequent service investment decisions and the integrator’s market positioning, ultimately reshaping the overall profit allocation among all supply chain participants. Building on these observations, we compare equilibria across the two leadership regimes and conduct comparative statics to evaluate how changes in service sensitivity influence the manufacturer’s wholesale price, the service provider’s service level, the integrator’s retail price, and the profits of all participants, and to identify which power structure is more advantageous in service-oriented hybrid supply chains. To this end, we develop a game-theoretic model that formalizes the relevant interaction mechanisms and their implications.
2. Literature Review
2.1. Power Structure Research in Supply Chains
We first discuss recent research on power structures in traditional supply chains—an essential context for understanding how decision-making authority affects the coordination of multi-party participants, especially in service-oriented scenarios. Traditional supply chains primarily consisted of manufacturers and retailers, with power typically concentrated in manufacturers. However, this manufacturer-dominant structure has gradually evolved with economic development: large retail giants, by virtue of their proximity to consumer markets and access to real-time demand information, have gained greater bargaining power, leading to the emergence of retailer-dominant structures as a growing trend. Chen et al. [4] examine the pricing strategy setting and the impact of supply chain power structures on pricing decisions and performance in the online-to-offline (O2O) retail service supply chain, using the Supplier-Stackelberg, Retailer-Stackelberg, and Nash game theories. Zhai et al. [5] have developed game-theoretic models for manufacturer-dominant and retailer-dominant channel structures under different conditions, revealing the moderating effect of power allocation on service investment and risk response strategies. Based on Stackelberg game theory, Yang et al. [6] further characterized leader-follower relationships between manufacturers and retailers using Stackelberg theory, yet their focus remained on traditional product-centric supply chains, with no exploration of how service integration alters power dynamics.
As research contexts expanded to hybrid supply chains (which integrate product and service flows), game-theoretic mechanisms became more complex, but most studies still overlooked the unique role of service providers in power structures. Cao et al. [7] developed a game model to explore how product quality and retailer promotion affect hybrid-channel performance, finding that promotion-driven Pareto improvement depends on product quality—but their framework treated “service” as an auxiliary attribute of retailing, rather than assigning it to an independent service provider. Wan & Fan [8] and Wan & Fan [9] introduced online platforms into multi-party hybrid channels, highlighting the critical role of platform-dominant structures in pricing and coupon decisions; however, their models centered on “manufacturer-platform-consumer” or “retailer-platform-consumer” interactions, with no dedicated analysis of service providers as power actors. Bian et al. [10] compared integrated, decentralized, and service outsourcing channels to examine how power structures influence pricing and service decisions, noting that dominant parties capture more revenue—but their “service outsourcing” setting reduced service providers to passive executors, rather than active leaders. Even Ma et al. [11], who constructed a three-channel hybrid supply chain model (covering manufacturer-dominant, retailer-dominant, and joint decision-making structures) from a low-carbon policy perspective, focused exclusively on product flow coordination and ignored the power shifts brought by service value creation.
Collectively, these studies have laid a foundation for understanding power dynamics in hybrid supply chains, but they share a critical limitation: none have incorporated service providers as independent dominant players in game-theoretic analyses. This gap is particularly notable in service-oriented manufacturing hybrid supply chains—where service providers are no longer mere “supporters” of product sales, but rather key contributors to value creation. As such, exploring power structures led by service providers is essential to addressing the practical needs of service-integrated supply chains, which is the core focus of this paper.
2.2. Service Sensitivity and Hybrid Supply Chain
In this theme, we focus on recent studies on service-oriented manufacturing hybrid supply chains, with a particular emphasis on the role of service sensitivity—a key variable that captures responsiveness to service quality, and thus directly shapes demand for product-service systems. A service supply chain is a system formed by a network of suppliers, service designers, service providers, and other service partners. Service supply chain management is increasingly playing a crucial role in modern economies [12]. Research shows that service-oriented manufacturing hybrid supply chains integrate the dual tasks of product manufacturing and service delivery, resulting in more complex information flows and capability configurations [13]. Moreover, embedding services and introducing service dimensions in service-oriented manufacturing hybrid supply chains increase the coordination difficulty among multiple entities in the hybrid supply chain [14], yet few studies have linked these challenges to service sensitivity.
Zuo et al. [15] developed a coordination model for a hybrid supply chain composed of a manufacturer, a service provider, and an integrator, and they noted that product demand is influenced by the service provider’s effort level and market uncertainty. However, their model did not include a service sensitivity parameter—meaning it could not quantify how changes in consumer responsiveness to service affect demand and subsequent decisions. Zhang et al. [16] also considered service levels in a hybrid supply chain model, proposing a mixed-integer programming model that integrates service time and delivery quantity, but their analysis focused on operational efficiency rather than the market-side impact of service sensitivity.
Some scholars have recognized service sensitivity as a core element of service strategy performance [17], but their research has mostly been confined to traditional supply chains. Chung et al. [18] introduce ‘service’ as a competitive instrument alongside ‘price’ in the McGuire-Stalin duopoly game, studying the role of service in shaping an equilibrium supply chain structure-—but their model involved only two manufacturers and no independent service providers or integrators. Chen & Wu [19] developed a pricing model for traditional supply chains that incorporates channel preference and service level, finding that service sensitivity significantly affects optimal pricing under centralized and decentralized scenarios; however, their framework was limited to “manufacturer-retailer” two-party channels, with no consideration of the three-party interactions that define hybrid supply chains. Wang & Hu [20] further introduced service sensitivity and greenness parameters into a logistics service supply chain, proposing multi-game models to simulate strategic interactions—but their two-stage chain lacked the product-service integration and multi-party coordination that characterize our research context. In their studies, both Roy & Das [21] and Yang et al. [22] considered the joint impact of service sensitivity and retail price on overall demand. However, most of these findings related to service sensitivity remain focused on traditional supply chains and have not yet been extended to hybrid supply chain settings, where manufacturers, service-providers, and integrators coexist within a service-oriented manufacturing context.
In summary, while existing studies have confirmed service sensitivity as a key driver of pricing and service decisions, they have failed to extend this variable to service-oriented manufacturing hybrid supply chains—especially those with three core participants (manufacturer, service provider, integrator). In such complex structures, service sensitivity does not merely shape end demand: it also triggers feedback mechanisms that influence each party’s decisions. Consequently, it is imperative to introduce service sensitivity as a dynamic variable in service-oriented manufacturing hybrid supply chain models.
2.3. Literature Comments
Through a systematic review, this paper identifies several areas for further exploration: First, it develops a service-oriented manufacturing hybrid supply chain model composed of a manufacturer, a service provider, and an integrator. Although a few existing studies have touched on such a structure, none have considered the scenario in which the service provider acts as the dominant party in the hybrid supply chain. This perspective is increasingly relevant as services exert greater influence on consumer decision-making. Second, service sensitivity, as a key variable influencing consumer decision-making behavior, has seldom been addressed in existing service-oriented manufacturing hybrid supply chains models. Finally, Existing studies consider power structures and service sensitivity largely in isolation or within two-party settings. In particular, an in-depth account is missing of how service sensitivity jointly with supply-chain leadership shapes outcomes in a three-party hybrid chain.
Accordingly, in summary, despite growing attention to service-oriented manufacturing, the dynamic interaction between service sensitivity and power structure has not been examined in depth within three-party hybrid supply chains (manufacturer–service provider–integrator). Existing work either analyzes these levers in isolation or within two-party settings, and it does not consider service-provider leadership or how shifts in service sensitivity reshape service levels, prices, and profit allocation across leadership regimes. To fill this gap, we develop a Stackelberg game model under different power structures within service-oriented manufacturing hybrid supply chains, to uncover the pricing logic and profit allocation mechanisms among manufacturers, service-providers, and integrators. Through this research, we seek to provide both theoretical foundations and empirical support for pricing decisions in hybrid supply chains under the “product + service” integration transformation. Ultimately, the goal is to help enterprises formulate more scientific and rational pricing and service level strategies in complex power structures.
To improve clarity and consistency in notation, Table 1 provides a glossary of the key variables and parameters used throughout this paper.

Table 1.
Glossary of Key Variables and Parameters.
3. Problem Description and Assumption
3.1. Problem Description
This paper explores the service-oriented manufacturing hybrid supply chain system (the hybrid supply chain) composed of a manufacturer, service provider, and integrator. In this system, the manufacturer is responsible for the production of products; the service provider offers services directly related to the products, ensuring that the corresponding service accompanies each product; the integrator combines the products and services to form a product-service system, which is then sold to the end consumers. The basic model structure of the service-oriented manufacturing hybrid supply chain, including the multi-flow interactions (logistic, financial, information) and the bidirectional transmission of service sensitivity between customers and supply chain members (manufacturer, service provider, integrator), is shown in Figure 1.
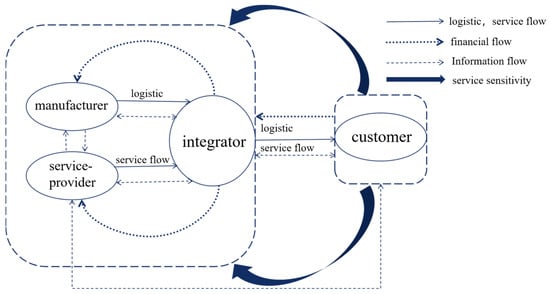
Figure 1.
Multi-flow Interaction and Service Sensitivity Transmission Mechanism in Service-Oriented Manufacturing Hybrid Supply Chains. Note: Solid arrows represent logistic and service flows; dashed arrows represent financial flows; dotted arrows represent information flows; bold dark blue arrows represent the bidirectional transmission path of service sensitivity—illustrating both how customers’ sensitivity to service levels reversely drives supply chain service decisions (from customers to service providers, integrators, and manufacturers) and how supply chain service adjustments positively influence customer demand.
At the same time, the core value of a service-oriented hybrid supply chain is determined by two key components: “product production” and “value-added services.” Manufacturers (with core production resources) and service providers (endowed with exclusive service capabilities) are the central players in the power game. The former represents the classic dominant structure of traditional product supply chains, where manufacturers grasp pricing and decision-making authority by virtue of their core production resources; the latter emerges as a core new model amid the sterilization transformation, where the value-added services offered by service providers have become a critical variable influencing market demand, significantly elevating their discourse power in the supply chain. The comparison between these two structures directly addresses the core research question of “the impact of the rise of service elements on supply chain power distribution,” enabling precise revelation of the intrinsic relationships between power structures, pricing strategies, service levels, and supply chain performance. Therefore, this study focuses on two power structures—manufacturer-dominant and service-provider-dominant—by constructing corresponding theoretical models to conduct in-depth research, exploring the impact of service sensitivity on pricing strategies and profit distribution in hybrid supply chains under different power structures.
3.2. Assumptions
Assumption 1.
A two-tier hybrid supply chain is established, consisting of a manufacturer, service provider, and integrator. The study discusses the impact of different power structures on pricing strategies and profit distribution in the hybrid supply chain.
Assumption 2.
For the sake of analytical tractability and to capture the impact of different power structures, we assume a sequential hierarchy among the followers.
When the manufacturer leads (Model-M), the service provider acts as the first follower (making decisions based on the manufacturer’s action), while the integrator acts as the second follower (deciding after observing both the manufacturer and the service provider).
When the service provider leads (Model-S), the manufacturer becomes the first follower, and the integrator remains the second follower. This strictly sequential structure reflects the distinct decision-making order in the supply chain. (To clearly visualize these decision hierarchies and the specific order of moves, the sequence of events for both power structures is illustrated in Figure 2).
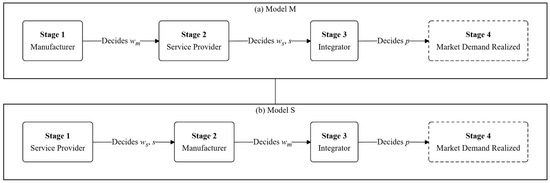
Figure 2.
Sequence of events in the Stackelberg game under different power structures. Note: (a) illustrates the sequential decision process in the Manufacturer-Dominant structure (Model M): the manufacturer moves first, followed by the service provider, and finally the integrator. (b) shows the Service-Provider-Dominant structure (Model S): the service provider moves first, followed by the manufacturer, with the integrator acting as the final follower in both cases.
Assumption 3.
The cost to the integrator is limited to the cost of purchasing the products and services; there is no cost to pay for packaging the products and services. (This setting aims to simplify the initial derivation of the model, focus on the core research framework of “power structure—service sensitivity—equilibrium decision-making”, and avoid secondary cost factors interfering with the analysis of core mechanisms).
Assumption 4.
The core factors influencing consumers’ purchasing decisions include product pricing, the level of value-added services, and consumers’ sensitivity to service quality. Referring on the classic modeling approaches of Hong et al. [23] and Cao et al. [7] in the field of supply chain games, and considering the market demand characteristics of service-oriented products, the product demand (D) is defined as a linear function, specifically expressed as: , ( denotes the base market demand; is the price sensitivity coefficient, capturing the negative impact of higher retail prices on market demand; represents the service sensitivity coefficient, measuring the positive effect of improved service levels on demand.)
Assumption 5.
Assume that is the service provider’s service cost function.
4. Model Formulation and Equilibrium Analysis
This paper considers two hybrid supply chain models under different power structures: one with the manufacturer as the dominant player and the other with the service provider as the dominant player. For convenience of expression, the superscript represents the optimal result, while the subscripts denote the manufacturer, service provider, and integrator, respectively. Different modes are represented by the superscripts .
4.1. Model M-Manufacturer Dominant Power Structure
In this model, the manufacturer acts as the leader, while the service provider and integrator are the followers. The decision-making sequence in this mode is as follows: The manufacturers first determine their product wholesale price , service providers set the service wholesale price and service level based on the manufacturer’s decisions, and finally, integrators set their retail price .
In this model, the profits of the manufacturer, service provider, and integrator are as follows:
By using backward induction, we obtain (The detailed proof and derivation process are provided in Appendix A):
4.2. Model S-Service Provider Dominant Power Structure
In this model, the service provider acts as the leader, while the manufacturer and integrator are the followers. The entire game sequence is changed, and the decision-making order in this mode is as follows: The service provider determines the service wholesale price and service level , manufacturers set the product wholesale price based on the service providers’ decisions, and finally, integrators set their retail price .
In this model, the profits of the manufacturer, service provider, and integrator are as follows:
By using backward induction, we obtain (the detailed proof and derivation process are provided in Appendix B):
4.3. Comparison of Equilibrium Solutions
First, each equilibrium solution is summarized in a table for comparative analysis, which is shown below (Table 2):
Table 2.
The equilibrium solutions and profits for the models.
4.4. Comparison and Analysis of Models
In this context, we compare and analyse the relationship between the magnitude of each equilibrium solution of a hybrid supply chain under two power structures and explore the effect of service sensitivity on each equilibrium solution. To ensure that the model developed makes sense, each case is satisfied: , .
Theorem 1.
- (1)
- ; ;
- (2)
- ;
Proof of Theorem 1.
, As previously shown, each case satisfies the required conditions , , Therefore, , , , From this , is proved. The rest of the derivation is similar and omitted. From this, Theorem 1 (1) is proved. , As previously shown, each case satisfies the required conditions , , , , from this is proved, the rest of the derivation is similar and omitted. From this, Theorem 1 (2) is proved. □
Theorem 1 indicates that, under the manufacturer-dominant model, the product wholesale price is higher than in the service-provider-dominant model. In contrast, under the service-provider-dominant structure, both the product retail price and the service wholesale price are higher. Furthermore, in both models, the product retail price and the service wholesale price are positively correlated with the service sensitivity coefficient. From a managerial perspective, this result reflects the difference in bargaining power and value appropriation between channel members. When the service provider acts as the leader, it possesses stronger bargaining power in determining the service wholesale price and can appropriate a larger portion of the overall value created by enhanced services. Because consumers’ perceived value is increasingly driven by service quality, the service provider can strategically set a higher service wholesale price to capture part of this value, thereby signaling its central role in the supply chain. This higher wholesale price represents the provider’s ability to internalize more of the service-related surplus. However, excessive dependence on service providers may distort the pricing balance and weaken overall supply chain coordination, reducing efficiency if not properly managed.
Theorem 2.
; .
Proof of Theorem 2.
, . As previously shown, each case satisfies the required conditions:, , , ; From this, Theorem 2 is proved. □
Theorem 2 indicates that, under the service-provider dominant model, both market demand and service levels are higher than in the Manufacturer dominant model. This suggests that service-provider dominant pricing helps achieve higher market demand and service levels in a service-oriented manufacturing hybrid supply chain. This is mainly attributed to the fact that the service provider is responsible for providing product-related services under service-provider-dominant pricing. In the context of service-oriented manufacturing, service providers focus more on enhancing the overall consumer perception by optimizing the service experience, thereby increasing the product’s added value and meeting consumers’ preferences for high-quality services. This, in turn, promotes the growth of market demand. At the same time, the product and service are deeply integrated, so that consumers not only receive the physical product but also enjoy high-level supporting services when purchasing. This integrated supply approach enhances consumers’ willingness to purchase, thereby improving the hybrid supply chain’s service level and market competitiveness.
Theorem 3.
, , .
Proof of Theorem 3.
, , , Due to ; , ; From this, Theorem 3 is proved. □
Theorem 3 indicates that, under different power structures, there are significant differences in the profit distribution among the manufacturer, service provider, and integrator. In the manufacturer-dominant model, the manufacturer gains higher profits by controlling production and product pricing, thereby capturing a greater share of value through product sales. In contrast, under the service-provider-dominant model, the service provider earns more because it leads the design and pricing of value-added services, which enhances the perceived value of the product–service system and stimulates market demand. From a mechanism perspective, these differences arise not only from the transfer of pricing power but also from synergistic value creation within the service-led structure. When the service provider becomes the channel leader, it coordinates the integration of manufacturing, service delivery, and system bundling more effectively, improving alignment between service quality and customer needs. This value co-creation effect increases consumers’ willingness to pay, expands total market demand, and raises the overall profitability of the hybrid supply chain. As a result, while the service provider captures a larger profit share, the manufacturer and integrator also benefit from higher demand and better coordination efficiency. Thus, the service-provider-dominant model enhances collective value generation and long-term competitiveness across the supply chain, rather than merely redistributing existing profits.
Theorem 4.
; .
Proof of Theorem 4.
, , , , due to ; ; ; Therefore , , From this, Theorem 4 is proved. □
Theorem 4 indicates that, regardless of whether it is the Manufacturer dominant model or the service-provider dominant model, as service sensitivity increases, both the overall service level and product demand in the hybrid supply chain show a positive growth trend. This result indicates that service sensitivity, as a key variable for measuring consumers’ emphasis on services, can continuously drive all parties to increase their service investments under different power structures, thereby promoting the expansion of market demand. This is because, as consumers place more importance on service quality (i.e, as service sensitivity increases), the marginal utility derived from the service also rises. Regardless of which party holds the pricing power in the hybrid supply chain, companies must enhance service levels to better align with market preferences, increase the attractiveness of the product-service system, and ultimately drive demand growth.
Theorem 5.
- (1)
- , .
- (2)
- , .
Proof of Theorem 5.
, , , , . Due to , , . The polynomial attains its minimum value at , and the minimum value is , Therefore, the polynomial is always positive. Therefore, the above inequality holds, and the rest of the proof process is similar and is omitted here. From this, Theorem 5 is proved. □
Theorem 5 indicates that, under different power structures, the individual profits of the participants in the hybrid supply chain and the total profit of the entire hybrid supply chain increase as consumer service sensitivity rises. As a key parameter for measuring consumers’ emphasis on service quality, service sensitivity directly affects the value weight of services within the product-service system. As sensitivity increases, consumers’ willingness to pay for high-level services grows, enhancing the product-service combination’s market value and pricing power. Driven by this, all participants in the hybrid supply chain generally have a stronger incentive to invest more in services to achieve higher profit returns. Whether in the manufacturer-dominant model or the service-provider dominant model, the positive impact of service sensitivity on the improvement of hybrid supply chain profits has been validated, demonstrating strong structural stability. Further comparison shows that, under the service-provider dominant model, the overall profit of the hybrid supply chain is always higher than the manufacturer’s dominant model’s corresponding level. This indicates that, in a service-oriented manufacturing hybrid supply chain, the service-provider dominant model has stronger service coordination capabilities and pricing coordination advantages when enhancing service value, compared to the Manufacturer dominant model.
5. Numerical Simulation and Analysis
5.1. Effects of Service Sensitivity
This section will use numerical experiments to verify the relevant propositions and analyse the impact of service sensitivity on optimal pricing decisions, service levels, and the optimal profits of manufacturers, service providers, and integrators in a service-oriented manufacturing hybrid supply chain. The numerical analysis will be conducted to verify and explore the findings. Based on previous literature [15], and without loss of generality, we assume the parameter values as follows: , These values will be used for a more intuitive numerical simulation analysis.
Under the two different power structures-Manufacturer dominant and service-provider dominant, the retail price, service wholesale price, product wholesale price, as well as market demand, service level, and the optimal profits of each party are influenced by the service sensitivity coefficient , as shown in Figure 2, Figure 3 and Figure 4.
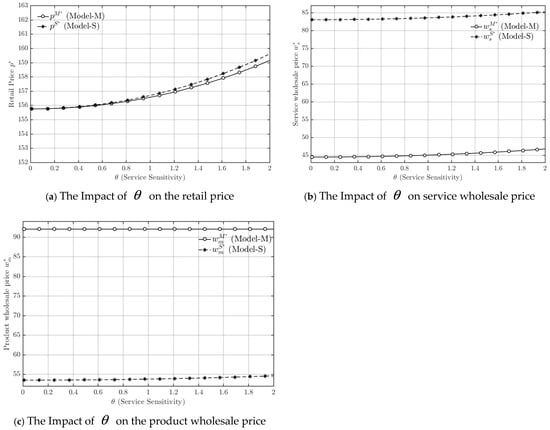
Figure 3.
Trends in retail price, service wholesale price, and product wholesale price.
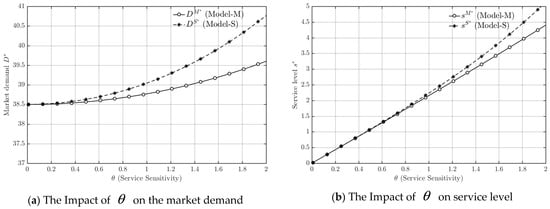
Figure 4.
Trends in market demand and service level.
As shown in Figure 3a, the retail price in both models increases with rising service sensitivity, and the retail price in the service-provider-dominant model remains slightly higher than that in the manufacturer-dominant model throughout. This observation is consistent with Theorem 1 (1), which indicates that stronger service sensitivity enhances consumers’ willingness to pay for improved services, thereby allowing the service-provider-led channel to maintain a higher retail price. As shown in Figure 3b, with the continuous increase in service sensitivity, a clear difference appears in the service wholesale price between the two power structures. Under the service-provider-dominant model, the service wholesale price stays at a higher and more stable level, while in the manufacturer-dominant model it is lower and increases only slightly as service sensitivity rises. This pattern verifies Theorem 1 (2), highlighting that the leader’s bargaining position largely determines service-related pricing decisions. As shown in Figure 3c, throughout the entire range of service sensitivity changes, the product wholesale price in the manufacturer-dominant model is consistently higher than in the service-provider dominant model, with both prices remaining relatively stable. This is consistent with Theorem 1 (2).
Taken together, the results in Figure 3 demonstrate that service sensitivity exerts a positive influence on the final retail price, while its impact on the wholesale prices of products and services is mainly shaped by the underlying power structure. In the service-provider-dominant model, the higher and more stable service wholesale price reflects the provider’s ability to appropriate more value through stronger bargaining power and closer alignment with consumer demand. By contrast, in the manufacturer-dominant model, the manufacturer emphasizes product value and production margins, resulting in a higher product wholesale price but lower service pricing. Overall, these findings empirically confirm Theorem 1, showing that service sensitivity primarily affects the market through the retail-price channel, whereas the distribution of pricing power across members determines the internal price structure within the hybrid supply chain.
As shown in Figure 4a, market demand under both the manufacturer-dominant and service-provider-dominant models increases steadily with rising service sensitivity. Across the entire sensitivity range, however, demand in the service-provider-dominant model remains consistently higher, and its growth rate is more pronounced. Figure 4b illustrates that service levels in both models rise approximately linearly with service sensitivity. When sensitivity is low, the two models yield similar service levels, but as service sensitivity strengthens, the service-provider-dominant model shows a noticeably faster increase. These observations are consistent with Theorems 2 and 4, which predict that higher service sensitivity enhances both market demand and service levels, especially when the service provider leads the channel.
Based on Figure 4, these results highlight that service sensitivity acts as a critical driver of both demand expansion and service improvement, but its impact depends strongly on the underlying power structure. Under service-provider dominance, the leader’s stronger coordination capability enables service investment to be more closely aligned with consumer preferences, amplifying the marginal effect of service sensitivity on market demand. This synergy between service quality and demand responsiveness allows the hybrid supply chain to translate higher consumer expectations into real market growth. Consequently, compared with the manufacturer-dominant model, the service-provider-dominant structure achieves greater profitability, responsiveness, and adaptability in high-sensitivity environments, confirming the theoretical propositions and emphasizing the strategic value of service leadership in hybrid supply chains.
As shown in Figure 5a, as service sensitivity increases, the manufacturer’s profit remains relatively stable under both power structures, with only minor fluctuations. The profit level is consistently higher in the manufacturer-dominant model than in the service-provider-dominant model. Figure 5b shows that the service provider’s profit under the service-provider-dominant model is higher and remains stable, indicating that changes in service sensitivity have little direct impact on its profitability. These findings are consistent with Theorem 3, which explains that the dominant party captures a greater share of profits through pricing control and bargaining advantages. In Figure 5c, the integrator’s profit in both models increases continuously with rising service sensitivity, and the profit level in the service-provider-dominant model is markedly higher with a faster growth rate. Figure 5d further reveals that the total profit of the hybrid supply chain increases steadily under both models, and that the overall profit and growth rate are both higher under the service-provider-dominant structure. This result verifies Theorem 5, which posits that service-led coordination enhances overall system profitability.
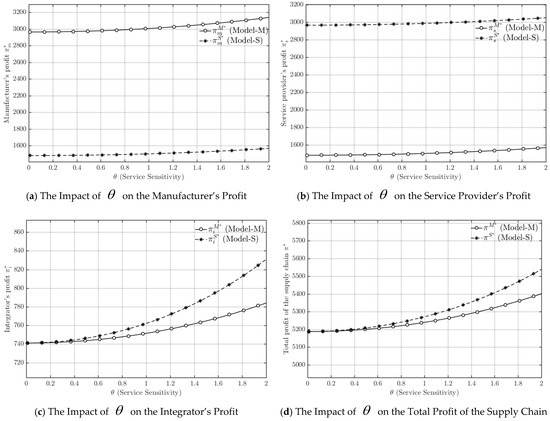
Figure 5.
Trends in Manufacturers’ Profit, Service Providers’ Profit, Integrators’ Profit, and Total Supply Chain Profit.
Based on Figure 5, it illustrates that higher service sensitivity exerts a positive effect on the profits of all participants, but the distribution pattern depends on the power structure. The relatively stable profits of the manufacturer and service provider suggest that individual firms’ returns are shaped more by their pricing power and bargaining position than by consumers’ changing service preferences. In the manufacturer-dominant model, the manufacturer secures the largest profit share through control of production and pricing, while the service provider and integrator obtain relatively limited gains, constraining total system benefits. Conversely, under the service-provider-dominant model, the leader’s coordination of service and product strategies creates synergistic value, improving integrator performance and overall supply-chain profitability. Hence, stronger service sensitivity not only enhances market demand but also magnifies the advantages of a service-dominant governance structure in achieving collaborative value creation across the hybrid supply chain.
In contrast, under the service-provider-dominant model, although the manufacturer’s profit declines, the profits of the service provider and integrator increase significantly, leading to a higher total profit for the entire hybrid supply chain. This outcome suggests that, in a service-oriented manufacturing context, the service-provider-dominant structure more effectively unlocks the potential of service value, enhances resource allocation efficiency, and fosters synergistic value creation among supply-chain participants. This advantage becomes particularly evident when consumers are highly sensitive to service quality. Therefore, from the perspective of overall system performance and sustainable competitiveness, service-provider-dominant pricing exhibits greater strategic value in environments characterized by strong service sensitivity.
5.2. Robustness Analysis
To further verify the robustness and generalizability of the main conclusions, a sensitivity analysis was conducted on two additional key parameters: the price sensitivity coefficient and Service effort cost coefficient . Figure 6 and Figure 7 illustrate the effects of variations in and on market demand, service level, and the total profit of the hybrid supply chain under both the manufacturer-dominant and service-provider-dominant models.
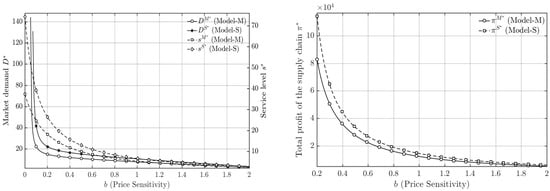
Figure 6.
The Impact of on the market demand, service level, and Total Supply Chain Profit.
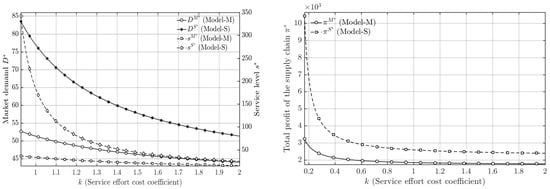
Figure 7.
The Impact of on the market demand, service level, and Total Supply Chain Profit.
The results reveal that, as expected, increases in (price sensitivity) or (service cost coefficient) lead to a decline in market demand, service level, and overall profit in both power structures. This is because higher implies that consumers become more sensitive to price changes, suppressing demand, while higher raises the marginal cost of service investment, discouraging firms from maintaining high service levels. However, despite these downward shifts in absolute values, the relative performance differences between the two dominance structures remain unchanged. Specifically, under the service-provider-dominant model, market demand, service level, and total profit consistently remain higher than those under the manufacturer-dominant model across all tested ranges of and .
This consistent pattern indicates that the study’s core managerial insights—namely, that service-provider dominance promotes better coordination efficiency, stronger market response, and higher overall profitability—are robust to changes in other key parameters. Therefore, the superiority of the service-provider-dominant model is not limited to specific parameter conditions but reflects a structurally stable outcome of the service-oriented manufacturing supply chain.
6. Conclusion and Discussion
6.1. Main Conclusions
This paper focuses on the service-oriented manufacturing hybrid supply chain composed of manufacturers, service providers, and integrators. It constructs Stackelberg game models for the manufacturer-dominant and service-provider dominant models, addressing pricing and service decision-making under different power structures. The optimal decision strategies for each participant under different game sequences are clarified. Through equilibrium solution derivation, theoretical proposition proofs, and numerical simulation comparisons, the following main research conclusions are obtained:
(1) Service sensitivity positively influences pricing in both power structures. In service-provider-dominant systems, higher service sensitivity allows firms to adopt premium pricing strategies by leveraging improved service quality and customer value perception. In contrast, under manufacturer dominance, pricing outcomes depend more on how pricing power is distributed across participants. Managers should therefore align pricing authority with value contribution to achieve balanced and efficient pricing decisions.
(2) Service sensitivity consistently enhances market demand and service levels, but the effect is stronger under service-provider dominance. Managers in service-intensive industries should actively monitor changes in customer service expectations and adjust service investment accordingly. Service providers should strengthen responsiveness and customization, while manufacturers should coordinate with service partners to maintain competitiveness.
(3) Service sensitivity affects profit allocation across the supply chain. In manufacturer-dominant structures, excessive control may restrict service providers’ incentives and reduce total efficiency. Managers should consider profit-sharing or service-performance-based mechanisms to sustain long-term cooperation. Service-provider-dominant structures encourage more balanced profit growth and collaborative value creation, highlighting the strategic benefits of service-led governance.
(4) Different power structures yield varying responsiveness to service sensitivity. In high-sensitivity markets, adopting a service-provider-dominant model enables better conversion of customer preferences into market value, improving adaptability and competitiveness. Managers should consider evolving toward service-value-driven governance, especially in industries such as automotive aftermarket, smart electronics, and healthcare, where service capabilities are central to differentiation and sustainable growth.
In summary, this study extends the theoretical framework for analyzing game mechanisms and service sensitivity in service-oriented manufacturing hybrid supply chains, addressing a key gap in the existing literature concerning the interaction between power structures and service sensitivity. From a theoretical standpoint, it constructs Stackelberg game models to examine how different dominance structures—manufacturer-dominant and service-provider-dominant—affect pricing decisions, service levels, and overall supply chain performance. From a practical perspective, this research provides theoretical guidance and decision-making references for enterprises in designing hybrid supply chain power structures, pricing strategies, and profit allocation mechanisms, particularly in the context of digital transformation and the servitization of manufacturing. The findings reveal that power structure plays a decisive role in shaping the performance of service-oriented hybrid supply chains. Specifically, under the service-provider-dominant model, the system demonstrates a stronger capacity to adapt to changes in service sensitivity, resulting in higher market demand, elevated service levels, and greater overall profitability.
Furthermore, the managerial implications of this research extend to real-world service-oriented hybrid supply chains, such as the automotive aftermarket, smart electronics, and healthcare sectors. In these industries, enterprises that adopt a service-provider-dominant structure—where service capabilities drive value creation—can better integrate products and services, enhance market adaptability, and foster long-term competitiveness. This structure enables firms to optimize pricing mechanisms, balance the interests of all participants, and improve the efficiency and responsiveness of the entire supply chain network.
6.2. Research Limitations and Future Research Directions
The present study, while offering valuable insights, acknowledges several inherent limitations in its research perspective.
First, the model does not account for asymmetry among followers (manufacturers, service providers, or integrators) or mixed-leadership scenarios, instead assuming equal status among them. This simplification may restrict the model’s ability to capture the complex dynamics of bargaining power in real-world supply chains.
Second, this study abstracts from external factors such as market competition, platform dynamics, and regulatory constraints, which may influence equilibrium outcomes in real-world supply chains. In competitive markets, intensified price pressure could weaken the leader’s advantage, while digital platforms may redistribute decision-making power through new governance mechanisms.
Third, the analysis primarily relies on mathematical modeling and numerical simulations without empirical or case-based validation, which, although methodologically rigorous, may constrain the practical depth of the findings.
Finally, the model centers on a single service-level variable, without distinguishing between different service dimensions (e.g., speed, customization, and reliability), thereby limiting its ability to capture richer consumer preferences. Future research should consider multi-dimensional service attributes to better reflect real-world conditions.
To enhance the practical applicability of this research, future studies should focus on the dynamic differences in bargaining power among supply chain participants. Specifically, introducing bargaining power coefficients or hybrid leadership structures could facilitate the development of asymmetric game models. Moreover, to improve the realism and policy relevance of hybrid supply chain analysis, future research should incorporate external factors such as market competition, platform dynamics, and regulatory constraints, thereby providing a more comprehensive understanding of how these forces influence equilibrium outcomes within the supply chain.
Ultimately, to amplify the breadth and profundity of the research, future work should aim to substantiate the theoretical model through rigorous empirical validation. This can be achieved by leveraging empirical data or conducting case studies. Additionally, employing a hybrid of quantitative and qualitative research methods to examine the model and its constituent factors will provide a robust assessment of their impact and interplay.
Author Contributions
Conceptualization, B.Y. and X.Y.; methodology, B.Y.; software, B.Y.; validation, B.Y. and X.Y.; formal analysis, B.Y.; investigation, B.Y.; resources, B.Y.; data curation, B.Y.; writing—original draft preparation, B.Y.; writing—review and editing, X.Y.; visualization, B.Y.; supervision, X.Y.; project administration, X.Y.; funding acquisition, X.Y. All authors have read and agreed to the published version of the manuscript.
Funding
This work was supported by the Natural Science Foundation of Guangxi Province (No.2021GXNSFAA075019); Philosophy and Social Science Foundation of Guangxi (No.25KSF232); The “14th Five Year Plan” of Guangxi Education and Science Major project in 2025 (No.2025JD20); Higher Education Undergraduate Teaching Reform Project of Guangxi (No.2024JGA258); The “14th Five Year Plan” of Guangxi Education and Science Annual project in 2023 (No.2023A028). This study acknowledge the support of Guangxi Academy of Artificial Intelligence; the National First-class Undergraduate Major—The Major of Logistics Management; Demonstrative Modern Industrial School of Guangxi University—Smart Logistics Industry School Construction Project; Guangxi Colleges and Universities Key laboratory of Intelligent Logistics Technology; Engineering Research Center of Guangxi Universities and Colleges for Intelligent Logistics Technology; Demonstrative Modern Industrial School of Guangxi University—Smart Logistics Industry School Construction Project, Nanning Normal University.
Data Availability Statement
The original contributions presented in this study are included in the article. Further inquiries can be directed to the corresponding author.
Conflicts of Interest
The authors declare no conflicts of interest.
Appendix A. Model M
Proof.
- Step1: Compute the first-order partial derivative of with respect to and set it to zero.
- .
- Step2: Substitute the above into , then compute the first-order derivatives with respect to and respectively and set them to zero.
- , By solving the above two equations simultaneously, we obtain: , Substitute this result into . We obtain: .
- Step3: Substitute equations and into , then compute the first-order derivative with respect to and set it to zero. We obtain: , Then, compute the first-order derivative with respect to and set it to zero: . Substitute into equations respectively to obtain the optimal equilibrium solutions. □
Appendix B. Model S
Proof.
- Step1: Compute the first-order derivative of with respect to and set it to zero. .
- Step2: Substitute the above into , then compute the first-order derivative with respect to and set it to zero, , Substitute into , we get: .
- Step3: Substitute equation into , then compute the first-order derivatives with respect to and respectively and set them to zero. And by solving the above two equations simultaneously, we obtain: , . Substitute into equations respectively to obtain the optimal equilibrium solutions. □
References
- Lin, J.; Miao, R.; Jiang, Z.; Wang, L. Service-Oriented Manufacturing: The Development Trend of Chinese Manufacturing Industry. In Advanced Manufacturing Systems; PTS 1–3. 2nd International Conference on Manufacturing Science and Engineering; Trans Tech Publications Ltd.: Stafa-Zurich, Switzerland, 2011; pp. 388–392. [Google Scholar]
- Gao, N.; Zhao, S.; Zhang, X. Research on the Service-Oriented Manufacturing Model. In Proceedings of the IEEE International Conference on Industrial Engineering and Engineering Management, Hong Kong, China, 8–11 December 2009; IEEE: New York, NY, USA, 2009; Volume 1–4, pp. 2431–2434. [Google Scholar]
- Kretschmer, T.; Leiponen, A.; Schilling, M.; Vasudeva, G. Platform ecosystems as meta-organisations: Implications for platform strategies. Strateg. Manag. J. 2022, 43, 405–424. [Google Scholar] [CrossRef]
- Chen, X.; Wang, X.; Jiang, X. The impact of power structure on the retail service supply chain with an O2O mixed channel. J. Oper. Res. Soc. 2016, 67, 294–301. [Google Scholar] [CrossRef]
- Zhai, Y.; Bu, C.; Zhou, P. Effects of channel power structures on pricing and service provision decisions in a supply chain: A perspective of demand disruptions. Comput. Ind. Eng. 2022, 173, 108715. [Google Scholar] [CrossRef]
- Yang, Z.; Zheng, Y.; Li, J.; Zhu, S.X.; Yang, C. Delivery service for a service-oriented manufacturing supply chain with procurement and delivery time decisions. Int. J. Prod. Res. 2024, 62, 7581–7597. [Google Scholar] [CrossRef]
- Cao, B.; Zhang, Q.; Cao, M. Optimizing Hybrid-Channel Supply Chains with Promotional Effort and Differential Product Quality: A Game-Theoretic Analysis. Mathematics 2022, 10, 1798. [Google Scholar] [CrossRef]
- Wan, N.; Fan, J. Pricing and platform coupon decisions of a hybrid channel supply chain under different power structures. Rairo-Oper. Res. 2025, 59, 427–460. [Google Scholar] [CrossRef]
- Wan, N.; Fan, J. Platform service decision and selling mode selection under different power structures. Ind. Manag. Data Syst. 2024, 124, 1991–2020. [Google Scholar] [CrossRef]
- Bian, J.; Lai, K.K.; Hua, Z. Service outsourcing under different supply chain power structures. Ann. Oper. Res. 2017, 248, 123–142. [Google Scholar] [CrossRef]
- Ma, J.; Yi, T.; Liu, C. Studying the Complexity of Multichannel Supply Chain with Different Power Structures Under Carbon Subsidy Policy. Int. J. Bifurc. Chaos 2021, 31, 2150166. [Google Scholar] [CrossRef]
- Choi, T.-M.; Wallace, S.W.; Wang, Y. Risk management and coordination in service supply chains: Information, logistics and outsourcing. J. Oper. Res. Soc. 2016, 67, 159–164. [Google Scholar] [CrossRef]
- Wang, K.Z.; Jiang, Z.B.; Lin, W.J.; Xie, W.M. Study on the Hybrid Supply Chain Management of Service-oriented Manufacturing. Soft Sci. 2013, 27, 93–95, 100. [Google Scholar]
- Xu, Y.; Wang, L.; Wang, W.; Chen, H.; Meng, X. The promotion of digital transformation for supply chain diversification in service-oriented manufacturing paradigm. Int. J. Logist. Res. Appl. 2024, 27, 2261–2284. [Google Scholar] [CrossRef]
- Zuo, F.J.; Zhang, Z.F.; Fan, B.B. Research on coordination of service-oriented manufacturing hybrid supply chain. Mod. Manuf. Eng. 2019, 460, 43–49. [Google Scholar]
- Zhang, Y.; Gao, Z.; Huang, M.; Jiang, S.; Yin, M.; Fang, S.-C. Multi-period distribution network design with boundedly rational customers for the service-oriented manufacturing supply chain: A 4PL perspective. Int. J. Prod. Res. 2024, 62, 7412–7431. [Google Scholar] [CrossRef]
- Zhang, J. What is the role of product services in the dual-channel closed-loop supply chain? Rairo-Oper. Res. 2024, 58, 3637–3658. [Google Scholar] [CrossRef]
- Chung, H.; Ahn, D.-Y.; Yoo, W.S. Equilibrium supply chain structures in the presence of asymmetric manufacturer capabilities in service efficacy and provision. J. Oper. Res. Soc. 2022, 73, 394–416. [Google Scholar] [CrossRef]
- Chen, Y.; Wu, M. Pricing Decisions in Dual-Channel Supply Chains Considering the Offline Channel Preference and Service Level. Mathematics 2024, 12, 2468. [Google Scholar] [CrossRef]
- Wang, S.; Hu, Z. Logistics Service Supply Chain Decision-Making Analysis Considering Impact of Environment and Service Level. Pol. J. Environ. Stud. 2022, 31, 5285–5297. [Google Scholar] [CrossRef]
- Roy, B.; Das, S. Multi-channel price and service level competition with the impact of coordination contracts. IMA J. Manag. Math. 2025, 36, 451–474. [Google Scholar] [CrossRef]
- Yang, H.; Zhao, S.; Peng, J. Optimal Retail Price and Service Level in a Dual-Channel Supply Chain with Reference Price Effect. J. Ind. Manag. Optim. 2023, 19, 3883–3912. [Google Scholar] [CrossRef]
- Hong, Z.; Guo, X. Green product supply chain contracts considering environmental responsibilities. Omega 2019, 83, 155–166. [Google Scholar] [CrossRef]


Disclaimer/Publisher’s Note: The statements, opinions and data contained in all publications are solely those of the individual author(s) and contributor(s) and not of MDPI and/or the editor(s). MDPI and/or the editor(s) disclaim responsibility for any injury to people or property resulting from any ideas, methods, instructions or products referred to in the content. |
© 2025 by the authors. Licensee MDPI, Basel, Switzerland. This article is an open access article distributed under the terms and conditions of the Creative Commons Attribution (CC BY) license (https://creativecommons.org/licenses/by/4.0/).