You are currently viewing a new version of our website. To view the old version click .
Mathematics
  • Article
  • Open Access

1 November 2025

Evaluating the Reliability and Security of an Uplink NOMA Relay System Under Hardware Impairments

,
,
,
,
,
and
1
Wireless Communications Research Group, Faculty of Electrical and Electronics Engineering, Ton Duc Thang University, Ho Chi Minh City 700000, Vietnam
2
Campus in Ho Chi Minh City, University of Transport and Communications, Ho Chi Minh City 700000, Vietnam
3
Department of Information Systems, Faculty of Information Technology, Posts and Telecommunications Institute of Technology, Ho Chi Minh City 700000, Vietnam
4
Faculty of Information Technology, Ton Duc Thang University, Ho Chi Minh City 700000, Vietnam

Abstract

With the rapid growth of wireless devices, security has become a key research concern in beyond-5G (B5G) and sixth-generation (6G) networks. Non-orthogonal multiple access (NOMA), one of the supporting technologies, is a strong contender to enable massive connectivity, increase spectrum efficiency, and guarantee high-quality access for a sizable user base. Furthermore, the scientific community has recently paid close attention to the effects of hardware impairments (HIs). The safe transmission of NOMA in a two-user uplink relay network is examined in this paper, taking into account both hardware limitations and the existence of listening devices. Each time frame in a mobile network environment comprises two phases in which users use a relay (R) to interact with the base station ( B S ). The research focuses on scenarios where a malicious device attempts to intercept the uplink signals transmitted by users through the R. Using important performance and security metrics, such as connection outage probability (COP), secrecy outage probability (SOP), and intercept probability (IP), system behavior is evaluated. To assess the system’s security and reliability under the proposed framework, closed-form analytical expressions are derived for SOP, IP, and COP. The simulation results provide the following insights: (i) they validate the accuracy of the derived analytical expressions; (ii) the study significantly deepens the understanding of secure NOMA uplink transmission under the influence of HIs across all the network entities, paving the way for future practical implementations; and (iii) the results highlight the superior performance of secure and reliable NOMA uplink systems compared to benchmark orthogonal multiple access (OMA) counterparts when both operate under the same HI conditions. Furthermore, an extended model without a relay is considered for comparison with the proposed relay-assisted scheme. Moreover, the numerical results indicate that the proposed communication model achieves over 90% reliability (with a COP below 0.1) and provides approximately a 30% improvement in SOP compared to conventional OMA-based systems under the same HI conditions.

1. Introduction

It is becoming increasingly important to guarantee both great spectral efficiency and safe data transfer as wireless communication systems advance to the sixth generation (6G). By allowing several users to use the same frequency resources through power-domain multiplexing, non-orthogonal multiple access (NOMA) has become a potential method to improve spectrum utilization and energy efficiency [,,,]. In both uplink and downlink circumstances, this method efficiently reduces user interference and increases spectral efficiency when paired with successive interference cancellation (SIC) at the receiver and superposition coding at the transmitter [,,,].
To increase the secrecy performance of NOMA systems under a variety of Quality-of-Service (QoS) restrictions, recent research has suggested solutions for resource allocation and signal design. However, these studies frequently assume that the hardware components are optimal, which is rarely the case in real-world deployments. In practice, residual hardware impairments (RHIs) are caused by unavoidable flaws in the transceiver hardware, including oscillators, amplifiers, and converters [,,,]. These limitations can seriously hinder system performance, especially in SIC decoding among NOMA users, by introducing distortion noise that is proportional to the signal power [,]. Moreover, physical layer security (PLS) in NOMA-based amplify and forward relay systems with RHIs was examined in a remarkable investigation [], which found that it hurt the outage and intercept probability (IP). However, the cumulative effect of RHIs on every device in an uplink NOMA relay network with an external eavesdropper (E) has not been examined in any previous work. In particular, there is still much to learn about the security performance of such a system, where users send private information to a base station ( B S ) through a relay (R).

1.1. Literature Review

The authors in [] examined an uplink wireless network using NOMA with a B S and three users sending signals to the B S . The bit error rate (BER) was used in the study to assess system performance. The study evaluated performance using BER but did not consider the presence of a potential E, the integration of an R node, and the effect of hardware impairments (HIs) on all the communication nodes. Moreover, just the BER measure was used for the performance evaluation. Likewise, an uplink NOMA system including two users and one B S was examined with the influence of HIs regarding all the devices by []. While this work extended the system model in [] by incorporating an R, it still did not account for the existence of an E. In order to assess system performance in a downlink secure communication system, the authors of [] used BER analysis. The uplink secrecy performance, HIs, and more general reliability and security metrics like the connection outage probability (COP), secrecy outage probability (SOP), and IP were not taken into account in this work. In [], the authors studied an uplink secure communication system with relay assistance and analyzed key secrecy metrics, including SOP and strictly positive secrecy capacity (SPSC). Nevertheless, this study also neglected the impact of HIs and did not explore other important performance indicators, such as COP and IP. To bridge these research gaps, this paper investigates the secrecy performance of an uplink NOMA relay network consisting of two users and one E, in which all the communication nodes are subject to HIs. Additionally, the system’s security and dependability are thoroughly investigated. Specifically, COP is analyzed to assess system reliability, and IP and SOP are calculated in closed-form formulae under actual conditions, such as high-signal-to-noise ratio (SNR) regimes. In Table 1, a comparison between this research and recent works is presented.
Table 1. Comparison of the present study with analogous research.

1.2. Motivation and Main Contributions

Despite its benefits, most of the earlier research on NOMA systems has largely ignored the security threats associated with wireless communications in favor of performance metrics such as throughput and energy use. Malicious E can intercept user data transmitted since wireless channels are broadcast, which could lead to serious confidentiality violations [,,]. Although encryption-based techniques have been widely used [,], their limits have been made clear by the increasing computer power of attackers. To improve privacy without using encryption keys, PLS approaches have been developed to take advantage of the random nature of wireless communications [,].
The main contributions are summarized as follows:
  • A secure uplink NOMA system is proposed, where user 1 ( D 1 ) and user 2 ( D 2 ) transmit signals to the B S via an R considering the presence of a potential E and the impact of HIs on all devices.
  • A comprehensive analysis of the system’s PLS and reliability is provided, with closed-form expressions derived for key performance metrics, including COP, SOP, and IP.
  • To validate the accuracy of the theoretical analysis, extensive Monte Carlo simulations are conducted under various system settings. These simulations not only confirm the analytical results but also provide valuable insights into the influence of key parameters on system performance, thereby highlighting the practicality of the design.
  • Moreover, the proposed approach is benchmarked against conventional orthogonal multiple access (OMA)-based schemes and the related model in []. The results clearly demonstrate superior reliability and security, emphasizing its effectiveness and potential applicability in realistic communication scenarios.

1.3. Structure

The following five sections comprise the organization of the paper: The suggested system paradigm is introduced in Section 2. In Section 3, the COP analysis is presented. Section 4 and Section 5 analyze the system’s security performance in terms of SOP and IP. Section 6 provides an in-depth exploration of the expanding research, featuring a model of a system that operates without the use of an R. Section 7 presents the generated analytical results. Lastly, Section 8 concludes the article.

2. System Model

The uplink system model of a cooperative NOMA network with an E is illustrated in Figure 1. Specifically, the system model consists of one B S , an R, two users ( D 1 and D 2 ), and an E. The signal transmitted from D i to B S occurs in two time slots. In the first time slot, D 2 sends its signal to R, while D 1 simultaneously transmits its signal to the B S , causing interference to R. At the same time, E eavesdrops on the signals from both D 1 and D 2 . During the second time slot, B S continues receiving the signal from D 1 and also receives the successfully decoded signal relayed by R. Meanwhile, E continues to intercept the signals from both D 1 and D 2 during this phase. The use of two time slots, phase 1 and phase 2, aims to enhance communication security and efficiency given the presence of E. The addition of an R improves both the security and signal quality. By dividing the transmission into two distinct stages, the system optimizes communication and security, ensuring that information is transmitted effectively and safely.
Figure 1. An uplink system model of a cooperative NOMA network with an E.

2.1. SIC Assumptions

In this work, the SIC assumptions are specified as follows. User D 1 continuously transmits its signal to the B S during both transmission phases, while user D 2 transmits to the R in the first phase and relies on the R’s forwarding in the second phase.
  • At the R, the message of D 1 is not decoded; instead, D 1 only acts as interference. The relay attempts to decode the signal of D 2 while treating the signal of D 1 as interference, as reflected in the corresponding SINR expression.
  • At the E, it is assumed that SIC is feasible. In this case, E first decodes the signal of D 2 and, after cancellation, attempts to decode the signal of D 1 . This corresponds to the SINR expressions for E in both transmission phases.
  • At the B S , decoding follows a different order due to the stronger link of D 1 . The B S first decodes the signal of D 1 and then performs SIC to decode the signal of D 2 .
For analytical tractability, an ideal SIC is assumed, meaning that, once a signal is successfully decoded, it can be perfectly removed from the composite signal. The practical degradation caused by non-ideal transceiver components is captured through the RHIs already modeled in the SINR expressions.

2.2. Signal Analysis in the First Time Slot

The representation of the signal from D 1 to B S is as follows [,]:
y D 1 B P 1 = g 1 S ω 1 P D 1 v 1 + ρ D 1 + ρ D 1 S + ζ S ,
where Rayleigh fading is used to illustrate the channel from D 1 to B S , represented by g 1 S C N 0 , κ g 1 S with variance κ g 1 S []. The power allocation coefficient for user D i , ( i = 1 , 2 ) , is denoted by ω i with ω 1 + ω 2 = 1 and ω 1 > ω 2 [,]. The symbol that represents user D 1 ’s signal is v 1 , and D 1 ’s transmission power is represented by P D 1 . ρ D 1 C N 0 , η D 1 2 P D 1 and ρ D 1 S C N 0 , η D 1 S 2 P D 1 g 1 S 2 are distortion noise, where η D 1 2 and η D 1 S 2 are the levels of RHI of D 1 and D 1 - B S link, respectively [,]. The additive white Gaussian noise (AWGN) in B S is represented by ζ S C N 0 , Z 0 and has the same variance Z 0 .
The signal-to-interference-plus-noise ratio (SINR) at B S that corresponds to D 1 is written as
γ D 1 B P 1 = g 1 S 2 ω 1 ψ D 1 g 1 S 2 ψ D 1 η D 1 2 + η D 1 S 2 + 1 ,
where ψ D 1 = P D 1 Z 0 .
Moreover, at R, it receives both the interference signal from D 1 and the signal from D 2 . Thus, the following is an expression for the signal at R [,]:
y D 2 R P 1 = g 2 R ω 2 P D 2 v 2 + ρ D 2 + ρ D 2 R + g 1 R ω 1 P D 1 v 1 + ρ D 1 + ρ D 1 R + ζ R ,
where Rayleigh fading is used to illustrate the channel from D 2 to R, represented by g 2 R C N 0 , κ g 2 R with variance κ g 2 R . The symbol that represents user D 2 ’s signal is v 2 . The transmission power of D 2 is represented by P D 2 . ρ D 2 C N 0 , η D 2 2 P D 2 and ρ D 2 R C N 0 , η D 2 R 2 P D 2 g 2 R 2 are distortion noise, where η D 2 2 and η D 2 R 2 are the levels of RHI at D 2 and D 2 - B S link, respectively []. Moreover, ρ D 1 R C N 0 , η D 1 R 2 P D 1 g 1 R 2 is the distortion noise, where η D 1 R 2 represents the levels of RHI of D 1 -R link []. The AWGN at R is represented by ζ R C N 0 , Z 0 and has the same variance Z 0 .
The following is an expression for the SINR at R for decoding user D 2 ’s signal:
γ D 2 R P 1 = g 2 R 2 ω 2 ψ D 2 g 2 R 2 ψ D 2 η D 2 2 + η D 2 R 2 + g 1 R 2 ψ D 1 ω 1 + η D 1 2 + η D 1 R 2 + 1 ,
where ψ D 2 = P D 2 Z 0 .
The following represents the eavesdropping equipment E that intercepts the signals of D 1 and D 2 [,]:
y E P 1 = g 1 E ω 1 P D 1 v 1 + ρ D 1 + ρ D 1 E + g 2 E ω 2 P D 2 v 2 + ρ D 2 + ρ D 2 E + ζ E ,
where Rayleigh fading is used to illustrate the channel from D i to E, represented by g i E C N 0 , κ g i E with variance κ g i E []. ρ D 1 E C N 0 , η D 1 E 2 P D 1 g 1 E 2 and ρ D 2 E C N 0 , η D 2 E 2 P D 2 g 2 E 2 are distortion noise, where η D 1 E 2 and η D 2 E 2 are the levels of RHI in the D 1 -E link and D 2 -E link, respectively []. The AWGN at E is represented by ζ R C N 0 , Z E and has the same variance Z E .
It is assumed that E in this scenario can identify more than one user. In particular, E decodes D i ’s overlaid signals using the SIC approach. Consequently, the SINR that the E used to identify the D 2 signal is provided by
γ D 2 E P 1 = g 2 E 2 ω 2 ψ E 2 g 2 E 2 ψ E 2 η D 2 2 + η D 2 E 2 + g 1 E 2 ψ E 1 ω 1 + η D 1 2 + η D 1 E 2 + 1 ,
where ψ E 1 = P D 1 Z E , ψ E 2 = P D 2 Z E .
After SIC, the SINR that the E obtained to identify the D 1 signal is written by
γ D 1 E P 1 = g 1 E 2 ω 1 ψ E 2 g 1 E 2 ψ E 1 η D 1 2 + η D 1 E 2 + g 2 E 2 ψ E 2 η D 2 2 + η D 2 E 2 + 1 .

2.3. Signal Analysis in the Second Time Slot

The representation of the signal from D 1 and R to B S is as follows [,]:
y B S P 2 = g 1 S δ 1 P D 1 q 1 + ρ D 1 + ρ D 1 S + g R S δ 2 P R v 2 + ρ R + ρ R S + ζ S ,
where the power allocation coefficient for user D i is denoted by δ i in the second time slot with δ 1 + δ 2 = 1 and δ 1 > δ 2 . Moreover, R’s transmission power is represented by P R . The symbol that represents the user signal D 1 is q 1 in the second time slot. Rayleigh fading is used to illustrate the channel from R to B S , represented by g R S C N 0 , κ g R S with variance κ g R S . ρ R C N 0 , η R 2 P R and ρ R S C N 0 , η R S 2 P R g R S 2 are distortion noise, where η R 2 and η R S 2 are the levels of RHI at the R and the R- B S link, respectively.
When g 1 S > g R S [], the SINR at B S that is associated with D 1 is expressed as
γ D 1 S P 2 = g 1 S 2 δ 1 ψ D 1 g 1 S 2 ψ D 1 η D 1 2 + η D 1 S 2 + g R S 2 ψ R δ 2 + η R 2 + η R S 2 + 1 ,
where ψ R = P R Z 0 .
The SINR at B S that correlates with D 2 after SIC is expressed as
γ D 2 S P 2 = g R S 2 δ 2 ψ R g R S 2 ψ R η R 2 + η R S 2 + g 1 S 2 ψ D 1 η D 1 2 + η D 1 S 2 + 1 .
The eavesdropping apparatus E that intercepts the signals of D 1 and R is represented by the following [,]:
y E P 2 = g 1 E δ 1 P D 1 q 1 + ρ D 1 + ρ D 1 E + g R E δ 2 P R v 2 + ρ R + ρ R E + ζ E ,
where Rayleigh fading is used to illustrate the channel from R to E, represented by g R E C N 0 , κ g R E with variance κ g R E .
The SINR obtained by E to detect the D 1 signal is supplied by
γ D 1 E P 2 = g 1 E 2 δ 1 ψ E 1 g 1 E 2 ψ E 1 η D 1 2 + η D 1 E 2 + g R E 2 ψ R E δ 2 + η R 2 + η R E 2 + 1 ,
where ψ R E = P R Z E .
The SINR obtained by E to identify the D 2 signal after SIC is given by
γ D 2 E P 2 = g R E 2 δ 2 ψ R E g R E 2 ψ R E η R 2 + η R E 2 + g 1 E 2 ψ E 1 η D 1 2 + η D 1 E 2 + 1 .
In this stage, the instantaneous secrecy rate is used to examine how secure performance may be assessed by two users. First, the instantaneous secrecy rate at D i is determined as [,]
Ψ D 1 = 1 2 log 2 min 1 + γ D 1 B P 1 1 + γ D 1 E P 1 , 1 + γ D 1 S P 2 1 + γ D 1 E P 2 + , Ψ D 2 = 1 2 log 2 min 1 + γ D 2 R P 1 1 + γ D 2 E P 1 , 1 + γ D 2 S P 2 1 + γ D 2 E P 2 + ,
where w + = max 0 , w .

3. Examining the COP

In this section, the COP of the considered system is analyzed. COP is defined as the probability that the instantaneous SINR or SNR of the link falls below a target threshold. COP is one of the key metrics for evaluating system performance, and it also serves as a fundamental indicator for future practical applications. Specifically, Section 3.1 investigates the COP performance of the user D 1 , while Section 3.2 focuses on the user D 2 .

3.1. COP for D 1

The COP of D 1 occurs when both transmission hops fail to decode D 1 ’s signal. Therefore, the COP of D 1 can be expressed as [,]
C O P D 1 = 1 Pr γ D 1 B P 1 ϖ ¯ 1 , γ D 1 S P 2 ϖ ¯ 1 = 1 Pr γ D 1 B P 1 ϖ ¯ 1 K 1 Pr γ D 1 S P 2 ϖ ¯ 1 K 2 ,
where ϖ ¯ i = ϖ i 1 , ϖ i = 2 2 R D i , and R D i is the target rate for D i .
Theorem 1. 
The closed-form expression for the COP of user D 1 can be derived as follows:
C O P D 1 = 1 ψ D 1 κ g 1 S δ 1 ϖ ¯ 1 η D 1 2 + η D 1 S 2 ϖ ¯ 1 ψ R κ g R S δ 2 + η R 2 + η R S 2 + ψ D 1 κ g 1 S δ 1 ϖ ¯ 1 η D 1 2 + η D 1 S 2 × exp ϖ ¯ 1 ψ D 1 κ g 1 S ω 1 ϖ ¯ 1 η D 1 2 + η D 1 B 2 ϖ ¯ 1 ψ D 1 κ g 1 S δ 1 ϖ ¯ 1 η D 1 2 + η D 1 S 2 .
Proof. 
The detailed proof can be found in Appendix A.   □

3.2. COP for D 2

Similar to (15), the COP of user D 2 is defined as the probability that both transmission hops fail to decode its signal. Accordingly, the COP of D 2 can be expressed as
C O P D 2 = 1 Pr γ D 2 R P 1 ϖ ¯ 2 , γ D 2 S P 2 ϖ ¯ 2 = 1 Pr γ D 2 R P 1 ϖ ¯ 2 K 3 Pr γ D 2 S P 2 ϖ ¯ 2 K 4 .
Theorem 2. 
The COP for D 2 can be represented in closed form as follows:
C O P D 2 = 1 ψ D 2 κ g 2 R ω 2 ϖ ¯ 2 η D 2 2 + η D 2 R 2 ϖ ¯ 2 ψ D 1 κ g 1 R ω 1 + η D 1 2 + η D 1 R 2 + ψ D 2 κ g 2 R ω 2 ϖ ¯ 2 η D 2 2 + η D 2 R 2 × ψ R κ g R S δ 2 ϖ ¯ 2 η R 2 + η R S 2 ϖ ¯ 2 ψ D 1 κ g 1 S η D 1 2 + η D 1 S 2 + ψ R κ g R S δ 2 ϖ ¯ 2 η R 2 + η R S 2 × exp ϖ ¯ 2 ψ D 2 κ g 2 R ω 2 ϖ ¯ 2 η D 2 2 + η D 2 R 2 ϖ ¯ 2 ψ R κ g R S δ 2 ϖ ¯ 2 η R 2 + η R S 2 .
Proof. 
The detailed proof can be found in Appendix B.   □

4. Examining the SOP

In this section, the SOP of the proposed model is examined. In addition to COP as an important performance metric, SOP is also a crucial parameter for evaluating the system’s security capability. Moreover, SOP is defined as the probability that the SINR or SNR of either transmission link is smaller than a target threshold. Section 4.1 analyzes the SOP performance of the user D 1 , and Section 4.2 provides the corresponding analysis for the user D 2 .

4.1. SOP for D 1

The capability of decoding the D 1 signal in B S is mentioned in uplink NOMA systems. The secure outage can be identified by taking into account the potential for Ψ D 1 to drop below their target rates. Specifically, the B S ’s SOP for decoding the D 1 signal is provided by [,]
S O P D 1 = 1 Pr 1 + γ D 1 B P 1 1 + γ D 1 E P 1 ϖ 1 O 1 Pr 1 + γ D 1 S P 2 1 + γ D 1 E P 2 ϖ 1 O 2 .
Theorem 3. 
The SOP for D 1 may be represented in approximate closed form as follows:
S O P D 1 1 ω 1 ψ D 1 κ g 1 S ϖ 1 ω 1 ψ E 2 η D 1 2 + η D 1 S 2 κ g 1 E + ω 1 ψ D 1 κ g 1 S × δ 1 ψ D 1 κ g 1 S ϖ 1 δ 1 ψ E 1 η D 1 2 + η D 1 S 2 κ g 1 E + δ 1 ψ D 1 κ g 1 S × exp ϖ ¯ 1 η D 1 2 + η D 1 S 2 ω 1 ψ D 1 κ g 1 S ϖ ¯ 1 η D 1 2 + η D 1 S 2 δ 1 ψ D 1 κ g 1 S .
Proof. 
The detailed proof can be found in Appendix C.   □

4.2. SOP for D 2

Similarly to (19), the SOP B S to decode the signal D 2 is provided by [,]
S O P D 2 = 1 Pr 1 + γ D 2 R P 1 1 + γ D 2 E P 1 ϖ 2 O 3 Pr 1 + γ D 2 S P 2 1 + γ D 2 E P 2 ϖ 2 O 4 .
Theorem 4. 
The SOP for D 2 can be represented in approximate closed form as follows:
S O P D 2 1 ω 2 ψ D 2 κ g 2 R ϖ 2 ω 2 ψ E 2 η D 2 2 + η D 2 R 2 κ g 2 E + ω 2 ψ D 2 κ g 2 R δ 2 ψ R κ g R S ϖ 2 δ 2 ψ R E η R 2 + η R S 2 κ g R E + δ 2 ψ R κ g R S × exp ϖ ¯ 2 η D 2 2 + η D 2 R 2 ω 2 ψ D 2 κ g 2 R ϖ ¯ 2 η R 2 + η R S 2 δ 2 ψ R κ g R S .
Proof. 
The detailed proof can be found in Appendix D.   □

5. Examining the IP

5.1. IP for D 1

Based on (7) and (12), the IP of user D 1 in the NOMA system is defined as the probability that the instantaneous SINR γ D 1 E P 1 , γ D 1 E P 2 exceeds a given threshold ( ϖ ¯ 1 ). Therefore, it can be expressed as follows []:
I P D 1 = Pr γ D 1 E P 1 ϖ ¯ 1 , γ D 1 E P 2 ϖ ¯ 1 = Pr γ D 1 E P 1 ϖ ¯ 1 M 1 Pr γ D 1 E P 2 ϖ ¯ 1 M 2 .
Theorem 5. 
The IP for D 1 can be represented in closed form as follows:
I P D 1 = ω 1 ψ E 2 ϖ ¯ 1 ψ E 1 η D 1 2 + η D 1 E 2 κ g 1 E ϖ ¯ 1 ψ E 2 κ g 2 E η D 2 2 + η D 2 E 2 + ω 1 ψ E 2 ϖ ¯ 1 ψ E 1 η D 1 2 + η D 1 E 2 κ g 1 E × ψ E 1 κ g 1 E δ 1 ϖ ¯ 1 η D 1 2 + η D 1 E 2 ϖ ¯ 1 ψ R E κ g R E δ 2 + η R 2 + η R E 2 + ψ E 1 κ g 1 E δ 1 ϖ ¯ 1 η D 1 2 + η D 1 E 2 × exp ϖ ¯ 1 ω 1 ψ E 2 ϖ ¯ 1 ψ E 1 η D 1 2 + η D 1 E 2 κ g 1 E ϖ ¯ 1 ψ E 1 κ g 1 E δ 1 ϖ ¯ 1 η D 1 2 + η D 1 E 2 .
Proof. 
The detailed proof can be found in Appendix E.   □

5.2. IP for D 2

Similar to (23), based on (6) and (13), the IP of user D 2 can be written as
I P D 2 = Pr γ D 2 E P 1 ϖ ¯ 2 , γ D 2 E P 2 ϖ ¯ 2 = Pr γ D 2 E P 1 ϖ ¯ 2 M 3 Pr γ D 2 E P 2 ϖ ¯ 2 M 4 .
Theorem 6. 
The IP for D 2 can be represented in closed form as follows:
I P D 2 = ψ E 2 κ g 2 E ω 2 ϖ ¯ 2 η D 2 2 + η D 2 E 2 ϖ ¯ 2 ψ E 1 κ g 1 E ω 1 + η D 1 2 + η D 1 E 2 + ψ E 2 κ g 2 E ω 2 ϖ ¯ 2 η D 2 2 + η D 2 E 2 × ψ R E κ g R E δ 2 ϖ ¯ 2 η R 2 + η R E 2 ϖ ¯ 2 ψ E 1 κ g 1 E η D 1 2 + η D 1 E 2 + ψ R E κ g R E δ 2 ϖ ¯ 2 η R 2 + η R E 2 × exp ϖ ¯ 2 ψ E 2 κ g 2 E ω 2 ϖ ¯ 2 η D 2 2 + η D 2 E 2 ϖ ¯ 2 ψ R E κ g R E δ 2 ϖ ¯ 2 η R 2 + η R E 2 .
Proof. 
The detailed proof can be found in Appendix F.    □

6. Expanding Research with a Model of a System Without Relay

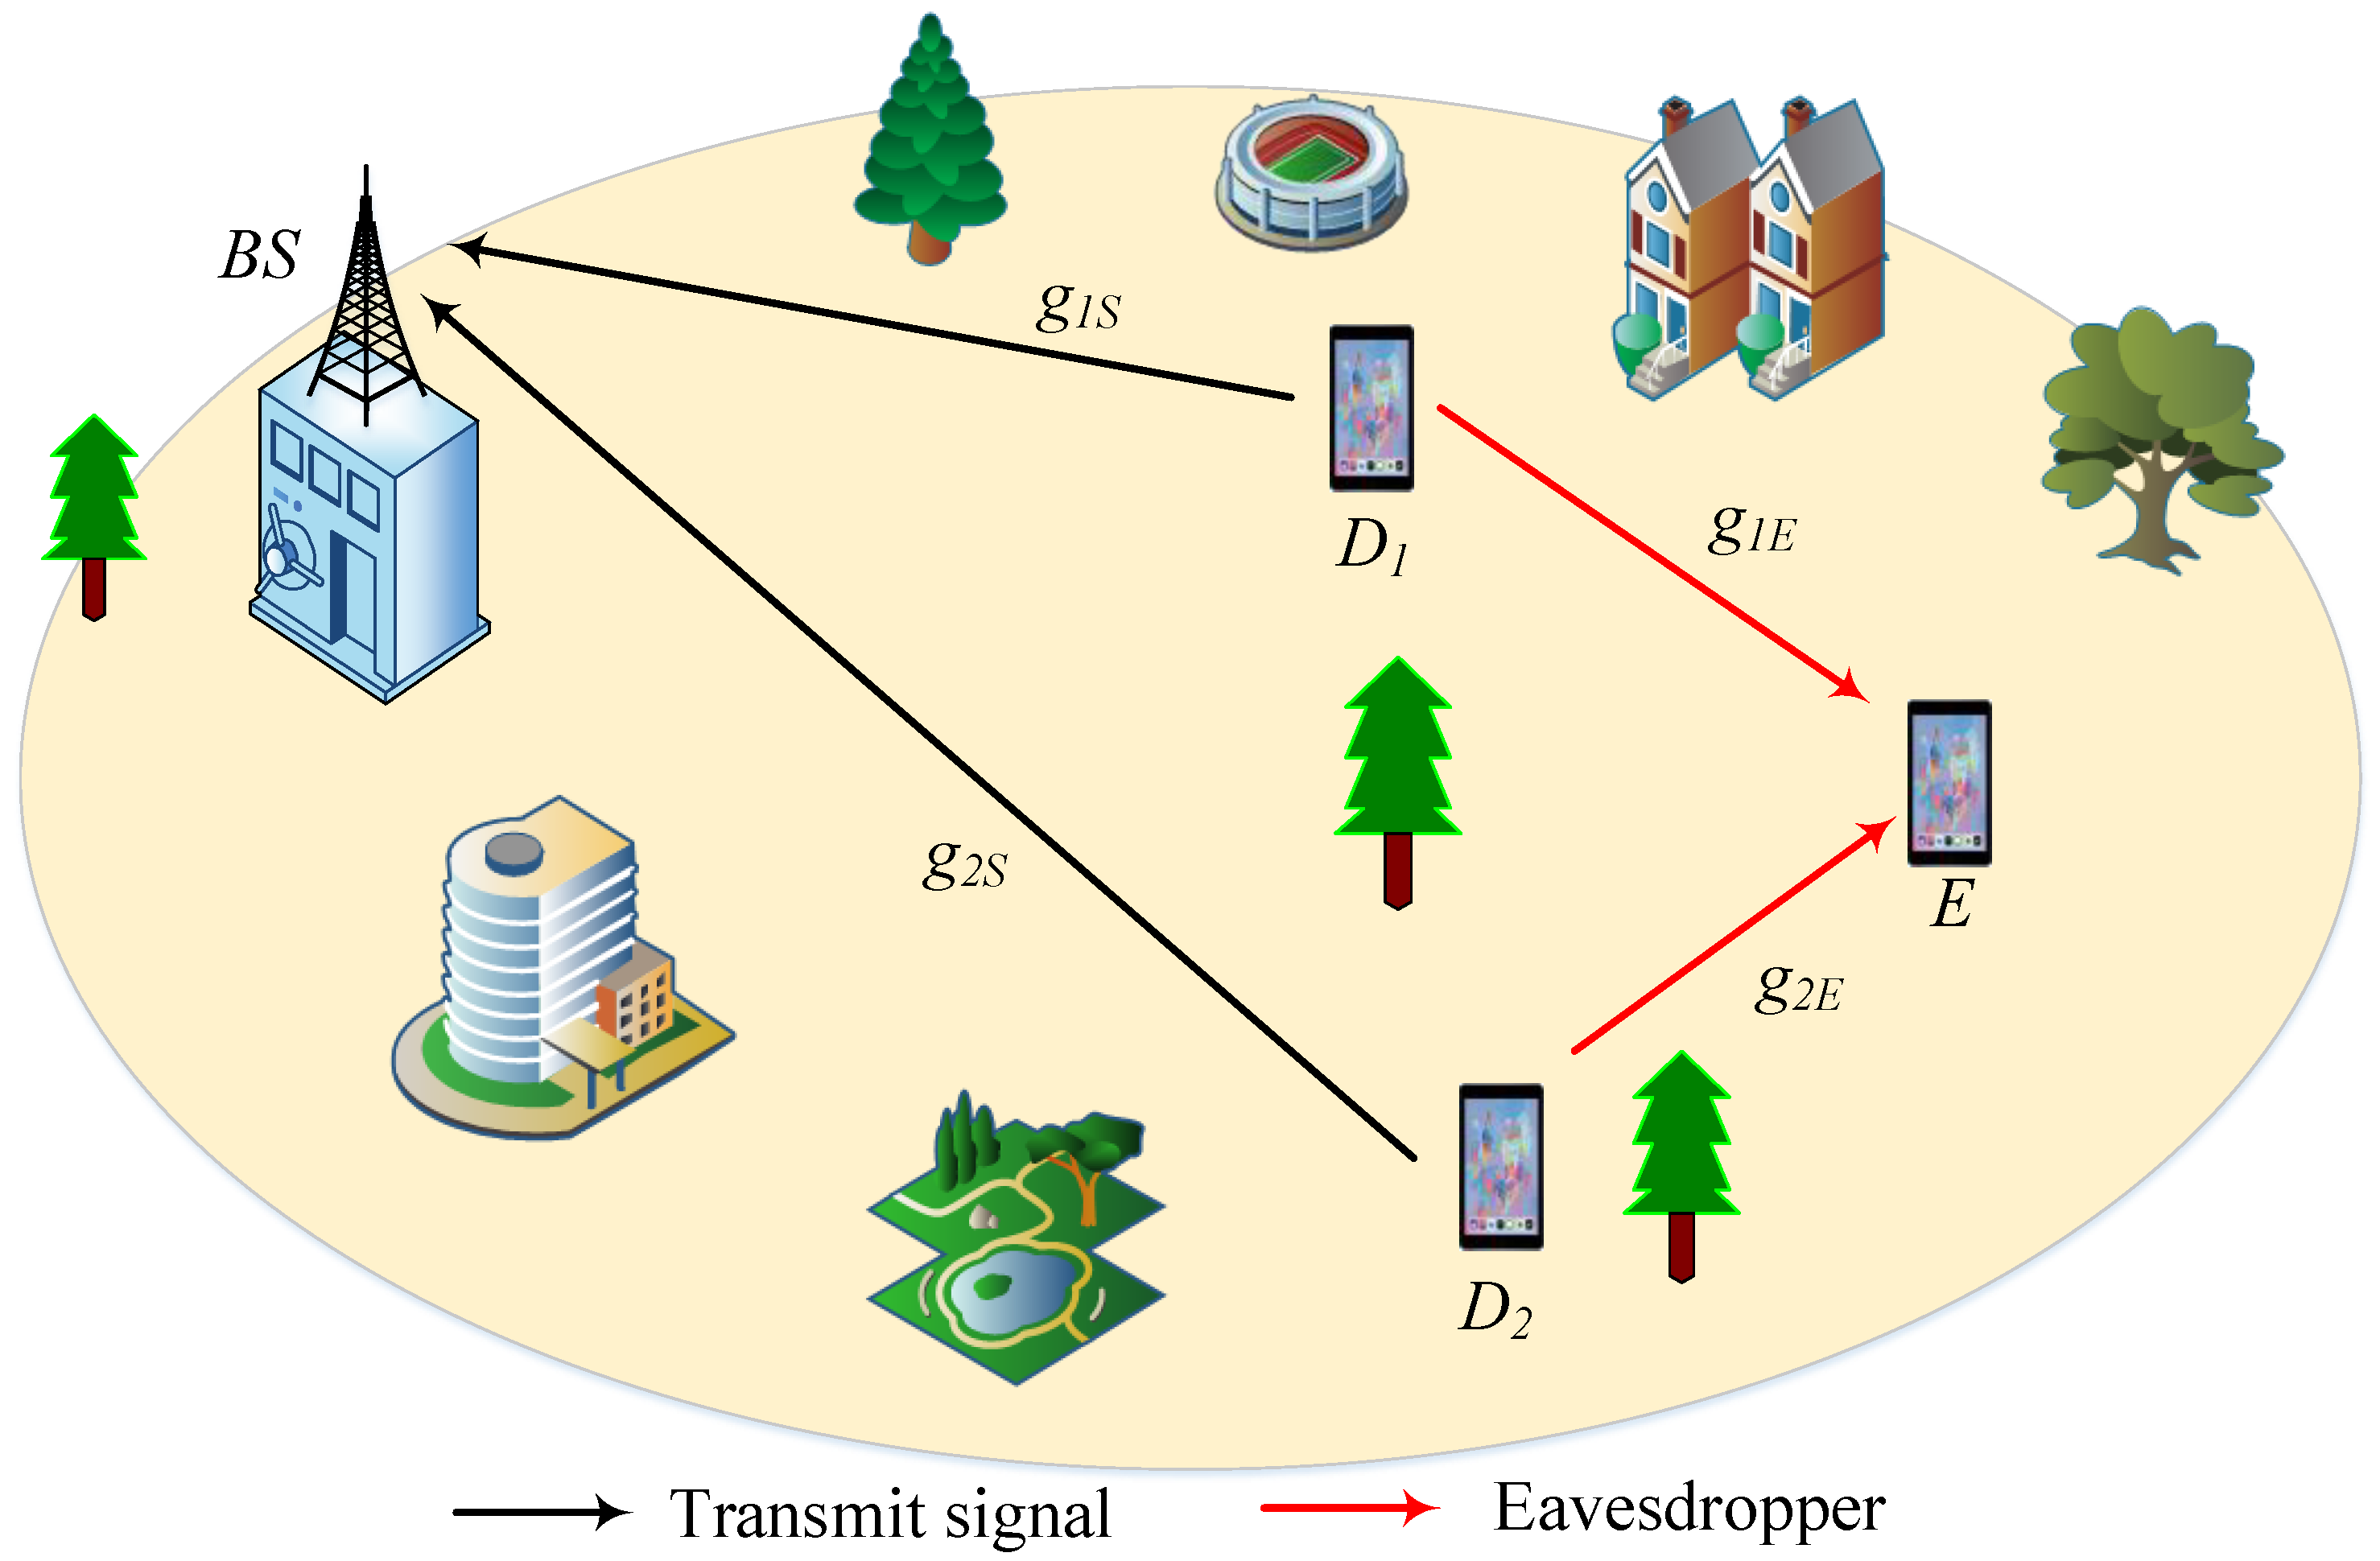
Based on the model depicted in Figure 1, Figure 2 represents an extended model in the absence of an R. Furthermore, due to the lack of an R, the system model comprises only a single phase. In this configuration, the signal transmission process is reestablished such that two users transmit signals to the B S while, simultaneously, device E intercepts these signals from both users. Additionally, similar to Figure 1, there is hardware impairment present across all devices within this system model.
Figure 2. An uplink system model of a cooperative NOMA network without a relay and with an E.
At this time, the signal received at the B S is transmitted from D i as follows:
y B S S 2 = g 1 S ω 1 P D 1 v 1 + ρ D 1 + ρ D 1 S + g 2 S ω 2 P D 2 v 2 + ρ D 2 + ρ D 2 S + ζ S ,
where ρ D 2 S C N 0 , η D 2 S 2 P D 2 g 2 S 2 is distortion noise; η D 2 S 2 represents the levels of RHI of D 2 - B S link [,]. The Rayleigh fading is used to illustrate the channel from D 2 to B S , represented by g 2 S C N 0 , κ g 2 S with variance κ g 2 S [].
Similar to (9), when g 1 S > g 2 S [], the SINR at B S that is associated with D 1 is expressed as
γ D 1 S S 2 = g 1 S 2 ω 1 ψ D 1 g 1 S 2 ψ D 1 η D 1 2 + η D 1 S 2 + g 2 S 2 ψ D 2 ω 2 + η D 2 2 + η D 2 S 2 + 1
After applying SIC, the SINR for decoding the D 2 signal at the B S is represented as follows:
γ D 2 S S 2 = g 2 S 2 ω 2 ψ D 2 g 1 S 2 ψ D 1 η D 1 2 + η D 1 S 2 + g 2 S 2 ψ D 2 η D 2 2 + η D 2 S 2 + 1
The equations for eavesdropping signals at E in the non-R scenario are analogous to those in the R scenario. Furthermore, the equations for the signals received at E, as well as the SINR and SNR equations, are expressed similarly to Equations (5)–(7).

6.1. COP of D 1

The occurrence of the user’s D 1 COP arises when it fails to decode its own signal. At this point, the COP of D 1 is expressed as follows:
C O P D 1 S 2 = 1 Pr γ D 1 S S 2 ϖ ¯ 1 .
where ϖ ¯ i S 2 = ϖ i S 2 1 , ϖ i S 2 = 2 R D i .
Theorem 7. 
The COP for D 1 can be represented in closed form as follows:
C O P D 1 S 2 = 1 ψ D 1 κ g 1 S ω 1 ϖ ¯ 1 η D 1 2 + η D 1 S 2 ϖ ¯ 1 ψ D 2 κ g 2 S ω 2 + η D 2 2 + η D 2 S 2 + ψ D 1 κ g 1 S ω 1 ϖ ¯ 1 η D 1 2 + η D 1 S 2 × exp ϖ ¯ 1 ψ D 1 κ g 1 S ω 1 ϖ ¯ 1 η D 1 2 + η D 1 S 2 ,
Proof. 
The detailed proof can be found in Appendix G.   □

6.2. COP of D 2

Similar to (30), the COP of D 2 is expressed as follows:
C O P D 2 S 2 = 1 Pr γ D 2 S S 2 ϖ ¯ 2 S 2 .
Theorem 8. 
The COP for D 2 can be represented in closed form as follows:
C O P D 2 S 2 = 1 ψ D 2 κ g 2 S ω 2 ϖ ¯ 2 S 2 η D 2 2 + η D 2 S 2 ϖ ¯ 2 S 2 ψ D 1 κ g 1 S η D 1 2 + η D 1 S 2 + ψ D 2 κ g 2 S ω 2 ϖ ¯ 2 S 2 η D 2 2 + η D 2 S 2 × exp ϖ ¯ 2 S 2 ψ D 2 κ g 2 S ω 2 ϖ ¯ 2 S 2 η D 2 2 + η D 2 S 2 .
Proof. 
The detailed proof can be found in Appendix H.   □
Note: Within the framework of a security system model that lacks an uplink R, it is imperative to observe that the user’s IP for D i is determined in a manner akin to scenarios involving an R during the initial phase. This resemblance occurs because the equations for received signals at E and the SINR for D i are calculated identically as they would be with an R. Therefore, even in instances where an R is absent, the IP is derived similarly to cases where an R exists.

7. Simulation Results

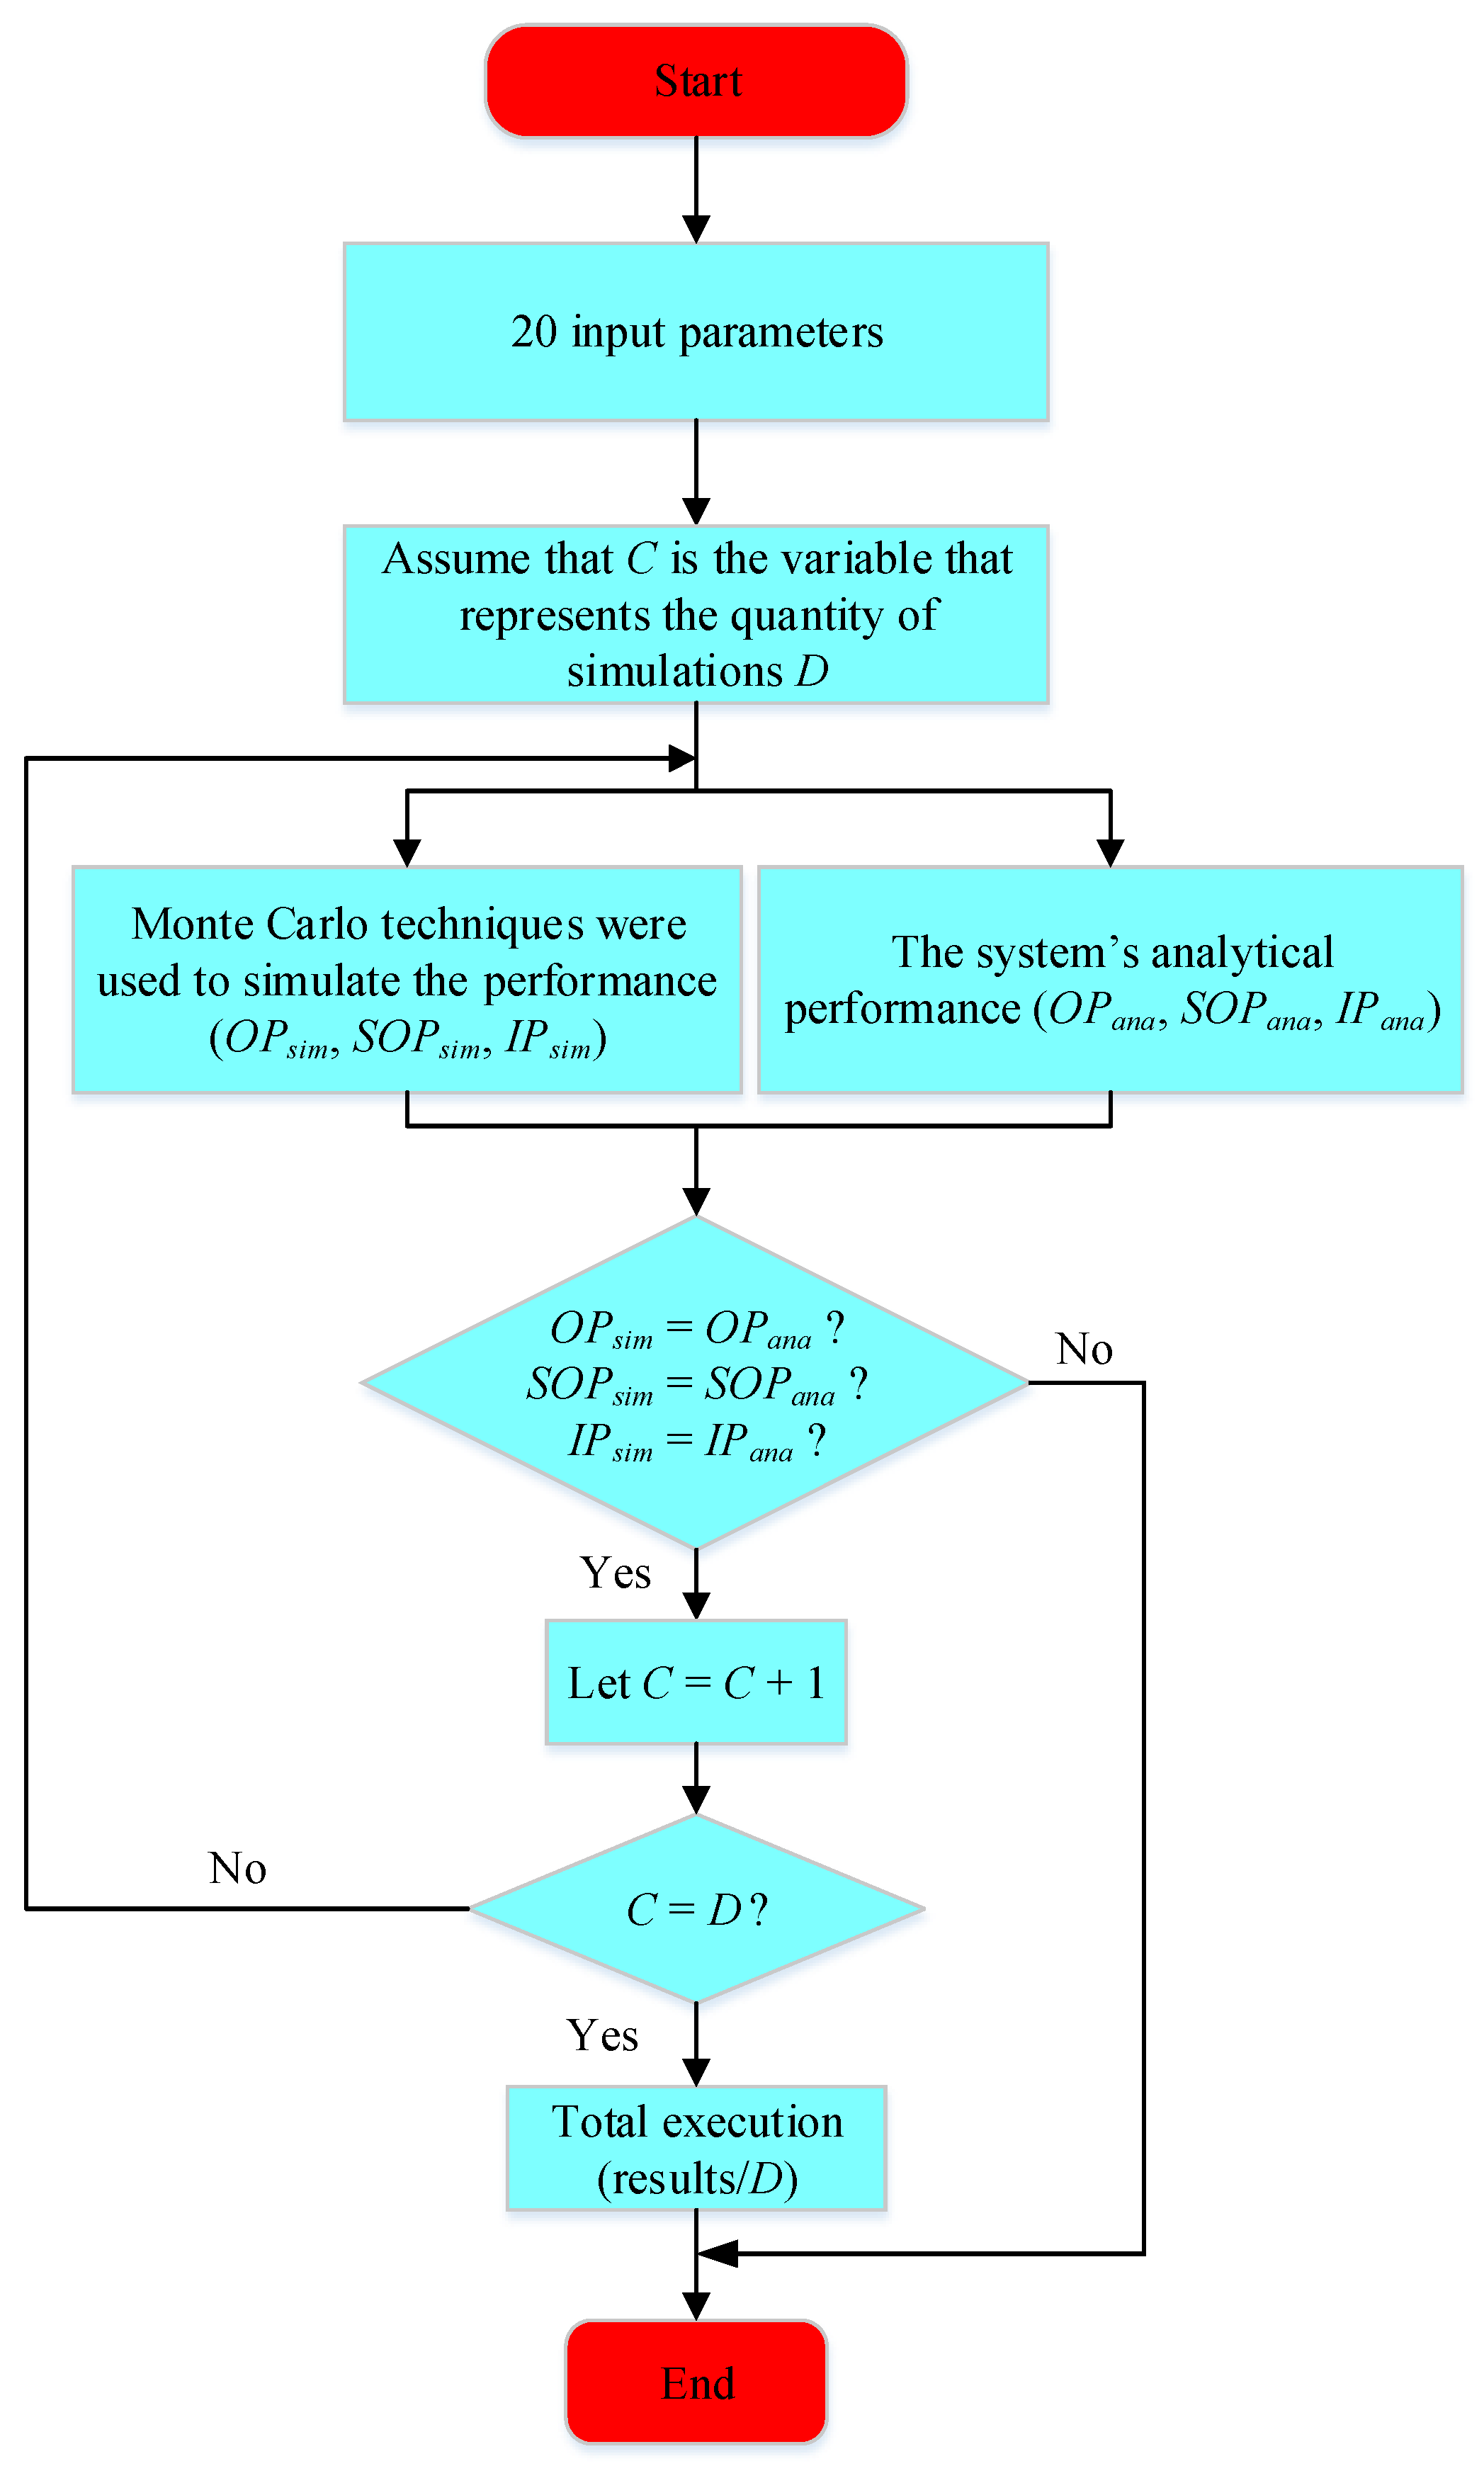
This section uses Monte Carlo simulations to validate the proposed analytical equations and includes the numerical findings for uplink NOMA security with HIs. Moreover, “Ana.” and “Sim.” stand for analytical and simulation, respectively. Table 2 enumerates the primary parameters, with certain exceptions noted for specific situations. Moreover, it is assumed that ψ = ψ D 1 = ψ D 2 = ψ R , ψ E = ψ E 1 = ψ E 2 , η 2 = η D i 2 = η D 1 S 2 = η D i R 2 = η D i E 2 = η D i R 2 = η R 2 = η R S 2 . The Monte Carlo simulation method, as depicted in Figure 3, is employed for conducting the system performance simulations. Furthermore, Algorithm 1 comprehensively encapsulates the fundamental steps derived from our MATLAB code (MATLAB 2000) for analyzing the OP of two users, providing a detailed and structured breakdown of the process. In addition, the scenario concerning IP is addressed similarly.
Table 2. The principal parameters assessed in the evaluated models.
Figure 3. The flowchart about Monte Carlo simulations provides a comprehensive illustration of the system’s performance.
In the OMA baseline, the uplink transmission is organized into four time slots:
  • Slot 1: user D 1 transmits to the B S while the E attempts to intercept D 1 ’s transmission.
  • Slot 2: user D 2 transmits to the relay R; during this slot, D 1 also transmits and thus acts as an interfering source to D 2 (this models residual simultaneous uplink activity); E listens to D 2 in this slot.
  • Slot 3: D 1 transmits again to the B S , with E eavesdropping.
  • Slot 4: R forwards the decoded signal to the B S , and E listens to the relay transmission.
All the slots are assumed to have equal duration unless stated otherwise. The same hardware impairment model is applied to both OMA and NOMA cases.
Algorithm 1 Methodology for Assessing the Probability of Outage for Dual Users.
1:
Input: Configure the input parameters as specified in the following instructions: ω 1 , ω 2 , R D 1 , R D 2 , κ g 1 S , κ g 1 E , κ g 2 E , κ g 2 R , κ g R E , η D 1 2 , η D 2 2 , η D 1 S 2 , η D 1 R 2 , η D 2 R 2 , η D 1 E 2 , η D 2 E 2 , η R 2 , η R S 2 , ψ , ψ E .
2:
Output: Save the simulated and analytical OP for D 1 and D 2 .
3:
Step 1: Configuration
  • Determine the SNR threshold: ψ D 1 = 10 P D 1 10 Z 0 , ψ D 2 = 10 P D 2 10 Z 0 .
  • Set system parameters: The channel gains for g R S , g 1 S , g 1 R , and g 2 R are derived from Rayleigh fading models.
4:
Step 2: Analytical Calculations and Simulation for OP
  • For every SNR value of transmission
    To simulate D i , first compute the received SNR at the destination for D i . Subsequently, determine the simulated OP “Sim.” by averaging the outcomes obtained from multiple Monte Carlo simulations.
    To conduct an analysis of D i , it is necessary to calculate the OP “Ana.”
  • end
5:
Step 3: Results of the Output
6:
Plot and compare the analytical and simulated findings for the OP of each user across the various system settings.
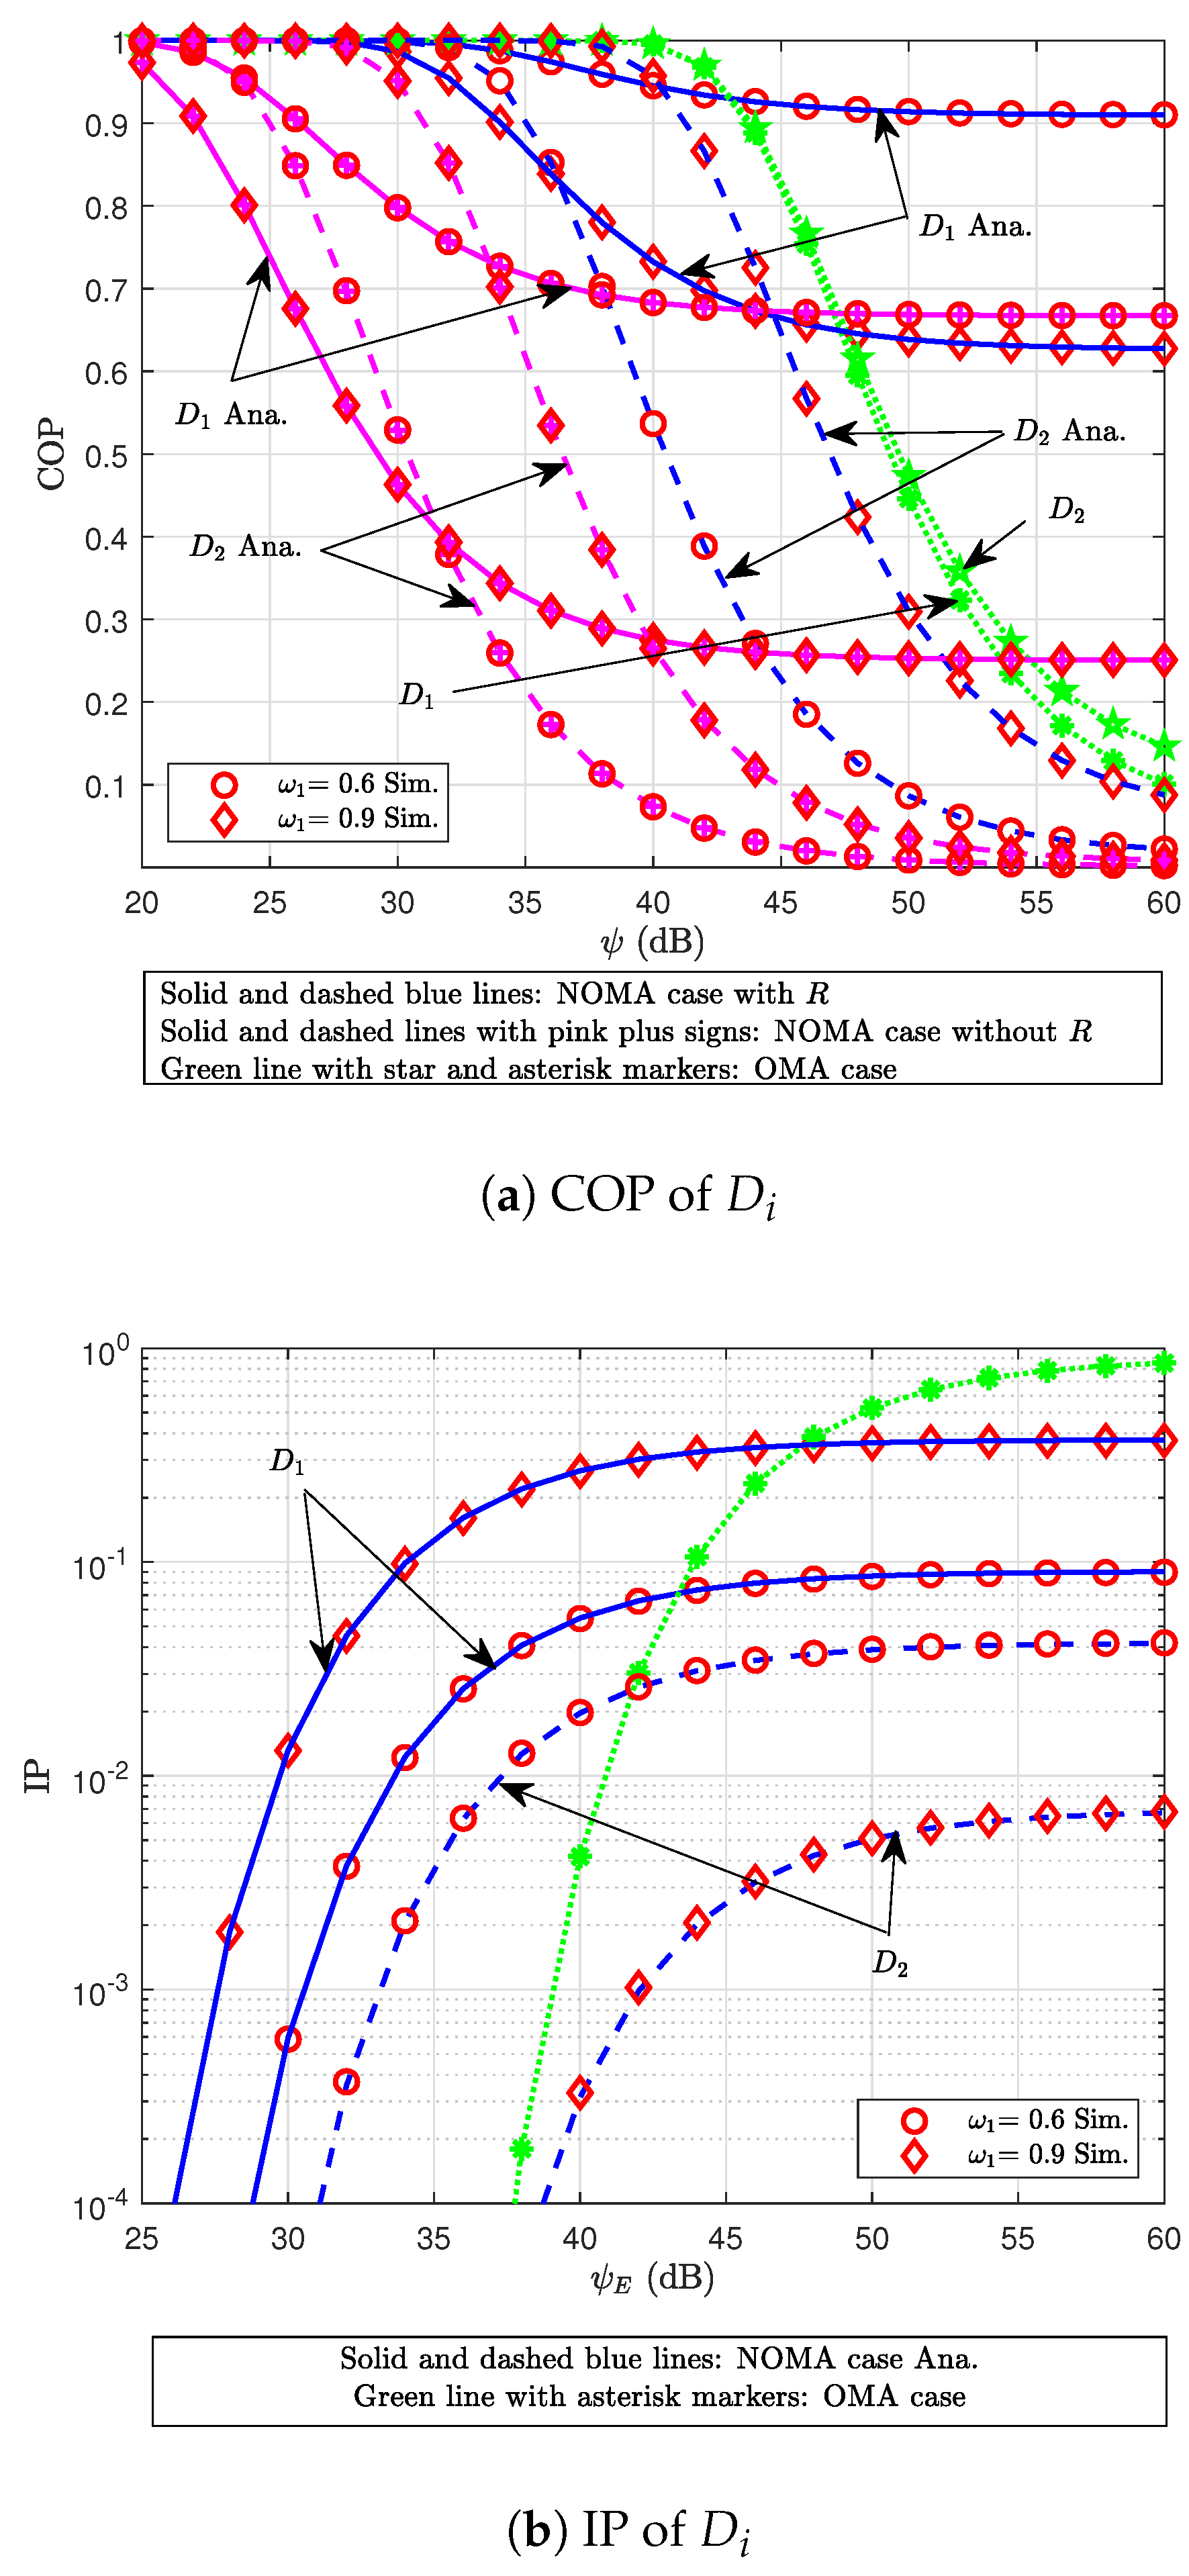
The COP–IP trade-off at user D i as a function of SNR for various values of the parameter ω 1 is shown in Figure 4. The correctness of the mathematical derivations shown in Equations (15)–(23) and (24)–(26) is validated by the tight match between the Monte Carlo simulation results and the analytical curves. First, it is evident that, as the SNR increases, the COP significantly decreases within the system’s operating region. In contrast, the IP increases notably from 25 dB to approximately 55 dB, after which it begins to saturate. This can be intuitively explained: higher SNR improves the signal reception regarding the legitimate users, enhancing reliability, but also makes it easier for the E to intercept the transmission, thereby increasing IP. Second, in comparing the performance of the two users, D 2 shows a lower COP than D 1 for SNR values roughly between 40 dB and 60 dB, and a lower IP than D 1 over the SNR range of 31 dB to 60 dB. Moreover, the OP of the system without the R is significantly lower than that of the system incorporating an R. This occurrence can be attributed to the interference encountered by the R from user D 1 within this system model, resulting in a considerably higher OP compared to scenarios that do not include an R. Third, looking at the impact of the power allocation factor ω 1 , it is found that raising ω 1 from 0.6 to 0.9 significantly lowers user D 1 ’s COP, suggesting increased dependability. However, this improvement comes at the cost of degraded performance for D 2 , whose COP increases in the same region. A similar but reversed trend is observed for the IP: as ω 1 increases, the IP of D 1 worsens, while that of D 2 improves. This trade-off arises because a larger power allocation to D 1 improves its reception of the signal while lowering the power available to D 2 , which hinders its capacity to correctly decode the data. Finally, the secrecy performance of the uplink NOMA system regarding HIs for all devices significantly outperforms that of the uplink OMA system under the same HI conditions. These observations emphasize the critical role of power allocation strategies in designing practical and balanced NOMA systems, especially in scenarios involving R and secrecy considerations.
Figure 4. COP–IP trade-off at user D i versus SNR for varying ω 1 .
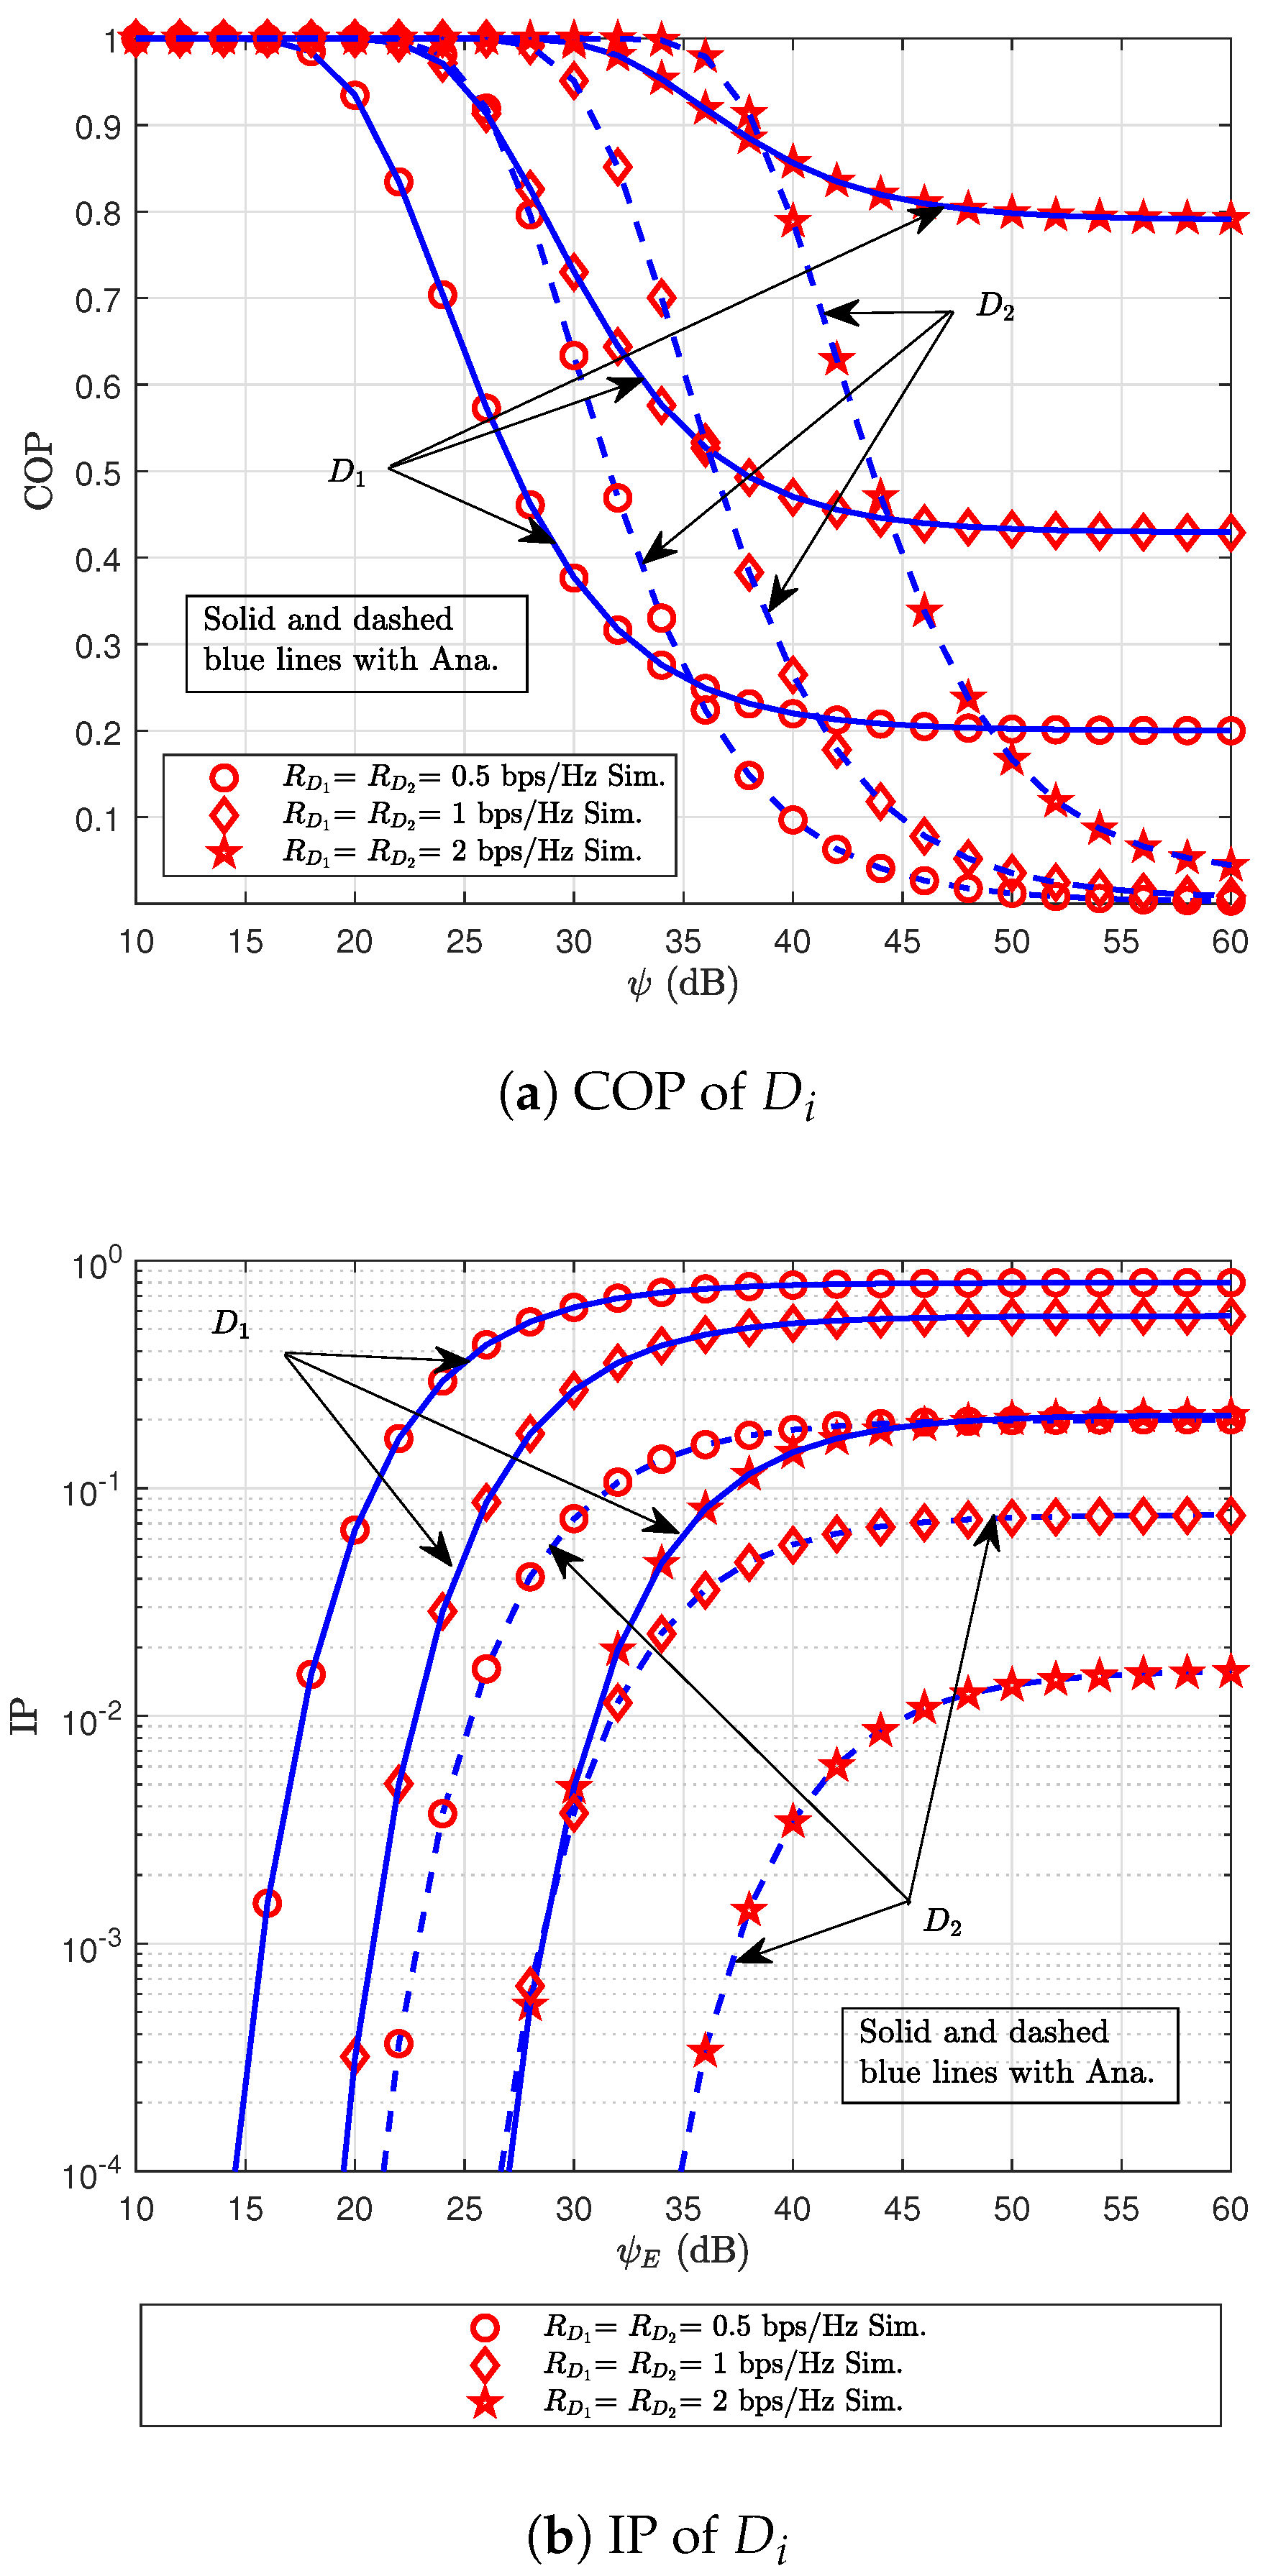
Figure 5 illustrates the COP–IP trade-off at user D i as a function of SNR for different values of the rate threshold parameter R D 1 = R D 2 . Similar to Figure 4, as the SNR increases, the COP of user D i decreases significantly, while the IP increases markedly within the system’s operational region. A key observation in this figure is the impact of the rate threshold R D 1 = R D 2 on system performance. It can be seen that, when R D 1 = R D 2 increases from 0.5 bps/Hz to 1 and then to 2 bps/Hz, the COP of user D i rises substantially, whereas the IP drops significantly. This behavior can be explained as follows: as the rate threshold increases, the system requires a higher minimum data rate for successful decoding. As a result, the probability that the legitimate user fails to meet this requirement increases, leading to a higher COP. Conversely, a higher rate threshold imposes stricter decoding conditions for the E, making it more difficult to intercept the transmission and thus reducing the IP. This trade-off underscores the importance of carefully choosing appropriate rate thresholds in practical system designs to achieve a desirable balance between communication reliability and security.
Figure 5. COP–IP trade-off at user D i versus SNR for varying R D 1 = R D 2 .
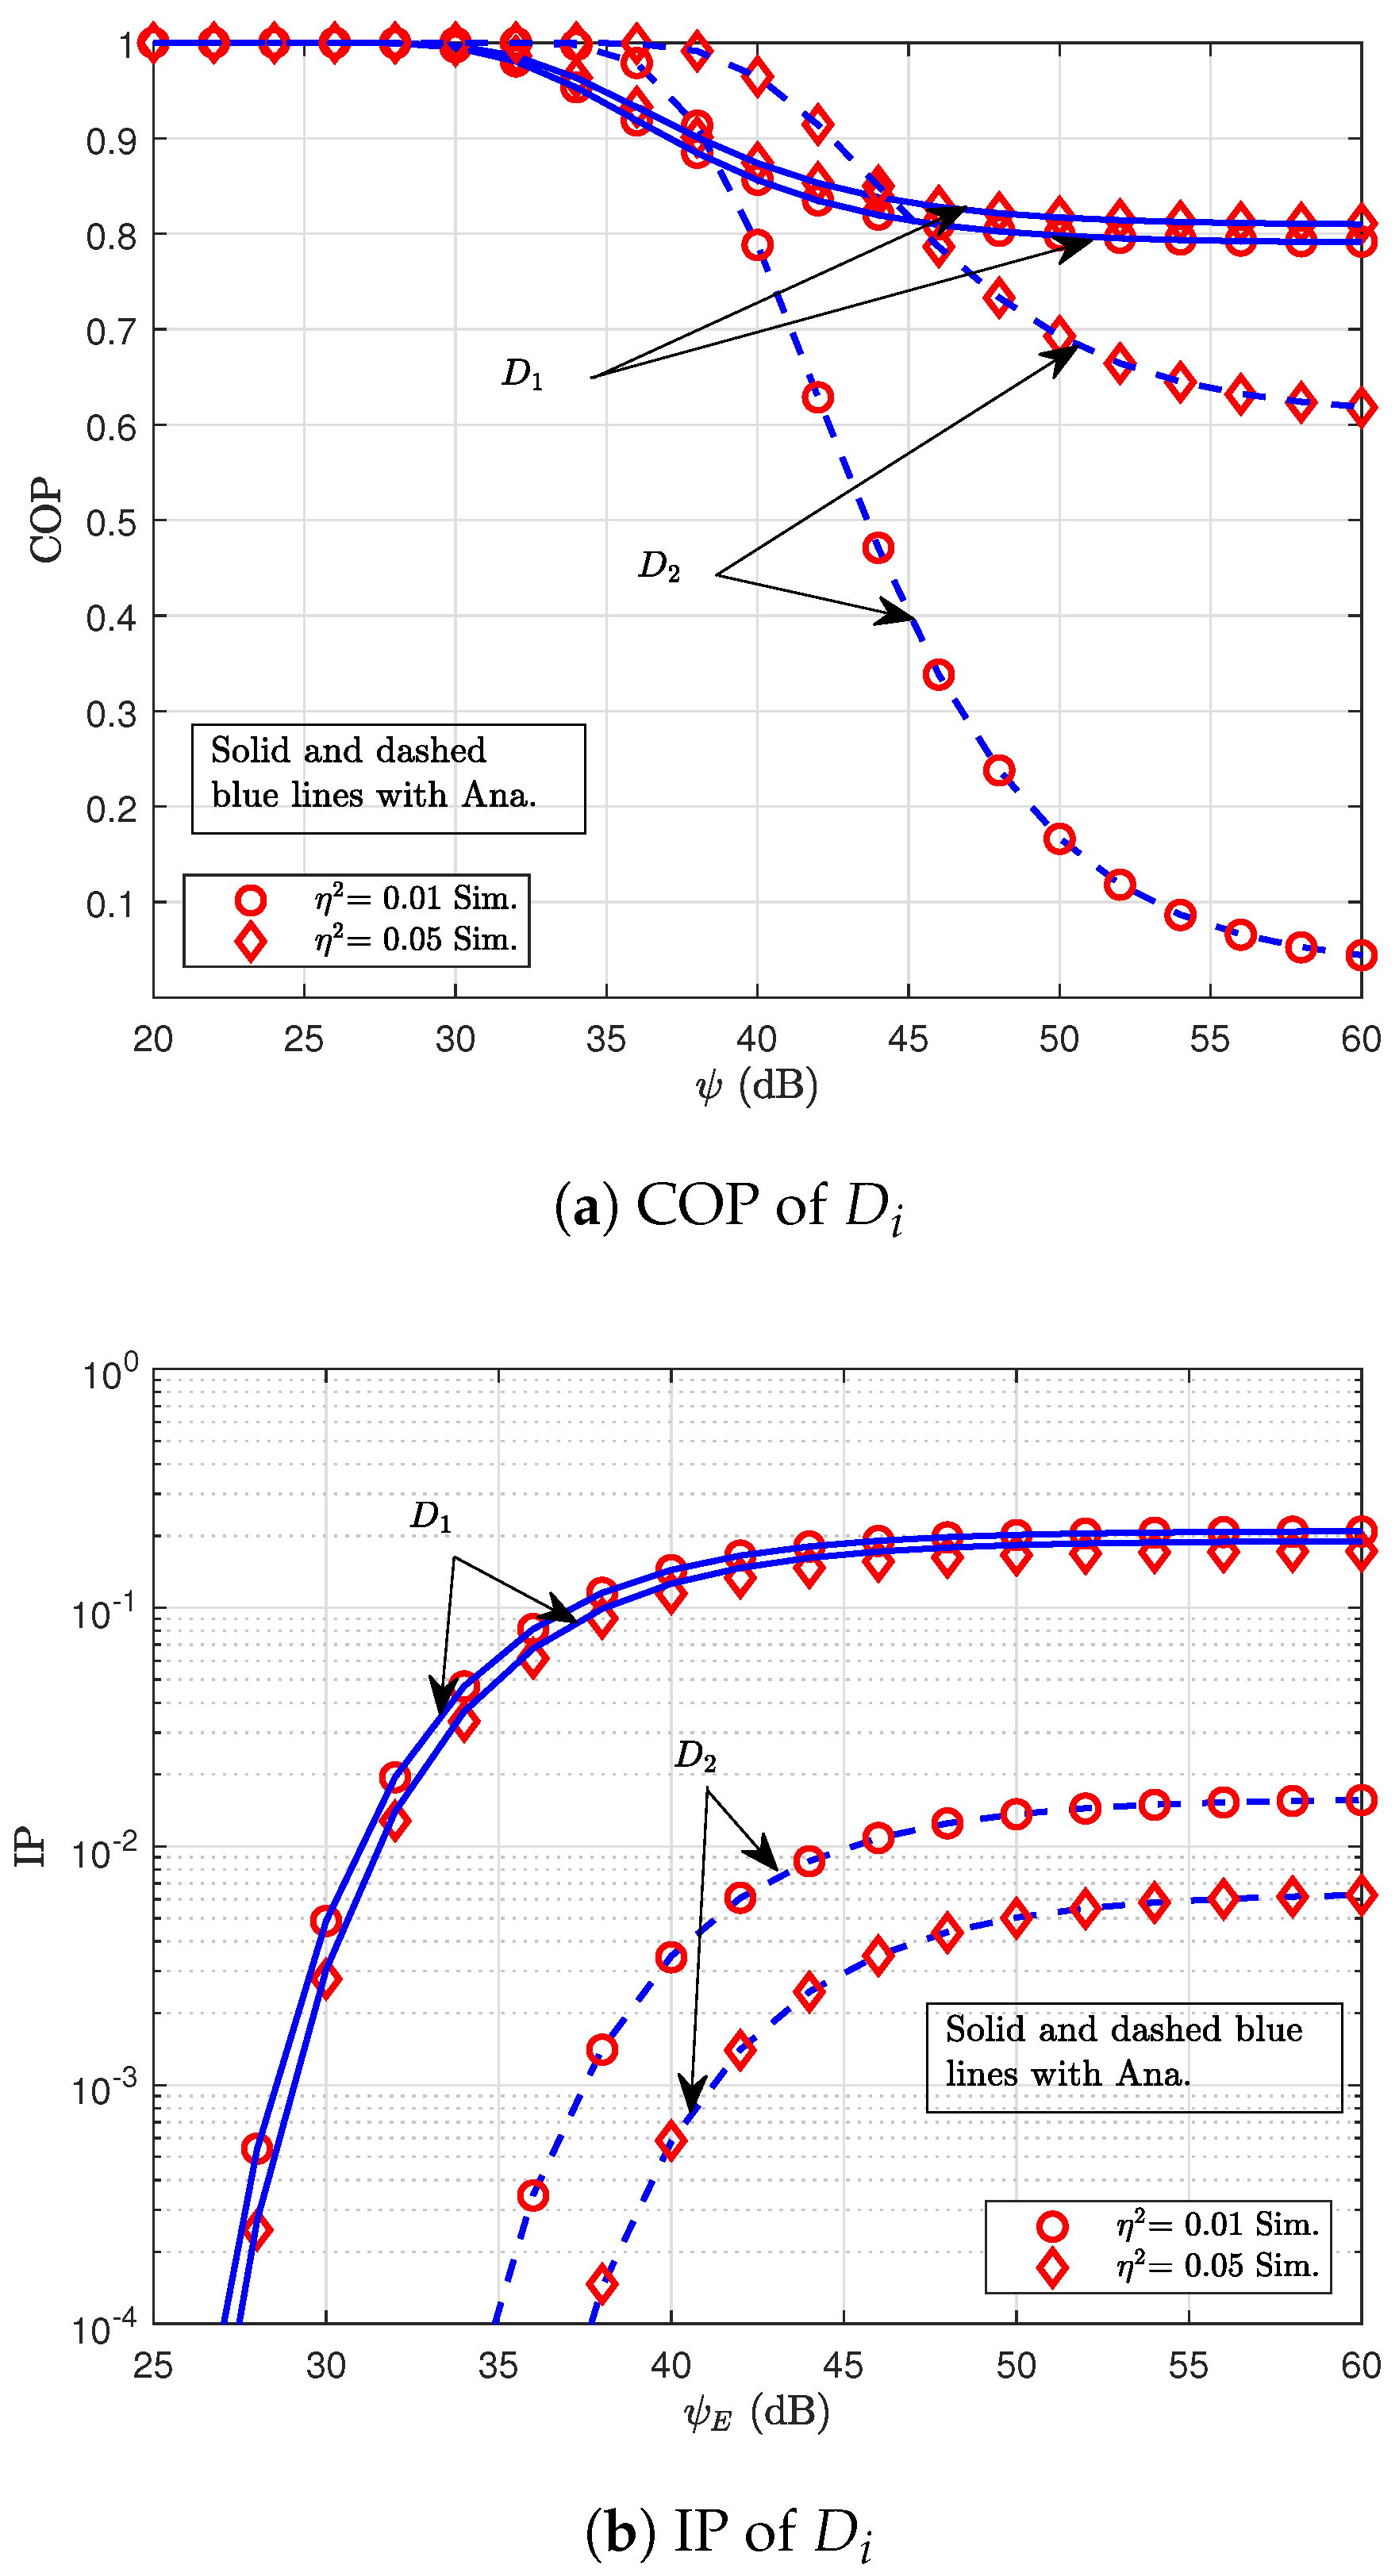
Figure 6 illustrates the COP–IP trade-off at user D i versus SNR for different values of the HI parameter η 2 . Similar to the previous figures, it can be observed that, as the SNR increases, the COP of user D i decreases while the IP increases. Additionally, both the COP and IP of user D 2 remain lower than those of user D 1 within the operating SNR range. A key observation in this figure is the impact of HIs for all devices, analyzed by varying the impairment parameter η 2 from 0.01 to 0.05. It is observed that increasing this parameter leads to a noticeable rise in the COP of user D i , while the IP of user D i significantly decreases. This phenomenon can be explained as follows: when HIs increase regarding all devices, the overall system performance deteriorates due to the distortion introduced during signal transmission and reception. As a result, legitimate users experience a substantial degradation in signal quality, resulting in a higher probability that the received signal fails to meet the required QoS thresholds; thus, the COP increases. Meanwhile, the same impairments also affect the E’s receiver, reducing the SINR and making it more difficult to intercept and decode the legitimate signal successfully. Consequently, the IP drops significantly. Therefore, while HIs worsen connection reliability, they unintentionally enhance the system’s PLS by reducing the likelihood of successful eavesdropping.
Figure 6. COP–IP trade-off at user D i versus SNR for varying η 2 .
The SOP of D 1 and D 2 as a function of SNR with varying values of ω 1 is shown in Figure 7. First, Monte Carlo simulations confirm that the mathematical analysis in Equations (19)–(22) is entirely accurate. Second, the figure illustrates how the SOP values of both D i users decrease as the SNR increases from −10 dB to 40 dB. This may be described as follows: The E does not gain proportionately from increased SNR, while genuine users receive stronger signals. By increasing the secrecy capacity gap between the legal link and the eavesdropping link, this results in lower SOP and better security performance. Furthermore, the SOP of user D 1 is substantially lower than that of user D 2 . This may be explained by the fact that user D 1 has a stronger and more reliable signal because they are closer to B S than user D 2 . As a result, the signal from D 1 is more difficult to decipher than that from E. Third, the SOP of D 1 dramatically drops while the SOP of D 2 grows when ω 1 rises from 0.6 to 0.9. This is explained by the fact that, as D 1 receives more power, the quality of the signals transmitted and received improves, resulting in a lower SOP. On the other hand, when D 1 receives greater power, D 2 receives less power, resulting in poorer transmission and reception of signals and a higher SOP for D 2 . This implies that the power allocation coefficient is important for future practical model design and development. Similar to Figure 4, the secrecy performance of the uplink NOMA system under HIs regarding all devices significantly outperforms that of the uplink OMA system under the same HI conditions.
Figure 7. SOP of D i for NOMA and OMA systems vs. transmitting SNR with different ω 1 .
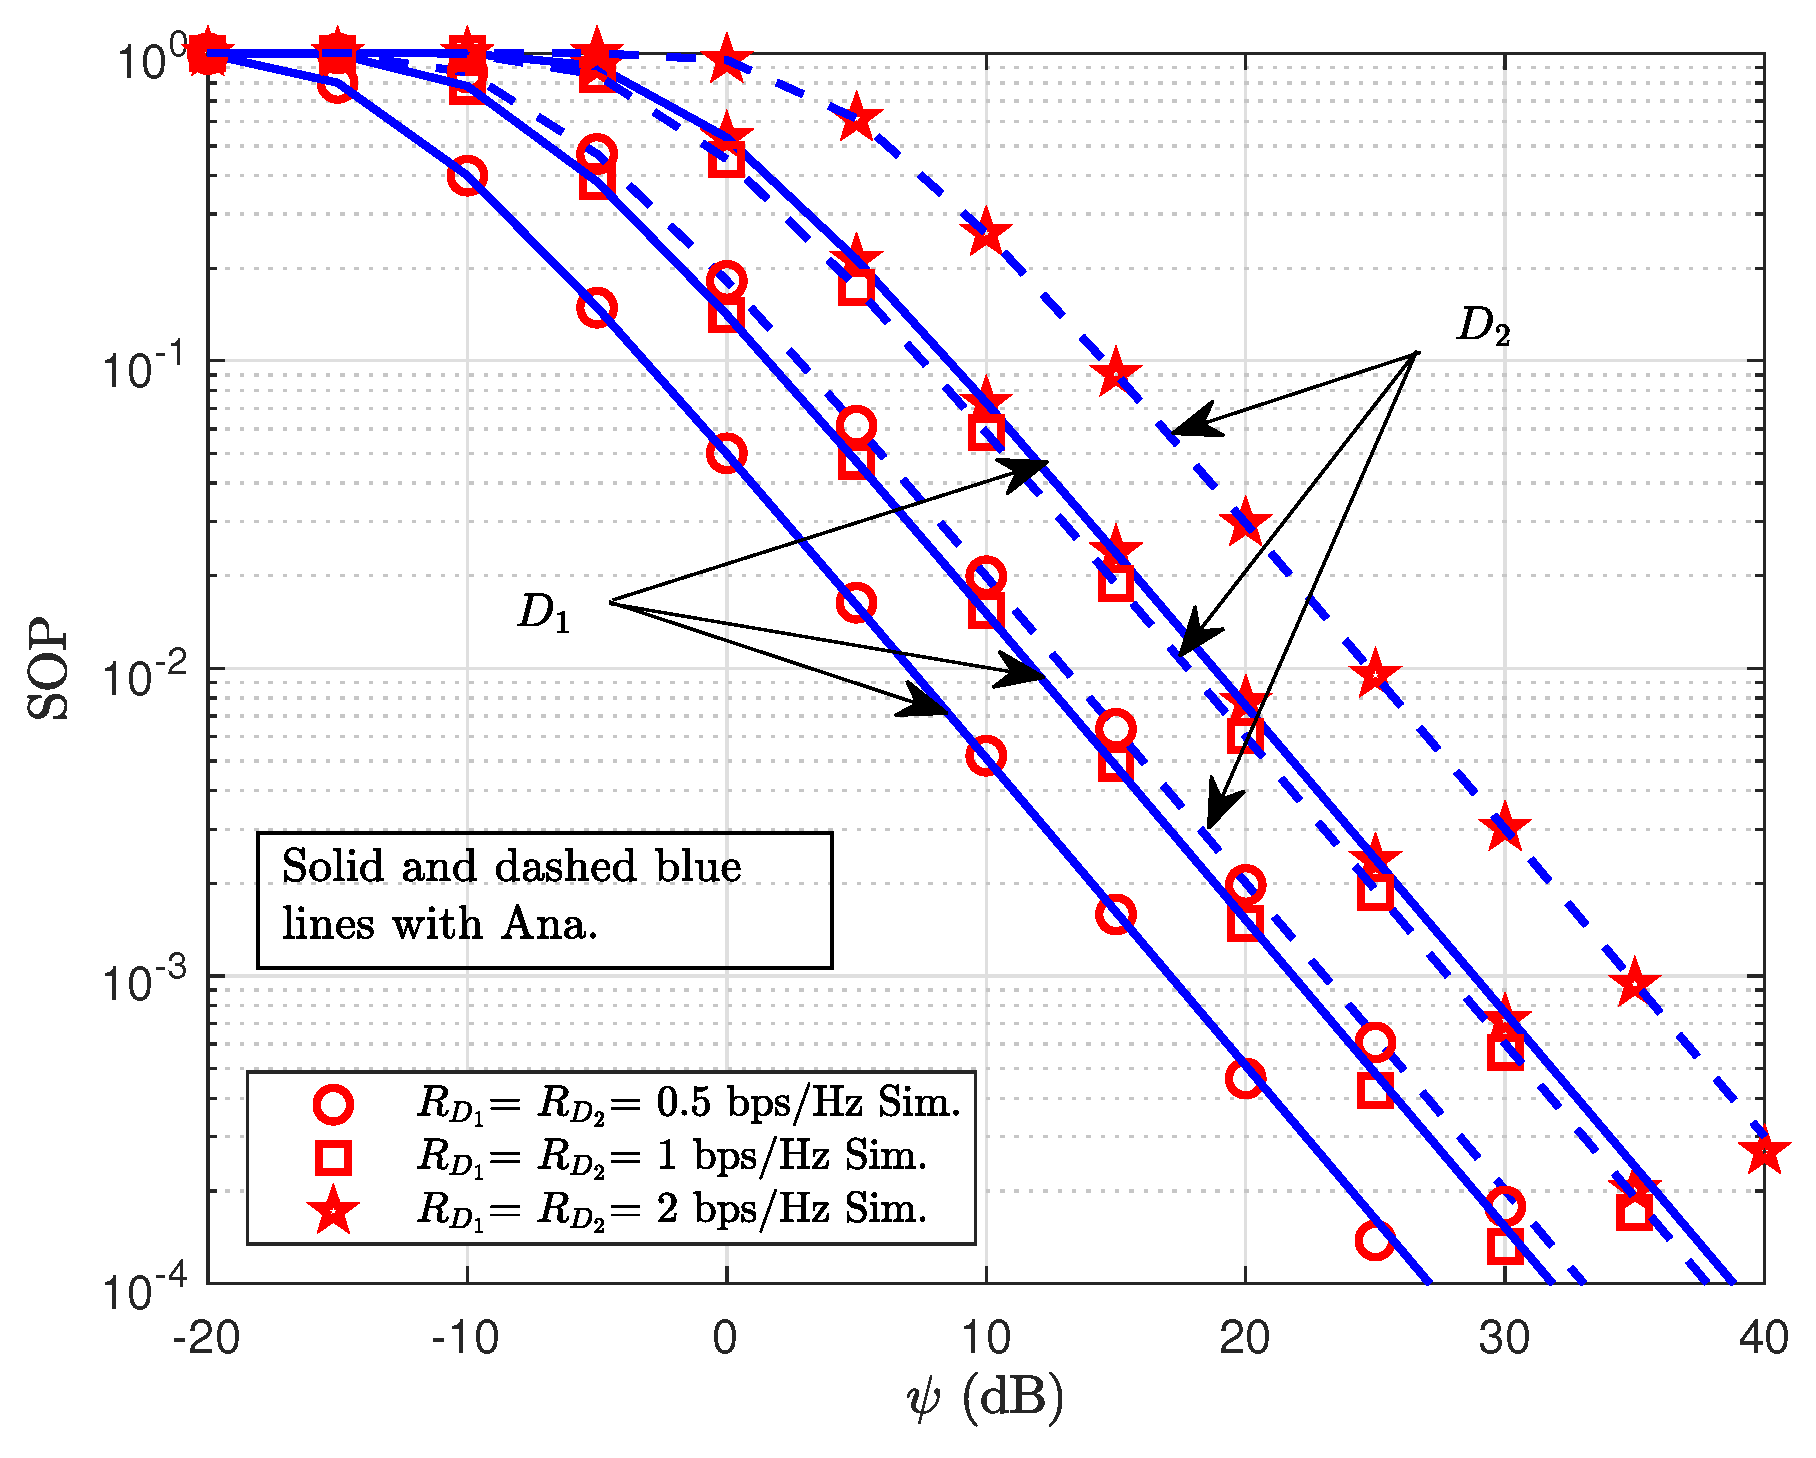
The SOP of D i as a function of the SNR with various values of R D 1 = R D 2 is shown in Figure 8. As in Figure 7, it is readily apparent that the SOP of D i decreases as the SNR increases from −10 to 40 dB. The justification for this SOP variation is comparable to that covered in the previous illustration. Furthermore, the SOP of D i increases in the SNR range of −10 dB to 40 dB when the value of R D 1 = R D 2 increases from 1 bps/Hz to 2 bps/Hz. This suggests that the signal SOP decreases with a decreasing threshold factor and vice versa. One explanation for this problem is that the system must meet increasingly demanding requirements to ensure secure communication as the necessary secrecy rate threshold increases. The likelihood of failing to meet this requirement, that is, the SOP, increases as a result.
Figure 8. SOP of D i vs. transmitting SNR with different R D 1 = R D 2 .
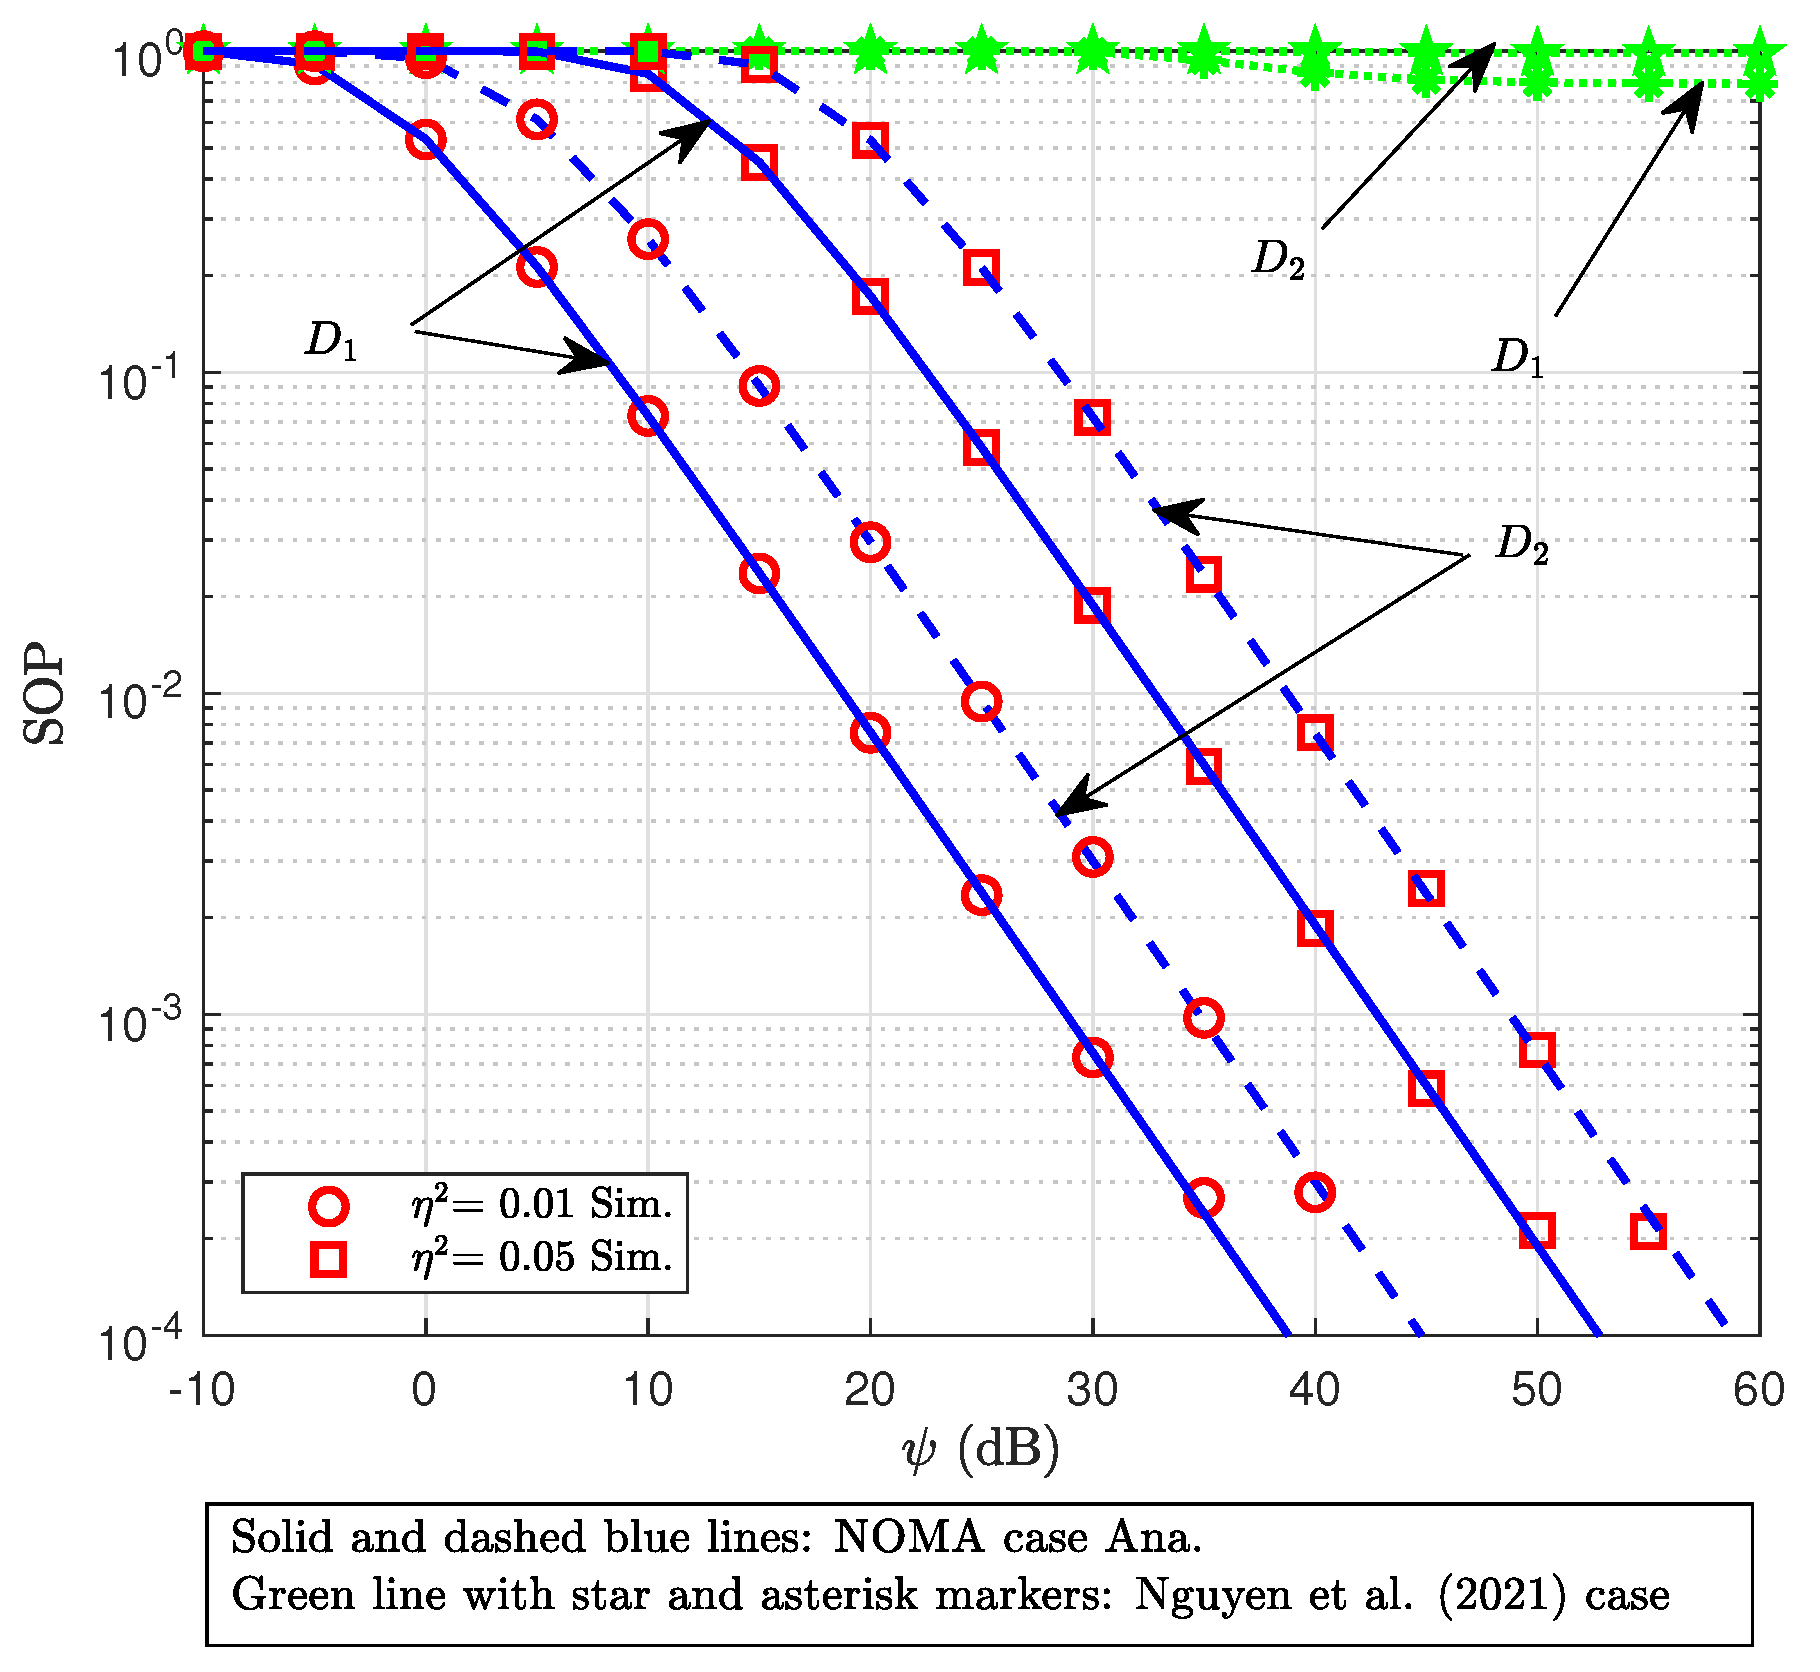
The SOP of D i is shown versus SNR for a range of η 2 values in Figure 9. Like the last two graphs, the SOP for both users drastically drops as the SNR rises from −10 to 40 dB. Interestingly, this chart looks at how the SOP is impacted by the HI factor. In particular, the SOP for both users drastically decreases as η 2 increases from 0.01 to 0.05. This can be explained by the fact that faults and imperfections during signal processing produce more interference when hardware is impaired. The efficacy of information security measures may be diminished by such interference, which can impede secure connections. The user’s capacity to preserve information security decreases with increasing interference levels, increasing the likelihood of a secrecy outage. The SOP of the users in [], which assumes perfect hardware without impairments, is substantially higher than the SOP of both users in this investigation since all devices are susceptible to HIs. This outcome may be explained by the fact that the total signal quality for both authorized users and the E decreases when HIs occur in all components of the system, including B S , D i , R, and even E. However, secrecy capacity may increase and SOP may decrease if E is more negatively impacted by HIs than authorized users, for example, due to a longer distance, a weaker received signal, or a lack of system optimization. Thus, it makes sense and is consistent with realistic expectations to adhere to a lower SOP in situations when hardware limitations have a more detrimental effect on the E than on authorized users. A potential passive security boost due to the asymmetric impacts of hardware limitations may be highlighted in the Discussion section by emphasizing this intriguing discovery.
Figure 9. SOP of D i vs. transmitting SNR with different η 2 , comparing the SOP results with those in [].
Figure 10 illustrates the SOP of user D i as a function of the SNR for different cases of non-uniform HIs. It can first be observed that, as the SNR increases, the SOP of D i consistently decreases within the system’s operating region. Furthermore, this figure highlights the comparative scenarios that consider non-uniform HI distributions, including cases where all nodes are impaired, only the E is impaired, only node D 1 is impaired, and the case where E is ideal (without HI) while all other nodes are impaired. Specifically, when all nodes experience HIs, the SOP of D i attains the highest values as the SNR increases from 30 dB to 60 dB. In contrast, when only E is affected by HIs, the SOP of D 1 is lower than that in the other two scenarios, while the SOP of D 2 is lower than in the all-nodes-impaired case and nearly equal to the case where only E is impaired. In the remaining case, where only D 1 is affected by HIs, the SOP of D 1 is lower than that when all nodes are impaired but higher than that when only E is impaired. Finally, when E operates without HIs (i.e., with ideal hardware) while all other nodes are affected, the SOP of D i is observed to be nearly identical to that in the all-nodes-impaired scenario and higher than in all the other cases.
Figure 10. SOP of D i versus transmit SNR for different η 2 values under non-uniform HI distributions.

8. Conclusions

The secrecy performance of an uplink NOMA relay network with HIs was examined in this research. A model of an uplink system is considered in which two users employ R to send signals to the B S , and their signals are also intercepted by E. All the devices in this system have HIs. Closed-form expressions for the SOP, IP, and COP were developed to describe the system’s secrecy and reliability performance based on the suggested model. According to the simulation results, important parameters that affect the total secrecy of the system include power allocation coefficients, secrecy rate thresholds for the two users, and the HI factors of all the devices. Furthermore, the SOP performance of the suggested system is noticeably superior to that documented in []. Compared to the benchmark uplink OMA model regarding the HIs of all the devices, the analysis and simulations in this study demonstrate that incorporating NOMA technology into the secure uplink network significantly outperforms the OMA counterpart under the same hardware constraints. Moreover, the numerical results indicate that the proposed communication model can achieve over 90% reliability (with a COP below 0.1) and provide approximately a 30% improvement in SOP compared to conventional OMA-based systems under the same HI conditions. Although our research provides insightful information on the PLS of NOMA relay networks with suboptimal hardware, several crucial issues need further study. For example, it has not yet been fully investigated how user movement and imperfect channel conditions affect secrecy performance. Moreover, the findings of this study offer valuable insights for network operators seeking to optimize security by fine-tuning critical system parameters, including power allocation, relay placement, and user pairing, to improve secrecy performance. Additionally, hardware imperfections can be strategically utilized as a passive security measure. This approach naturally degrades an eavesdropper’s channel while leaving legitimate users unaffected, thereby providing an additional layer of inherent protection.
For the design of secure communication systems in real-world Internet of Things (IoT) and upcoming 6G networks, where HIs are inevitable, the suggested analysis can provide a strong theoretical basis. To further improve system security, future studies may consider expanding the existing model to include many users and Rs, as well as adaptive power allocation and dynamic user pairing techniques. Moreover, a more comprehensive sensitivity analysis will be considered to assess system performance under diverse conditions, such as alternative channel models, to further evaluate robustness and generalizability.

Author Contributions

D.-H.H. and T.-A.N. designed the algorithm, performed the theoretical analysis, checked the results, and wrote the manuscript. X.-T.T., M.-L.D. and V.-T.L. implemented the simulation and contributed to the manuscript preparation. A.L.I. and C.-T.L. were responsible for formulating the research issues and revising the paper. All authors have read and agreed to the published version of the manuscript.

Funding

This research was supported in part by the National Science and Technology Council, Taiwan (grant number NSTC 113-2410-H-030-077-MY2).

Institutional Review Board Statement

Not applicable.

Data Availability Statement

The original contributions presented in this study are included in the article. Further inquiries can be directed to the corresponding author.

Conflicts of Interest

The authors declare no conflicts of interest.

Appendix A

First, the cumulative distribution function (CDF) and the probability density function (PDF) of L g i R , g R S , g 1 S , g i E , g R E are given by [,]
F L 2 l = 1 exp x κ L , f L 2 l = 1 κ L exp x κ L .
According to Equation (15), K 1 can be computed as
K 1 = Pr g 1 S 2 ω 1 ψ D 1 g 1 S 2 ψ D 1 η D 1 2 + η D 1 B 2 + 1 ϖ ¯ 1 = Pr g 1 S 2 ϖ ¯ 1 ψ D 1 ω 1 ϖ ¯ 1 η D 1 2 + η D 1 B 2 = 1 F g 1 S 2 ϖ ¯ 1 ψ D 1 ω 1 ϖ ¯ 1 η D 1 2 + η D 1 B 2 = exp ϖ ¯ 1 ψ D 1 κ g 1 S ω 1 ϖ ¯ 1 η D 1 2 + η D 1 B 2 ,
here, (A2) is derived subject to the condition of ω 1 > ϖ ¯ 1 η D 1 2 + η D 1 B 2 and is based on the CDF and PDF presented in (A1).
Next, according to Equation (15), K 2 can be written as
K 2 = Pr g 1 S 2 δ 1 ψ D 1 g 1 S 2 ψ D 1 η D 1 2 + η D 1 S 2 + g R S 2 ψ R δ 2 + η R 2 + η R S 2 + 1 ϖ ¯ 1 = Pr g 1 S 2 ϖ ¯ 1 g R S 2 ψ R δ 2 + η R 2 + η R S 2 + 1 ψ D 1 δ 1 ϖ ¯ 1 η D 1 2 + η D 1 S 2 = 0 1 F g 1 S 2 ϖ ¯ 1 x ψ R δ 2 + η R 2 + η R S 2 + 1 ψ D 1 δ 1 ϖ ¯ 1 η D 1 2 + η D 1 S 2 f g R S 2 x d x .
Based on (A1), Equation (A3) is further computed under the condition of δ 1 > ϖ ¯ 1 η D 1 2 + η D 1 S 2 . Then, K 2 is calculated as follows:
K 2 = 0 exp ϖ ¯ 1 x ψ R δ 2 + η R 2 + η R S 2 + 1 ψ D 1 κ g 1 S δ 1 ϖ ¯ 1 η D 1 2 + η D 1 S 2 1 κ g R S exp x κ g R S d x = 1 κ g R S exp ϖ ¯ 1 ψ D 1 κ g 1 S δ 1 ϖ ¯ 1 η D 1 2 + η D 1 S 2 × 0 exp ϖ ¯ 1 ψ R δ 2 + η R 2 + η R S 2 ψ D 1 κ g 1 S δ 1 ϖ ¯ 1 η D 1 2 + η D 1 S 2 + 1 κ g R S x d x = ψ D 1 κ g 1 S δ 1 ϖ ¯ 1 η D 1 2 + η D 1 S 2 ϖ ¯ 1 ψ R κ g R S δ 2 + η R 2 + η R S 2 + ψ D 1 κ g 1 S δ 1 ϖ ¯ 1 η D 1 2 + η D 1 S 2 × exp ϖ ¯ 1 ψ D 1 κ g 1 S δ 1 ϖ ¯ 1 η D 1 2 + η D 1 S 2 .
By substituting Equations (A2) and (A4) into Equation (15), Equation (16) is obtained. Hence, the proof is complete.

Appendix B

According to (17), K 3 can be formulated as
K 3 = Pr g 2 R 2 ω 2 ψ D 2 g 2 R 2 ψ D 2 η D 2 2 + η D 2 R 2 + g 1 R 2 ψ D 1 ω 1 + η D 1 2 + η D 1 R 2 + 1 ϖ ¯ 2 = Pr g 2 R 2 ϖ ¯ 2 g 1 R 2 ψ D 1 ω 1 + η D 1 2 + η D 1 R 2 + 1 ψ D 2 ω 2 ϖ ¯ 2 η D 2 2 + η D 2 R 2 .
To proceed with the calculation in Equation (A5), the condition ω 2 > ϖ ¯ 2 η D 2 2 + η D 2 R 2 must be satisfied and Equation (A1) must be considered. At this point, K 3 can be further calculated as follows:
K 3 = 0 1 F g 2 R 2 ϖ ¯ 2 x ψ D 1 ω 1 + η D 1 2 + η D 1 R 2 + 1 ψ D 2 ω 2 ϖ ¯ 2 η D 2 2 + η D 2 R 2 f g 1 R 2 x d x = 1 κ g 1 R exp ϖ ¯ 2 ψ D 2 κ g 2 R ω 2 ϖ ¯ 2 η D 2 2 + η D 2 R 2 × 0 exp ϖ ¯ 2 ψ D 1 ω 1 + η D 1 2 + η D 1 R 2 ψ D 2 κ g 2 R ω 2 ϖ ¯ 2 η D 2 2 + η D 2 R 2 + 1 κ g 1 R x d x = ψ D 2 κ g 2 R ω 2 ϖ ¯ 2 η D 2 2 + η D 2 R 2 ϖ ¯ 2 ψ D 1 κ g 1 R ω 1 + η D 1 2 + η D 1 R 2 + ψ D 2 κ g 2 R ω 2 ϖ ¯ 2 η D 2 2 + η D 2 R 2 × exp ϖ ¯ 2 ψ D 2 κ g 2 R ω 2 ϖ ¯ 2 η D 2 2 + η D 2 R 2 .
As per (17), K 4 may be expressed as
K 4 = Pr g R S 2 δ 2 ψ R g R S 2 ψ R η R 2 + η R S 2 + g 1 S 2 ψ D 1 η D 1 2 + η D 1 S 2 + 1 ϖ ¯ 2 = Pr g R S 2 ϖ ¯ 2 g 1 S 2 ψ D 1 η D 1 2 + η D 1 S 2 + 1 ψ R δ 2 ϖ ¯ 2 η R 2 + η R S 2 .
Similar to (A6), to proceed with the calculation in Equation (A7), the condition δ 2 > ϖ ¯ 2 η R 2 + η R S 2 must be satisfied and Equation (A1) must be considered. At this point, K 4 can be further calculated as follows:
K 4 = 0 1 F g R S 2 ϖ ¯ 2 x ψ D 1 η D 1 2 + η D 1 S 2 + 1 ψ R δ 2 ϖ ¯ 2 η R 2 + η R S 2 f g 1 S 2 x d x = 1 κ g 1 S exp ϖ ¯ 2 ψ R κ g R S δ 2 ϖ ¯ 2 η R 2 + η R S 2 × 0 exp ϖ ¯ 2 ψ D 1 η D 1 2 + η D 1 S 2 ψ R κ g R S δ 2 ϖ ¯ 2 η R 2 + η R S 2 + 1 κ g 1 S x d x = ψ R κ g R S δ 2 ϖ ¯ 2 η R 2 + η R S 2 ϖ ¯ 2 ψ D 1 κ g 1 S η D 1 2 + η D 1 S 2 + ψ R κ g R S δ 2 ϖ ¯ 2 η R 2 + η R S 2 × exp ϖ ¯ 2 ψ R κ g R S δ 2 ϖ ¯ 2 η R 2 + η R S 2 .
Substituting Equations (A6) and (A8) into (17), Equation (18) is obtained. Hence, the proof is complete.

Appendix C

From (19), it can be seen that there is a correlation between the variables γ D 1 B P 1 and γ D 1 E P 1 , making a precise analysis impossible. Therefore, the following upper limits are selected, γ D 1 B P 1 < g 1 S 2 ω 1 ψ D 1 η D 1 2 + η D 1 B 2 and γ D 1 E P 1 < g 1 E 2 ω 1 ψ E 2 , and focus on the study of the high-SNR regime []. O 1 can be written as
O 1 = Pr γ D 1 B P 1 ϖ ¯ 1 + ϖ 1 γ D 1 E P 1 Pr g 1 S 2 ϖ ¯ 1 + ϖ 1 g 1 E 2 ω 1 ψ E 2 η D 1 2 + η D 1 S 2 ω 1 ψ D 1 .
Based on (A1), O 1 is expressed as
O 1 0 1 F g 1 S 2 ϖ ¯ 1 + ϖ 1 ω 1 ψ E 2 x η D 1 2 + η D 1 S 2 ω 1 ψ D 1 f g 1 E 2 x d x exp ϖ ¯ 1 η D 1 2 + η D 1 S 2 ω 1 ψ D 1 κ g 1 S 1 κ g 1 E 0 exp ϖ 1 ω 1 ψ E 2 η D 1 2 + η D 1 S 2 ω 1 ψ D 1 κ g 1 S + 1 κ g 1 E x d x ω 1 ψ D 1 κ g 1 S ϖ 1 ω 1 ψ E 2 η D 1 2 + η D 1 S 2 κ g 1 E + ω 1 ψ D 1 κ g 1 S exp ϖ ¯ 1 η D 1 2 + η D 1 S 2 ω 1 ψ D 1 κ g 1 S .
From (19), an approximation is γ D 1 S P 2 < g 1 S 2 δ 1 ψ D 1 η D 1 2 + η D 1 S 2 , and γ D 1 E P 2 < g 1 E 2 δ 1 ψ E 1 . O 2 may be computed as
O 2 = Pr γ D 1 S P 2 ϖ ¯ 1 + ϖ 1 γ D 1 E P 2 Pr g 1 S 2 δ 1 ψ D 1 η D 1 2 + η D 1 S 2 ϖ ¯ 1 + ϖ 1 g 1 E 2 δ 1 ψ E 1 Pr g 1 S 2 ϖ ¯ 1 + ϖ 1 g 1 E 2 δ 1 ψ E 1 η D 1 2 + η D 1 S 2 δ 1 ψ D 1 .
Similarly to (A9) and based on (A1), O 2 is computed as follows:
O 2 0 1 F g 1 S 2 ϖ ¯ 1 + ϖ 1 δ 1 ψ E 1 x η D 1 2 + η D 1 S 2 δ 1 ψ D 1 f g 1 E 2 x d x δ 1 ψ D 1 κ g 1 S ϖ 1 δ 1 ψ E 1 η D 1 2 + η D 1 S 2 κ g 1 E + δ 1 ψ D 1 κ g 1 S exp ϖ ¯ 1 η D 1 2 + η D 1 S 2 δ 1 ψ D 1 κ g 1 S .
From (A10) and (A12) into (19), Equation (20) is obtained. Hence, the proof is complete.

Appendix D

From (21) and in analogy with (A9), an approximation is obtained as γ D 2 R P 1 < g 2 R 2 ω 2 ψ D 2 η D 2 2 + η D 2 R 2 , and γ D 2 E P 1 < g 2 E 2 ω 2 ψ E 2 . Then, O 3 is represented as
O 3 = Pr γ D 2 R P 1 ϖ ¯ 2 + ϖ 2 γ D 2 E P 1 Pr g 2 R 2 ϖ ¯ 2 + ϖ 2 g 2 E 2 ω 2 ψ E 2 η D 2 2 + η D 2 R 2 ω 2 ψ D 2 0 1 F g 2 R 2 ϖ ¯ 2 + ϖ 2 ω 2 ψ E 2 x η D 2 2 + η D 2 R 2 ω 2 ψ D 2 f g 2 E 2 x d x 1 κ g 2 E exp ϖ ¯ 2 η D 2 2 + η D 2 R 2 ω 2 ψ D 2 κ g 2 R 0 exp ϖ 2 ω 2 ψ E 2 η D 2 2 + η D 2 R 2 ω 2 ψ D 2 κ g 2 R + 1 κ g 2 E x d x ω 2 ψ D 2 κ g 2 R ϖ 2 ω 2 ψ E 2 η D 2 2 + η D 2 R 2 κ g 2 E + ω 2 ψ D 2 κ g 2 R exp ϖ ¯ 2 η D 2 2 + η D 2 R 2 ω 2 ψ D 2 κ g 2 R .
Next, similarly to (A13), the expression is approximated γ D 2 S P 2 < g R S 2 δ 2 ψ R η R 2 + η R S 2 , and γ D 2 E P 2 < g R E 2 δ 2 ψ R E . O 4 is written as
O 4 = Pr γ D 2 S P 2 ϖ ¯ 2 + ϖ 2 γ D 2 E P 2 Pr g R S 2 ϖ ¯ 2 + ϖ 2 g R E 2 δ 2 ψ R E η R 2 + η R S 2 δ 2 ψ R 0 1 F g R S 2 ϖ ¯ 2 + ϖ 2 δ 2 ψ R E x η R 2 + η R S 2 δ 2 ψ R f g R E 2 x d x 1 κ g R E exp ϖ ¯ 2 η R 2 + η R S 2 δ 2 ψ R κ g R S 0 exp ϖ 2 δ 2 ψ R E η R 2 + η R S 2 δ 2 ψ R κ g R S + 1 κ g R E x d x δ 2 ψ R κ g R S ϖ 2 δ 2 ψ R E η R 2 + η R S 2 κ g R E + δ 2 ψ R κ g R S exp ϖ ¯ 2 η R 2 + η R S 2 δ 2 ψ R κ g R S .
From (A13) and (A14) into (21), Equation (22) is obtained. Hence, the proof is complete.

Appendix E

As indicated in Equation (23), M 1 can be calculated as follows:
M 1 = Pr g 1 E 2 ω 1 ψ E 2 g 1 E 2 ψ E 1 η D 1 2 + η D 1 E 2 + g 2 E 2 ψ E 2 η D 2 2 + η D 2 E 2 + 1 ϖ ¯ 1 = Pr g 1 E 2 ϖ ¯ 1 g 2 E 2 ψ E 2 η D 2 2 + η D 2 E 2 + 1 ω 1 ψ E 2 ϖ ¯ 1 ψ E 1 η D 1 2 + η D 1 E 2 .
To proceed with the calculation in Equation (A15), the condition ω 1 ψ E 2 > ϖ ¯ 1 ψ E 1 η D 1 2 + η D 1 E 2 must be satisfied and Equation (A1) must be considered. At this point, M 1 can be further calculated as follows:
M 1 = 0 1 F g 1 E 2 ϖ ¯ 1 x ψ E 2 η D 2 2 + η D 2 E 2 + 1 ω 1 ψ E 2 ϖ ¯ 1 ψ E 1 η D 1 2 + η D 1 E 2 f g 2 E 2 x d x = 1 κ g 2 E exp ϖ ¯ 1 ω 1 ψ E 2 ϖ ¯ 1 ψ E 1 η D 1 2 + η D 1 E 2 κ g 1 E × 0 exp ϖ ¯ 1 ψ E 2 η D 2 2 + η D 2 E 2 ω 1 ψ E 2 ϖ ¯ 1 ψ E 1 η D 1 2 + η D 1 E 2 κ g 1 E + 1 κ g 2 E x d x = ω 1 ψ E 2 ϖ ¯ 1 ψ E 1 η D 1 2 + η D 1 E 2 κ g 1 E ϖ ¯ 1 ψ E 2 κ g 2 E η D 2 2 + η D 2 E 2 + ω 1 ψ E 2 ϖ ¯ 1 ψ E 1 η D 1 2 + η D 1 E 2 κ g 1 E × exp ϖ ¯ 1 ω 1 ψ E 2 ϖ ¯ 1 ψ E 1 η D 1 2 + η D 1 E 2 κ g 1 E .
Based on (23), O 1 is expressed as
M 2 = Pr g 1 E 2 δ 1 ψ E 1 g 1 E 2 ψ E 1 η D 1 2 + η D 1 E 2 + g R E 2 ψ R E δ 2 + η R 2 + η R E 2 + 1 ϖ ¯ 1 = Pr g 1 E 2 ϖ ¯ 1 g R E 2 ψ R E δ 2 + η R 2 + η R E 2 + 1 ψ E 1 δ 1 ϖ ¯ 1 η D 1 2 + η D 1 E 2 .
Similar to (A16), to proceed with the calculation in Equation (A17), the condition δ 1 > ϖ ¯ 1 η D 1 2 + η D 1 E 2 must be satisfied and Equation (A1) must be considered. At this point, M 2 can be further calculated as follows:
M 2 = 0 1 F g 1 E 2 ϖ ¯ 1 x ψ R E δ 2 + η R 2 + η R E 2 + 1 ψ E 1 δ 1 ϖ ¯ 1 η D 1 2 + η D 1 E 2 f g R E 2 x d x = 1 κ g R E exp ϖ ¯ 1 ψ E 1 κ g 1 E δ 1 ϖ ¯ 1 η D 1 2 + η D 1 E 2 × 0 exp ϖ ¯ 1 ψ R E δ 2 + η R 2 + η R E 2 ψ E 1 κ g 1 E δ 1 ϖ ¯ 1 η D 1 2 + η D 1 E 2 + 1 κ g R E x d x = ψ E 1 κ g 1 E δ 1 ϖ ¯ 1 η D 1 2 + η D 1 E 2 ϖ ¯ 1 ψ R E κ g R E δ 2 + η R 2 + η R E 2 + ψ E 1 κ g 1 E δ 1 ϖ ¯ 1 η D 1 2 + η D 1 E 2 × exp ϖ ¯ 1 ψ E 1 κ g 1 E δ 1 ϖ ¯ 1 η D 1 2 + η D 1 E 2 .
From (A16) and (A18) into (23), Equation (24) is obtained. Hence, the proof is complete.

Appendix F

As indicated in Equation (25), M 3 can be calculated as follows:
M 3 = Pr g 2 E 2 ω 2 ψ E 2 g 2 E 2 ψ E 2 η D 2 2 + η D 2 E 2 + g 1 E 2 ψ E 1 ω 1 + η D 1 2 + η D 1 E 2 + 1 ϖ ¯ 2 = Pr g 2 E 2 ϖ ¯ 2 g 1 E 2 ψ E 1 ω 1 + η D 1 2 + η D 1 E 2 + 1 ψ E 2 ω 2 ϖ ¯ 2 η D 2 2 + η D 2 E 2 .
To proceed with the calculation in Equation (A19), the condition ω 2 > ϖ ¯ 2 η D 2 2 + η D 2 E 2 must be satisfied and Equation (A1) must be considered. At this point, M 3 can be further calculated as follows:
M 3 = 0 1 F g 2 E 2 ϖ ¯ 2 x ψ E 1 ω 1 + η D 1 2 + η D 1 E 2 + 1 ψ E 2 ω 2 ϖ ¯ 2 η D 2 2 + η D 2 E 2 f g 1 E 2 x d x = 1 κ g 1 E exp ϖ ¯ 2 ψ E 2 κ g 2 E ω 2 ϖ ¯ 2 η D 2 2 + η D 2 E 2 × 0 exp ϖ ¯ 2 ψ E 1 ω 1 + η D 1 2 + η D 1 E 2 ψ E 2 κ g 2 E ω 2 ϖ ¯ 2 η D 2 2 + η D 2 E 2 + 1 κ g 1 E x d x = ψ E 2 κ g 2 E ω 2 ϖ ¯ 2 η D 2 2 + η D 2 E 2 ϖ ¯ 2 ψ E 1 κ g 1 E ω 1 + η D 1 2 + η D 1 E 2 + ψ E 2 κ g 2 E ω 2 ϖ ¯ 2 η D 2 2 + η D 2 E 2 × exp ϖ ¯ 2 ψ E 2 κ g 2 E ω 2 ϖ ¯ 2 η D 2 2 + η D 2 E 2 .
Based on (25), M 4 is expressed as
M 4 = Pr g R E 2 δ 2 ψ R E g R E 2 ψ R E η R 2 + η R E 2 + g 1 E 2 ψ E 1 η D 1 2 + η D 1 E 2 + 1 ϖ ¯ 2 = Pr g R E 2 ϖ ¯ 2 g 1 E 2 ψ E 1 η D 1 2 + η D 1 E 2 + 1 ψ R E δ 2 ϖ ¯ 2 η R 2 + η R E 2 .
Similar to (A20), to proceed with the calculation in Equation (A17), the condition δ 1 > ϖ ¯ 1 η D 1 2 + η D 1 E 2 must be satisfied and Equation (A1) must be considered. At this point, M 4 can be further calculated as follows:
M 4 = 0 1 F g R E 2 ϖ ¯ 2 x ψ E 1 η D 1 2 + η D 1 E 2 + 1 ψ R E δ 2 ϖ ¯ 2 η R 2 + η R E 2 f g 1 E 2 x d x = 1 κ g 1 E exp ϖ ¯ 2 ψ R E κ g R E δ 2 ϖ ¯ 2 η R 2 + η R E 2 × 0 exp ϖ ¯ 2 ψ E 1 η D 1 2 + η D 1 E 2 ψ R E κ g R E δ 2 ϖ ¯ 2 η R 2 + η R E 2 + 1 κ g 1 E x d x = ψ R E κ g R E δ 2 ϖ ¯ 2 η R 2 + η R E 2 ϖ ¯ 2 ψ E 1 κ g 1 E η D 1 2 + η D 1 E 2 + ψ R E κ g R E δ 2 ϖ ¯ 2 η R 2 + η R E 2 × exp ϖ ¯ 2 ψ R E κ g R E δ 2 ϖ ¯ 2 η R 2 + η R E 2 .
From (A20) and (A22) into (25), Equation (26) is obtained. Hence, the proof is complete.

Appendix G

As derived from Equation (30), the expression for C O P D 1 S 2 can be formulated as follows:
C O P D 1 S 2 = 1 Pr g 1 S 2 ω 1 ψ D 1 g 1 S 2 ψ D 1 η D 1 2 + η D 1 S 2 + g 2 S 2 ψ D 2 ω 2 + η D 2 2 + η D 2 S 2 + 1 ϖ ¯ 1 S 2 = 1 Pr g 1 S 2 ϖ ¯ 1 S 2 g 2 S 2 ψ D 2 ω 2 + η D 2 2 + η D 2 S 2 + 1 ψ D 1 ω 1 ϖ ¯ 1 S 2 η D 1 2 + η D 1 S 2 .
Based on (A1), C O P D 1 S 2 can be further calculated as follows:
C O P D 1 S 2 = 1 0 1 F g 1 S 2 ϖ ¯ 1 S 2 x ψ D 2 ω 2 + η D 2 2 + η D 2 S 2 + 1 ψ D 1 ω 1 ϖ ¯ 1 S 2 η D 1 2 + η D 1 S 2 f g 2 S 2 x d x = 1 1 κ g 2 S exp ϖ ¯ 1 S 2 ψ D 1 κ g 1 S ω 1 ϖ ¯ 1 S 2 η D 1 2 + η D 1 S 2 × 0 exp ϖ ¯ 1 S 2 ψ D 2 ω 2 + η D 2 2 + η D 2 S 2 ψ D 1 κ g 1 S ω 1 ϖ ¯ 1 S 2 η D 1 2 + η D 1 S 2 + 1 κ g 2 S x d x = 1 ψ D 1 κ g 1 S ω 1 ϖ ¯ 1 S 2 η D 1 2 + η D 1 S 2 ϖ ¯ 1 S 2 ψ D 2 κ g 2 S ω 2 + η D 2 2 + η D 2 S 2 + ψ D 1 κ g 1 S ω 1 ϖ ¯ 1 S 2 η D 1 2 + η D 1 S 2 × exp ϖ ¯ 1 S 2 ψ D 1 κ g 1 S ω 1 ϖ ¯ 1 S 2 η D 1 2 + η D 1 S 2 .
The proof is complete.

Appendix H

Based on the derivation from Equation (32), the expression for C O P D 2 S 2 can be articulated as follows:
C O P D 2 S 2 = 1 Pr g 2 S 2 ω 2 ψ D 2 g 1 S 2 ψ D 1 η D 1 2 + η D 1 S 2 + g 2 S 2 ψ D 2 η D 2 2 + η D 2 S 2 + 1 ϖ ¯ 2 S 2 = 1 Pr g 2 S 2 ϖ ¯ 2 S 2 g 1 S 2 ψ D 1 η D 1 2 + η D 1 S 2 + 1 ψ D 2 ω 2 ϖ ¯ 2 S 2 η D 2 2 + η D 2 S 2 .
According to (A1), the calculation of C O P D 2 S 2 can be further elaborated as follows:
C O P D 2 S 2 = 1 0 1 F g 2 S 2 ϖ ¯ 2 S 2 x ψ D 1 η D 1 2 + η D 1 S 2 + 1 ψ D 2 ω 2 ϖ ¯ 2 S 2 η D 2 2 + η D 2 S 2 f g 1 S 2 x d x = 1 1 κ g 1 S exp ϖ ¯ 2 S 2 ψ D 2 κ g 2 S ω 2 ϖ ¯ 2 S 2 η D 2 2 + η D 2 S 2 × 0 exp ϖ ¯ 2 S 2 ψ D 1 η D 1 2 + η D 1 S 2 ψ D 2 κ g 2 S ω 2 ϖ ¯ 2 S 2 η D 2 2 + η D 2 S 2 + 1 κ g 1 S x d x = 1 ψ D 2 κ g 2 S ω 2 ϖ ¯ 2 S 2 η D 2 2 + η D 2 S 2 ϖ ¯ 2 S 2 ψ D 1 κ g 1 S η D 1 2 + η D 1 S 2 + ψ D 2 κ g 2 S ω 2 ϖ ¯ 2 S 2 η D 2 2 + η D 2 S 2 × exp ϖ ¯ 2 S 2 ψ D 2 κ g 2 S ω 2 ϖ ¯ 2 S 2 η D 2 2 + η D 2 S 2 .
The proof is complete.

References

  1. Mead, J.A.; Singh, K.; Allu, R.; Biswas, S.; Ku, M.L. Hardware Impairment Aware Transmit Power Minimization for Secure RIS-Aided Full-Duplex NOMA Communications. IEEE Trans. Green Commun. Netw. 2024, 9, 1153–1166. [Google Scholar] [CrossRef]
  2. Ali, K.S.; Al-Dweik, A.; Hossain, E.; Chafii, M. Physical Layer Security of Partial-NOMA and NOMA in Poisson Networks. IEEE Trans. Wirel. Commun. 2024, 23, 6562–6579. [Google Scholar] [CrossRef]
  3. Zhang, H.; Jin, M.; Guo, Q.; Yao, J. Secure Beamforming for NOMA-ISAC with Multicast and Unicast Communications. IEEE Wirel. Commun. Lett. 2024, 13, 2927–2931. [Google Scholar] [CrossRef]
  4. Hao, W.; Zeng, M.; Chu, Z.; Yang, S. Energy-Efficient Power Allocation in Millimeter Wave Massive MIMO With Non-Orthogonal Multiple Access. IEEE Wirel. Commun. Lett. 2017, 6, 782–785. [Google Scholar] [CrossRef]
  5. Dai, L.; Wang, B.; Yuan, Y.; Han, S.; Chih-lin, I.; Wang, Z. Non-orthogonal multiple access for 5G: Solutions, challenges, opportunities, and future research trends. IEEE Commun. Mag. 2015, 53, 74–81. [Google Scholar] [CrossRef]
  6. Van Nguyen, M.S.; Do, D.T.; Al-Rubaye, S.; Mumtaz, S.; Al-Dulaimi, A.; Dobre, O.A. Exploiting Impacts of Antenna Selection and Energy Harvesting for Massive Network Connectivity. IEEE Trans. Commun. 2021, 69, 7587–7602. [Google Scholar] [CrossRef]
  7. Tin, P.T.; Huy, P.V.; Thanh, L.V.; Nguyen, M.S.V. Analyzing Performance of NOMA Cooperative Networks with Reconfigurable Intelligent Surfaces in Cognitive Radio Networks. In Proceedings of the AETA 2023—Recent Advances in Electrical Engineering and Related Sciences: Theory and Application, Busan, Republic of Korea, 14–16 December 2023; Trong Dao, T., Zelinka, I., Hoang Duy, V., Wang, J.P., Dong, C.S.T., Tran, P.T., Eds.; Springer: Singapore, 2025; pp. 109–119. [Google Scholar]
  8. Van Nguyen, M.S.; Do, D.T.; Vahid, A.; Muhaidat, S.; Sicker, D. Enhancing NOMA Backscatter IoT Communications With RIS. IEEE Internet Things J. 2024, 11, 5604–5622. [Google Scholar] [CrossRef]
  9. Asif, M.; Bao, X.; Ihsan, A.; Khan, W.U.; Ahmed, M.; Li, X. Securing NOMA 6G Communications Leveraging Intelligent Omni-Surfaces Under Residual Hardware Impairments. IEEE Internet Things J. 2024, 11, 25326–25336. [Google Scholar] [CrossRef]
  10. Le, A.T.; Tran, D.H.; Le, C.B.; Tin, P.T.; Nguyen, T.N.; Ding, Z.; Poor, H.V.; Voznak, M. Power Beacon and NOMA-Assisted Cooperative IoT Networks With Co-Channel Interference: Performance Analysis and Deep Learning Evaluation. IEEE Trans. Mob. Comput. 2024, 23, 7270–7283. [Google Scholar] [CrossRef]
  11. Ju, Y.; Cao, Z.; Chen, Y.; Liu, L.; Pei, Q.; Mumtaz, S.; Dong, M.; Guizani, M. NOMA-Assisted Secure Offloading for Vehicular Edge Computing Networks With Asynchronous Deep Reinforcement Learning. IEEE Trans. Intell. Transp. Syst. 2024, 25, 2627–2640. [Google Scholar] [CrossRef]
  12. Zhou, T.; Fu, Y.; Qin, D.; Nie, X.; Jiang, N.; Li, C. Secure and Multistep Computation Offloading and Resource Allocation in Ultradense Multitask NOMA-Enabled IoT Networks. IEEE Internet Things J. 2024, 11, 5347–5361. [Google Scholar] [CrossRef]
  13. Björnson, E.; Hoydis, J.; Kountouris, M.; Debbah, M. Massive MIMO Systems With Non-Ideal Hardware: Energy Efficiency, Estimation, and Capacity Limits. IEEE Trans. Inf. Theory 2014, 60, 7112–7139. [Google Scholar] [CrossRef]
  14. Dang, H.P.; Van Nguyen, M.S.; Do, D.T.; Pham, H.L.; Selim, B.; Kaddoum, G. Joint Relay Selection, Full-Duplex and Device-to-Device Transmission in Wireless Powered NOMA Networks. IEEE Access 2020, 8, 82442–82460. [Google Scholar] [CrossRef]
  15. Li, M.; Selim, B.; Muhaidat, S.; Sofotasios, P.C.; Dianati, M.; Yoo, P.D.; Liang, J.; Wang, A. Effects of Residual Hardware Impairments on Secure NOMA-Based Cooperative Systems. IEEE Access 2020, 8, 2524–2536. [Google Scholar] [CrossRef]
  16. AlaaEldin, M.; Alsusa, E.; Al-Jarrah, M.; Seddik, K.G.; Matthaiou, M. Generalized BER Performance Analysis for SIC-Based Uplink NOMA. IEEE Open J. Commun. Soc. 2025, 6, 1246–1265. [Google Scholar] [CrossRef]
  17. Sa, S.K.; Mishra, A.K. Enhancing MEC Offloading Performance with NOMA-CDRT in the Presence of Impaired Hardware. IEEE Access 2024, 12, 98803–98815. [Google Scholar] [CrossRef]
  18. Al-Musawi, I.M.; Al-Hussaibi, W.A.; Ali, F.H. Efficient Secure NOMA Schemes Based on Chaotic Physical Layer Security for Wireless Networks. IEEE Open J. Commun. Soc. 2022, 3, 2425–2443. [Google Scholar] [CrossRef]
  19. Nguyen, M.S.V.; Do, D.T.; Afghah, F.; Islam, S.M.R.; Le, A.T. Exploiting Secrecy Performance of Uplink NOMA in Cellular Networks. IEEE Access 2021, 9, 95135–95154. [Google Scholar] [CrossRef]
  20. Van Nguyen, M.S.; Do, D.T. Evaluating secrecy performance of cooperative NOMA networks under existence of relay link and direct link. Int. J. Commun. Syst. 2020, 33, e4284. [Google Scholar] [CrossRef]
  21. Li, X.; Zhao, M.; Zeng, M.; Mumtaz, S.; Menon, V.G.; Ding, Z.; Dobre, O.A. Hardware Impaired Ambient Backscatter NOMA Systems: Reliability and Security. IEEE Trans. Commun. 2021, 69, 2723–2736. [Google Scholar] [CrossRef]
  22. Chen, J.; Yang, L.; Alouini, M.S. Physical Layer Security for Cooperative NOMA Systems. IEEE Trans. Veh. Technol. 2018, 67, 4645–4649. [Google Scholar] [CrossRef]
  23. Deng, C.; Liu, M.; Li, X.; Liu, Y. Hardware Impairments Aware Full-Duplex NOMA Networks Over Rician Fading Channels. IEEE Syst. J. 2021, 15, 2515–2518. [Google Scholar] [CrossRef]
  24. Tin, P.T.; Minh Nam, P.; Trung Duy, T.; Tran, P.T.; Voznak, M. Secrecy Performance of TAS/SC-Based Multi-Hop Harvest-to-Transmit Cognitive WSNs Under Joint Constraint of Interference and Hardware Imperfection. Sensors 2019, 19, 1160. [Google Scholar] [CrossRef] [PubMed]
  25. Wu, W.; Zhou, F.; Hu, R.Q.; Wang, B. Energy-Efficient Resource Allocation for Secure NOMA-Enabled Mobile Edge Computing Networks. IEEE Trans. Commun. 2020, 68, 493–505. [Google Scholar] [CrossRef]
  26. He, X.; Jin, R.; Dai, H. Physical-Layer Assisted Secure Offloading in Mobile-Edge Computing. IEEE Trans. Wirel. Commun. 2020, 19, 4054–4066. [Google Scholar] [CrossRef]
  27. Van Nguyen, M.S.; Do, D.T.; Tin, P.T.; Vahid, A. Secure Performance Analysis of User Pairs in Active Reconfigurable Intelligent Surface-Aided IoT Systems. IEEE Syst. J. 2025, 19, 370–381. [Google Scholar] [CrossRef]
  28. Ju, Y.; Zou, G.; Bai, H.; Liu, L.; Pei, Q.; Wu, C.; Otaibi, S.A. Random Beam Switching: A Physical Layer Key Generation Approach to Safeguard mmWave Electronic Devices. IEEE Trans. Consum. Electron. 2023, 69, 594–607. [Google Scholar] [CrossRef]
  29. Zhou, J.; Dong, X.; Cao, Z.; Vasilakos, A.V. Secure and Privacy Preserving Protocol for Cloud-Based Vehicular DTNs. IEEE Trans. Inf. Forensics Secur. 2015, 10, 1299–1314. [Google Scholar] [CrossRef]
  30. Bloch, M.; Barros, J.; Rodrigues, M.R.D.; McLaughlin, S.W. Wireless Information-Theoretic Security. IEEE Trans. Inf. Theory 2008, 54, 2515–2534. [Google Scholar] [CrossRef]
  31. Kader, M.F.; Shin, S.Y. Coordinated Direct and Relay Transmission Using Uplink NOMA. IEEE Wirel. Commun. Lett. 2018, 7, 400–403. [Google Scholar] [CrossRef]
  32. Tin, P.T.; Luan, N.T.; Nguyen, T.N.; Tran, M.; Duy, T.T. Throughput enhancement for multi-hop decode-and-forward protocol using interference cancellation with hardware imperfection. Alex. Eng. J. 2022, 61, 5837–5849. [Google Scholar] [CrossRef]
  33. Tin, P.T.; Nguyen, M.S.V.; Duy, T.T.; Huy, P.V.; Thanh, L.V.; Kim, B.S. Performance and Secrecy Analysis of Cooperative Full-Duplex NOMA System with Fountain Codes and Intelligent Reflective Surface. IEEE Access 2025, 13, 113089–113112. [Google Scholar] [CrossRef]
  34. Van Nguyen, M.S.; Do, D.T.; Phan, V.D.; Ullah Khan, W.; Imoize, A.L.; Fouda, M.M. Ergodic Performance Analysis of Double Intelligent Reflecting Surfaces-Aided NOMA–UAV Systems with Hardware Impairment. Drones 2022, 6, 408. [Google Scholar] [CrossRef]
  35. Nguyen, M.S.V.; Dang, H.P. Exploiting Performance of Ambient Backscatter Systems in Presence of Hardware Impairment. Adv. Electr. Electron. Eng. 2021, 19, 313–321. [Google Scholar] [CrossRef]
  36. Tran Tin, P.; Phan, V.D.; Si Thien Chau, D.; Nguyen, T.N.; Nguyen, P.X. Performance Analysis in DF Energy Harvesting Full-Duplex Relaying Network with MRC and SC at the Receiver under Impact of Eavesdropper. J. Electr. Comput. Eng. 2021, 2021, 5547658. [Google Scholar] [CrossRef]
  37. Tung, N.T.; Nam, P.M.; Tin, P.T. Performance evaluation of a two-way relay network with energy harvesting and hardware noises. Digit. Commun. Netw. 2021, 7, 45–54. [Google Scholar] [CrossRef]
  38. Tin, P.T.; Duy, T.T. Power allocation strategies for dual-hop relay protocols with best relay selection under constraint of intercept probability. ICT Express 2019, 5, 52–55. [Google Scholar] [CrossRef]
  39. Van Nguyen, M.-S.; Do, D.-T.; Tin, P.T.; Imoize, A.L.; Kumaravelu, V.B. Full duplex reconfigurable intelligent surfaces system relying on NOMA and wireless power transfer. Wirel. Netw. 2024, 30, 2127–2142. [Google Scholar] [CrossRef]
  40. Tin, P.T.; Dinh, B.H.; Nguyen, T.N.; Ha, D.H.; Trang, T.T. Power Beacon-Assisted Energy Harvesting Wireless Physical Layer Cooperative Relaying Networks: Performance Analysis. Symmetry 2020, 12, 106. [Google Scholar] [CrossRef]
  41. Tin, P.T.; Van Nguyen, M.S.; Duy, T.T.; Pham, V.H.; Kim, B.S. Combination of RIS and Fountain Codes in NOMA relay wireless networks for enhancing system performance and security. ICT Express 2025, 11, 909–913. [Google Scholar] [CrossRef]
  42. Tin, P.T.; Nguyen, M.S.V.; Bui, Q.A.; Imoize, A.L.; Kim, B.S. System Modeling and Deep Learning-Based Security Analysis of Uplink NOMA Relay Networks with IRS and Fountain Codes. Comput. Model. Eng. Sci. 2025, 144, 2521–2543. [Google Scholar] [CrossRef]
  43. Tin, P.T.; Nguyen, M.S.V.; Tran, D.H.; Nguyen, C.T.; Chatzinotas, S.; Ding, Z.; Voznak, M. Performance Analysis of User Pairing for Active RIS-Enabled Cooperative NOMA in 6G Cognitive Radio Networks. IEEE Internet Things J. 2024, 11, 37675–37692. [Google Scholar] [CrossRef]
  44. Yue, X.; Liu, Y.; Kang, S.; Nallanathan, A.; Ding, Z. Exploiting Full/Half-Duplex User Relaying in NOMA Systems. IEEE Trans. Commun. 2018, 66, 560–575. [Google Scholar] [CrossRef]
  45. Guo, K.; Zhang, B.; Huang, Y.; Guo, D. Outage Analysis of Multi-Relay Networks With Hardware Impairments Using SECps Scheduling Scheme in Shadowed-Rician Channel. IEEE Access 2017, 5, 5113–5120. [Google Scholar] [CrossRef]
  46. Tran Tin, P.; van Nguyen, M.S.; Trung Duy, T.; Vu Minh, B.; Kim, B.S.; Rejfek, L. Enhancing Secrecy Performance Using Fountain Codes and NOMA Under Joint Cooperative Jamming Technique and Intelligent Reflective Surface. IEEE Access 2024, 12, 117399–117417. [Google Scholar] [CrossRef]
Disclaimer/Publisher’s Note: The statements, opinions and data contained in all publications are solely those of the individual author(s) and contributor(s) and not of MDPI and/or the editor(s). MDPI and/or the editor(s) disclaim responsibility for any injury to people or property resulting from any ideas, methods, instructions or products referred to in the content.

Article Metrics

Citations

Article Access Statistics

Multiple requests from the same IP address are counted as one view.