Article

Proposal of a Framework for Evaluating the Importance of Production and Maintenance Integration Supported by the Use of Ordinal Linguistic Fuzzy Modeling

by
Ronald Díaz Cazañas
1,
Daynier Rolando Delgado Sobrino
2,*,
Estrella María De La Paz Martínez
1,
Jana Petru
3 and
Carlos Daniel Díaz Tejeda
1
1
Faculty of Mechanical and Industrial Engineering, Central University “Marta Abreu” de Las Villas, 51/2 Km Camajuaní Road, Santa Clara 54830, Cuba
2
Faculty of Materials Science and Technology in Trnava, Institute of Production Technologies, Slovak University of Technology in Bratislava, 917 24 Trnava, Slovakia
3
Faculty of Mechanical Engineering, VSB—Technical University of Ostrava, 70800 Ostrava, Czech Republic
*
Author to whom correspondence should be addressed.
Mathematics 2024, 12(2), 338; https://doi.org/10.3390/math12020338
Submission received: 19 December 2023 / Revised: 14 January 2024 / Accepted: 18 January 2024 / Published: 19 January 2024

Abstract

:
Over the years, the integration of Production Management and Maintenance Management has gained significant attention from the scientific community due to its benefits for the company. When searching through the states of the art and practice, it is possible to understand that one of the main challenges for the integration is the lack of systematic, methodological, and scientific approaches and evaluation systems that lead companies into a successful implementation and a clear understanding of the benefits and drawbacks of the process. This paper introduces an original framework that conducts the processes of evaluation, weighting, and aggregation of set of novel indicators proposed by the authors. The main output of the proposal is an integral index that allows us to qualify, in a linguistic domain, the importance of the Production and Maintenance Management integration. At the same time, the proposed framework includes a methodology to evaluate the consensus of the experts, based on the use of linguistic terms with a membership function of the triangular type, which attempts to overcome some deficiencies of previous models identified by the authors in a detailed and complex analysis of the scientific literature. The proposed framework is applied in a plant of the Cuban mechanical industry. The results of this application are clearly presented and discussed, allowing us to verify and validate the proposal while also contributing to its ease of understanding and ultimately to the successful integration of the production and maintenance tasks in the given company.

1. Introduction

The success of any company requires an adequate level of integration between its systems and/or subsystems and processes. A particular case is the integration between the Production Management (PM) and Maintenance Management (MM) processes, given the potential benefits achieved in terms of cost reduction, increased availability, and performance when both subsystems fit and are managed with the required synergy [1,2,3,4,5,6].
In this sense the authors in [7] stated that some manufacturing objectives, such as inventory reduction, improved equipment reliability, increased productivity and quality, have led maintenance managers to operate proactively, coordinating their activities with the production function.
Similarly, authors like the ones in [8,9,10] pointed out that the MM and manufacturing strategy integration is vital to the same MM performance, which allows ensuring of the availability of the equipment, product quality, deliveries on time, and competitive prices. The work presented in [11] also states that the concept of maintenance must be reviewed periodically to take into account changes in the system and its environment; while the authors in [12] recognize that the perspective of the maintenance function will change depending on its interaction with the company, and thus the researchers and practitioners often have to deal with maintenance concept variations from one organization to another, and with the lack of a global solution easily adjustable to each case study.
At the same time, it is fair to say that the need to achieve an adequate level of integration between PM and MM may be more or less significant, depending on factors related to the design characteristics of the production subsystem and the effectiveness of the maintenance subsystem. In this regard, authors like the ones in [13,14] highlight that, in companies with a high component of labor and poorly integrated processes, the inverse nature of the Production and Maintenance functions (the operators use the equipment for producing and it has to be running while maintainers use it for restoring its condition while this usually has to be switched off) does not necessarily constitute a key issue given that the bottlenecks are not necessarily found on the machines. On the other hand, in complex industrial or service systems, in which there is significant automation and integration of processes such as, for example, in the automotive industry in Europe, the situation of the reverse activities of production and maintenance operators (operators require that equipment is upon on state, available for producing, meanwhile maintenance staff generally use it upon off mode for its restoring) is an increasingly important issue to take into account. In consequence, the need to adopt proactive maintenance policies and computer-assisted Maintenance Management systems is greater in large companies, with continuous production processes and high costs due to stoppages, but usually not in the case of small companies with process-oriented production flows. Similarly, the need to achieve integrated maintenance is more significant in those companies that wish to maintain control of their processes and flexibility at competitive levels.
Concerning this topic, the author in [15] points out that there are relationships between production technology and maintenance practices whose strength varies according to the complexity of each production environment. Similarly, the researchers in [11,16] also emphasize that the problem lies in the fact that companies with different competitive priorities just follow different maintenance strategies. The authors of this paper have no option but to identify themselves with both of the previous statements given that they see undeniable truth in both of them.
Despite all of this evidence on the importance, need, and benefits of PM—MM integration, there are only a few relevant studies in the states of the art and practice covering the topic from a perspective similar to the one pursued with this research. Even when none of these works has presented a clear method specifically designed to assess the importance of PM—MM integration within the company, it is still highly valuable, convenient, and necessary to examine their findings and conclusions in order to support a goal of this paper that lies in the proposal of a set of indicators leading to an index capable of evaluating the importance of PM—MM integration in a given company.
Based on this knowledge and partial conclusions, it is particularly important to mention an empiric research presented by [14], where the author focused on demonstrating that, when implementing a PM—MM integration strategy, companies had higher possibilities of obtaining a better overall performance. In addition, in this study, it was also concluded that the effects of maintenance approaches on the operational performance differed according to the given context or production instance. This author also analyzed the integration of maintenance within manufacturing from the perspective of two variables, i.e., hard integration and soft integration. The first of these referred to the technological support and computer-aided Maintenance Management systems that facilitate integration, while the second referred to the integration from the perspective of the relationships established in the organizational structure, including human resources. His study covered a sample of 253 companies representative of the manufacturing sector in Sweden, and included indicators of the main maintenance dimensions, production context factors, and operational performance. Also, from a cluster analysis, three groups of companies were identified based on the type of maintenance strategy adopted. Those groups of companies differed in terms of size, process technology, and orientation of the manufacturing strategy.
A similar research approach was adopted by [15] to infer information about the relationship and correlation between production technology and the use of maintenance practices. The study revealed a significant and positive correlation between the decentralization of the maintenance workforce, with the technical complexity and interdependence between the stages of the production process. At the same time, the technical complexity also manifested a significant and positive correlation with the training and use of a professional maintenance staff, and a significant and negative correlation with the involvement of operators in maintenance tasks. No significant correlation was found between production technology and preventive maintenance practices, nor between the latter and technical variety.
In the case of [7], the authors developed a model to study the influence of the integration between maintenance policy and aggregate production planning over the total cost reduction. The study focused on three important elements, all of them related to cost impacts. Firstly, the integration of the maintenance policy with the aggregate planning of the production led to a reduction in the total cost. In addition, the effectiveness of the integration between production planning and maintenance planning proved to be more significant in productive environments where the financial consequences of failures were greater. Finally, the study also demonstrated that, when the maintenance cost increased in relation to the production cost, the savings associated with integration decreased as well.
Similarly, in [17], the authors developed a structural equation model to evaluate the relationship between the Total Productive Maintenance (TPM) philosophy and manufacturing performance (MP). As for the TPM, this was measured through variables related to autonomous maintenance and planned maintenance practices, while in the case of MP, it was measured using variables such as cost, quality, deliveries, and flexibility. After the implementation of the model, it was concluded that TPM had a significant and positive correlation with the variables that make up the MP construct.
In the case of [18], a framework to characterize the complexity presented in the MM within a productive environment was developed. The authors identified and made use of the following factors: availability of data and automated Maintenance Management systems, complexity and variety of manufacturing technologies, level of automation and integration of the process, Production Management system, level of knowledge of operators about the process, technology and maintenance, and the experience of maintenance personnel. Subsequently, in order to obtain an index able to reflect the complexity of MM in the company, a Likert scale was used to weight the factors according to the characteristics of the production system in the analyzed company. Although not as complete and complex as the proposals presented in this paper, the authors found the work in [18] to be useful and to work as a nice inspiration for our own proposals.
Similarly, the research in [16] presented an empirical study that evidenced that the way of managing maintenance was different between companies that emphasized different competitive manufacturing priorities. This was attributed to the fact that different business objectives required different levels of emphasis on maintenance related terms.
In [8], the authors developed a multi-attribute decision-making model for selecting the most appropriate maintenance system for the organization. The selection was based on the impact of each maintenance system on the performance of the organization. It was described from a set of criteria: the level of use of the equipment and the workforce, the reduction of defects of the product, of the process, and rework, the increase of average time between failures, and the reduction of the maintenance costs, the delays in the deliveries, the number of accidents, among others.
On the other hand, in [11], a framework that integrates the fundamental elements of the maintenance flexibility concept was proposed. According to these authors, business objectives decide on the maintenance strategy, and thus maintenance tasks must change in consonance with business objectives changes. These changes in maintenance tasks will in consequence define modifications in the same maintenance system and processes, which lead these authors to conclude a review of the infrastructure that supports the maintenance service, the information systems, and the education and training plans, is also required.
All of the elements mentioned above demonstrate the need to manage PM and MM processes in an integrated manner, and furthermore, they highlight the fact that the emphasis on the need for integration varies according to context. In this sense, the development of a method capable of evaluating how significant it is to maintain an adequate level of PM—MM integration, in a given company, would allow us to objectively demonstrate to the parties involved (mainly the production and maintenance managers) the need to deploy a decision-making process that is coherent and synergistic. All of it seeking to obtain the global optimum in the performance of the Production—Maintenance system, as a whole, instead of trying to generate a local optimum within each subsystem, which could be detrimental to the overall effectiveness and performance of the company.
Based on these considerations and detailed analysis of the relevant and related states of the art and practice, the present paper introduces a novel framework to direct the activities of evaluation, weighting, and aggregation of a group of indicators (attributes) as the base for obtaining an index that allows qualifying, in a linguistic domain, of the importance of PM—MM integration. At the same time, this framework includes a new methodology to evaluate the consensus of experts and uses linguistic terms with a triangular membership function. It is meant to overcome some deficiencies of previous models in which the index that was to characterize the consensus and did not adequately reflect the levels of proximity or distance between the linguistic terms emitted by an expert during the evaluation of attributes [19,20,21].
On the other hand, since the method selected for obtaining the weights together with the recursive character of the linguistic term aggregation operator used (LOWA operator) causes that the weight of the element to be added in each iteration i tends to be dominated by the one obtained in iteration i − 1, even if this element were to have a high real relative importance, the authors have decided to overcome this deficiency by introducing a parameter that quantifies the distance between linguistic terms into the expression determining the consensual relationship. Such a parameter has a triangular membership function. Furthermore, the authors also propose a new way of obtaining the components of the vector of weights used in the aggregation, so that in each iteration i the weight of the attribute to be aggregated reflects the real comparative importance of it with respect to the average relative importance of the attributes already aggregated in previous iterations.
The reminder of this paper is structured as follows: Section 2 presents a set of novel indicators to assess the different dimensions of the importance of PM—MM integration, while Section 3 details a novel framework designed to evaluate, weight, and aggregate the defined indicators. Given the qualitative nature of some of the proposed indicators, the evaluation process of these is based on the use of Ordinal Fuzzy Linguistic Modeling (OFLM), and after the aggregation phase, it is possible to obtain a general index that characterizes the importance of the PM—MM integration in the company under question, i.e., a Production–Maintenance Integration Index (PMII). Subsequently, Section 4 presents the results of the application of the proposals in a workshop of the Cuban mechanical industry, while at the end, Section 5 is dedicated to the conclusions and some suggestions for the development of future work on this subject.

2. Proposal of a Set of Indicators for Evaluating the Importance of the PM—MM Integration

Although in the states of the art and practice the authors could not find a proposal of indicators for specifically evaluating the integration level between PM and MM, the theoretical elements analyzed in the previous section as to the relationship Production—Maintenance serve as a strong base in the definition of such a set of indicators, by applying a deductive process. It is a proved fact that, in highly automatized plants, the importance of the PM—MM integration is more critical that in those intensive in manpower [11,13,14,15,16]. This reason leads us to think that the automatization level is an element that should be taken into account in the set of indicators. On the other hand, considering the fact that some authors point out that companies with different competitive priorities generally follow different maintenance strategies [7,11,15], then a competitiveness-driven approach is another of the indicators to be proposed.
A study presented in [7] showed that the integration between production and maintenance plannings was more significant in production settings in which the failures’ consequences were higher. This study also revealed that, as the maintenance cost increases in relation to the production cost, the savings derived from integration are reduced. If taking this fact into consideration, it is then useful to consider a group of elements that, at the floor shop level, characterizes and explains the failure consequences; likewise, it is also important to consider other elements linked with maintainability, which condition and determine the throughput, availability, and costs. In this sense, in terms of elements that highlight the need for the PM—MM integration, the authors of this paper also decided to consider others such as the impact of maintenance-related downtimes or stops over production goals; the rate of maintenance interventions that should be executed over a stopped machine; the complexity of reparations; and the level or extent of technical service required by the equipment.
On the other hand, as factors that decrease the need of the PM—MM integration, because of the reduction they lead to in terms of the failures’ negative operational consequences, the authors of this paper have identified others, such as the existence of redundant equipment or alternative production lines [14], and the availability of resources for executing the maintenance activities [11].
From the organizational point of view, the implementation of a process-based management strategy requires an adequate coordination and integration between all the processes and systems of the company, being a particular case of those related to production and maintenance. For this reason, another of the proposed indicators is the recognition of the need to adopt process-based management.
According to the opinion of the authors of this paper and also of those in [13], the existence of common material resources for production and maintenance promises a higher PM—MM integration to eliminate the redundancy of information and informatic modules that manage these resources. For this reason, the proportion of material resources that are common to Production and Maintenance is another of the proposed indicators in this paper.
Based on all previous considerations, Table 1 presents a general proposal of unique and novel indicators that are the base and lead to the subsequent proposal of an index for evaluating the importance of the PM—MM integration in a company. Table 1 also presents a brief description of each of the indicators and the theoretical conceptions behind these.
The evaluation of each indicator will be either qualitative or quantitative and will depend on the own nature of these, given that indicators such as a competitiveness-driven approach could be hardly quantified while others such as the proportion of material resources that are common to Production and Maintenance can be easily expressed in numbers. In this sense, the research in [19] developed a model for the management of heterogeneous information in which data could be linguistic or numeric within the interval (0; 1). However, this work did not detail a way of normalizing quantitative indicators that could be expressed in a different interval or whose goal or ideal value could correspond to the minimum or intermediate value within the interval. This gap is something that will be also addressed within the proposals in this paper.

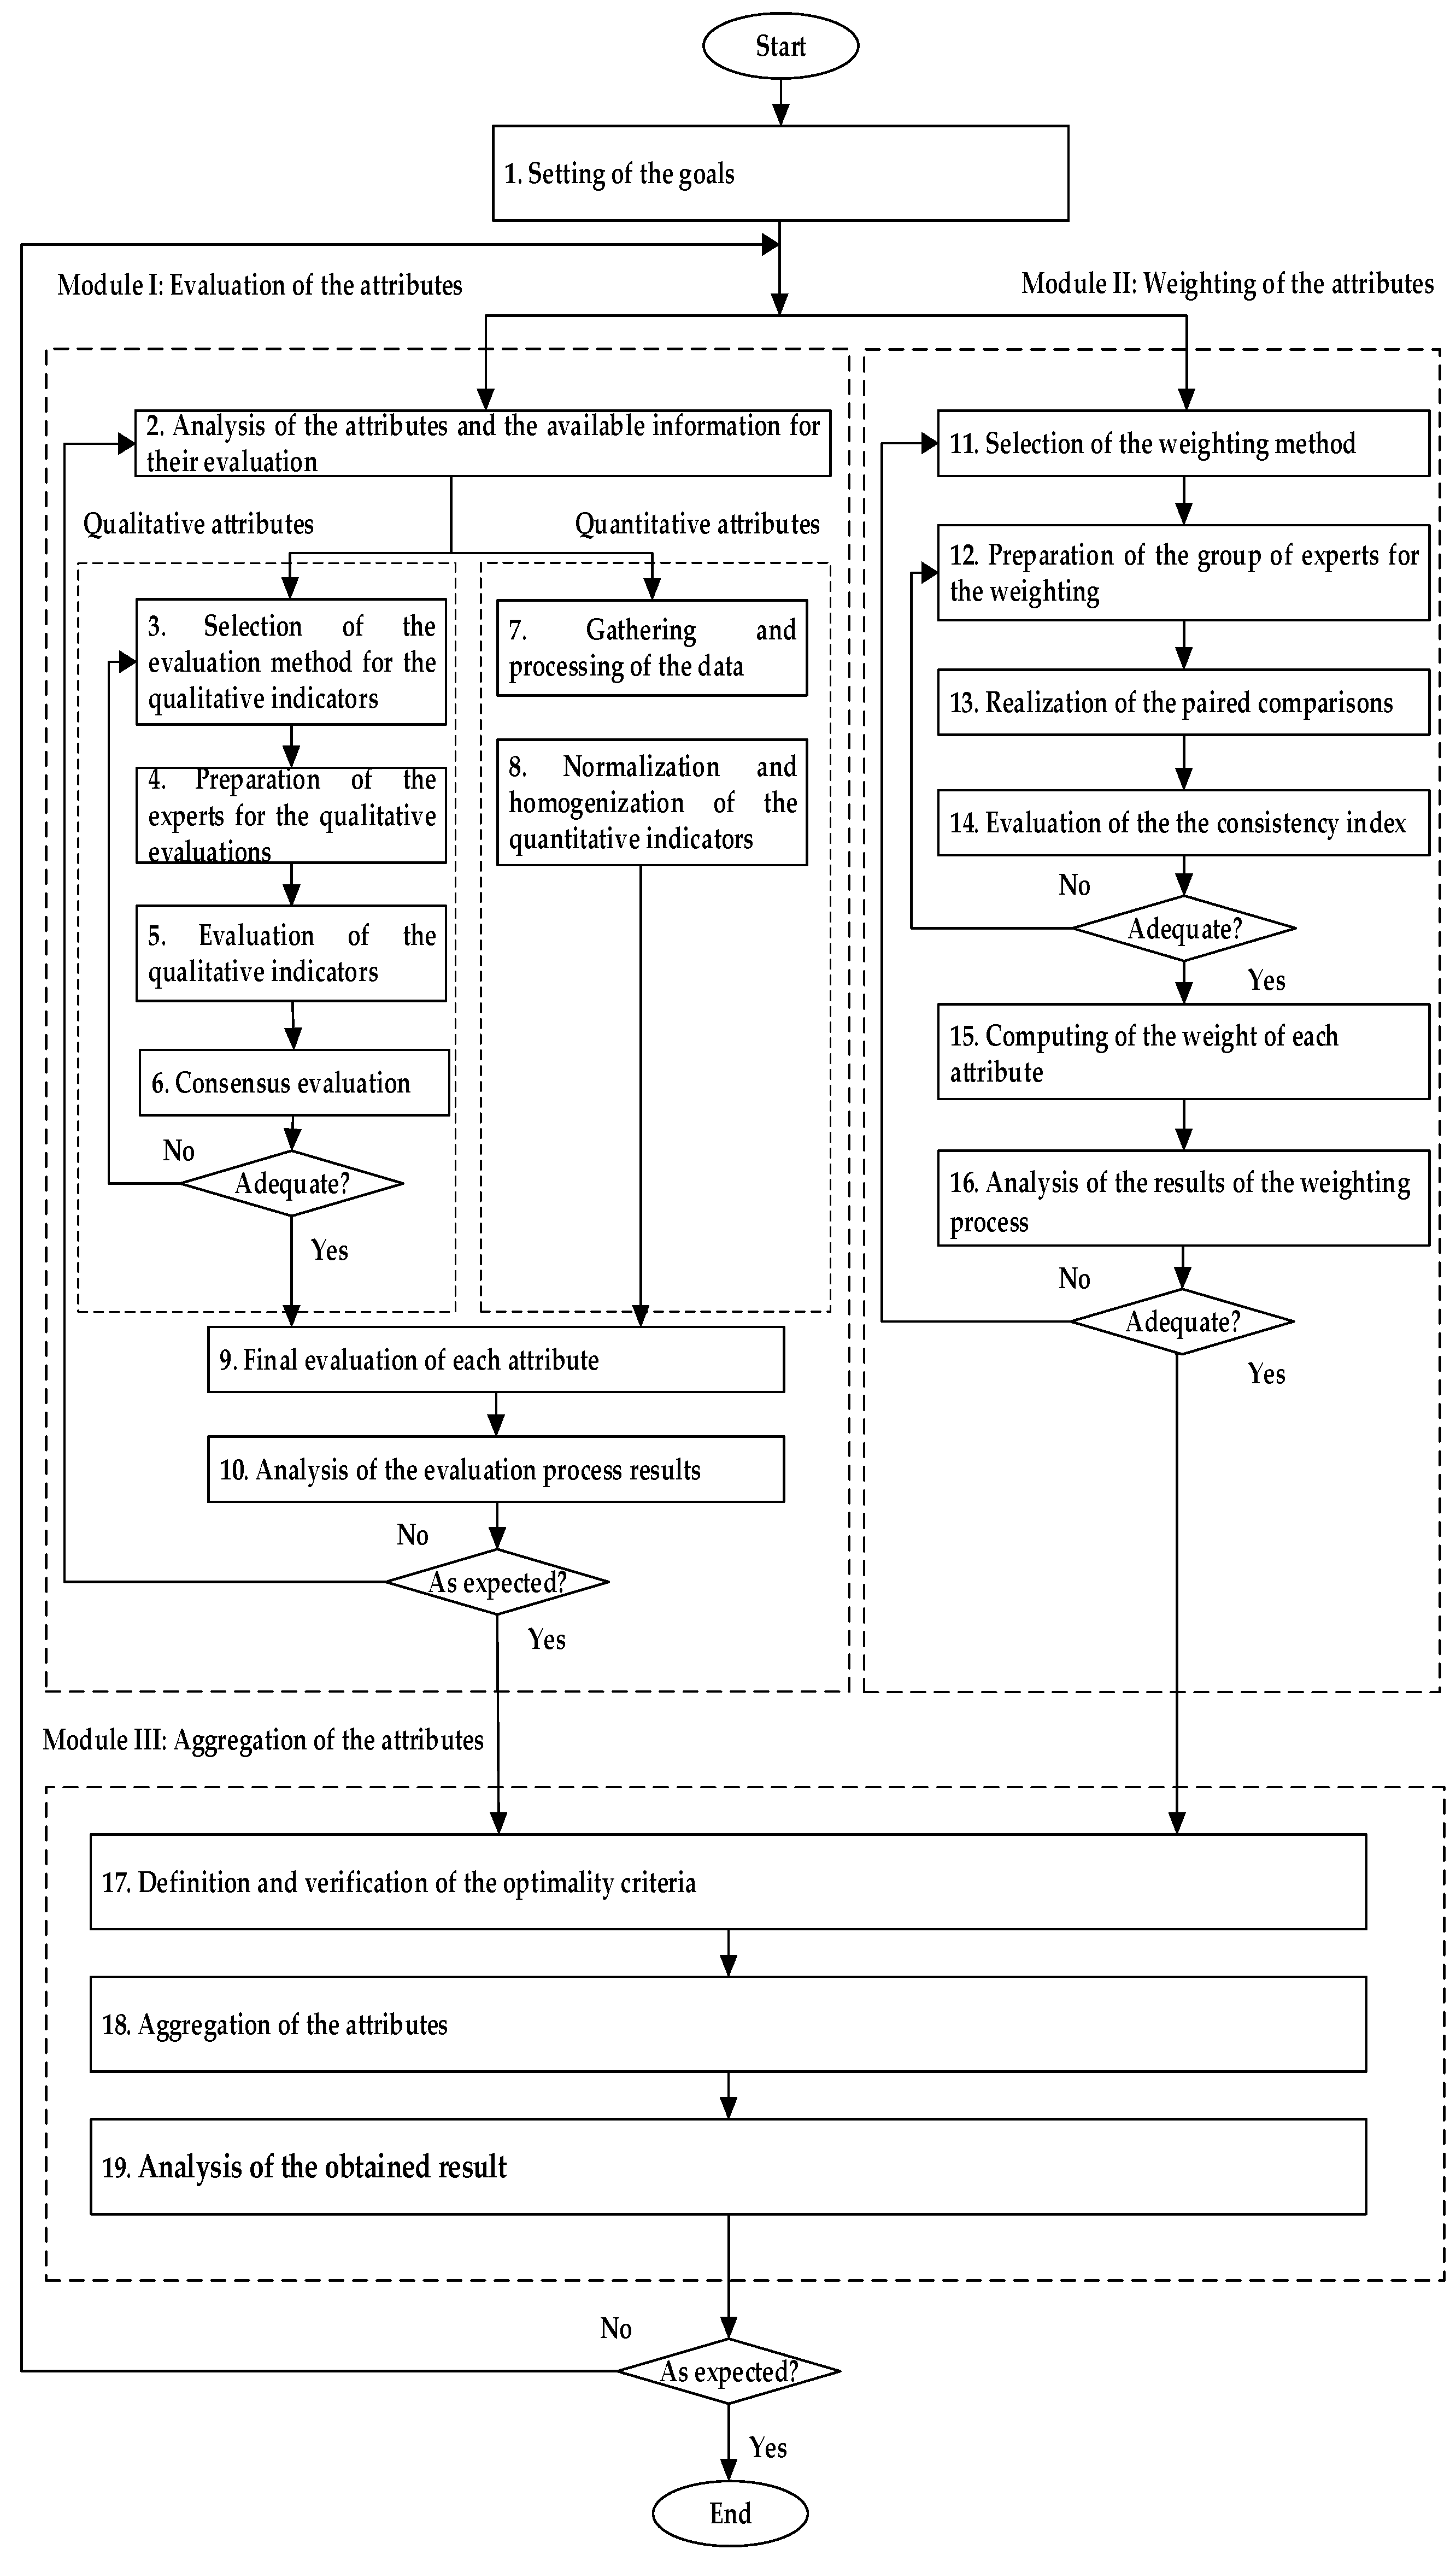
3. Framework for the Evaluation, Weighting, and Aggregation of Indicators Characterizing the Importance of the PM—MM Integration

This framework includes evaluation, weighting, and attribute aggregation modules, which allow us to obtain a general index that characterizes the importance of PM—MM integration in a company (PMII), see Figure 1. For the sake of a better understanding, each of the framework’s steps will be described next:

3.1. Setting of the Goals

The goal values of the parameters that characterize the efficiency of the evaluating and weighting processes are set in this step.

3.2. Module I: Evaluation of the Attributes

This module uses the defined attributes (indicators) and the necessary information for their evaluation as input data. It includes the evaluation process and the quality analysis of this process itself, which is performed through the determination of a consensus degree or index. The output of this step is a set of evaluated attributes (indicators) in accordance with their current state and values in the company under study.

3.2.1. Analysis of the Attributes and the Available Information for Their Evaluation

By considering and assessing the uncertainty level of the available information, it is possible to specify which indicators are to be evaluated in a qualitative way (linguistically), through the expert’s judgment, and those which will be evaluated in a quantitative way.

3.2.2. Selection of the Evaluation Method for the Qualitative Indicators

The Ordinal Fuzzy Linguistic Modeling approach will be used as the evaluation method for the qualitative indicators. This decision is based on its capabilities for the treatment of the uncertainty and vagueness existing in the linguistic information provided by the experts [19,20,21,22,23,24,25]. The evaluation scale will be formed by a set of seven terms or linguistic labels, these are: null (n), very low (vl), low (l), medium (m), high (h), very high (vh), perfect (p), as shown in Figure 2. Readers of this paper are also kindly invited to check the content of [26], where these authors made a really complete and complex analysis on the Consensus Reaching Process for the modeling of experts’ linguistic preferences.
For the definition of the linguistic terms’ semantics, a triangular membership function of the type ( μ A ( x ) ) will be used, as it appears in Equation (1), see [24]. All of these terms will be represented through triangular fuzzy numbers with the parameters a1, a2, and a3, as is also shown in Figure 2.
μ A ( x ) = 0 i f   x < a 1 x a 1 a 2 a 1 i f   a 1   x     a 2 a 3 x a 3 a 2 i f   a 2   x     a 3 0 i f   x > a 3
By setting S as the set of terms or linguistic labels we have the following:
S0 = null (n), S1 = very low (vl), S2 = low (l), S3 = medium (m), S4 = high (h), S5 = very high (vh), S6 = perfect (p).

3.2.3. Preparation of the Experts for the Qualitative Evaluations

The content of each indicator will be explained to the experts. This is performed in order to warranty that each expert is able to establish an adequate match between the linguistic terms in the scale and the possible states of the indicator under assessment.

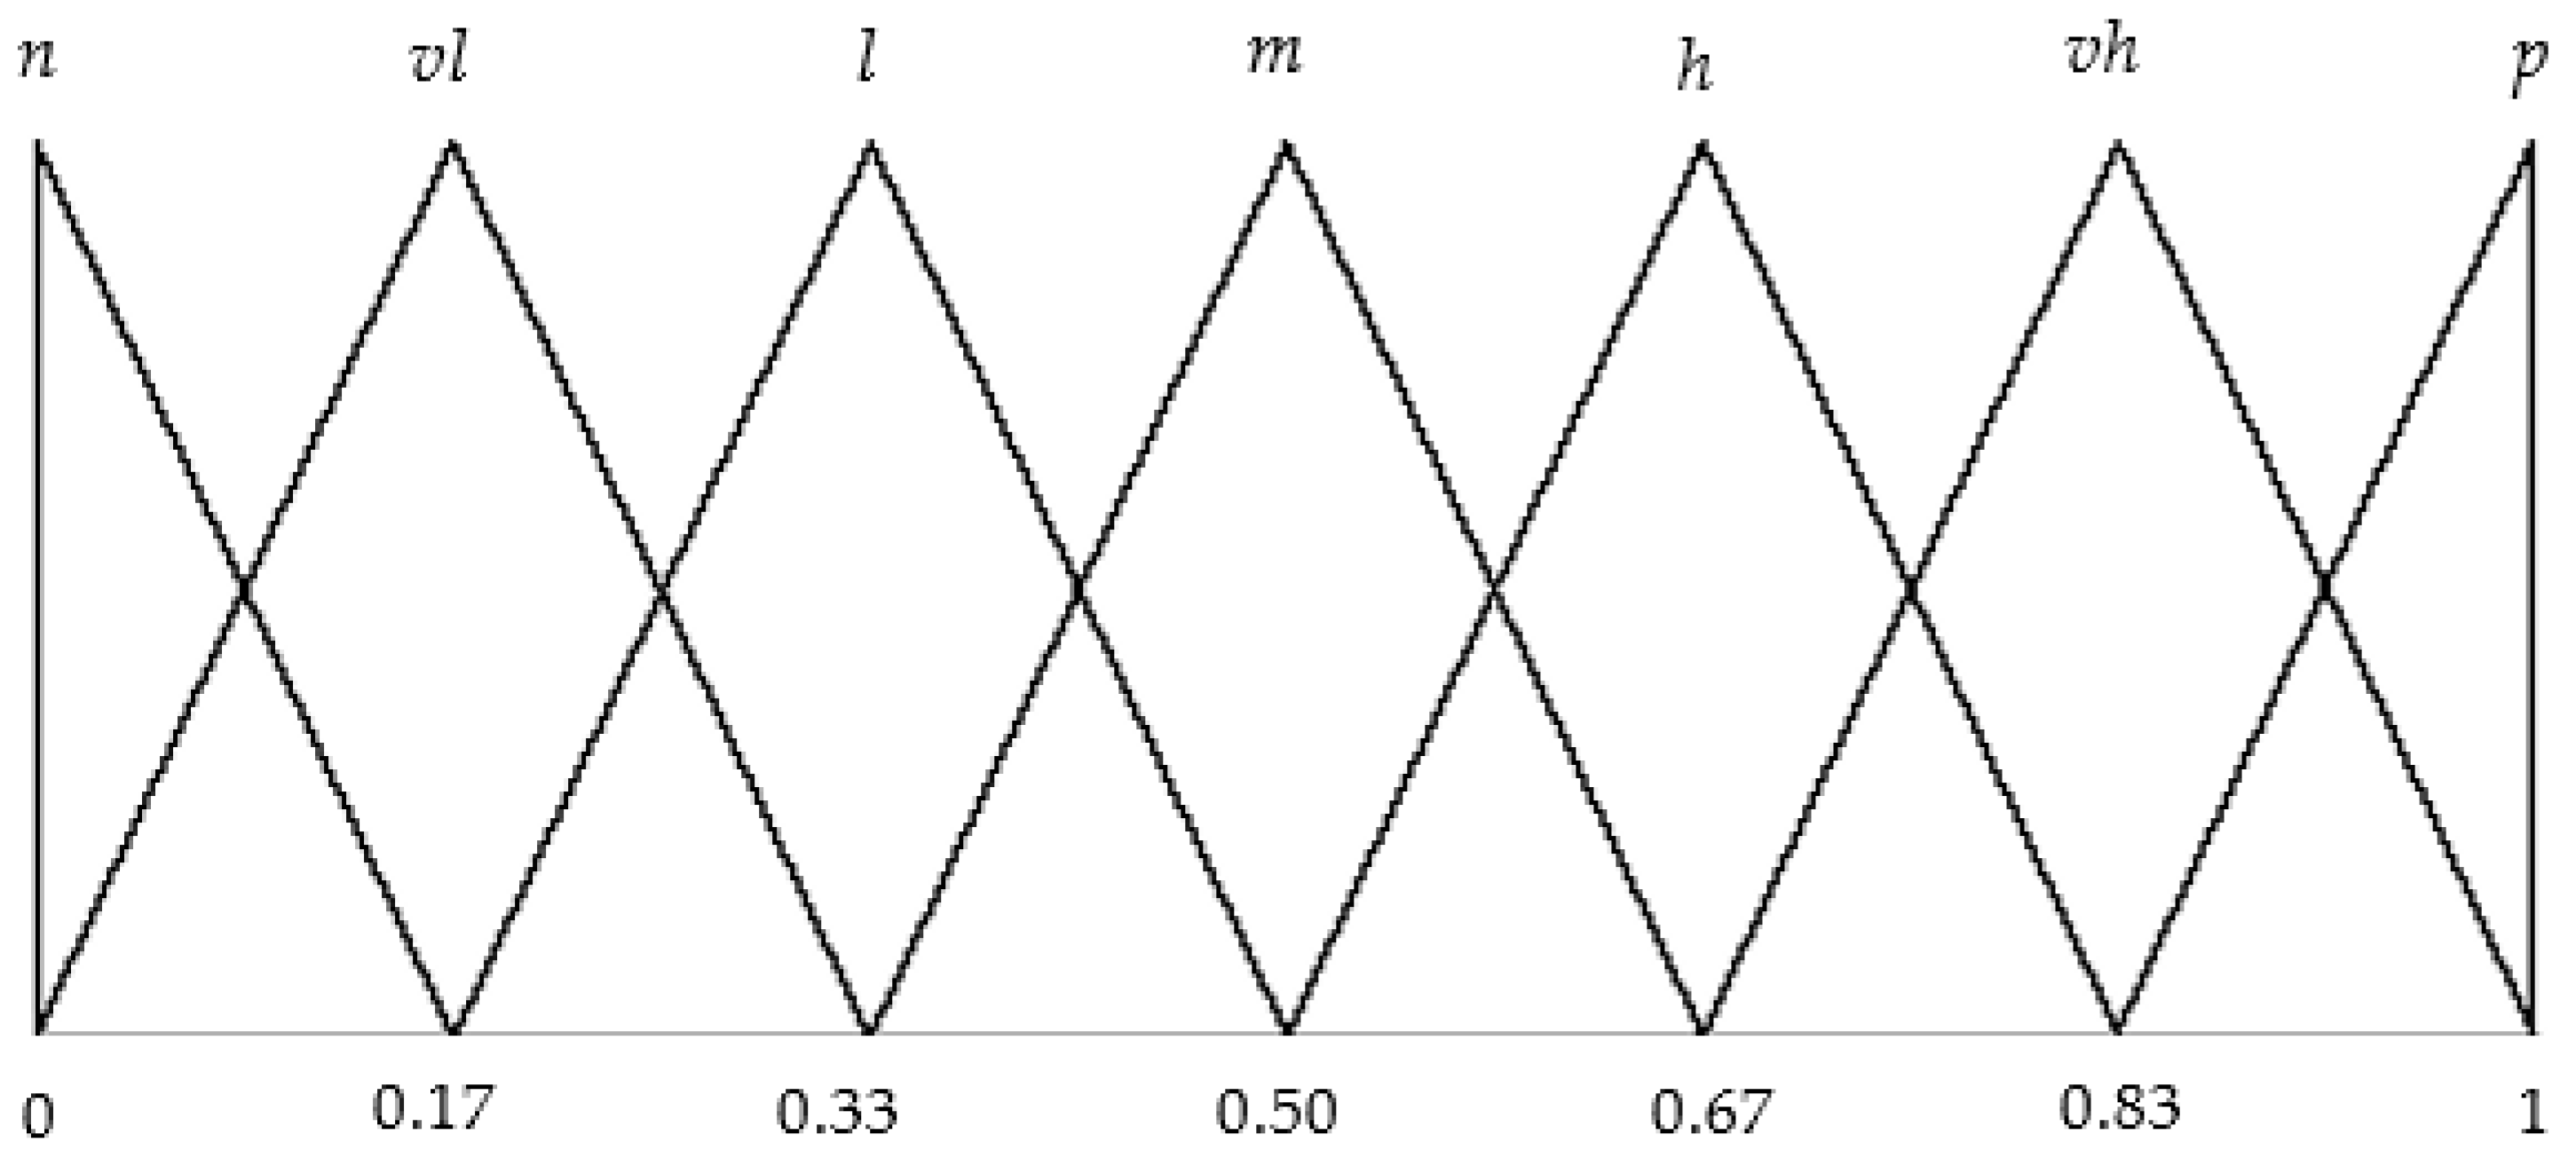
3.2.4. Evaluation of the Qualitative Indicators

Experts will assign to each indicator the linguistic term (label) of the scale S that, in accordance with their assessment, better and more objectively represents their current state in the company.

3.2.5. Consensus Evaluation

The authors in [20] proposed a good and well-accepted methodology for determining the consensus in a linguistic context, which is based on the calculation of one parameter called consensus relation ( C R ) and the subsequent application of a linguistic quantifier over the obtained numerical value. However, although their approach and methodology allow us to evaluate the distance between the different assessments given by each expert and a collective opinion measure, it does not consider how close to each other the linguistic terms selected and assigned by the own expert can be, and for this reason, the C R would be the same in case of existing, within the group of experts, assessments of the type vl and vh, or h and vh, with these last two terms consecutive ones in scale where, logically, the consensus level would be expected to be higher.
In addition, when analyzing this research, it could be also noted that, when consecutives linguistic terms with cardinalities higher than 1 coexist, the consensus relation produces a low consensus level if the linguistic quantifier named “much” is used. This manifests a lack of coherency with the evaluation’s results if the linguistic terms’ proximity is taken into account, because of the fact of being consecutive values in the proposed scale.
Taking into consideration the above-mentioned facts, this section introduces the proposal of a methodology that overcomes the above-mentioned drawbacks or limitations. It includes the following steps:
  • To obtain a vector v s i j for each indicator (attribute) j , whose components are the linguistic terms s i S established by the group of experts as a measure of the evaluation of the indicator j .
  • To obtain the quantity ( G ) of experts’ subgroups that is formed withing the group, in accordance with the coincidences in their evaluation of the attribute j:
G = #   ( v s i j )   s i S
where # represents the cardinality of the vector v s i j .
3.
For each linguistic term s i S of the vector v s i j , to obtain the number of experts m s i j that coincided in the assignation of it as the attribute j’s evaluation measure.
4.
To obtain the experts proportion ( p s i ) that coincided in assigning the linguistic label (term) s i as the attribute j’s evaluation measure:
p s i = m s i j m
where m refers the number of experts.
5.
To calculate the consensus relation ( C R ) using the following expression:
C R i = 1   i f   G = 1 j = 1 G p s i 2   i f   G = 2   a n d   t h e   2   l i n g u i s t i c   t e r m s   a r e   c o n s e c u t i v e   o n e s j = 1 G p s i 2 d m i n d ¯ min p s i j   i f   n o n c o n s e c u t i v e   l i n g u i s t i c   t e r m s   e x i s t
where:
  • C R i : consensus relation reached by the experts in evaluating the indicator j.
  • p s i : expert proportion that coincided in assigning the term s i i as measure of the indicator j .
  • G : subgroup of experts formed in accordance with the coincidence in the utilized term for evaluating the indicator j .
  • d m i n : normalized minimum distance between G consecutive linguistic terms of the scale.
  • d ¯ : normalized mean distance between the non-consecutive terms ( s i ) of the scale employed the experts for evaluating the indicator j .
Given that a triangular fuzzy number A, with parameters a 1 , a 2 , and a 3 , can be represented in accordance with the concept of the confidence interval of level α in the following way [27]:
A α = a 1 α , a 2 α = a 1 + a 2 a 1 α ,   a 3 ( a 3 a 2 ) α
then, the normalized distance between two triangular fuzzy numbers A and B will be determined by Equation (6), as used in [27]:
d ( A , B ) = 1 2 ( β 2 β 1 ) 0 1 a 1 α b 1 α + a 2 α b 2 α α
where:
  • d ( A , B ) : normalized distance between the fuzzy numbers A and B both with a triangular membership function.
  • β 1 : m i n a 1 A ;   a 1 B .
  • β 2 : m a x a 3 A ;   a 3 b .
  • a α and b α : representation of the triangular fuzzy numbers A and B, respectively, based on the confidence interval concept of level α ( α c u t ) .
  • a 1 α b 1 α : distance to the left between the triangular fuzzy numbers A and B.
  • a 2 α b 2 α : distance to the right between the triangular fuzzy numbers A and B.
For obtaining d m i n , the distance among all the subsets of consecutive terms of size G that are generated starting of a subset of size seven is to be determined first. This has to be performed in accordance with the used evaluation scale (see Figure 2). Then, the one with the shorter distance is to be selected.
d m i n = min ( d g i ) i = 1 ,   ,   N
where N refers to the number of subgroups of consecutive terms of size G that can be generated starting of seven terms, and d g i the normalized mean distance existing among the G linguistic terms of the group i.
6.
To select a linguistic quantifier that will represent the fuzzy majority concept.
A linguistic quantifier is a fuzzy subset Q that, for any value r R +   Q ( r ) indicates the grade, level, or extent to which the value r satisfies the concept represented by the same Q . For more information on this, readers are kindly invited to check the vast study presented in [20].
7.
Determination of the consensus level ( C L j ) reached over each attribute j.
The equation to use is the following:
C L j = Q 2 ( C R j )
Q 2 ( C R j ) can be obtained using Equation (9):
Q 2 ( C R j ) = l 0 i f   C R j < a l i i f   a   C R j   b l u i f   C R j > b
With l 0 and l u the minimum and maximum linguistic terms, respectively, of the employed linguistic terms set S, and a and b the minimum and maximum values of the quantifier’s domain.
l i = S u p   l q { l q }
With
M = l q L :   μ l q ( C R j ) = S u p t J   μ l t C R j a b a
j is the S linguistic terms set’s cardinality.
8.
Determination of the global consensus level ( G C L ) obtained in the evaluation of the attributes’ set.
This G C L will be calculated by using the following equation:
G C L = Q 2 j = 1 n C R j n
With n the number of attributes (indicators).
Next, the steps for evaluating the quantitative indicators are also presented.

3.2.6. Gathering and Processing of the Data

In this step, quantitative data are collected for evaluating this kind of indicator, in addition, a reference threshold value is also established for each indicator that allows evaluation of its significance.

3.2.7. Normalization and Homogenization of the Quantitative Indicators

The normalization process will take place using the next equation, which is also an original proposal within this paper:
V n j = 1 V r j V m j V r j
  • V n j : indicator (attribute) j ’s normalized value.
  • V m j : current value of the indicator j .
  • V r j : reference value of the indicator j .
Subsequently, the normalized values should be homogenized so that they are expressed in the same scale, which appears in the previous Figure 2. For these purposes, the previously presented linguistic quantifier Q 2 will be applied over the values V n j .

3.2.8. Final Evaluation of Each Attribute

The final evaluation of each qualitative attribute will be obtained by aggregating the linguistic terms emitted by the experts as a measure of its evaluation, and this only if an adequate consensus level has been demonstrated. For such aggregation purposes, there are various aggregating operators that directly operate over the set of linguistic labels, see [21,23,24]. Various of these operators are based on the well-known Linguistic Ordered Weighted Averaging operator (LOWA) and others, such as LAMA. However, they all imply complex calculations that might restrict their application’s efficiency. In this sense, for the purposes of the present research and based on the authors’ long-term experience in this area, the sole application of the LOWA operator with some modifications and improvements to it, that are proposed later in this paper and help in obtaining the weight vector, seems to be sufficient. The mathematical apparatus and explanation behind this operator are shown as follows [23]:
ϕ ( a 1 , , a m ) = W .   B T = C m { w k ,   b k ,   k = 1 , , m } = w 1 b 1   ( 1 w 1 ) C m 1 { β h ,   b h ,   h = 2 , , m }
where W is a weight vector [ w 1 , , w m ] such that w i [ 0 ;   1 ] and w i = 1 ;
β h = w h 2 m w k , h = 2 , , m . B = b 1 , , b m is a vector associated to A such that B = σ A = ( a σ 1 , , a σ m ) , being a σ j < a σ i   i   j .
Similarly, σ is a permutation defined over the set of terms A , while C m is the m label convex combining operator, defined by the authors in [28].
For m = 2 we have the following equations:
C 2 { w i , b i ,   i = 1 ;   2 } = w 1 s j ( 1 w 1 ) s i = s k ;   s i , s j S ( j i )
k can be obtained using Equation (16):
k = m i n { T , i + r o u n d ( w 1 . ( j i ) ) }
With S the linguistic term set to be aggregated with cardinality T + 1 .
Usually, the weight vector W is calculated by some quantifier, however, in this work, obtaining of the weights is proposed to be performed based on the cardinality of each of the terms to be aggregated, and this in accordance with the aggregation concept that it is commonly addressed and used for the majority operators without a quantifier [22]. This way we have:
w i = f i b i , K ,   b n = γ i δ m i n θ δ m a x . θ δ m a x 1 . θ δ m i n + 1 . θ δ m i n + γ i δ m i n + 1 θ δ m a x . θ δ m a x 1 . θ δ m i n + 1 + + γ i δ m a x θ δ m a x
where:
  • b i : i-th element of the term set to be aggregated, ordered in an increasing way in accordance with its cardinalities.
  • δ i : Cardinality of the element i.
    γ i K = 1 i f   δ i K 0 o t h e r w i s e
  • θ i is calculated using Equation (19):
    θ i = n u m b e r   o f   e l e m e n t s   w i t h   c a r d i n a l i t y     i + 1   i f   i     δ m i n n u m b e r   o f   e l e m e n t s   w i t h   c a r d i n a l i t y   i   o t h e r w i s e
Because the aggregation process based on the LOWA operator is an iterative one, in which in each iteration element of the B linguistic term set is aggregated with the result obtained in the previous iteration, it happens that, in each iteration i, the term’s weight to be aggregated tends to be dominated by the linguistic term’s weight that was obtained as a result of the aggregation in the iteration i-1. This fact occurs because the term obtained as result in the iteration i − 1 is to be aggregated in the iteration i with a weight value that constitutes the cumulated weight of all terms that have been aggregated until this iteration i − 1.
In this regard, the authors of this paper propose a modification to the way of obtaining the weight vector β h , where it is achieved that the weight value of each element reflects the relative importance previously calculated for it with respect to the mean relative importance of the elements that preceded it in previous iterations. The following expression (20) introduces the calculation method for this vector. This also constitutes a scientific added value in the form of an own proposal of the author’s in this paper.
β h = w h m h w h m h + i = h + 1 m w i i f   h = 1 ,   2 , ,   m 1 1 β m 1 i f   h = m
where:
  • β h = [ β 1 , β 2 , , β m ] is a weight ordered vector associated to A such that: w β i w β j i < j.
  • m : number of linguistic terms to be aggregated.
Now, considering the previous steps, the LOWA operator will be used, taking into consideration the previous weights ( ϕ F ) ; while the reordering of the vector B will be now performed in a non-increasing way, in accordance with the new weights values ( β h ) of the terms to be aggregated.
In the case of the quantitative attributes, the evaluation will be obtained directly from the previous step once the quantifier Q 2 is applied over the homogenized value ( V h j ) .

3.2.9. Analysis of the Evaluation Process Results

In this step, the obtained evaluations will be presented to the experts with the aim of verifying their agreement with the results.

3.3. Module II: Weighting of the Attributes

This module uses as input information the operational characteristics of some of the used methods for the weights’ calculation, the same nature of the attributes to be weighted, while it is also supported by the addition and use of some informatic application to ease the computing. The main processes developed in this module are the same weighting process and the evaluation of the weighting process quality. The final weight of each indicator is the final output of this part of the proposal.

3.3.1. Selection of the Weighting Method

In this case, the Fuller’s Triangle method see [29] is proposed to be used with a light modification made by the authors of this paper. The modification lies on its comparison scale and allows the possibility of assigning the same importance to two compared attributes and, also, to compute the consistency level achieved during the comparison of attribute pairs. The established scale for the attribute’s paired comparison is as follows:
a i j = 2 if the attribute i is considered more important than the attribute j .
a i j = 1 if the attribute i has the same importance as the attribute j .
a i j = 0 if the attribute i is considered to be less important than the attribute j .

3.3.2. Preparation of the Group of Experts for the Weighting

Each expert will be instructed on the characteristics that the attributes will be compared upon. In this case, the relative importance of one indicator over another one will be determined as a result of how this indicator sees and assumes the importance of the PM—MM integration.

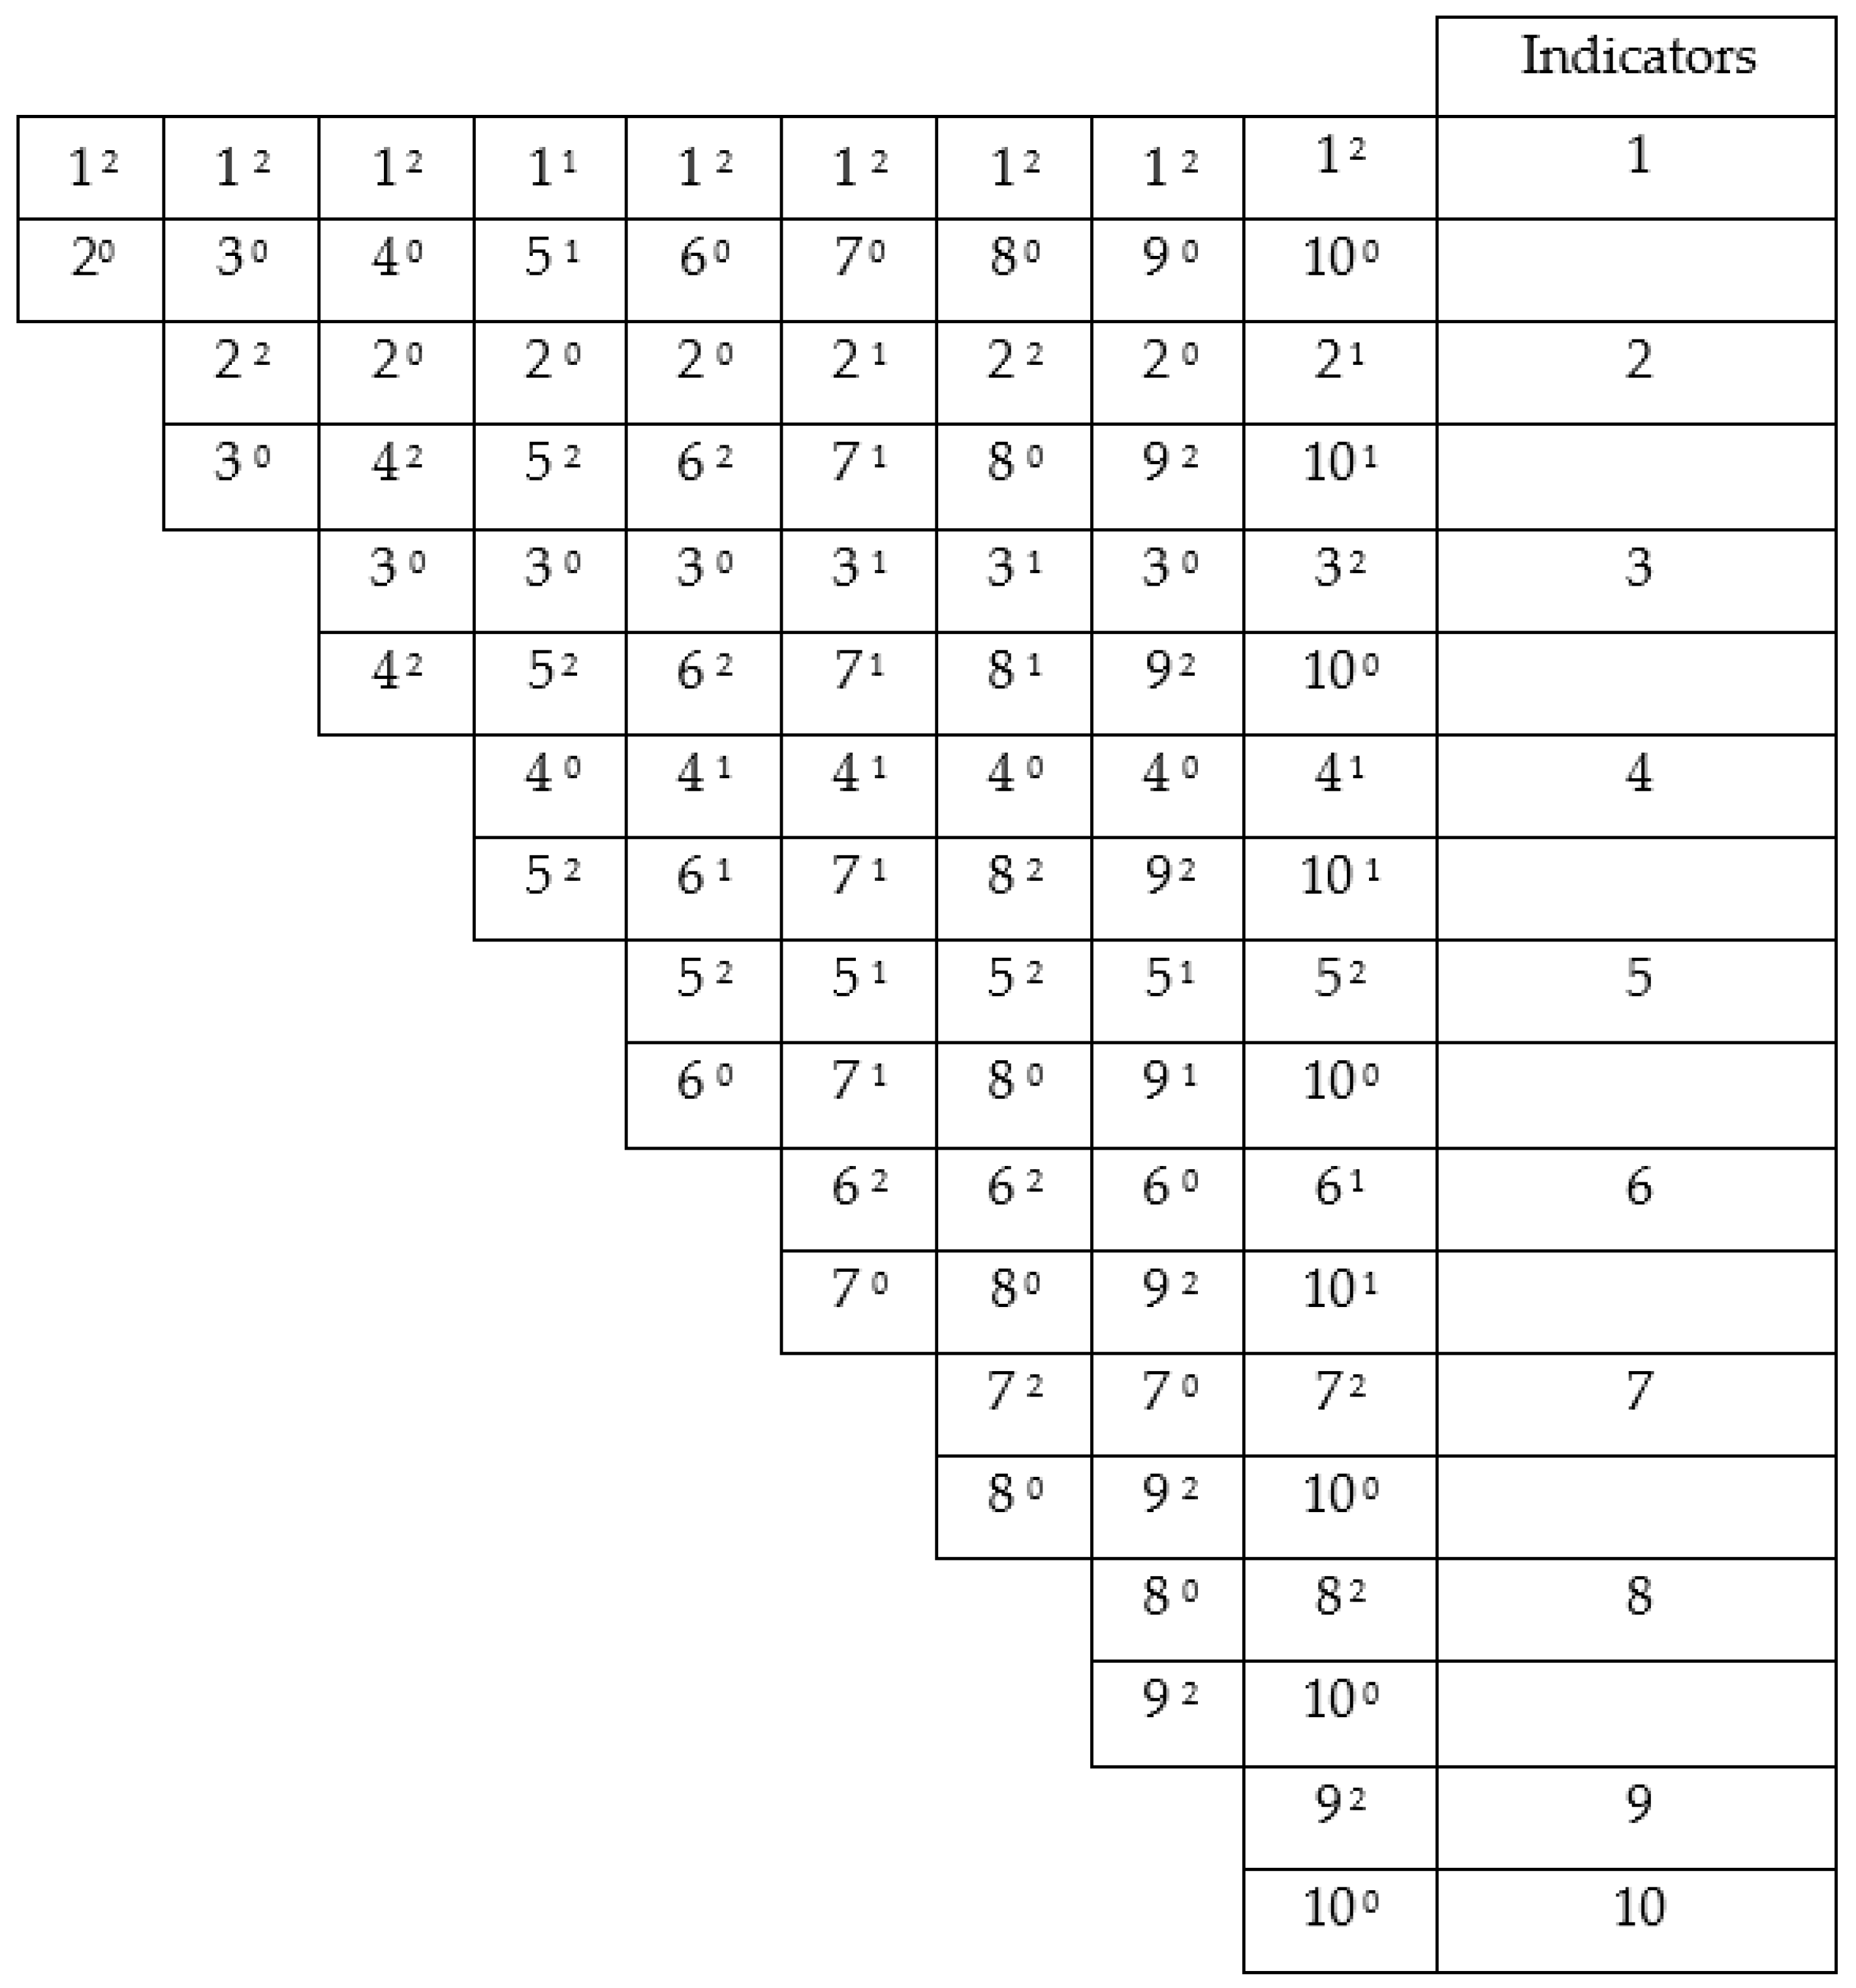
3.3.3. Realization of the Paired Comparisons

This step defines the way to perform the comparisons between pairs of attributes. There are two possibilities: (1) to obtain the experts’ evaluations in an independent way or (2) to obtain these in a joined fashion. It is important to consider any doubts or questions the experts may have with respect to the content of the indicator given that it may significantly influence the weighting process.

3.3.4. Evaluation of the Consistency Index

In this step, all the possible triplets are generated from the attributes’ set, and, on the basis of the rules that are next specified, the inconsistency level and the inconsistency units present in each attribute triplet are subsequently defined.
  • Total inconsistency. It is defined when, in a triplet of attributes, the transitivity principle is totally violated, and this is based on the comparison scale that is proposed, for instance: if it occurs that a i j = 2, a j k = 2, and a i k = 0, in this case, the triplet is assigned or given one inconsistency unit.
  • Partial inconsistency. It is defined when in, a triplet of attributes, the transitivity principle is partially violated, for instance: if it occurs that a i j   = 2, a j k = 2, and a i k = 1, in this case, the triplet is assigned or given 0.5 inconsistency units.
  • Consistent. Consistency is assumed when it is not possible to confirm that partial or total inconsistencies are present. In this case, we do not assign inconsistency units to the triplet.
The consistency index ( C I ) is calculated according to the fallowing equation:
C I = 1 i T U i c i T
where:
  • U i c i : units of inconsistency assigned to the attributes’ triplet i .
  • T : number of triplets that are generated by a set of n elements.
T = n ! 3 ! n 3 !
With n the number of compared attributes (indicators).
In case the paired comparisons have been performed in an independent way by each expert, then the concordance level reached by these is to be calculated, for which Kendall’s concordance coefficient is to be evaluated. In addition, in this case, it is also needed to execute a hypothesis test with respect to the experts’ preferences agreement.

3.3.5. Computing of the Weight of Each Attribute

The Simple Ordering method is proposed for use in this step. This method has proved to be an efficient one in this kind of study, see [30]. If the indicators’ paired comparisons were performed in an individual way by each expert, the range’s mean value would be assumed, and starting from it, a given score will be assigned to each attribute. The authors in [30] back in 2014 presented a methodological tool addressing how to specifically carry out the integration between the Production and Maintenance Management processes at a tactical level. The proposal incorporated elements of the Reliability Centered Maintenance (RCM) philosophy, the Value Analysis, the Ordinal Linguistic Fuzzy Modeling (OFLM), and the Theory of Fuzzy Control. Both the current research and that previous one keep a clear relation although addressing different phases of the whole PM—MM integration.

3.3.6. Analysis of the Results of the Weighting Process

The group of experts will analyze the results and determine if these correspond to the expected differences among the attributes. This will be performed based on the defined feature taken as reference for the weighting itself, i.e., the need for the PM—MM integration.
If there were marked differences, the effectiveness of the steps up until this point will be checked. Otherwise, if results are considered adequate ones, then the methodology moves into the aggregation module, which is presented next.

3.4. Module III: Aggregation of the Attributes

The set of previously evaluated and weighted attributes constitute the input values for this module. The aggregation process, and the obtaining of a main index that defines the level of importance of the production—maintenance integration (PMII)—is the final output of this module.

3.4.1. Definition and Verification of the Optimality Criterion

The optimality criterion will be of the maximum type, which implies that the overall accomplishment of each indicator requires the complete achievement of the concept expressed by the same index PMII. In this sense, the negation operator “Neg” will be applied over the linguistic label that defines the evaluation of those attributes whose raised satisfaction levels imply a low accomplishment of the PMII index.
N e g s i = s j   |   j = g i

3.4.2. Aggregation of the Attributes

The aggregation of the attributes for obtaining the PMII will be realized using the LOWA operator. This will take place using the weights obtained in the second module of the framework. As the application of this operator requires the ordering of the indicators in non-increasing way, in accordance with their weights, in the case of the coexistence of indicators of equal weight values, subsets of these will be created in order to perform partial aggregations of such subsets, generating the weights in accordance with the cardinalities of the terms to aggregate. After this step, the result of these partial aggregations is to be substituted in the initial set of attributes to then perform the global aggregation finally. This strategy we have proposed is different to other approaches in the literature in which the application of the LOWA operator does not consider the possibility of some indicators having equal weight. In addition, in such proposals, the ordering is made arbitrarily, which might produce inconsistent results in many of the cases.

3.4.3. Analysis of the Obtained Result

A qualitative analysis of the obtained result will be carried out at this stage of the methodology in order to determine if it corresponds with expectations. If there are incongruencies in this comparison, the effectiveness of previous steps is to be checked.

4. Results and Discussion

4.1. A Brief Description of the Case Study

The case of study belongs to a manufacturing plant of the Cuban mechanical industry. This plant is dedicated to the production of equipment and spare parts of high priority for the country’s economy given that these are mostly used in the sugar, metallurgic, mining, oil, and construction materials industries, to just cite the main ones. The plant produces items such as reducers, rockers, mills, etc., and its manufacturing priorities are directed towards the production cost and delivery time reductions. The plant has a total of 36 machines with a high automatization level.

4.2. Results of the Framework Application

When analyzing the defined set of indicators presented in Table 1, it was decided that the 3rd and 6th ones would be evaluated in a quantitative way, due to the existence of data in the plant, and also the possibility of establishing objective values (goals) for them. The remaining ones were evaluated in a linguistic way. The minimal thresholds to meet in terms of the consensus and consistency indexes were the linguistic term (label) “high” and the value of 0.8, respectively. The results obtained for the indicators evaluated in a qualitative way are the first to be presented next.
Each expert began by assigning each indicator the linguistic label that, in accordance with his/her opinion, represented its current state within the company. The results are shown in Table 2, where the indicators appear numbered in the first column in the exact order they were referred to in Table 1, while the eight selected experts (E1, …, E8) appear in the first row. On the other hand, Table 3 shows the result of the main parameters that determine the consensus level ( C L j ) achieved in the evaluation with respect to each indicator j , by using the linguistic quantifier “much”, with parameters a and b having values of 0.3 and 0.8, respectively.
For the sake of comprehension and demonstrative purposes, an exemplification of the computation of the parameters that determine the consensus level is presented next for the case of the indicator 1. The p s i 1 values are as follows:
p n 1 = p m b 1 = p b 1 = p m 1 = p = 0 8 = 0 , p = 6 8 = 0.750 , p p 1 = 2 8 = 0.250 .
Given that, in this case, according to the used scale, the linguistic terms are consecutive ones, by considering Equation (4) we have that:
C R i = 0.75 2 + 0.25 2 = 0.625
Similarly, in order to obtain C L 1 , Equation (8) was implemented using the linguistic quantifier “much”, whose a and b values were 0.3 and 0.8, respectively.
Before using Equation (10) to obtain the value of l i , it was necessary to first determine the vector M, which is integrated by those linguistic labels that accomplish or meet the condition defined through Equation (9). In this sense, it was also necessary to determine the membership of the following value with respect to the linguistic terms appearing in Figure 2.
C R 1 a b a = 0 , 65 .
In this regard, by using Equation (1), it is possible to see that this value presents a membership grade of 0.12 to the linguistic term “medium" (m), 0.88 to the linguistic term “high” (h), and 0 to the remaining terms of the scale. This way, we can conclude that the vector M consists of only one linguistic term, in this case “high”, which coincides with the l i value and, at the same time, with the consensus level value reached by the experts when evaluating the indicator 1.
As appreciated in Table 3, in all of the cases the obtained consensus level was equal to or higher than the linguistic term “high”. This leads to the conclusion that the demanded quality level for the qualitative attribute evaluation process was met. In the execution of the step 8 of the methodology for obtaining the Global Consensus Level (GLC), we first determined the C R ¯ through the C R j values, see Table 3. In this case, we obtained the following value:
C R = j = 1 10 C R j 10 = 0.689 .
By applying the linguistic quantifier Q 2 to this value, in accordance with Equation (12), then we have that the GCL is “very high”, i.e., G C L = vh.
It is important to emphasize the fact that our proposal for determining the consensus relation ( C R ), unlike others, for instance the one presented in [20], has an inclusive character, that is, it considers the opinions of all involved experts and, even more important, it is also sensitive to the proximity among the linguistic terms emitted in evaluation process, as is appreciated when comparing the C R results and the corresponding C L value in the case of the indicators 5 and 9.
In the case of these indicators, it can be seen that there is the same balance in terms of the proportion of experts who provide one or another linguistic label as a measure of the evaluation of both indicators, regardless of whether the linguistic labels used to evaluate are not the same for the indicator. In the case of indicator 5, 87.5% of the experts consider that it is at a “high” level and the 12.5% consider that it is in another state, “perfect”. Similarly, in the case of indicator 9, 87.55% of the experts consider that said indicator is in one state and 12.5% of the members consider that it is presented in another evaluation state. However, since our proposal takes into account the proximity among the linguistic terms (labels), and the labels used in evaluating indicator 9 are closer than those used for indicator 5, then C R 5 , and consequently C L 5 , are also lower than C R 9 and C L 9 respectively.
For both of these indicators the cardinality of the vector v s i j is the same, even the p s i 1 values for the emitted labels in each case are equal, however, given that the proximity among the labels through which indicator 5 was evaluated is inferior, then the C R 5 value is lower than the corresponding one to C R 9 . This fact would not have been detected nor considered if we had simply applied the methodology proposed in [20], in which case the C R value would have been equal to 0.875 for both indicators. This is, again, another of the added values of the presented research.
Another important aspect also lies in the same selection of the proportional linguistic quantifier. Here, it is necessary to find an adequate trade-off between accuracy and application cost, given that the results of C L might be overvalued if the quantifier “At least half” were to be used, or otherwise undervalued if the linguistic quantifier “All” were to be used instead.
The final evaluation of each indicator was obtained using the LOWA operator, as indicated in step 9 of the proposed framework. For the sake of comprehension and demonstrative purposes, an exemplification of the computing or determination is presented next for the case of indicator 1. In Table 3 it is possible to see that the evaluation vector of indicator 1 includes the terms p and vh, with cardinalities of 2 and 6, respectively, which relate to and constitute the values S6 and S5 of the used scale’s term set. According to Equation (17), the weights’ vector (w) can be calculated as follows:
w p = 1 2 × 2 = 0.25 ,
w v h = 1 2 × 2 + 1 2 = 0.75 .
For the case of two linguistic terms to be aggregated, the adjusted weight vector β h coincides with the vector W, which is calculated by means of Equation (17). In accordance with Equation (14), the LOWA can be represented as follows:
ϕ F v h , p = w 1 s i   ( 1 w 1 ) s j = 0.25 s 6 ( 1 0.25 ) s 5 = s k .
At the same time, and as mentioned before, this operator requires the non-increasing ordering of the linguistic terms, in accordance with their semantic, and therefore w 1 constitutes the weight associated to the term b i (the term with the higher semantic value), while 1 − w 1 represents the weight associated to b j (the term with the lowest semantic value). By substituting this into Equation (14), k can be determined, and with it, the linguistic term ( s k ) resulting from the aggregation.
k = m i n { 6 , 5 + r o u n d ( 0.25 ( 6 5 ) ) } = 5 ,
  s k = v h .
The linguistic values defining the evaluation of the remaining qualitative indicators were also determined in a similar way. These results can be appreciated in the last column of Table 2.
Next, the framework continues with the evaluation of the quantitative indicators, in this case the 3rd and 6th ones. In the case of the 3rd indicator, at the moment of the realization of this study in the company, it was well known that it behaved and reached values of around 90%; however, the defined reference value for it was 100%. As for the 6th indicator, it was also known that 25% of the production resources could be used in equipment repairs, however, the experts defined 30% as the reference value in this case. By implementing Equation (13), the following normalized values were obtained:
V n 3 = 1 1 0.90 1 = 0.90 ,
V n 6 = 1 0.30 0.25 0.30 = 0.83 .
On the other hand, the linguistic quantifier “All” was used for the homogenization process with a and b values equal to 0.5 and 1, respectively. Similarly, by making use of Equations (11) and (10) for the values V n 3 and V n 6 , it was possible to determine, in the case of indicator 3, that the M vector included only one element (vh), for that reason, this is the linguistic term that defines its evaluation. In the case of indicator 6, the M vector only included the term h, which also corresponded to its evaluation.
All these results were presented to the experts, and it was concluded that there was an adequate correspondence among the obtained evaluations for each indicator and its current state in the production plant. Subsequently, the application of the framework proceeded with module II. The paired comparisons between indicators were performed by the experts in a joint way, by using the approach described in steps 11 to 13 (see Section 3.3.1, Section 3.3.2 and Section 3.3.3). The results are shown in Figure 3.
As the paired comparisons were performed by the group of experts in a joint way, the weighting process quality was analyzed only by the consistency index. The number of triplets with total inconsistency was five, for instance, the triplet 2-4-8 to just cite one. The number of triplets with partial inconsistency was 21, for instance, the triplet 1-5-7 to just cite another one.
Similarly, making the necessary substitutions in Equation (21), it was also possible to determine the consistency index achieved whose value was 0.87. This value was higher than the minimal established value of 0.8. In Table 4, is also possible to appreciate the weight of each indicator, obtained by the Simple Ordering method.
Having, at this point, the evaluation and weight of each indicator, it was time to proceed with the aggregation process, which is detailed in the third module of the framework and leads to the obtaining of the PMII index. Before doing this, it was first necessary to use the negation operator over indicators 9 and 10, given that these were inversely proportional to the PMII index itself. Table 5 summarizes the final evaluation of each indicator, the linguistic term to be aggregated, as well as their weight values.
The n fixed-weight values to aggregate using the LOWA operator ( ϕ F ) required the definition of an ordered vector B, where its components are the n linguistic terms ordered in a non-increasing fashion according to their weights. The aggregation process implied the realization of n − 1 iterations, where, in each iteration i, two terms were aggregated, one of these being the result of the aggregation at iteration i − 1 and the other one the (n-i)th term of the ordered vector B. The operator ϕ F was applied over the following B and W vectors, which are:
B = (vh, h, m, h, h, vh, h, h, vh, l),
W = (0.182; 0.155; 0.155; 0.127; 0.109; 0.091; 0.072; 0.055; 0.036; 0.018).
According to vector Ws components, one subset of indicators of equal weight was identified. In this case, this subset is formed by indicators 5 and 9. The results of the aggregation of both indicators is shown in Table 6. For these two indicators of equal weight, the components of the vector β h are equal to 0.5, the same applies to the values w 1 and 1 − w 1 .
If we now use the linguistic term “high” (h) as the evaluation value for the same indicators 5 and 9, the new vector B can be expressed as follows:
B = (vh, h, h, h, h, vh, h, h, vh, l)
On the other hand, by keeping invariable the weight vector W and using Equation (20), it was possible to generate the corresponding adjusted weight vector β h . Using this vector, it was then also possible to generate the weight components w 1 and 1 − w 1 which were to be used in each aggregating iteration.
β h = ( 0.667 ;   0.652 ;   0.681 ;   0.667 ;   0.667 ;   0.668 ;   0.665 ;   0.671 ;   0.667 ;   0.333 )
Table 7 shows the result of the aggregation in each iteration. The last iteration provides the PMII index result, i.e., PMII = “very high” (vh). This result was contrasted with the opinions of the group of experts, and their agreement with the result was also verified.

A Partial Comparative Analysis in the Calculation of the PMII Index

To partially and further demonstrate the feasibility of our proposal, we proceed to determine the same PMII index by applying the LOWA operator in its original version ( F Q 1 ), as it appears in [20,23,28]. In this case, the weights of the terms to be aggregated are calculated from the concept of the relative quantifier ( Q 1 ).
As explained in Section 3.2.8, the application of the LOWA operator requires a non-decreasing ordering of the vector of linguistic terms B of to be aggregated; this ordering will be performed according to its semantics. Thus, considering the evaluation of each indicator that appears in Table 5, we have:
B = (vh, vh, vh, h, h, h, h, h, m, l)
In this case, the weight vector will be calculated from the application of the proportional fuzzy quantifier Q 1 , expressed in a numerical domain Q 1   [0, 1], as shown in [20]. Specifically, Q 1 ( r ) indicates the degree to which a portion r of objects satisfies the concept expressed by the quantifier Q 1 . This degree of satisfaction is calculated using the following equation:
Q 1 ( r ) = 0 i f   r < a r a b a i f   a   r   b 1 i f   r > b
With a and b the minimum and maximum values that define the semantics of the quantifier ( a , b , r   [0, 1]).
In terms of the original LOWA version, the weight w i of each indicator i if is calculated using Equation (25):
w i = Q 1 j n Q 1 ( j 1 n )
where j is the position occupied by indicator i within the ordered vector B.
Table 8 shows the evaluations and weights of the set of ordered indicators of the vector B calculated by Equation (25) according to this alternative comparison method, this using the LOWA operator in its original form. The majority proportional quantifier was used as defined in [20] with a = 0.3 and b = 0.8.
Table 9 shows the iterations of the aggregation of the indicators of the ordered vector B (from right to left as it is performed in the LOWA operator). As can be seen, indicators 9 and 10 are not considered in the aggregation process since both have a weight equal to zero. This is one of the limitations of the original approach and something we have solved with our modifications.
As a result of the application of this LOWA operator in its original formulation, the PMII index is evaluated as “high”. This result differs from the value obtained from our proposal since the original approach does not take into account the real weight of the indicators, but instead the weight is associated to and depends on its the evaluation of the indicator itself. This is something that in practice may be often far from reality, and thus we have proposed its modification.
To sum this partial comparison up, it is important to once more highlight the impact of the aggregation method proposed in this paper over the final result of the PMII index. In this sense, the idea of identifying subsets of indicators with the same weight and performing partial aggregations of these subsets, as was done in the case of indicators 5 and 9 (see Table 6), in order to later substitute the result into a global aggregation which considers all indicators, produces a different result to the one that would have been obtained in the case of simply establishing an arbitrary ordering of the vector B, by placing the linguistic term that defines the evaluation of indicator 9 (in this case m) before the term that defines the evaluation of the indicator 5 (term h), and considering both had equal weights. If this had been performed this way, the result of the PMII index after the global aggregation would have been “high” (h) instead.
In addition, given the non-linear character and non-decreasing monotonic characteristics of the aggregation operator used, it can be also seen how it produces a result that reflects, to a better extent, the state of the indicators of higher relative importance, which is usually a very favorable element from the practical point of view. In this case study, the indicator 1, evaluated as “very high”, concentrates around 20% of the weight.
Finally, based on the case study and the research presented here, it is also possible for the authors of this paper to conclude that the use of different well-known evaluation methods, as for instance, the Likert numeric scales or numeric operators such as the Weighted Average, would have produced a different result, a result influenced by a lack of flexibility of the numeric evaluation methods and the linear character of the mentioned operator. However, as indicated in the framework’s last step, it is still and always up to the experts involved in the study to evaluate the effectiveness of the results achieved.

5. Conclusions

The present research arose from a deep analysis of the states and practice, where it was verified that, although there had been good efforts and published works, none of the existing approaches had presented a clear method specifically designed to assess the importance of PM—MM integration. In this sense, the present paper presented a set of novel indicators and a framework enabling the realization of their evaluation, weighting, and aggregation. Based on this, it was possible to create and propose an index (PMII) that allows us to evaluate the importance of the PM—MM integration in a company. The conception of this index constitutes a useful tool within the decision-making process, as it justifies the level of efforts aimed at improving the level of integration between both processes. The authors firmly believe this all adds practical, methodological, and scientific value to our research and covers some of the gaps identified in the literature analysis.
The inclusion of Ordinal Fuzzy Linguistic Modeling for the evaluation of qualitative attributes made it possible to give an adequate treatment to the vagueness and imprecision that characterizes the evaluative judgment of experts, in addition to constituting a comfortable medium for the experts themselves when expressing their evaluations. The fact of allowing the possibility of characterizing the consensus achieved among experts also increases the power of this technique.
The proposed framework introduced a novel methodology to evaluate the consensus of the experts based on a proposal previously published in [20]. The proposed methodology includes key modifications regarding (1) the calculation of the consensus relationship by including the concept of distance between fuzzy numbers with a triangular membership function, and (2) a new way of generating the adjusted vector of weights ( β h ) used in the LOWA operator for the aggregation. Both of these modifications address limitations in the previous approaches, and thus we also believe that this constitutes part of the scientific and methodological value of our research.
On the other hand, the authors of this paper believe that part of the fundamental contributions of the study also lies in the same proposal of the set of original indicators that synthesize the different aspects of the PM—MM integration in the company. These indicators are, at the same time, the base for the calculation of the PMII index proposed.
Similarly, the weighting method proposed within this paper also includes a small modification of the well-known Fuller’s Triangle method to obtain the weights. This modification allows quantification of the level of consistency achieved during the paired comparisons, and thereby assessment of the level of quality achieved in this step. It also offers greater flexibility to the method, since it allows assigning of equal importance to each of the two indicators that are evaluated within the pair, something that was not possible with the scale presented by the original method. In addition, the fact of considering and using both qualitative and quantitative indicators together increases the flexibility of the proposed framework with respect to other partial (not equally oriented or as complete as this) proposals in the state of the art and practice, in which the indicators are presented either in a linguistic domain or in a numerical one.
The application of the proposals of this research into practical case study demonstrated its feasibility for real-world use, constituting a new method to highlight the need to improve PM and MM processes in the company and, even more, to achieve adequate coordination between both processes.
Future work will be oriented to information representation of the modeling using two tuples for the evaluation of qualitative indicators, what would lead to an even more efficient reduction of information losses. Future research will also encompass a feasibility analysis in terms of including in the findings in this paper a model based on linguistic hierarchies and unbalanced linguistic sets for the evaluation of certain indicators. Also, new approaches for the ordering of the linguistic terms to aggregate using the LOWA operator will be a subject of future investigation.

Author Contributions

Conceptualization, R.D.C., D.R.D.S. and E.M.D.L.P.M.; methodology, R.D.C., D.R.D.S., E.M.D.L.P.M. and J.P.; validation, R.D.C., D.R.D.S. and C.D.D.T.; formal analysis, R.D.C., D.R.D.S., E.M.D.L.P.M. and J.P.; investigation, R.D.C., D.R.D.S. and E.M.D.L.P.M.; resources, R.D.C., D.R.D.S., E.M.D.L.P.M. and J.P.; writing—original draft preparation, R.D.C., D.R.D.S. and C.D.D.T.; writing—review and editing, R.D.C., D.R.D.S., E.M.D.L.P.M., J.P. and C.D.D.T.; visualization, R.D.C. and D.R.D.S.; supervision, R.D.C., D.R.D.S., E.M.D.L.P.M. and J.P.; project administration, R.D.C. and D.R.D.S.; funding acquisition, D.R.D.S. and J.P. All authors have read and agreed to the published version of the manuscript.

Funding

This research was funded by the Ministry of Education, Youth and Sports of the Czech Republic and the Faculty of Mechanical Engineering VŠB-TUO, grant number SP2023/088.

Data Availability Statement

Data are contained within the article.

Acknowledgments

This paper has been developed in connection with the Students’ Grant Competition project SP2023/088 “Specific Research of Modern Manufacturing Technologies for Sustainable Economy” financed by the Ministry of Education, Youth and Sports of the Czech Republic and the Faculty of Mechanical Engineering VŠB-TUO. This support and funding are both gratefully acknowledged.

Conflicts of Interest

The authors declare no conflicts of interest.

References

  1. Zhao, Y.; He, Y.; Zhou, D.; Zhang, A.; Han, X.; Li, Y.; Wang, W. Functional risk-oriented integrated preventive maintenance considering product quality loss for multistate manufacturing systems. Int. J. Prod. Res. 2021, 59, 1003–1020. [Google Scholar] [CrossRef]
  2. Khatab, A.; Diallo, C.; Aghezzaf, E.-H.; Venkatadri, U. Integrated production quality and condition-based maintenance optimisation for a stochastically deteriorating manufacturing system. Int. J. Prod. Res. 2019, 57, 2480–2497. [Google Scholar] [CrossRef]
  3. Schutz, J.; Chelbi, A.; Rezg, N.; Ben Salem, S. Production and maintenance strategies for parallel machines with load transfer in case of failure. J. Qual. Maint. Eng. 2019, 25, 525–544. [Google Scholar] [CrossRef]
  4. Wakiru, J.M.; Pintelon, L.; Muchiri, P.; Chemweno, P. Integrated maintenance policies for performance improvement of a multi-unit repairable, one product manufacturing system. Prod. Plan. Control 2021, 32, 347–367. [Google Scholar] [CrossRef]
  5. Liu, Q.; Dong, M.; Chen, F.F. Single-machine-based joint optimization of predictive maintenance planning and production scheduling. Robot. Comput.-Integr. Manuf. 2018, 51, 238–247. [Google Scholar] [CrossRef]
  6. Ao, Y.; Zhang, H.; Wang, C. Research of Integrated Decision Model for Production Scheduling and Maintenance Planning with Economic Objective. Comput. Ind. Eng. 2019, 137, 106092. [Google Scholar] [CrossRef]
  7. Weinstein, L.; Cheng, C.-H. Integrating maintenance and production decisions in a hierarchical production planning environment. Comput. Oper. Res. 1999, 26, 1059–1074. [Google Scholar] [CrossRef]
  8. Kodali, R.; Mishra, R.P.; Anand, G. Justification of world class maintenance systems using analytic hierarchy constant sum method. J. Qual. Maint. Eng. 2009, 15, 47–77. [Google Scholar] [CrossRef]
  9. Robson, K.; Trimble, R.; MacIntyre, J. Creating and Sustaining a Maintenance Strategy: A Practical Guide. J. Bus. Adm. Res. 2013, 2, 77–83. [Google Scholar] [CrossRef]
  10. Robson, K.; Trimble, R.; MacIntyre, J. The inhibitors and enablers of maintenance and manufacturing strategy: A cross-case analysis. Int. J. Syst. Assur. Eng. Manag. 2014, 5, 107–117. [Google Scholar] [CrossRef]
  11. Garg, A.; Deshmukh, S.G. Flexibility in Maintenance: A Framework. Glob. J. Flex. Syst. Manag. 2009, 10, 21–34. [Google Scholar] [CrossRef]
  12. Naughton, M.D.; Tiernan, P. Individualising maintenance management: A proposed framework and case study. J. Qual. Maint. Eng. 2012, 18, 267–281. [Google Scholar] [CrossRef]
  13. Royo Sánchez, J.A.; Berges Muro, L.; Lope Domingo, M.A.; Aguilar Martín, J.J.; González Pedraza, R. Production and Maintenance Integrated Resource Planning Management System. In Proceedings of the 17th OrthoGES European Maintenance Congress, Barcelona, Spain, 11–13 May 2004. [Google Scholar]
  14. Jonsson, P. Towards an holistic understanding of disruptions in Operations Management. J. Oper. Manag. 2000, 18, 701–718. [Google Scholar] [CrossRef]
  15. Swanson, L. An empirical study of the relationship between production technology and maintenance management. Int. J. Prod. Econ. 1997, 53, 199–207. [Google Scholar] [CrossRef]
  16. Pinjala, S.K.; Pintelon, L.; Vereecke, A. An empirical investigation on the relationship between business and maintenance strategies. Int. J. Prod. Econ. 2006, 104, 214–229. [Google Scholar] [CrossRef]
  17. McKone, K.E.; Schroeder, R.G.; Cua, K.O. The impact of total productive maintenance practices on manufacturing performance. J. Oper. Manag. 2001, 19, 39–58. [Google Scholar] [CrossRef]
  18. Crespo Márquez, A.; Gupta, J. Contemporary maintenance management: Process, framework and supporting pillars. Int. J. Manag. Sci. 2006, 34, 313–326. [Google Scholar] [CrossRef]
  19. Espinilla, M.; Andrés, R.; Martínez, F.J.; Martínez, L. A 360 degree performance appraisal model dealing with heterogeneous information and dependent criteria. Inf. Sci. 2013, 222, 459–471. [Google Scholar] [CrossRef]
  20. Herrera, F.; Herrera-Viedma, E.; Verdegay, J.L. A model of consensus in group decision making under linguistic assessments. Fuzzy Sets Syst. 1996, 78, 73–87. [Google Scholar] [CrossRef]
  21. Xu, Z. EOWA and EWG Operators for aggregating linguistic labels based on linguistic preference relations. Int. J. Uncertain. Fuzziness Knowlege-Based Syst. 2004, 12, 791–810. [Google Scholar] [CrossRef]
  22. Peláez, J.I.; Doña, J.M.; Gómez Ruiz, J.A. Analysis of OWA operators in decision making for modelling the majority concept. Appl. Math. Comput. 2007, 186, 1263–1275. [Google Scholar] [CrossRef]
  23. Herrera, F.; Herrera-Viedma, E. Aggregation Operators for Linguistic Weighted Information. IEEE Trans. Syst. Man Cybern. Part A Syst. Hum. 1997, 27, 646–656. [Google Scholar] [CrossRef]
  24. Cabrerizo, F.J.; Alonso, S.; Herrera-Viedma, E. A consensus model for group decisions making problems with unbalance fuzzy linguistic information. Int. J. Inf. Technol. Decis. Mak. 2008, 8, 109–131. [Google Scholar] [CrossRef]
  25. Wang, L.; Xue, H. Group Decision-Making Method Based on Expert Classification Consensus Information Integration. Symmetry 2020, 12, 1180. [Google Scholar] [CrossRef]
  26. Labella, Á.; Rodríguez, R.M.; Alzahrani, A.A.; Martínez, L.A. Consensus Model for Extended Comparative Linguistic Expressions with Symbolic Translation. Mathematics 2020, 8, 2198. [Google Scholar] [CrossRef]
  27. Morillas, A. Introducción al Análisis de Datos Difusos. Curso de Doctorado en Economía Cuantitativa. Departamento de Estadística y Econometría, Universidad de Málaga, Málaga, Spain. 2000. Available online: https://www.studocu.com/latam/document/universidad-tecnologica-de-la-habana-jose-antonio-echeverria/ingenieria-de-software-i/antonio-morillas-raya-introduccion-al-analisis-de-datos-difusos/17491208 (accessed on 18 December 2023).
  28. Delgado, M.; Verdegay, J.L.; Vila, M.A. On Aggregation Operations of Linguistic Labels. Int. J. Intell. Syst. 1993, 8, 351–370. [Google Scholar] [CrossRef]
  29. Agarski, B.; Budak, I.; Kosec, B.; Hodolic, J. An approach to multi-criteria environmental evaluation with multiple weight assignment. Environ. Model. Assess. 2012, 17, 255–266. [Google Scholar] [CrossRef]
  30. Díaz Cazañas, R.; Delgado Sobrino, D.R. On the integration of production and maintenance planning at the tactical level: Proposal of a contribution procedure. Appl. Mech. Mater. 2014, 474, 35–41. [Google Scholar] [CrossRef]
Figure 1. Framework for the evaluation, weighting, and aggregation of indicators characterizing the importance of the PM—MM integration.
Mathematics 12 00338 g001
Figure 2. Adopted scale for evaluating the qualitative indicators.
Mathematics 12 00338 g002
Figure 3. Paired comparisons performed by the experts on the set of indicators.
Mathematics 12 00338 g003
Table 1. Proposed indicators for evaluating the importance of the PM—MM integration.
IndicatorsTheoretical Conceptions
  • Automatization level
In processes highly depend on equipment, the need of integration is higher than in those manpower-based processes [11,12,13,14,15,16].
2.
Competitiveness-driven approach
Companies with different competitive priorities follow different maintenance strategies [11,16].
3.
Rate of interventions with stopped machine
If this results in a high value, the maintenance strategy should focus more on reducing the mean time between interventions. It requires higher coordination between both departments to take advantage of opportunity windows in the production program.
4.
Complexity of the reparations
As maintainability decreases, the integration between both systems should increase to reduce the negative impact over availability.
5.
Impact of maintenance stops over production goals
This has to be considered by the maintenance department in order to develop prevention or consequences’ reduction strategies, definition of critical equipment, among others. According to [15], functional areas with low to no buffers should work in a coordinated way, otherwise small equipment interruptions can affect the whole system.
6.
Proportion of material resources common to production and maintenance
This should be considered in order to eliminate problems caused by information redundancy. The higher its level, the higher the needs of integration in areas such as inventory and suppliers’ management, design, and implementation of IT solutions in both systems, etc. [13].
7.
Level of technical Service required by the equipment
If it is high, it demands higher integration, which can lead to development of an autonomous maintenance and/or outsourcing maintenance strategy.
8.
Recognition of the need to adopt process-based management
As with the competitiveness-driven approach, the processes-based management approach forces the integration in the management of these processes, being a key and a particular case of the processes of PM and MM.
9.
Resource availability for maintenance
It is one of the elements that supports maintenance quality [11]. If it results in a high value, the need for integration decreases. Otherwise, it indicates the need for a coordinated work in the search of strategies to reach the required availability.
10.
Existence of redundant equipment
This decreases the tensions in reaching coordination between production and maintenance planning, because it avoids process interruptions by unexpected breakdowns or planned maintenance interventions that can overlap with production orders [14].
Table 2. Evaluations given by the experts to the indicators.
IndicatorsE1E2E3E4E5E6E7E8F.E
1vhpvhvhvhvhvhpvh
2hhmhhvhhhh
4vhvhhvhvhvhhvhvh
5hhhhphhhh
7hhhhhhhhh
8hhhlmhhhh
9mmmlmmmmm
10hmhhhhmhh
Table 3. Achieved consensus levels in the evaluation of the qualitative indicators.
Indicators v s i j G p n j p v l j p l j p m j p h j p v h j p p j C R j C L j
1 v h , p 2000000.7500.2500.625h
2 m , h , v h 30000.1250.7500.12500.593h
4 h , v h 200000.2500.75000.625h
5 h , p 200000.87500.1250.73vh
7 h 100001001p
8 l , m , h 3000.1250.1250.750000.593h
9 l , m 2000.1250.8750000.781p
10 m , h 30000.2500.750000.625h
Table 4. Weight of the indicators.
IndicatorsScoreRangeWeight
117100.182
2640.072
3420.036
4750.091
5158.50.155
61070.127
7860.109
8530.055
9158.50.155
10310.018
Table 5. Term to be aggregated and weight of each indicator.
IndicatorsEvaluationTerm to AggregateWeight
1vhvh0.182
2hh0.072
3vhvh0.036
4vhvh0.091
5hh0.155
6hh0.127
7hh0.109
8hh0.055
9mm0.155
10hl0.018
Table 6. Aggregation of indicators 5 and 9 through the operator ϕ F .
IterationsTerms to
Aggregate
ij
w 1
1 w 1
k
ϕ F
1h, m340.5000.5004h
Table 7. Aggregation of the indicators through the operator ϕ F .
Iterations Terms to
Aggregate
ij
w 1
1 w 1
k
ϕ F
1vh, l250.6670.3334h
2h, h440.6710.3294h
3h, h440.6650.3354h
4vh, h450.6880.3125vh
5h, vh450.3330.6674h
6h, h440.6670.3334h
7h, h440.6810.3194h
8h, h440.6520.3484h
9vh, h450.6670.3335vh
Table 8. Evaluations and weights of the set of ordered indicators according to the original version of the LOWA operator.
IndicatorsEvaluationTerm to AggregateWeight β h
1vhvh00
3vhvh00
4vhvh00
2hh0.20.2
5hh0.20.2
6hh0.20.2
7hh0.20.2
8hh0.20.2
9mm00
10hl00
Table 9. Aggregation of the indicators through the operator F Q 1 .
IterationsTerms to
Aggregate
ij
w 1
1 w 1
k
F Q 1
1h, h440.20.84h
2h, h440.20.84h
3h, h440.20.84h
4h, h440.20.84h
5h, vh450.01.04h
6h, vh450.01.04h
7h, vh450.01.04h
Disclaimer/Publisher’s Note: The statements, opinions and data contained in all publications are solely those of the individual author(s) and contributor(s) and not of MDPI and/or the editor(s). MDPI and/or the editor(s) disclaim responsibility for any injury to people or property resulting from any ideas, methods, instructions or products referred to in the content.

