Abstract
This study focuses on the scheduling problem of heterogeneous unmanned surface vehicles (USVs) with obstacle avoidance pretreatment. The goal is to minimize the overall maximum completion time of USVs. First, we develop a mathematical model for the problem. Second, with obstacles, an A* algorithm is employed to generate a path between two points where tasks need to be performed. Third, three meta-heuristics, i.e., simulated annealing (SA), genetic algorithm (GA), and harmony search (HS), are employed and improved to solve the problems. Based on problem-specific knowledge, nine local search operators are designed to improve the performance of the proposed algorithms. In each iteration, three Q-learning strategies are used to select high-quality local search operators. We aim to improve the performance of meta-heuristics by using Q-learning-based local search operators. Finally, 13 instances with different scales are adopted to validate the effectiveness of the proposed strategies. We compare with the classical meta-heuristics and the existing meta-heuristics. The proposed meta-heuristics with Q-learning are overall better than the compared ones. The results and comparisons show that HS with the second Q-learning, HS + QL2, exhibits the strongest competitiveness (the smallest mean rank value 1.00) among 15 algorithms.
MSC:
90B35
1. Introduction
Oceans cover two-thirds of the earth’s area [1]; however, most of the oceans have not been explored. Satellites, submersibles, and vessels are commonly used equipment in ocean exploration, each playing a role in different fields. Satellites are mainly used for ocean resource management and disaster monitoring by collecting large-scale and high-frequency ocean information [2]. However, satellites are affected by many factors, such as clouds, atmosphere, water color, etc., and cannot provide high-resolution and high-accuracy data [3]. Submersibles can directly observe and analyze seabed resources, such that direct data or samples can be obtained. Still, the operations of submersibles are affected by water pressure, temperature, and battery capacity. They cannot last for a long time or travel over a large area, and their execution needs vessels or satellites for support and positioning [4]. Vessels can serve as platforms for ocean exploration and are applied in many fields, such as marine environmental protection, channel measurement, and ocean observation.
Unmanned surface vehicles (USVs) are characterized by unattended operations, high payload capacity, low cost, and high maneuverability [5], and have been widely used in civil and military fields [6]. Xie et al. [7] proposed a hybrid partitioning patrol scheme, which divided the sea surface area into different importance levels and guides USVs to accomplish patrol tasks. Li et al. [8] addressed the maritime safety issue under severe weather conditions. Inspired by an immune–endocrine short feedback system, they presented a novel approach to make USVs able to fully exploit their strengths and accomplish patrol tasks in complex sea conditions. In terms of marine environment monitoring, Sutton et al. [9] conducted the first autonomous circumnavigation of Antarctica using a USV, measuring sea–air carbon dioxide, wind speed, and surface ocean properties. In [10], high-precision data were collected from the coastal water of Belize by using a USV equipped with pH and pCO2 sensors. Based on a wave-adaptive modular vessel USV, Sinisterra et al. [11] used a stereo vision-based method to track moving target vessels on the sea surface. Benefiting from the communication and carrying capacity of USVs, Shao et al. [12] proposed a collaborative unmanned surface vehicle–unmanned aerial vehicle platform. For collaborating unmanned surface vehicle–autonomous underwater vehicles, Lei Yang et al. [4] proposed three operation modes. Both teams used USVs as platforms to collaborate with UAVs and AUVs, respectively, extending the utilization and capabilities of the devices.
The main contributions of this study are summarized as follows:
- (1)
- a mixed integer linear programming model is established to describe the heterogeneous USV scheduling problems for minimizing the maximum completion time;
- (2)
- problem-specific knowledge-based nine neighborhood search operators are designed to improve the performance of metaheuristics;
- (3)
- three Q-learning strategies are proposed to guide the selection of premium neighborhood search operators during iterations.
The rest of this paper is structured as follows. Section 2 reviews the publications on this topic. Section 3 introduces the mathematical model for the USV scheduling problems. Section 4 presents the proposed algorithms. Section 5 reports the experiential results and comparisons, and finally, Section 6 summarizes the study and points out some future directions.
2. Literature Review
In this section, we present an overview of the published literature in four dimensions: path planning, meta-heuristic, Q-learning, and the problem’s heterogeneity.
Path planning of USVs on the sea surface is the basis for completing predetermined task objectives with high speed, safety, and energy efficiency. In [13], path planning problems were divided into two layers: local path planning and global one. In local path planning, robots have limited knowledge of the environment, while in global path planning, they have a complete understanding of the environment [13]. In our study, the known environmental information is relatively complete and remains stable over time, so a static and global path planning method is chosen [14]. Based on an automatic identification system service platform, Kai Yu et al. [14] proposed an improved A* algorithm, which allows ships to change their speed to avoid obstacles during global path planning. Yang et al. [15] proposed a global path planning algorithm based on a double deep Q network for the global path generation. In [16], a parallel evolutionary genetic algorithm (PEGA) was proposed, which was implemented on a chip by a hardware and software collaboration design method. The chip was used for global path planning of autonomous mobile robots. Yin et al. [17] combined an adaptive agent modeling with a rapidly exploring random tree star (RRT*) and proposed a reliability-based path planning algorithm ER-RRT* with better performance.
Meta-heuristics have been widely applied in engineering optimization and scheduling problems, such as traffic signal control [18], flow shop scheduling optimization [19], etc. Compared to other algorithms, meta-heuristics can balance the computational cost and the accuracy of the results [20]. They are also employed for solving task assignment and path planning problems [21]. Gemeinder et al. [22] used GA to design a mobile robot path planning software that focused on energy consumption. A hybrid of a GA and particle swarm optimization algorithm was developed to calculate the optimal path of fixed-wing unmanned aerial vehicles [23]. To improve the quality of the initial path, Nazarahari et al. [24] developed an enhanced genetic algorithm (EGA), which used five customized crossover and mutation operators for the robots’ path planning. An improved SA was developed by integrating two additional operators and path initialization rules in environments with static and dynamic obstacles [25]. Huo et al. [26] addressed UAV path planning problems in natural disaster rescue and battlefield collaborative action scenarios and proposed an improved GA algorithm by integrating simulated annealing to solve them. With the minimum energy consumption, Xiao et al. [27] designed an SA to balance task allocation and path planning for segmented multi-UAV image acquisition tasks. Based on five metaheuristics, Gao et al. [20] designed various heuristic rules and improving strategies to solve the scheduling problems of multiple USVs.
Meta-heuristics are prone to local optimum and have low convergence speed. As one of the most commonly used reinforcement learning algorithms, Q-learning has been employed to improve the performance of meta-heuristics in recent years [28,29,30,31]. Ren et al. [32] proposed a variable neighborhood search algorithm with Q-learning to solve disassembly line scheduling problems. In response to the slower learning speed of Q-learning, Low et al. [33] developed a modified Q-learning for path planning by optimizing path smoothness, time consumption, shortest distance, and total distance. Zhao et al. [34] proposed a hyper-heuristic algorithm with Q-learning to solve an energy-efficient distributed blocking flow shop scheduling problem. An efficient Q-learning was designed to solve path planning and obstacle avoidance problems for mobile robots, in which a new reward function was developed to improve the performance of Q-learning [35].
In the domain of unmanned vehicles (UVs) (such as AVs, UAVs, USVs, etc.), the problems related to heterogeneous UVs have attracted much attention. Heterogeneous UVs can be significantly more cost-effective and improve system performance by working cooperatively [36]. In large-scale applications, it is common for heterogeneous UAVs with different capabilities to cooperate [37]. Among the published works on heterogeneous USVs, some studies have explored task allocation [38], coordinated control [39, 40], and path planning [41]. However, the scheduling problem for heterogeneous USVs has been less considered.
3. Problem Description
The concerned problem involves the coordination and optimization of multiple heterogeneous USVs with different capabilities and constraints. With obstacles between some points where tasks are to be performed, the distance between them should be calculated in advance. The objective is to minimize the maximum competition time when all USVs finish their tasks.
Figure 1 shows an example with three USVs and 13 tasks, where different tasks are assigned to three vessels of different types. Due to their limited battery capacity, USVs may have to return to the starting point to change a battery and replenish energy during the tasks. In this study, the task points are presented by a two-dimensional plane space with a length and width of 100 units. As shown in Figure 2, the modeling of the environment consists of three parts: boundaries, obstacles, and task points. All task points and obstacles are distributed within the boundaries.
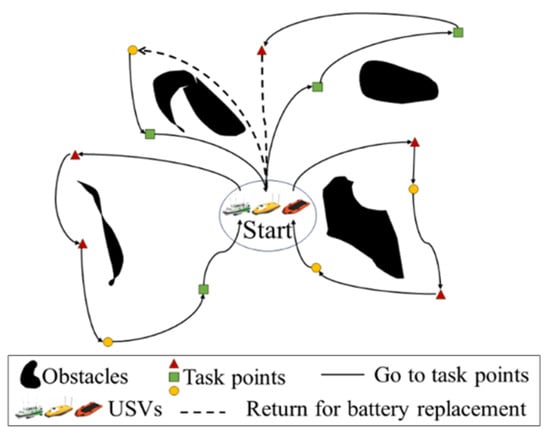
Figure 1.
An example of scheduling problems with heterogeneous USVs.
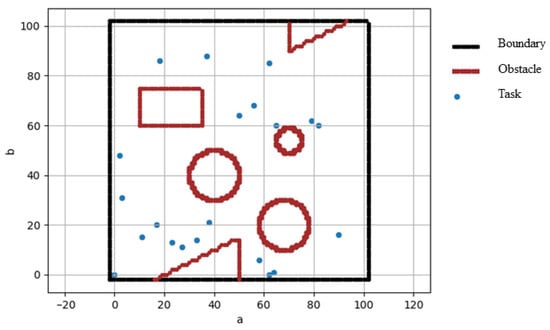
Figure 2.
An illustrative example of the environment model.
In this problem, we have tasks with types, and and , respectively, represent sets consisting of vessels and missions of the type , . There are USVs with types, ; the different types of USVs are denoted as . All tasks are processed independently, and each USV cannot be interrupted once a task is started until it is completed. Each task can only be performed by one vessel. The ship moving time between task points is included in the total completion time. When all assigned tasks are completed, a USV returns to its departure point.
The used notations in the model are described in Table 1.

Table 1.
The used notations in the model.
In real-life scenarios, many factors are challenging in the global planning stage, such as wind, waves, ocean currents, and emergencies. In this study, triangular fuzzy numbers (TFN) are used to make the model more realistic. The following methods perform addition, rank, and maximization operations for triangular fuzzy numbers.
Addition operation: two task times and , their addition is as follows.
Ranking operation: three criteria are used to compare and .
Max operation:
The mathematical model is formulated as follows:
s.t.
As shown in Equation (6), the objective is to minimize the maximum completion time, and the fitness values are expressed using TFN. The rules for calculating and comparing TFN follow Equations (1)–(5). Equation (7) is the travel time from task point i to task point j. Equation (8) expresses the time required for a single battery replacement. The total time for a USV to perform a task and travel to the next task point is given in Equation (9). In Equation (9), when the heterogeneous coefficient is infinity, it means that USVs of the same type with USV are unable to perform the same type of tasks with task . Equation (10) denotes the total time required for a USV to replace the battery. Equation (11) represents the completion time of USV k.
Equations (12)–(21) represent the corresponding constraints for the heterogeneous USV scheduling problems. Each task point should be visited once by a USV, which is indicated by constraints (12)–(14). Constraint (15) restricts that all USVs start from the departure point and return there after finishing all the assigned tasks. Constraints (16) and (17) limit the USV amount and index variables. Constraint (18) specifies that the completion time mapped by the start point is 0. Constraint (19) presents a limitation on the total battery capacity of the USVs. Constraints (20) and (21) place the types of tasks and boats.
4. Proposed Algorithms
There are two parts in this section, the first part is the preprocessing of the environment to avoid obstacles using the A* algorithm. The second part is the algorithm design, which includes the coding and decoding of the solution, the meta-heuristics, the local search operators, the Q-learning-based local search, and the framework of the proposed algorithms.
4.1. Path Search
A* algorithms are common for path planning [42] and one of the most effective methods for finding the shortest path in a static environment. They play a crucial role in the field of vehicle navigation. The flowchart of the A* algorithm is shown in Figure 3. When the A* algorithm starts iterating, it will search for the lowest cost grid around the starting point of the grid map. Then, it searches for the next lowest cost grid around this one and repeats the process until it arrives at the end point. The searched grids constitutes the shortest path from the start point to the end point. To solve the stationary obstacle avoidance problem for USVs, this study uses an A* algorithm to calculate the feasible path between task points to obtain the shortest path with obstacles being avoided.
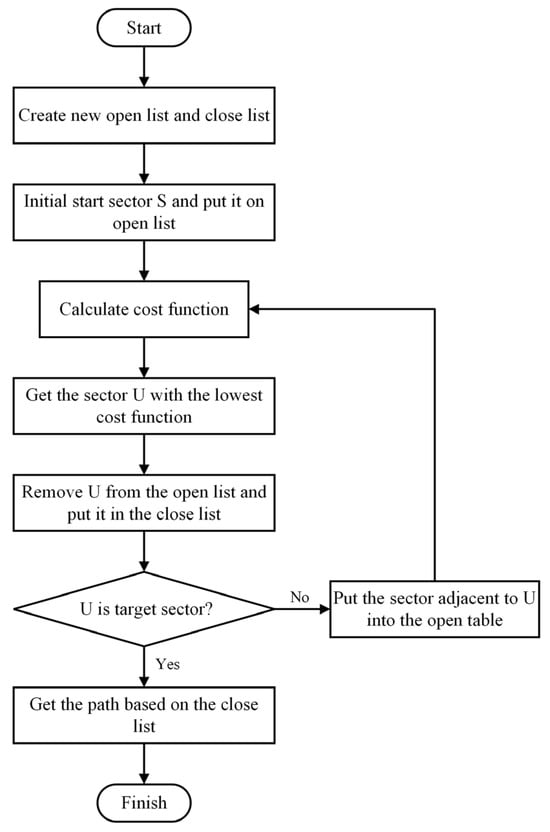
Figure 3.
Flowchart of A* algorithm.
An example of the A* algorithm for path searching is shown in Figure 4. The length of the shortest path found by the A* algorithm is used to calculate the travel time between task points S and F.
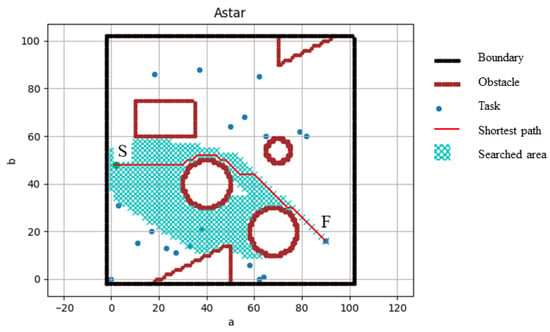
Figure 4.
An example of A* Algorithm for path searching.
4.2. Solution Representation
A USV scheduling problem is to assign tasks to USVs and sort the assigned tasks for each USV. According to the characteristics of the problems, we design an encoding strategy to represent a solution. It is in the form of . A USV with serial number is assigned to the sequence of tasks , where or is a vector with three elements denoted as to present the attributes of USVs or tasks. If has a value of 0, it represents a USV, while if it has a value of 1, it represents a task; gives the type of the USV or task; and indicates its index.
An example for a solution is shown in Figure 5. In this solution, three ships perform seven tasks. For example, element represents a USV with serial number 1 of type 2. Similarly, represents a task of type 2 with serial number 0. The solution can be represented as , and the sequence of tasks for each vessel can be represented as , , .
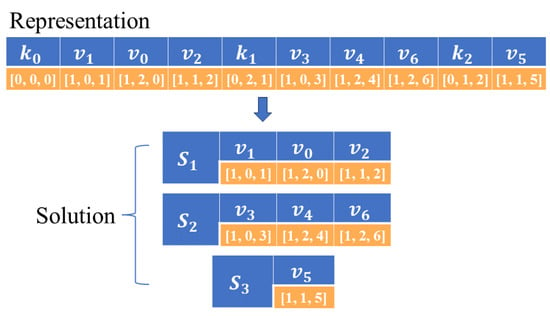
Figure 5.
Representation of a solution.
4.3. Meta-Heuristics
This study employs three meta-heuristics, GA, SA, and HS, and proposes their variants by applying Q-learning-based local search operators. The three algorithms are widely used for solving various optimization and scheduling problems [43,44]. Figure 6 shows the flowchart of the meta-heuristics.
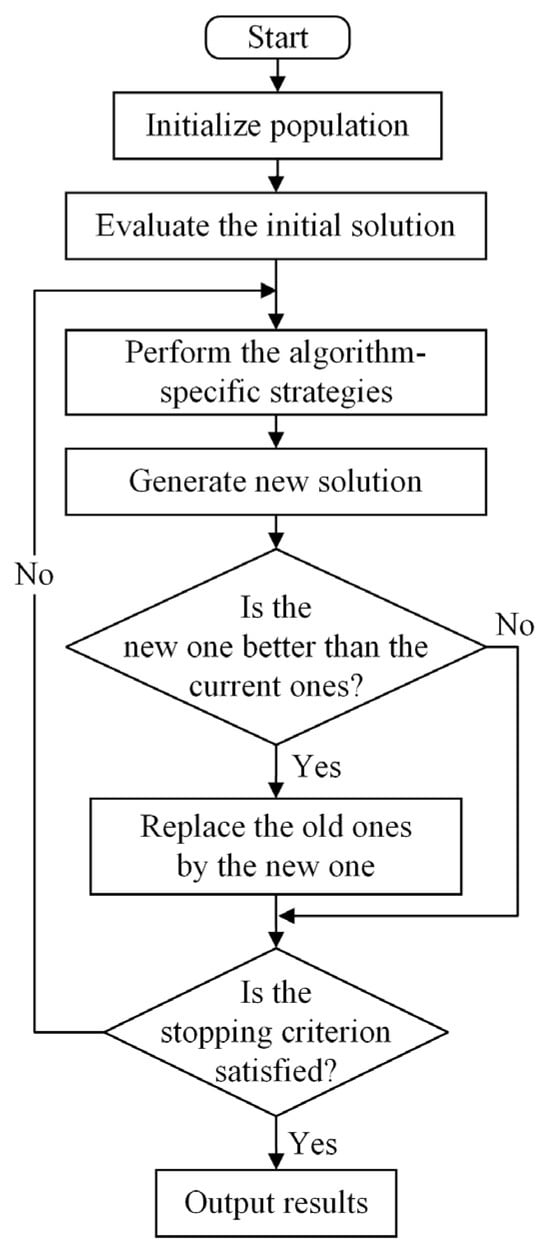
Figure 6.
Flowchart of meta-heuristics.
4.4. Local Search
Classical meta-heuristics are characterized by low convergence efficiency and easily fall into local optimum for combinatorial optimization and scheduling problems. Based on problem-specific knowledge, we design nine local search (LS) operators to improve the convergence and solutions’ quality and they are categorized into three types. The LS operators in the first type are for task assignment and sequencing of the same type of USVs, while the LSs of the second type are designed for different USV types. The third type of LSs are used for searching larger neighborhood space without considering heterogeneity.
Three LS operators, named as LS1, LS2, and LS3 in the first type, are designed to adjust the task allocation and completion order in the same type of USVs to find better neighbor solutions. As shown in Figure 7, LS1 is used to randomly select an element and insert it into another random position. LS2 selects two elements randomly and exchanges their positions. By LS3, a segment of a solution is randomly selected and the order of elements in it is reversed.
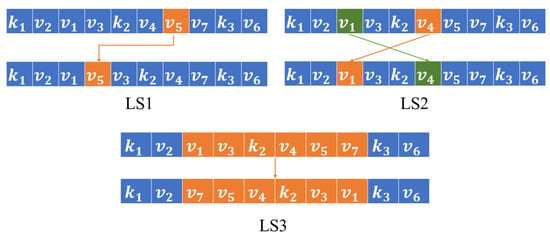
Figure 7.
Example of LS1, LS2, and LS3.
The LS operators in the second type consider the heterogeneity of the USVs. LS4 selects an element randomly and inserts it into the sequence of a heterogeneous USV that is also randomly selected. LS5 exchanges the positions of two randomly selected elements from the sequences of two heterogeneous USVs. By LS6, a segment of a solution is randomly selected where the tasks belong to heterogeneous USVs. Reverse operation is executed on these elements and the assigned USV of each task may be changed. The detail for LS6 is shown in Figure 8.
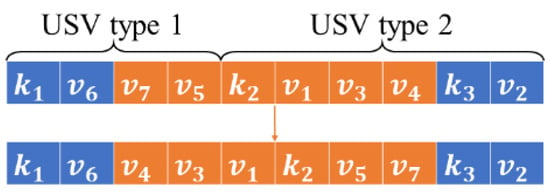
Figure 8.
Example of LS6.
To extend the local search space, the third type of LSs are proposed, which do not consider the heterogeneity of USVs and use different neighborhood structures from the previous ones. In the third type, there are three LSs called LS7, LS8, and LS9. As shown in Figure 9, LS7 randomly selects two segments of equal-length sequences from a solution and then mixes them by inserting the elements one by one. LS8 randomly selects and inserts it into a random position. By LS9, a segment of sequence with a random length is selected, and then a reverse operation is executed on it. After that, it is inserted into a random position of the original solution.
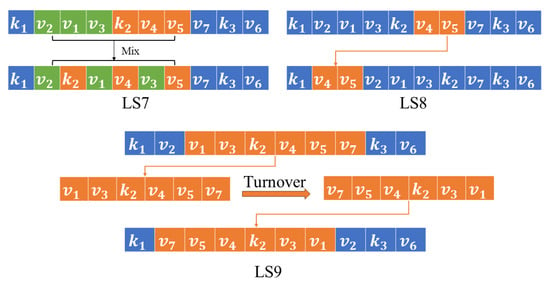
Figure 9.
Example of LS7, LS8, and LS9.
4.5. Q-Learning
Q-learning is a kind of reinforcement learning algorithm. As a method of decision-making, it evaluates an agent’s behavior based on feedback from the environment and stores the evaluation value of each action. The agent forms experience by constantly interacting with the environment. The agent gains experience, chooses more appropriate actions, and eventually reaches a decision that is closer to the global optimum. In the Q-table, Q-value records the impact of different actions on the long-term reward under different states. The optimal Q-value in the Q-table determines the selected action at each time. The update formula of the Q-value is as follows.
where and represent the state and action of an agent at step ; is the reward obtained by the agent executing action ; denotes the state at step , while represents the maximum Q-value corresponding to the actions under state ; means the learning rate, while represents the discount factor.
After each interaction with the environment, the agent adjusts the Q-value of the current state-action pair according to the observed reward and the maximum Q-value of the next state. By repeating this process continuously, the agent can gradually approach the optimal Q-value function and choose the optimal behavior accordingly.
4.6. Q-Learning-Based Local Search
4.6.1. The First Q-Learning-Based Local Search (QL1)
By QL1, the states in the Q-table are set to be the task load ratios that match the ship type. A group of four numbers represents the task load ratios of the ship cluster. The task load ratios are divided into zero matching, low proportion matching, medium proportion matching, and high proportion matching. They represent that the number of tasks assigned to a ship that matches the ship type accounts for 0%, 1–33.33%, 33.34–66.66%, and 66.67–100% of their total loads, respectively. As shown in Figure 10, state S = [0, 1, 1, 2] means that the numbers of USVs under four ratio states are 0, 1, 1, 2. The actions in the Q-table are set to nine local search operators, as shown in Table 2.

Figure 10.
An example of the state for QL1.

Table 2.
The Q-table of QL1.
In the initial Q-table, all Q-values are set to 100, and all actions have an equal probability of being selected. After executing an action, the Q-value is updated according to the following formula:
where θ is the discount rate, and represent the fitness values of the current solution and the new one, respectively.
4.6.2. The Second Q-Learning-Based Local Search (QL2)
By QL2, the states in the Q-table are set to be the loads of USVs in the ship cluster. Similar to QL1, QL2 uses four numbers to represent a state. As shown in Figure 11, each value represents the number of USVs and its position denotes the USVs’ workload. The workloads are described as 0–25%, 26–50%, 51–75%, and 76–100%, respectively. In a state S = [2,1,1,0], each value means the number of USVs under the corresponding task load.

Figure 11.
An example of the state for QL2.
Similar to QL1, the actions of QL2 are the nine local search operators. In the initial Q-table, all Q-values are also set to 100, and the initial probability of selecting each local search operator is the same.
4.6.3. The Third Q-Learning-Based Local Search (QL3)
By QL3, a general strategy is adopted without designing a special state identifier for the problem. The nine local search operators are treated as both states and actions. It focuses on optimizing the execution order of neighborhood search operators. As shown in Table 3, both the states and actions are the nine local search operators. For example, if the current state is , an action is executed in the last iteration. If is chosen as an action currently, after executing it, the state is changed to .

Table 3.
The Q-table of QL3.
4.7. The Framework of the Proposed Algorithms
This study proposes three Q-learning strategies to guide local search selection, which are embedded into three meta-heuristics: GA, SA, and HS. The framework of the proposed algorithms is shown in Figure 12. First, the population is initialized by the solutions generated in Section 4.2, and then the initial solutions are evaluated. Second, new solutions are generated by the algorithm-specific strategies. Then, the QL-based local search strategies in Section 4.6 further optimize the solutions by meta-heuristics. Finally, it repeats the whole iteration process until the termination condition is reached, and then outputs the best results.
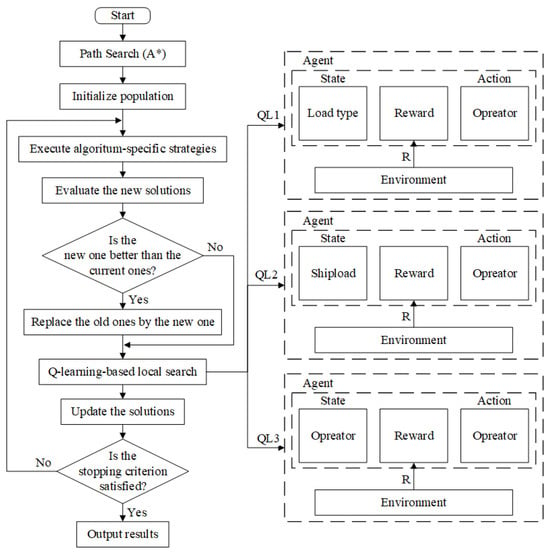
Figure 12.
The flow chart of the proposed algorithms.
5. Experiments and Discussion
5.1. Experimental Setup
To evaluate the effectiveness of the improved algorithms, we solve 13 cases with different scales from a USV company in China. The number of USVs is changed from 2 to 8, while the number of tasks is changed from 20 to 120, and there are 3 types of USVs and tasks included in each case. There are few publications used to solve the heterogeneous USVs scheduling problems with obstacle avoidance. In this study, we compare three classical meta-heuristics and their 12 variants, including different local search operators and Q-learning-based local search selection strategies. All algorithms are coded in Python and run on a computer equipped with Intel® Core™-12400 @2.50 GHz with 32.0 GB of memory. To make a fair comparison, each instance is run independently 30 times and the run time is set as follows:
where is the number of tasks while represents the number of USVs. The Q-tables in the three Q-learning strategies are updated online. The parameters’ setting of Q-learning and meta-heuristics are shown in Table 4 and Table 5.

Table 4.
Parameter setting of the meta-heuristics.

Table 5.
Parameter setting of Q-learning.
5.2. Effectiveness of Proposed Strategies
In this sub-section, three meta-heuristics (SA, GA, and HS) and their variants based on the local search operators (SA + LS, GA + LS, and HS + LS) and the variants using Q-learning-based strategies to guide the local search (SA + QL1, SA + QL2, SA + QL3, GA + QL1, GA + QL2, GA + QL3, HS + QL1, HS + QL2, and HS + QL3) are evaluated and compared.
Table 6, Table 7 and Table 8 show the average fitness and CV values obtained by all the compared algorithms for the 13 cases. The CV values are calculated using the following formula:
where is the standard deviation and is the mean of the results obtained in 30 runs of a case by one algorithm. The best results are shown in bold. We find that the meta-heuristics with Q-learning-based local search strategies perform better than others in their respective groups.

Table 6.
Statistical results by SA and its variants.

Table 7.
Statistical results by GA and its variants.

Table 8.
Statistical results by HS and its variants.
To further validate the effectiveness of the local search operators and Q-learning strategies, we execute the Friedman test on meta-heuristics (SA, GA, and HS) and their variants, respectively. The results are presented in Figure A1, Figure A2, Figure A3, Figure A4, Figure A5, Figure A6 and Figure A7 in Appendix A. After analyzing the results, we can conclude that the three algorithms, SA + QL3, GA + QL1, and HS + QL2 achieved better performance than their peers in the respective groups. It can be concluded that the proposed Q-learning guided local search strategies can improve the performance of the basic meta-heuristics and their variants with randomized local search strategy.
5.3. Statistical Test
To further analyze the performance difference among SA + QL3, GA + QL3, and HS + QL2. The Friedman test is executed on their results for 13 cases, as shown in Figure 13. The asymptotic significance (Asympt. Sig.) is much less than 0.05. This means that there is a significant performance difference among the three algorithms. The three algorithms are ranked using the Nemenyi post hoc test, and the results are shown in Figure 14. In this test, the algorithms with smaller average ranking values have better performance. The average ranking value (1.00) of HS + QL2 is lower compared to the ones by SA + QL3 and GA + QL3. The two-way analysis of variance by rank for the three algorithms is given in Figure 15. This test shows the distribution of rankings achieved by the algorithms for thirteen examples. It can be observed that the HS + QL2 achieves the best results for most cases. Hence, we can conclude that the HS + QL2 is more competitive than its peers.
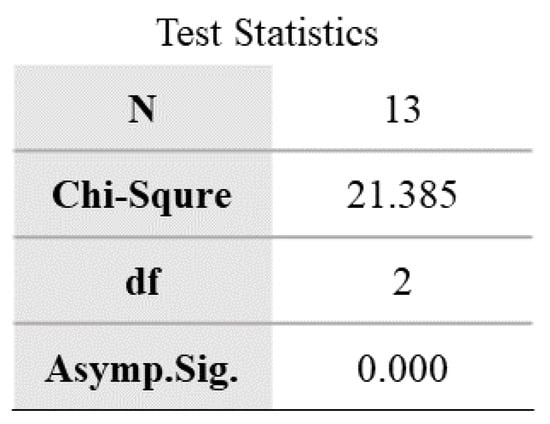
Figure 13.
The test statistics of the three algorithms.
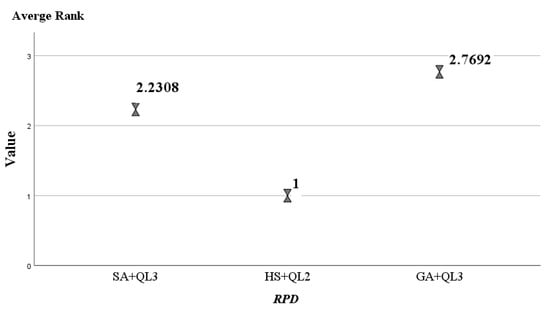
Figure 14.
The Nemenyi post hoc test of the three algorithms.
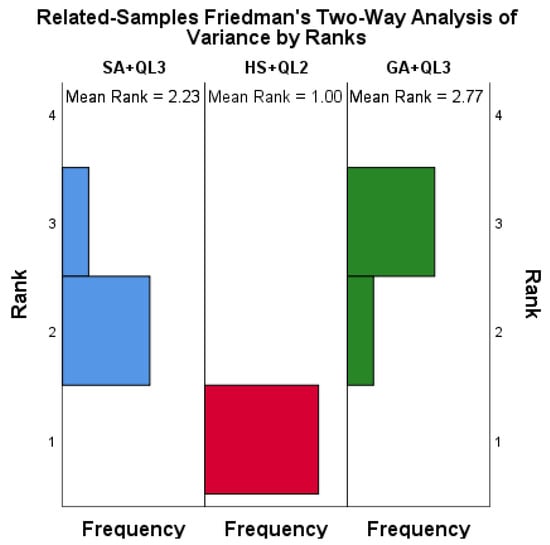
Figure 15.
The Rank distribution of the three algorithms.
To present the convergence of the three algorithms clearly, Figure 16 shows the convergence curves of them for the largest instance, “8 × 120”. The convergence curves of another case are shown in Figure A8, Figure A9, Figure A10 and Figure A11 in Appendix B. It can be seen from the figure that the convergence of HS + QL2 performs the best among the three algorithms, and its final result is also better than those of its peers.
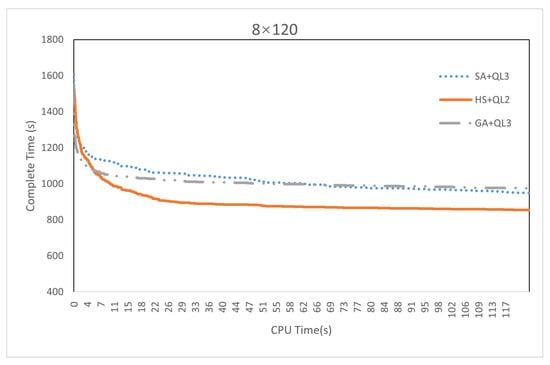
Figure 16.
The convergence curves of the three algorithms for the largest case.
5.4. Compare with Existing Algorithms
The SA + QL3, GA + QL3, and HS + QL2 are compare with PSO_LS and PSO_QL in [20]. Table 9 shows the average fitness values obtained by the five algorithms. From Table 9, it can be observed that the results by SA + QL3, GA + QL3, and HS + QL2 are better than those by PSO_LS and PSO_QL. The HS + QL2 obtains the best average values for all instances. It can be concluded that HS + QL2 has the best performance for solving the heterogeneous USV scheduling problems.

Table 9.
Comparison of average fitness values for five meta-heuristics.
6. Conclusions and Future Work
In this study, Q-learning is employed to guide three meta-heuristics to select the appropriate local search operators for solving the heterogeneous USV scheduling problems. Based on the nature of the problem, we propose nine local search operators and design three different Q-learning strategies. The performance of the proposed local search operators and the Q-learning strategies are verified by solving 13 instances with different scales. We have compared the proposed meta-heuristics with Q-learning strategies to the existing algorithms. The experimental results and analysis suggest that the proposed algorithms perform better than the peers.
The future research directions are as follows:
- (1)
- consider more objectives such as energy consumption, carbon emission, and safety;
- (2)
- design more approaches to integrate meta-heuristics and reinforcement learning algorithms;
- (3)
- extend the algorithms to solve more USV scheduling and optimization problems.
Author Contributions
Conceptualization, Z.M.; methodology, Z.M., K.G. and H.Y.; writing—original draft preparation, Z.M. and H.Y.; writing, review, and editing, K.G. and N.W.; supervision, K.G. All authors have read and agreed to the published version of the manuscript.
Funding
This study is partially supported by the Zhuhai Industry–University–Research Project with Hongkong and Macao under Grant ZH22017002210014PWC, the National Natural Science Foundation of China under Grant 62173356, the Science and Technology Development Fund (FDCT), Macau SAR, under Grant 0019/2021/A, the Guangdong Basic and Applied Basic Research Foundation (2023A1515011531), and research on the Key Technologies for Scheduling and Optimization of Complex Distributed Manufacturing Systems (22JR10KA007).
Data Availability Statement
No new data were created or analyzed in this study. Data sharing is not applicable to this article.
Conflicts of Interest
The authors declare no conflicts of interest.
Appendix A
The Friedman test is performed to verify the improvement of the new strategies over the meta-heuristics. From Figure A1, it can be seen that the asymptotic significance (Asympt. Sig.) for the three basic algorithms with their variants is much less than 0.05. It means that the basic algorithms are significantly different from their improved variants.
These algorithms were ranked using the Nemenyi post hoc test, and the resulting rankings are shown in Figure A2, Figure A3 and Figure A4. In the three groups, the three algorithms, SA + QL3, GA + QL3, and HS + QL2 have the smallest average ranking values (1.08, 2.15, and 1.77), respectively. Friedmann’s two-way analysis of variance by rank gives a clearer presentation of the instance distribution for the compared algorithms, as shown in Figure A5, Figure A6 and Figure A7. It can be seen that SA + QL3, GA + QL3, and HS + QL2 achieve the best results in most cases.

Figure A1.
Friedman Test of meta-heuristics and their variants.
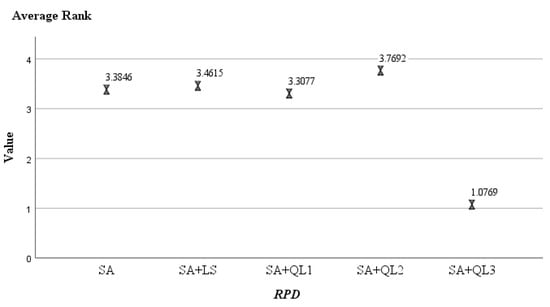
Figure A2.
The Nemenyi post hoc test of SA and their variants.
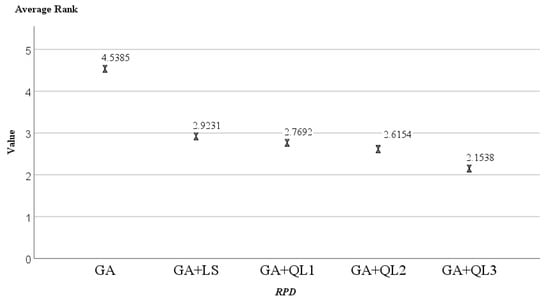
Figure A3.
The Nemenyi post hoc test of GA and their variants.
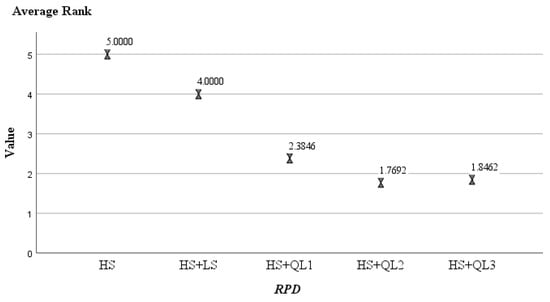
Figure A4.
The Nemenyi post hoc test of HS and their variants.
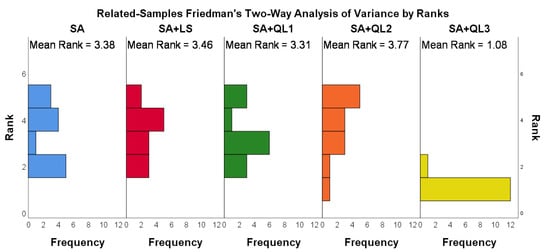
Figure A5.
The Rank distribution of SA and their variants.
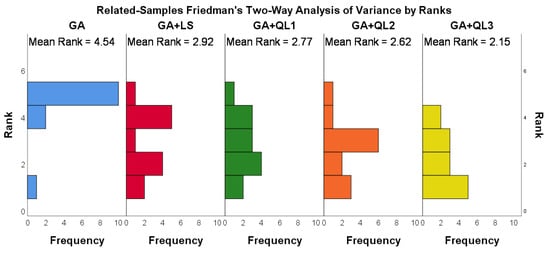
Figure A6.
The Rank distribution of GA and their variants.
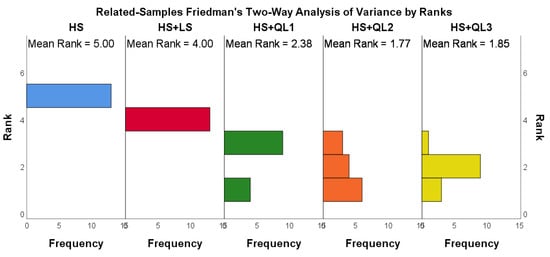
Figure A7.
The Rank distribution of HS and their variants.
Appendix B
As shown in Figure A8, Figure A9, Figure A10 and Figure A11, we provide the convergence curves for the cases corresponding to the maximum number of tasks with two-USVs, four-USVs, six-USVs, and eight-USVs.
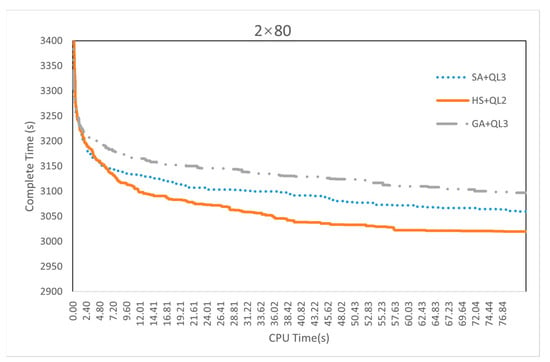
Figure A8.
The convergence curves of the three algorithms for case “2 × 80”.
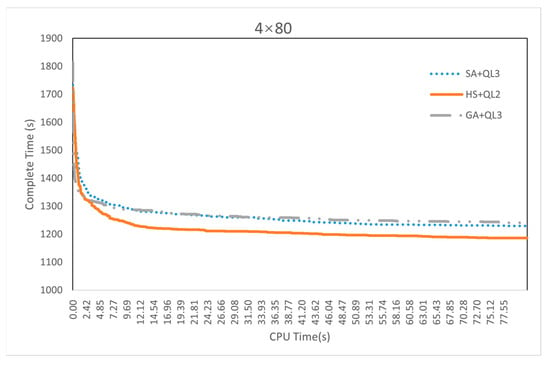
Figure A9.
The convergence curves of the three algorithms for case “4 × 80”.
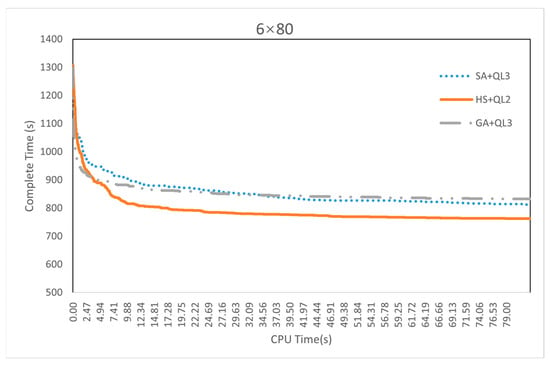
Figure A10.
The convergence curves of the three algorithms for case “6 × 80”.
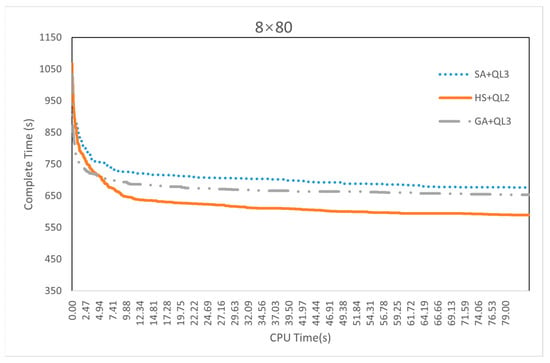
Figure A11.
The convergence curves of the three algorithms for case “8 × 80”.
References
- Yuh, J.; Marani, G.; Blidberg, D.R. Applications of Marine Robotic Vehicles. Intel. Serv. Robot. 2011, 4, 221–231. [Google Scholar] [CrossRef]
- Xingfa, G.; Xudong, T. Overview of China Earth Observation Satellite Programs [Space Agencies]. IEEE Geosci. Remote Sens. Mag. 2015, 3, 113–129. [Google Scholar] [CrossRef]
- McCarthy, M.J.; Colna, K.E.; El-Mezayen, M.M.; Laureano-Rosario, A.E.; Méndez-Lázaro, P.; Otis, D.B.; Toro-Farmer, G.; Vega-Rodriguez, M.; Muller-Karger, F.E. Satellite Remote Sensing for Coastal Management: A Review of Successful Applications. Environ. Manag. 2017, 60, 323–339. [Google Scholar] [CrossRef] [PubMed]
- Yang, L.; Zhao, S.; Wang, X.; Shen, P.; Zhang, T. Deep-Sea Underwater Cooperative Operation of Manned/Unmanned Submersible and Surface Vehicles for Different Application Scenarios. JMSE 2022, 10, 909. [Google Scholar] [CrossRef]
- Sotelo-Torres, F.; Alvarez, L.V.; Roberts, R.C. An Unmanned Surface Vehicle (USV): Development of an Autonomous Boat with a Sensor Integration System for Bathymetric Surveys. Sensors 2023, 23, 4420. [Google Scholar] [CrossRef] [PubMed]
- Ren, R.-Y.; Zou, Z.-J.; Wang, Y.-D.; Wang, X.-G. Adaptive Nomoto Model Used in the Path Following Problem of Ships. J. Mar. Sci. Technol. 2018, 23, 888–898. [Google Scholar] [CrossRef]
- Xie, J.; Zhou, R.; Luo, J.; Peng, Y.; Liu, Y.; Xie, S.; Pu, H. Hybrid Partition-Based Patrolling Scheme for Maritime Area Patrol with Multiple Cooperative Unmanned Surface Vehicles. J. Mar. Sci. Eng. 2020, 8, 936. [Google Scholar] [CrossRef]
- Huang, L.; Zhou, M.; Hao, K. Non-Dominated Immune-Endocrine Short Feedback Algorithm for Multi-Robot Maritime Patrolling. IEEE Trans. Intell. Transport. Syst. 2020, 21, 362–373. [Google Scholar] [CrossRef]
- Sutton, A.J.; Williams, N.L.; Tilbrook, B. Constraining Southern Ocean CO2 Flux Uncertainty Using Uncrewed Surface Vehicle Observations. Geophys. Res. Lett. 2021, 48, e2020GL091748. [Google Scholar] [CrossRef]
- Cryer, S.; Carvalho, F.; Wood, T.; Strong, J.A.; Brown, P.; Loucaides, S.; Young, A.; Sanders, R.; Evans, C. Evaluating the Sensor-Equipped Autonomous Surface Vehicle C-Worker 4 as a Tool for Identifying Coastal Ocean Acidification and Changes in Carbonate Chemistry. J. Mar. Sci. Eng. 2020, 8, 939. [Google Scholar] [CrossRef]
- Sinisterra, A.J.; Dhanak, M.R.; Von Ellenrieder, K. Stereovision-Based Target Tracking System for USV Operations. Ocean Eng. 2017, 133, 197–214. [Google Scholar] [CrossRef]
- Shao, G.; Ma, Y.; Malekian, R.; Yan, X.; Li, Z. A Novel Cooperative Platform Design for Coupled USV–UAV Systems. IEEE Trans. Ind. Inf. 2019, 15, 4913–4922. [Google Scholar] [CrossRef]
- Zafar, M.N.; Mohanta, J.C. Methodology for Path Planning and Optimization of Mobile Robots: A Review. Procedia Comput. Sci. 2018, 133, 141–152. [Google Scholar] [CrossRef]
- Yu, K.; Liang, X.; Li, M.; Chen, Z.; Yao, Y.; Li, X.; Zhao, Z.; Teng, Y. USV Path Planning Method with Velocity Variation and Global Optimisation Based on AIS Service Platform. Ocean Eng. 2021, 236, 109560. [Google Scholar] [CrossRef]
- Xiaofei, Y.; Yilun, S.; Wei, L.; Hui, Y.; Weibo, Z.; Zhengrong, X. Global Path Planning Algorithm Based on Double DQN for Multi-Tasks Amphibious Unmanned Surface Vehicle. Ocean Eng. 2022, 266, 112809. [Google Scholar] [CrossRef]
- Tsai, C.-C.; Huang, H.-C.; Chan, C.-K. Parallel Elite Genetic Algorithm and Its Application to Global Path Planning for Autonomous Robot Navigation. IEEE Trans. Ind. Electron. 2011, 58, 4813–4821. [Google Scholar] [CrossRef]
- Yin, J.; Hu, Z.; Mourelatos, Z.P.; Gorsich, D.; Singh, A.; Tau, S. Efficient Reliability-Based Path Planning of Off-Road Autonomous Ground Vehicles Through the Coupling of Surrogate Modeling and RRT. IEEE Trans. Intell. Transport. Syst. 2023, 43, 15035–15050. [Google Scholar] [CrossRef]
- Gao, K.; Zhang, Y.; Su, R.; Yang, F.; Suganthan, P.N.; Zhou, M. Solving Traffic Signal Scheduling Problems in Heterogeneous Traffic Network by Using Meta-Heuristics. IEEE Trans. Intell. Transport. Syst. 2019, 20, 3272–3282. [Google Scholar] [CrossRef]
- Kuo, I.-H.; Horng, S.-J.; Kao, T.-W.; Lin, T.-L.; Lee, C.-L.; Terano, T.; Pan, Y. An Efficient Flow-Shop Scheduling Algorithm Based on a Hybrid Particle Swarm Optimization Model. Expert Syst. Appl. 2009, 36, 7027–7032. [Google Scholar] [CrossRef]
- Gao, M.; Gao, K.; Ma, Z.; Tang, W. Ensemble Meta-Heuristics and Q-Learning for Solving Unmanned Surface Vessels Scheduling Problems. Swarm Evol. Comput. 2023, 82, 101358. [Google Scholar] [CrossRef]
- Liu, L.; Wang, X.; Yang, X.; Liu, H.; Li, J.; Wang, P. Path Planning Techniques for Mobile Robots: Review and Prospect. Expert Syst. Appl. 2023, 227, 120254. [Google Scholar] [CrossRef]
- Gemeinder, M.; Gerke, M. GA-Based Path Planning for Mobile Robot Systems Employing an Active Search Algorithm. Appl. Soft Comput. 2003, 3, 149–158. [Google Scholar] [CrossRef]
- Roberge, V.; Tarbouchi, M.; Labonte, G. Comparison of Parallel Genetic Algorithm and Particle Swarm Optimization for Real-Time UAV Path Planning. IEEE Trans. Ind. Inf. 2013, 9, 132–141. [Google Scholar] [CrossRef]
- Nazarahari, M.; Khanmirza, E.; Doostie, S. Multi-Objective Multi-Robot Path Planning in Continuous Environment Using an Enhanced Genetic Algorithm. Expert Syst. Appl. 2019, 115, 106–120. [Google Scholar] [CrossRef]
- Miao, H.; Tian, Y.-C. Dynamic Robot Path Planning Using an Enhanced Simulated Annealing Approach. Appl. Math. Comput. 2013, 222, 420–437. [Google Scholar] [CrossRef]
- Huo, L.; Zhu, J.; Wu, G.; Li, Z. A Novel Simulated Annealing Based Strategy for Balanced UAV Task Assignment and Path Planning. Sensors 2020, 20, 4769. [Google Scholar] [CrossRef] [PubMed]
- Xiao, S.; Tan, X.; Wang, J. A Simulated Annealing Algorithm and Grid Map-Based UAV Coverage Path Planning Method for 3D Reconstruction. Electronics 2021, 10, 853. [Google Scholar] [CrossRef]
- Zhao, F.; Zhou, G.; Wang, L. A Cooperative Scatter Search with Reinforcement Learning Mechanism for the Distributed Permutation Flowshop Scheduling Problem with Sequence-Dependent Setup Times. IEEE Trans. Syst. Man Cybern. Syst. 2023, 53, 4899–4911. [Google Scholar] [CrossRef]
- Zhao, F.; Wang, Q.; Wang, L. An Inverse Reinforcement Learning Framework with the Q-Learning Mechanism for the Metaheuristic Algorithm. Knowl. Based Syst. 2023, 265, 110368. [Google Scholar] [CrossRef]
- Zhao, F.; Wang, Z.; Wang, L. A Reinforcement Learning Driven Artificial Bee Colony Algorithm for Distributed Heterogeneous No-Wait Flowshop Scheduling Problem with Sequence-Dependent Setup Times. IEEE Trans. Automat. Sci. Eng. 2022, 20, 2305–2320. [Google Scholar] [CrossRef]
- Yu, H.; Gao, K.-Z.; Ma, Z.-F.; Pan, Y.-X. Improved Meta-Heuristics with Q-Learning for Solving Distributed Assembly Permutation Flowshop Scheduling Problems. Swarm Evol. Comput. 2023, 80, 101335. [Google Scholar] [CrossRef]
- Ren, Y.; Gao, K.; Fu, Y.; Sang, H.; Li, D.; Luo, Z. A Novel Q-Learning Based Variable Neighborhood Iterative Search Algorithm for Solving Disassembly Line Scheduling Problems. Swarm Evol. Comput. 2023, 80, 101338. [Google Scholar] [CrossRef]
- Low, E.S.; Ong, P.; Low, C.Y.; Omar, R. Modified Q-Learning with Distance Metric and Virtual Target on Path Planning of Mobile Robot. Expert Syst. Appl. 2022, 199, 117191. [Google Scholar] [CrossRef]
- Zhao, F.; Di, S.; Wang, L. A Hyperheuristic With Q-Learning for the Multiobjective Energy-Efficient Distributed Blocking Flow Shop Scheduling Problem. IEEE Trans. Cybern. 2023, 53, 3337–3350. [Google Scholar] [CrossRef] [PubMed]
- Maoudj, A.; Hentout, A. Optimal Path Planning Approach Based on Q-Learning Algorithm for Mobile Robots. Appl. Soft Comput. 2020, 97, 106796. [Google Scholar] [CrossRef]
- Zhao, X.; Zong, Q.; Tian, B.; Zhang, B.; You, M. Fast Task Allocation for Heterogeneous Unmanned Aerial Vehicles through Reinforcement Learning. Aerosp. Sci. Technol. 2019, 92, 588–594. [Google Scholar] [CrossRef]
- Chen, J.; Ling, F.; Zhang, Y.; You, T.; Liu, Y.; Du, X. Coverage Path Planning of Heterogeneous Unmanned Aerial Vehicles Based on Ant Colony System. Swarm Evol. Comput. 2022, 69, 101005. [Google Scholar] [CrossRef]
- Tan, G.; Zhuang, J.; Zou, J.; Wan, L. Multi-Type Task Allocation for Multiple Heterogeneous Unmanned Surface Vehicles (USVs) Based on the Self-Organizing Map. Appl. Ocean Res. 2022, 126, 103262. [Google Scholar] [CrossRef]
- Tan, G.; Sun, H.; Du, L.; Zhuang, J.; Zou, J.; Wan, L. Coordinated Control of the Heterogeneous Unmanned Surface Vehicle Swarm Based on the Distributed Null-Space-Based Behavioral Approach. Ocean Eng. 2022, 266, 112928. [Google Scholar] [CrossRef]
- Liu, Y.; Lin, X.; Zhang, C. Affine Formation Maneuver Control for Multi-Heterogeneous Unmanned Surface Vessels in Narrow Channel Environments. J. Mar. Sci. Eng. 2023, 11, 1811. [Google Scholar] [CrossRef]
- Tan, G.; Zhuang, J.; Zou, J.; Wan, L. Adaptive Adjustable Fast Marching Square Method Based Path Planning for the Swarm of Heterogeneous Unmanned Surface Vehicles (USVs). Ocean Eng. 2023, 268, 113432. [Google Scholar] [CrossRef]
- Bell, M.G.H. Hyperstar: A Multi-Path Astar Algorithm for Risk Averse Vehicle Navigation. Transp. Res. Part B Methodol. 2009, 43, 97–107. [Google Scholar] [CrossRef]
- Gao, K.; Huang, Y.; Sadollah, A.; Wang, L. A Review of Energy-Efficient Scheduling in Intelligent Production Systems. Complex Intell. Syst. 2020, 6, 237–249. [Google Scholar] [CrossRef]
- Gao, K.; Cao, Z.; Zhang, L.; Chen, Z.; Han, Y.; Pan, Q. A Review on Swarm Intelligence and Evolutionary Algorithms for Solving Flexible Job Shop Scheduling Problems. IEEE/CAA J. Autom. Sin. 2019, 6, 904–916. [Google Scholar] [CrossRef]
Disclaimer/Publisher’s Note: The statements, opinions and data contained in all publications are solely those of the individual author(s) and contributor(s) and not of MDPI and/or the editor(s). MDPI and/or the editor(s) disclaim responsibility for any injury to people or property resulting from any ideas, methods, instructions or products referred to in the content. |
© 2024 by the authors. Licensee MDPI, Basel, Switzerland. This article is an open access article distributed under the terms and conditions of the Creative Commons Attribution (CC BY) license (https://creativecommons.org/licenses/by/4.0/).