Article

Relative Importance of Certain Factors Affecting Air Exchange in a High-Altitude Single-Heading Tunnels Based on the Numerical Simulation Method

1
School of Resources and Safety Engineering, Central South University, Changsha 410083, China
2
Yunnan Diqing Non-Ferrous Metal Co., Ltd., Shangri-la 674400, China
*
Author to whom correspondence should be addressed.
Mathematics 2023, 11(7), 1700; https://doi.org/10.3390/math11071700
Submission received: 24 February 2023 / Revised: 26 March 2023 / Accepted: 29 March 2023 / Published: 2 April 2023
(This article belongs to the Special Issue Advances in Computational and Applied Fluid Dynamics)

Abstract

:
Single-heading tunnels in underground metal mines have high air pollutant concentrations, chaotic airflow, and low pollutant diffusion efficiency in high-altitude areas, resulting in poor air exchange. Based on Pulang copper mine (China), a computational fluid dynamics case using the steady Reynolds-averaged Navier–Stokes equations with a k-omega turbulence model was developed to study certain factors influencing the air exchange of single-heading tunnels, and was combined with an orthogonal experimental method to simulate the mean age of air (MAA) under different working conditions. This study revealed the ranking of the importance of some factors on the air exchange via sensitivity analysis. The MAA generally increases with the increasing distance between the duct and the heading face and the increasing diameter of the oxygen supply duct. This study’s optimal distance and diameter can reduce MAA by 14.7% and 9.9%, respectively. Placing the oxygen supply duct and the duct on the same side and using an 800/1000 mm inner diameter duct can effectively reduce the MAA by 6.7% and 4.2%, respectively, in this study. The findings of this study can optimize air exchange in the Pulang copper mine, and can also be referenced for the optimization of air exchange in high-altitude highway or railway tunnels being excavated.

1. Introduction

There are various air quality problems in single-heading tunnels under excavation for underground metal mines in China. The air exchange problem is particularly serious in high-altitude areas, because high-altitude mines have low pollutant diffusion efficiency compared with medium- or low-altitude mines [1], which results in poor indoor air quality (IAQ) in high-altitude mines. The IAQ in single-heading tunnels is worse than in other areas of the mine because air pollutant concentrations tend to be much higher [2]. What is worse, excavation work at a high altitude requires an additional oxygen supply to the workers, and this oxygen supply needs additional ducts and induced draft fans (I.D. fans), making the airflow in high-altitude single-heading tunnels more chaotic than in others, even deteriorating air exchange. These issues above lead to a dilemma where single-heading tunnels in high-altitude mines have a chaotic flow field, difficult diffusion of pollutants, and high pollutant concentrations compared with medium- or low-altitude mines, or even other areas of high-altitude mines, which in turn are highly susceptible to respiratory occupational diseases among workers [3,4,5]. Nevertheless, the current studies do not study this problem in-depth and solve it effectively. Given the above, this paper studies the influence of certain factors affecting the air exchange rate (typically measured as air changes per hour, i.e., ACH) in high-altitude single-heading tunnels, and the mean age of air (MAA) is used in this study as the index of ACH. The MAA is a common index in architecture to judge the ACH during ventilation and has been gradually applied in mine ventilation to describe the freshness of air at a point in the fluid domain during ventilation [6,7,8,9,10,11] in recent years. For example, Parra et al. [2] obtained the flow field situation, MAA, and methane concentration distribution in a mine tunnel via CFD, in order to delineate hazard zones and optimize ACH. Lee Dong-Kil et al. [12] selected the ventilation layout with the lowest MAA and the fastest removal rates of air pollutants in a limestone mine using Ansys-Fluent. Jongmyung Park et al. [13] studied the effects of different duct locations on the MAA to explore which duct position has the best ACH. Although there has been a gradual increase in research on the optimization of ventilation for mines based on the MAA recently, most of the existing research was performed in low-altitude mines, and there is still a gap in ventilation optimization studies for complex high-altitude mines. In this study, the CFD analysis method and the orthogonal experimental method were used, simulating the air exchange in the single-heading tunnel of Pulang copper mine under different working conditions using Ansys-Fluent. Additionally, we investigate the influencing factors that affect the air exchange in high-altitude single-heading tunnels, and study the relationship between these factors and the mean age of air in high-altitude environments with high pollutant concentrations, chaotic airflow, and inefficient pollutant diffusion, in order to fill the gap in air exchange research in high-altitude single-heading tunnels, roadway tunnels, or railway tunnels under excavation. This study also establishes a low-cost and high-efficiency sensor placement scheme that can be used to measure the mean age of air of the whole tunnel. This study can help to improve optimal air exchange in high-altitude tunnels to protect the respiratory health of workers, and provide guidance and references for real-world optimization work.

2. Materials and Methods

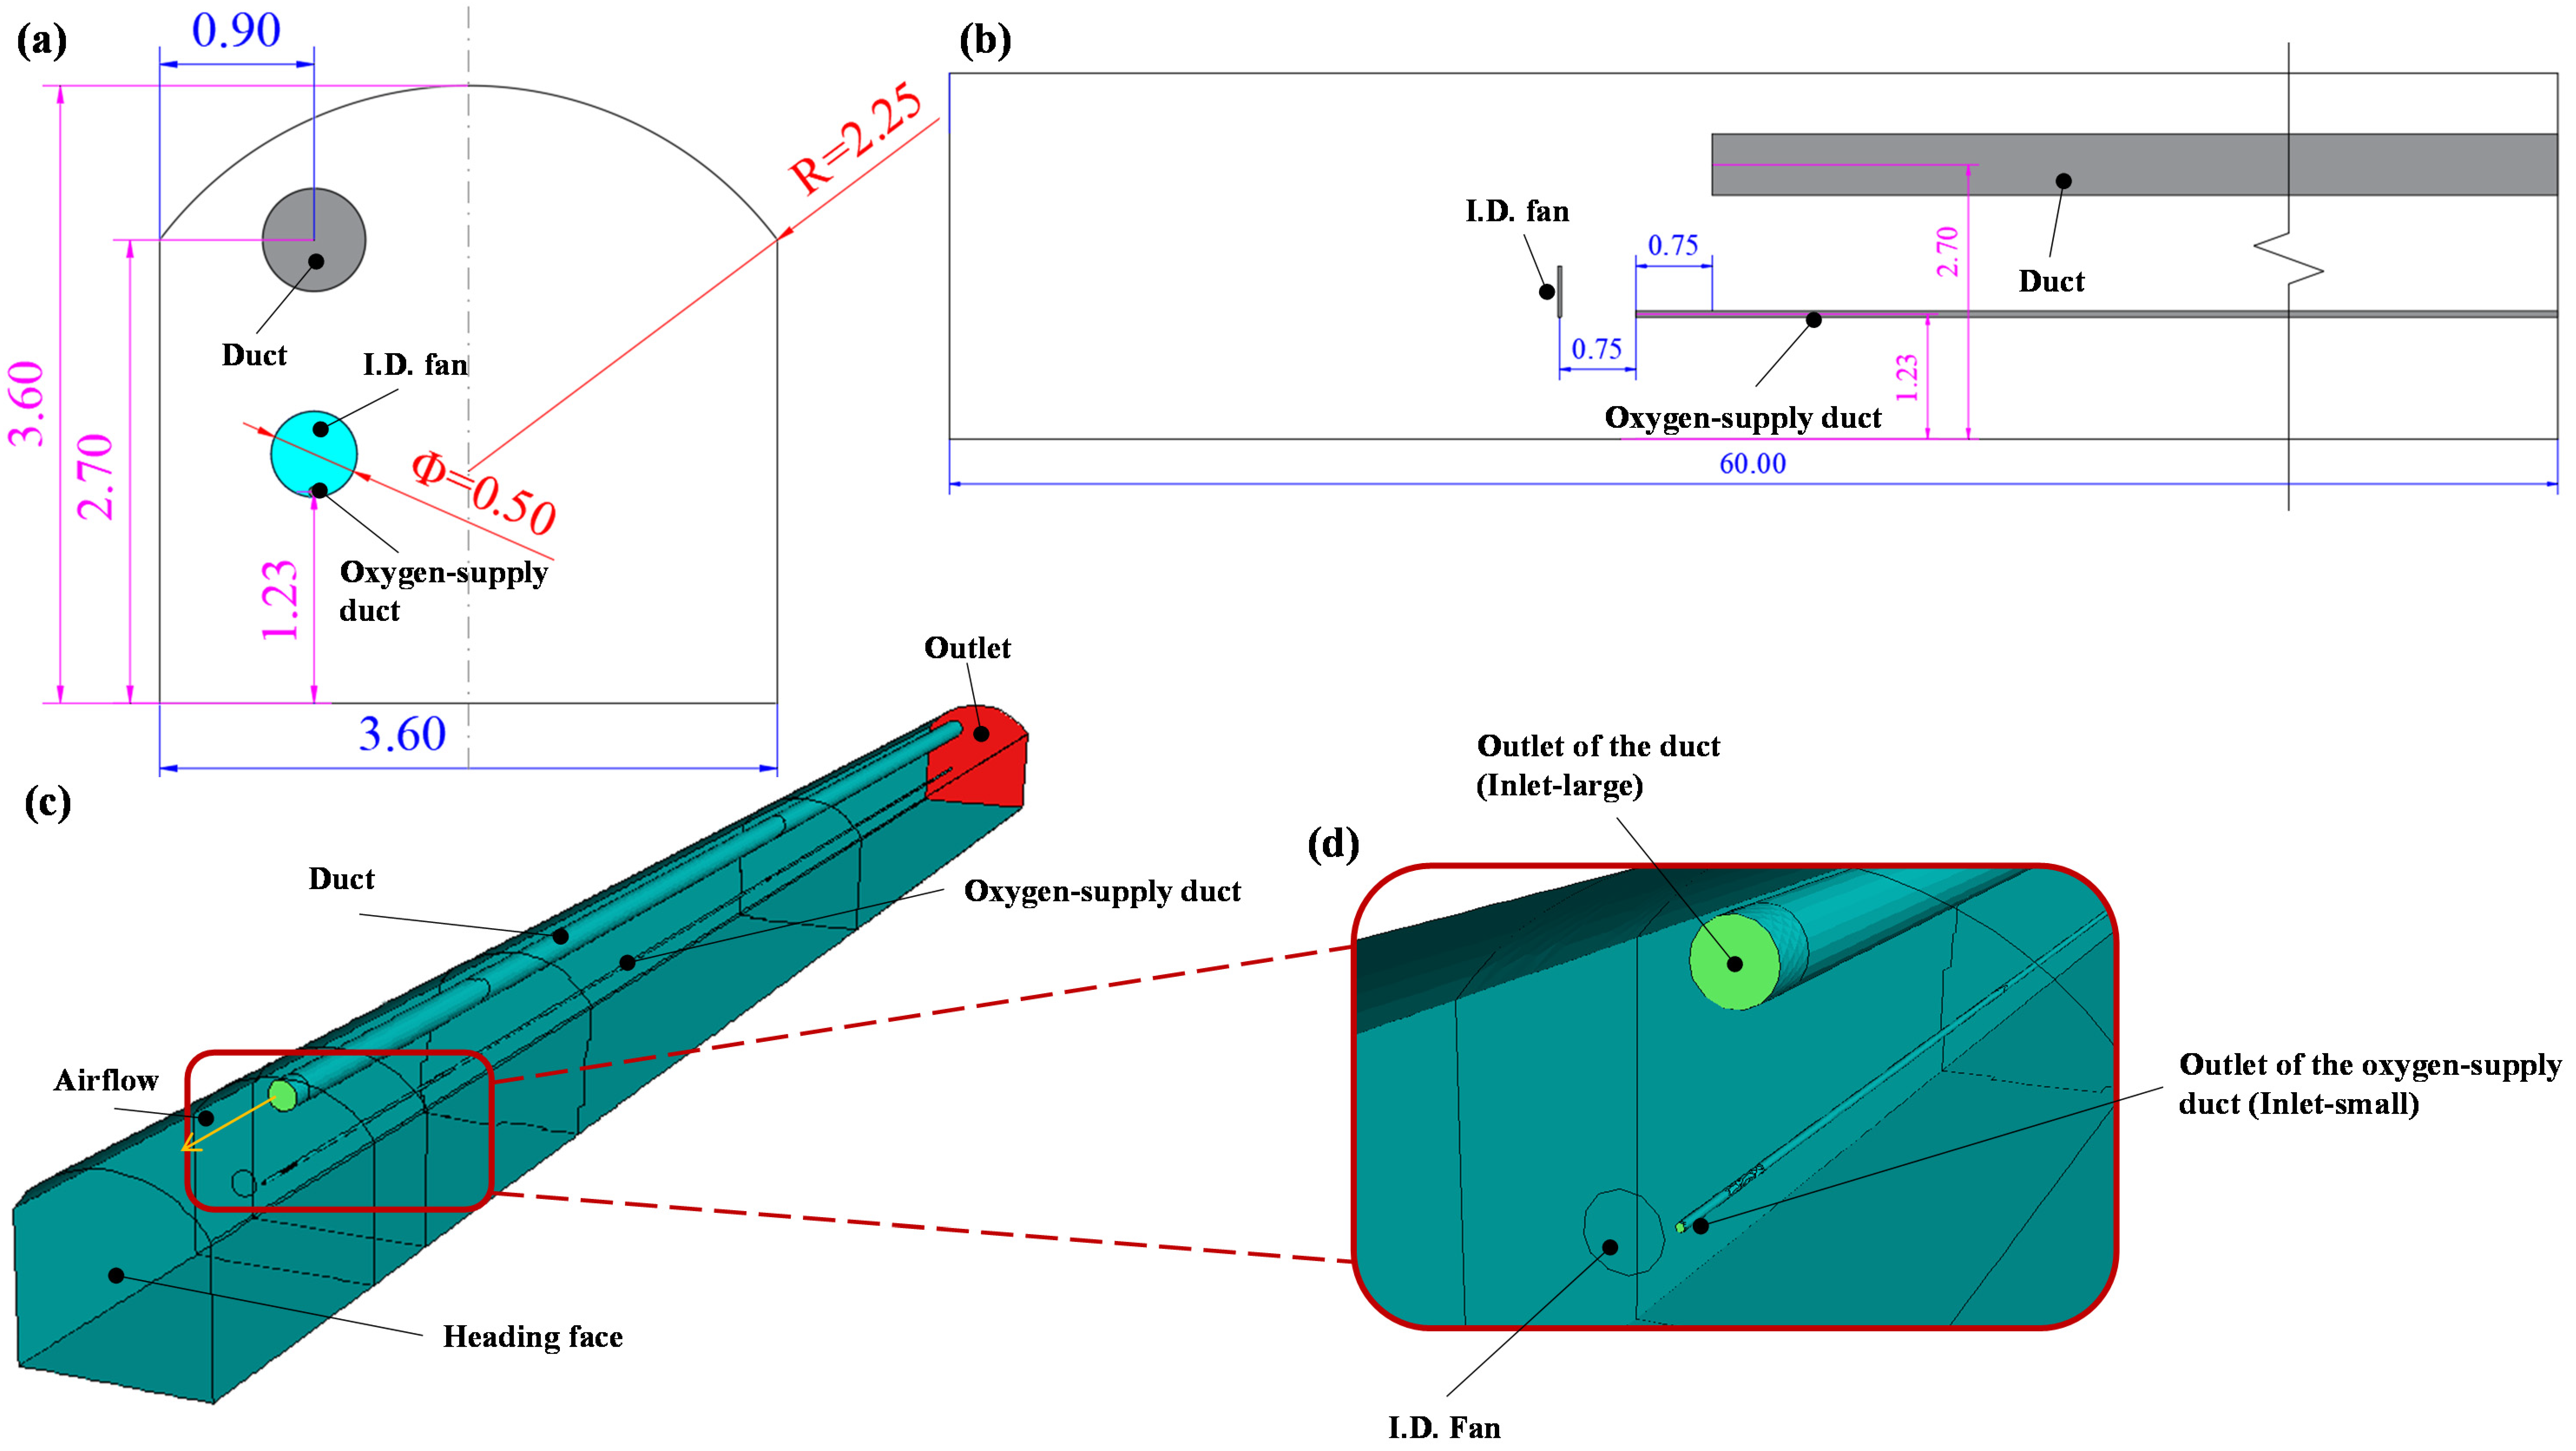
2.1. Engineering Background

The single-heading tunnel belonging to the Pulang copper mine, Yunnan Diqing Non-Ferrous Metal Co., Ltd., is located at an altitude of 3400 m, with a length of over 200 m. The Pulang copper mine is located in the northeastern part of Shangri-La, Diqing Tibetan Autonomous Prefecture, Yunnan Province, China. The mining area is 3400~4500 m above sea level. It is the largest underground copper mine in China, associated with gold, silver, molybdenum, and other metals.
The single-heading tunnel is 3.60 m wide and 3.60 m high, and the side walls are 2.70 m high. The top plate of the single-heading tunnel is an arch structure, the arch part is 0.90 m high, and the radius of the arch is 2.25 m. The cross-sectional area of the single-heading tunnel is 11.98 m2. The single-heading tunnel is shown in Figure 1a. Considering the low atmospheric pressure in the high-altitude area, to prevent negative pressure inside the single-heading tunnel, positive-pressure forced ventilation was selected. Therefore, a duct was provided to supply fresh air into the single-heading tunnel. An oxygen supply duct was provided to supply oxygen into the single-heading tunnel, and an I.D. fan was installed in front of the oxygen supply duct to help distribute incoming oxygen as shown in Figure 1b.
Because the working area is mainly concentrated in the first 60 m, only the tunnel within 60 m from the heading face was selected for modeling. The duct is placed at a height of 2.70 m, and its axis is 0.90 m away from the left side wall or the right side wall; or at a height of 3.00 m on the symmetrical surface of the single-heading tunnel. The I.D. fan and the oxygen supply duct are 1.20 m high above the floor, and the diameter of the I.D. fan is 0.50 m. The oxygen supply duct is 0.75 m longer than the duct, and the I.D. fan is placed 0.75 m in front of the oxygen supply duct as shown in Figure 1.

2.2. Orthogonal Experiment Design

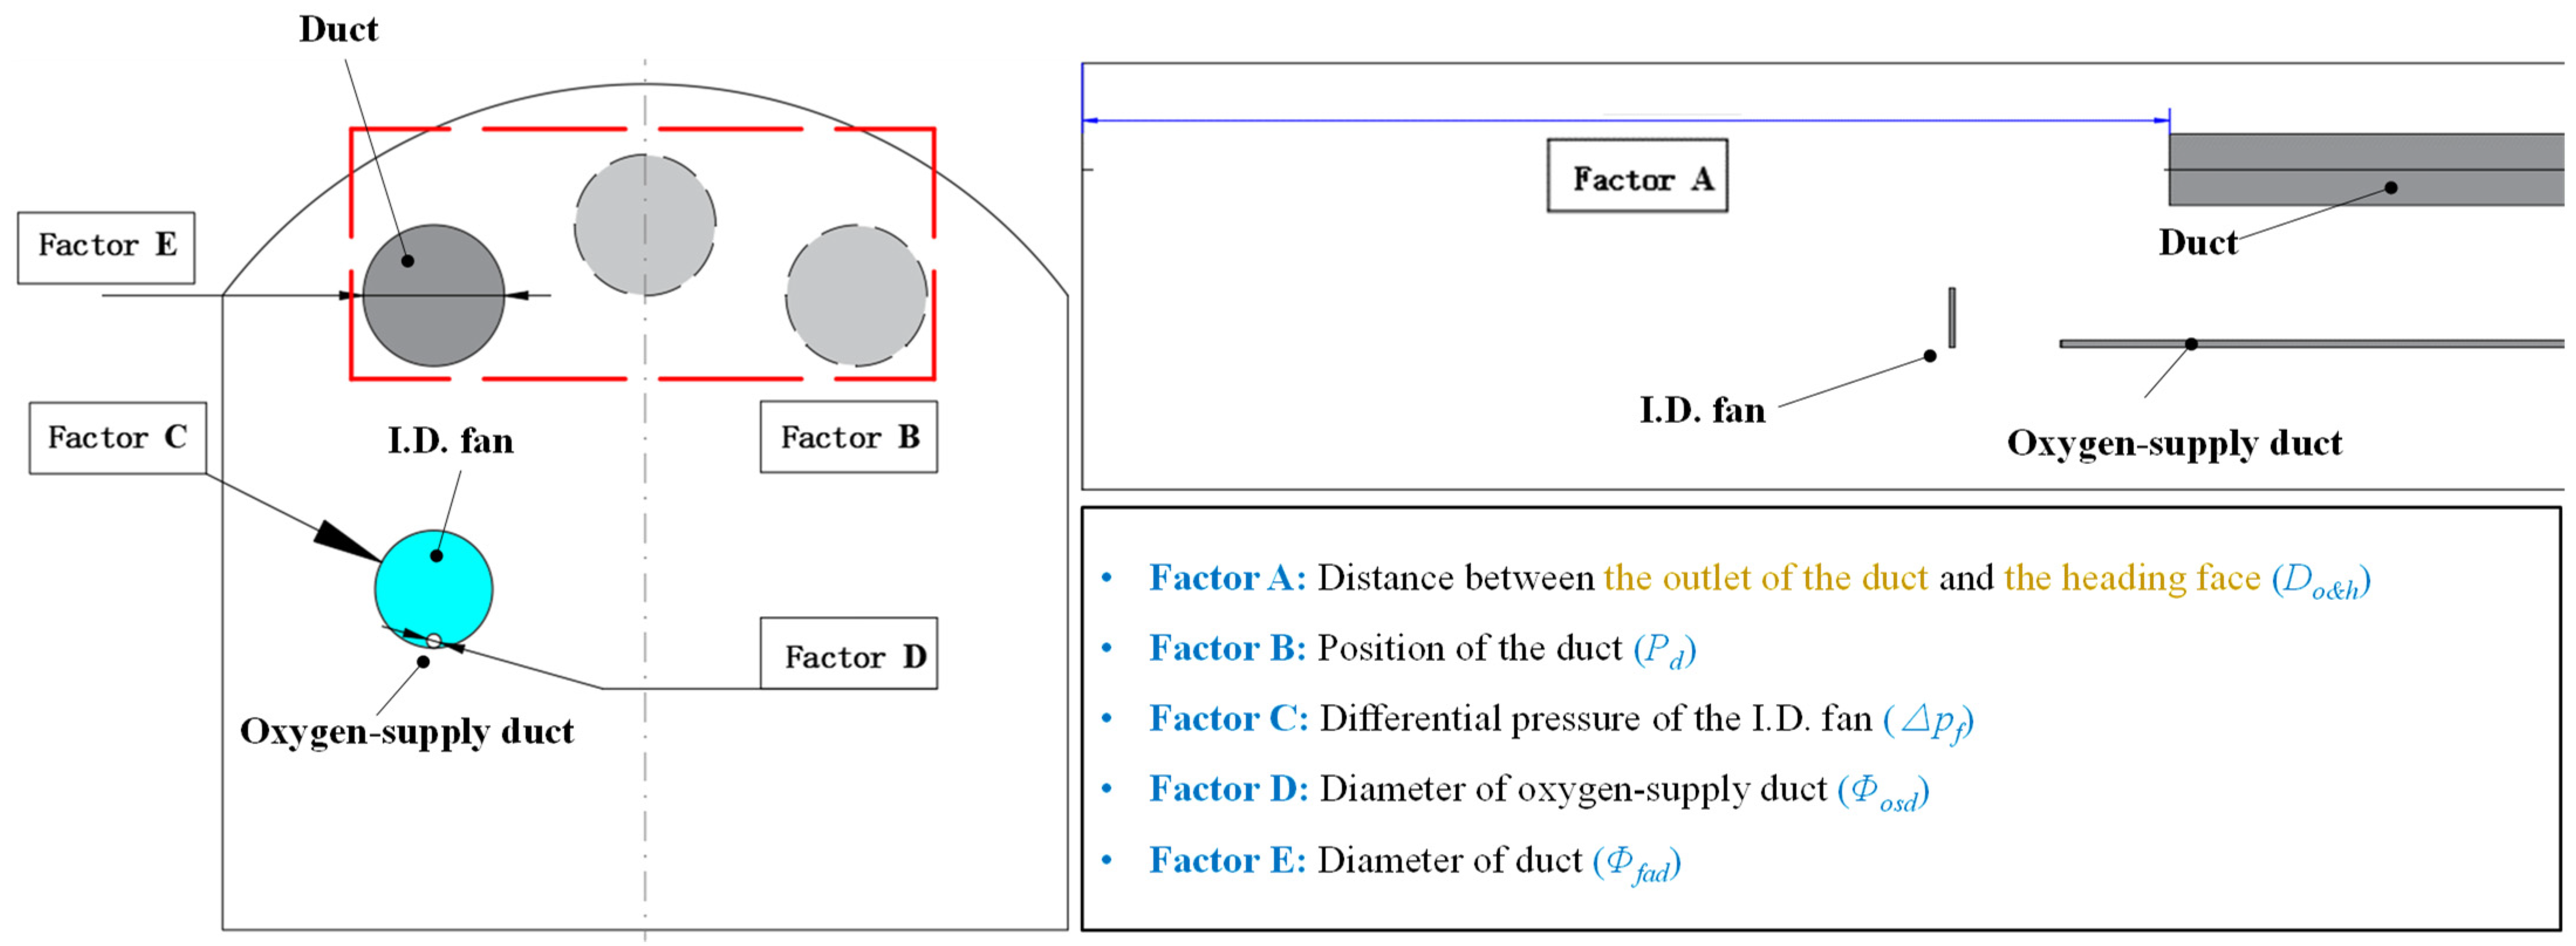
2.2.1. Determination of the Factors

To identify factors that have a great influence on the MAA in the single-heading tunnel, it is necessary to analyze the main reason that causes the increase in MAA in the single-heading tunnel. Since the age of air is essentially the retention time of air in an enclosed or semi-enclosed space, the state of motion of the air is the determining factor for the age of air, and the flow velocity and the movement path of air are the factors that determine the state of air motion. A study by J. Park et al. [13] showed that when air is supplied into the single-heading tunnel, the air in some areas sometimes moves in a circular motion, forming turbulent swirls. These swirls cause a significant increase in the MAA in the single-heading tunnel.
Based on the results of the above studies, it is possible to start from the influencing factors that affect the flow velocity and motion path of air and combine previous studies with practical engineering experience to find the factors that have an important influence on the age of air. In this study, the diameter of the duct (Φfad) and the diameter of the oxygen supply duct (Φosd) [14] were the only factors that changed the inlet airflow velocity because of the constant mass flow rate of air and oxygen, while the distance between the outlet of the duct and the heading face (Do&h) determined the length of the air motion path, and the position of the duct (Pd) was confirmed to significantly affect the air motion path by J. Park et al. and Lee, Dong-Kil. These two factors can affect the mean age of air by affecting the air motion path. In addition, in this study, an I.D. fan was set up for better diffusion of supplied oxygen in the single-heading tunnel. Ref. [15] confirmed that the differential pressure of the I.D. fan (∆pf), which can affect the local airflow velocity, also has a significant effect on the air exchange rate by numerical simulation experiments.
In summary, the distance between the outlet of the duct and the heading face (Do&h), the position of the duct (Pd), the differential pressure of the I.D. fan (∆pf), the diameter of the oxygen supply duct (Φosd), and the diameter of the duct (Φfad) were selected as the study factors for the orthogonal experiments in this study. The factors determined are shown in Figure 2.

2.2.2. Determination of the Reasonable Levels of the Factors

Since the levels of the above factors have a large span and a large number of groups, it is necessary to set reasonable levels before conducting the study. The reasonable levels of factors were determined following Chinese national standards [16], etc., and hands-on experience of oxygen supply in high-altitude mines. The finalized orthogonal experimental factors and reasonable levels for numerical experiments were determined as follows: Factor A: 7.5 m, 10.0 m, 12.5 m, 15.0 m, 17.5 m; Factor B: same side, upper center, opposite side; Factor C: 20 Pa, 40 Pa, 60 Pa, 80 Pa, 100 Pa; Factor D: 0.06 m, 0.07 m, 0.08 m, 0.09 m, 0.10 m; Factor E: 600 mm, 800 mm, 1000 mm.

2.2.3. Orthogonal Array

Following the rules of the mixed-level orthogonal design [17,18,19], an orthogonal array L25(53·32) with five factors was used in the research, for a total of 25 trials, and the orthogonal experiments scheme is shown in Table 1.
Table 1 was obtained by correcting the standard L25(55) orthogonal array with the mixed level method. Compared with the standard L25 orthogonal array, two of the factors in this study were set with only three levels, which means that two levels were redundant. So, we replaced the two redundant levels in the standard L25(55) orthogonal array with any one or more of the other three levels. In this study, the two redundant levels were replaced by “Upper center” and “800 mm”, respectively.
This array can also be generated using the Taguchi design function of the NCSS or Minitab software.

2.3. CFD Analysis

A CFD analysis project of the single-heading tunnel was established in the general CFD software Ansys-Fluent. The model was developed by means of DesignModeler, meshing was performed via Meshing, and post-processing of the simulation was conducted using CFD-Post.

2.3.1. Mathematical Models and Governing Equations

The following assumptions were made for the basic conditions simulated to reasonably simplify the simulation.
  • Steady-state assumption: After the flow field reaches a steady state, the parameters within the flow field, including oxygen concentration, flow velocity, and localized age of air, no longer change with time.
  • Constant assumption: The mass flow rates at the outlet of each duct, the pressure of the I.D. fan, atmospheric pressure, environmental temperature, and other parameters remain constant during the simulation.
  • Wall assumption: The study does not involve the study of flow in the boundary layer, but only the flow field inside the single-heading tunnel, so the wall conditions of the CFD model were set to be walls with slip conditions to simplify the calculation.
  • Fan planarization assumption: Fan surface body was used to replace the real I.D. fan, and simplified to a circular surface body. The study by A. Krol et al. [20] demonstrated that simplifying fans to infinitely thin surfaces in numerical simulation has very little effect on the accuracy of the results if the diameter and pressure jump are set to the same as the original fan. The use of the fan surface body instead of the fan model largely simplified the calculation.
Due to the different fluid types, the inlet of the duct and the oxygen supply duct needed to set different oxygen mass fractions, which required the activation of the species setting function in the Ansys-Fluent boundary conditions setting. Additionally, to activate the species setting function in the boundary condition settings, the species transport model without chemical reactions was enabled; the steady-state solver was enabled to investigate the parameters in the fluid domain at steady-state. In view of the air exchange in the single-heading tunnel studied in this paper, the flow of single phase incompressible gas was simulated, and the effect of a small amount of solid dust floating in the air on the airflow was neglected.
The steady-state N–S equations [21,22,23,24] and the SST k-ω equations were used to establish a closed set of governing equations, as in Equations (1)–(5).
Mass conservation equation:
( u ) x + ( v ) y + ( w ) z = 0
Momentum conservation equations (N–S equations):
{ 1 ρ p x ( ( u 2 ) x + ( u v ) y + ( u w ) z ) + 1 ρ ( τ x x x + τ y x y + τ z x z ) = 0 1 ρ p y ( ( v u ) x + ( v 2 ) y + ( v w ) z ) + 1 ρ ( τ x y x + τ y y y + τ z y z ) = 0 1 ρ p z ( ( w u ) x + ( w v ) y + ( w 2 ) z ) + 1 ρ ( τ x z x + τ y z y + τ z z z ) = 0
Species transport equation (in turbulent flows):
J i = ( ρ D i , m + μ t S c t ) Y i D T , i T T
where ρ is the density of the fluid; u , v , and w are the velocity in the x , y , and z direction, respectively; p is the pressure; τ is the shear stress; J i is the diffusion flux of species i; Di,m is the mass diffusion coefficient for species i in the mixture; DT,i is the thermal (Soret) diffusion coefficient; T is the temperature; Yi is the local mass fraction of species i; μt is the turbulent viscosity; and Sct is the turbulent Schmidt number, with the default Sct being 0.7.
Since the change in heat in the incompressible fluid flow is very small, the energy equation can be ignored.
There was a large pressure gradient around the I.D. fan, and the SST k-ω turbulence model was chosen because of its high accuracy under an adverse pressure gradient.
Turbulent kinetic energy k:
( ρ k u i ) x i = x j ( Γ k k x j ) + G k Y k
Specific turbulence dissipation ω:
( ρ k u i ) x i = x j ( Γ ω ω x j ) + G ω Y ω + D ω
where Gk is the generation of turbulence kinetic energy due to mean velocity gradients; Gω is the generation of ω; Γk and Γω are the effective diffusivities of k and ω, respectively; Yk and Yω are the dissipation of k and ω due to turbulence, respectively; and Dω is the cross-diffusion term.
We used the user-defined functions (UDFs) in the Ansys-Fluent Theory Guide to calculate the age of air. Additionally, after calculating the age of air values at each point, we then averaged values to obtain the MAA in the whole tunnel [20].

2.3.2. Simulation Modeling and Boundary Conditions

A 1:1 simulation model of the single-heading tunnel at Pulang copper mine was developed as shown in Figure 1c, and the front and side views of the model are shown in Figure 1a,b. Figure 1c,d show the 3D model of the single-heading tunnel.
The oxygen supply duct and the I.D. fan were both placed on the right-hand side of the single-heading tunnel to avoid obstruction of normal work and transportation.
The boundary conditions were set based on the calculation and field measurement results of environment parameters in the Pulang copper mine. Based on the case that the single-heading tunnel is located at an altitude of 3400 m, and the target of oxygen supply is to increase the oxygen volume fraction in that the single-heading tunnel by 5%, the high-altitude environment parameters required for the simulation and boundary conditions were calculated using Equations (6)–(15).
The equation for calculating the required volume airflow rates at the single-heading tunnel [16] is shown in Equation (6):
Q = V 0 S   ×   60
where Q is the volume airflow rates required at the single-heading tunnel using the minimum dust exhaust air velocity, m3/min; V0 is the minimum dust exhaust air velocity, which was taken as 0.25 m/s following the Ventilation Technical Standards for Metal and Nonmetal Underground Mines Ventilation System (AQ 2013.2 - 2008); and S is the area of the tunnel section, m2.
There is a one-to-one correspondence between atmospheric pressure, temperature, and altitude, and the equation between atmospheric pressure and altitude [25] is shown in Equation (7), while the equation between temperature and altitude is shown in Equation (8).
p z = 101 . 325   ×   ( 1   z 44329 ) 5 . 255876
T z = 293 . 15     ( z 100   ×   0 . 6 )
where pz and Tz are the atmospheric pressure and temperature at z altitude, respectively, Pa and K; and z is the altitude, m.
Based on the above results, the air density at the altitude of 3400 m can be calculated by means of Equation (9):
ρ z = 1.293   ×   p z 101.325   ×   273.15 T z
where ρz is the air density at z altitude, kg/m3.
The equation of calculating oxygen supplied with a 5% rise in oxygen volume fraction as the target is shown in Equation (10):
x = Q   ×   [ 20.9 %   ×   ( 1 + 5 % )     20.9 % ] 1     [ 20.9 % × ( 1 + 5 % ) ]
where x is the volume flow rate of the oxygen supply duct, m3/min.
The turbulence intensity and turbulent viscosity ratio are calculated using Equations (11)–(15):
I = 0.16 Re 0.125
μ t μ = 0.09 ρ k 2 ε μ
Re = ρ v L μ
k = 1.5 ( v I ) 2
ε = 0.09 0.75 k 1.5 0.07 L
where I is the turbulence intensity; Re is the Reynolds number; L is the characteristic length of the tunnel, m; μt/μ is the turbulent viscosity ratio; k is the turbulent kinetic energy, J; ε is the dissipation rate of turbulence, %; and μ is the dynamic viscosity of the fluid, N·s/m2.
The high-altitude environment parameters required for the simulation and boundary conditions are shown in Table 2, where the turbulence intensity and turbulence viscosity ratio settings were applied to all inlets and outlet.

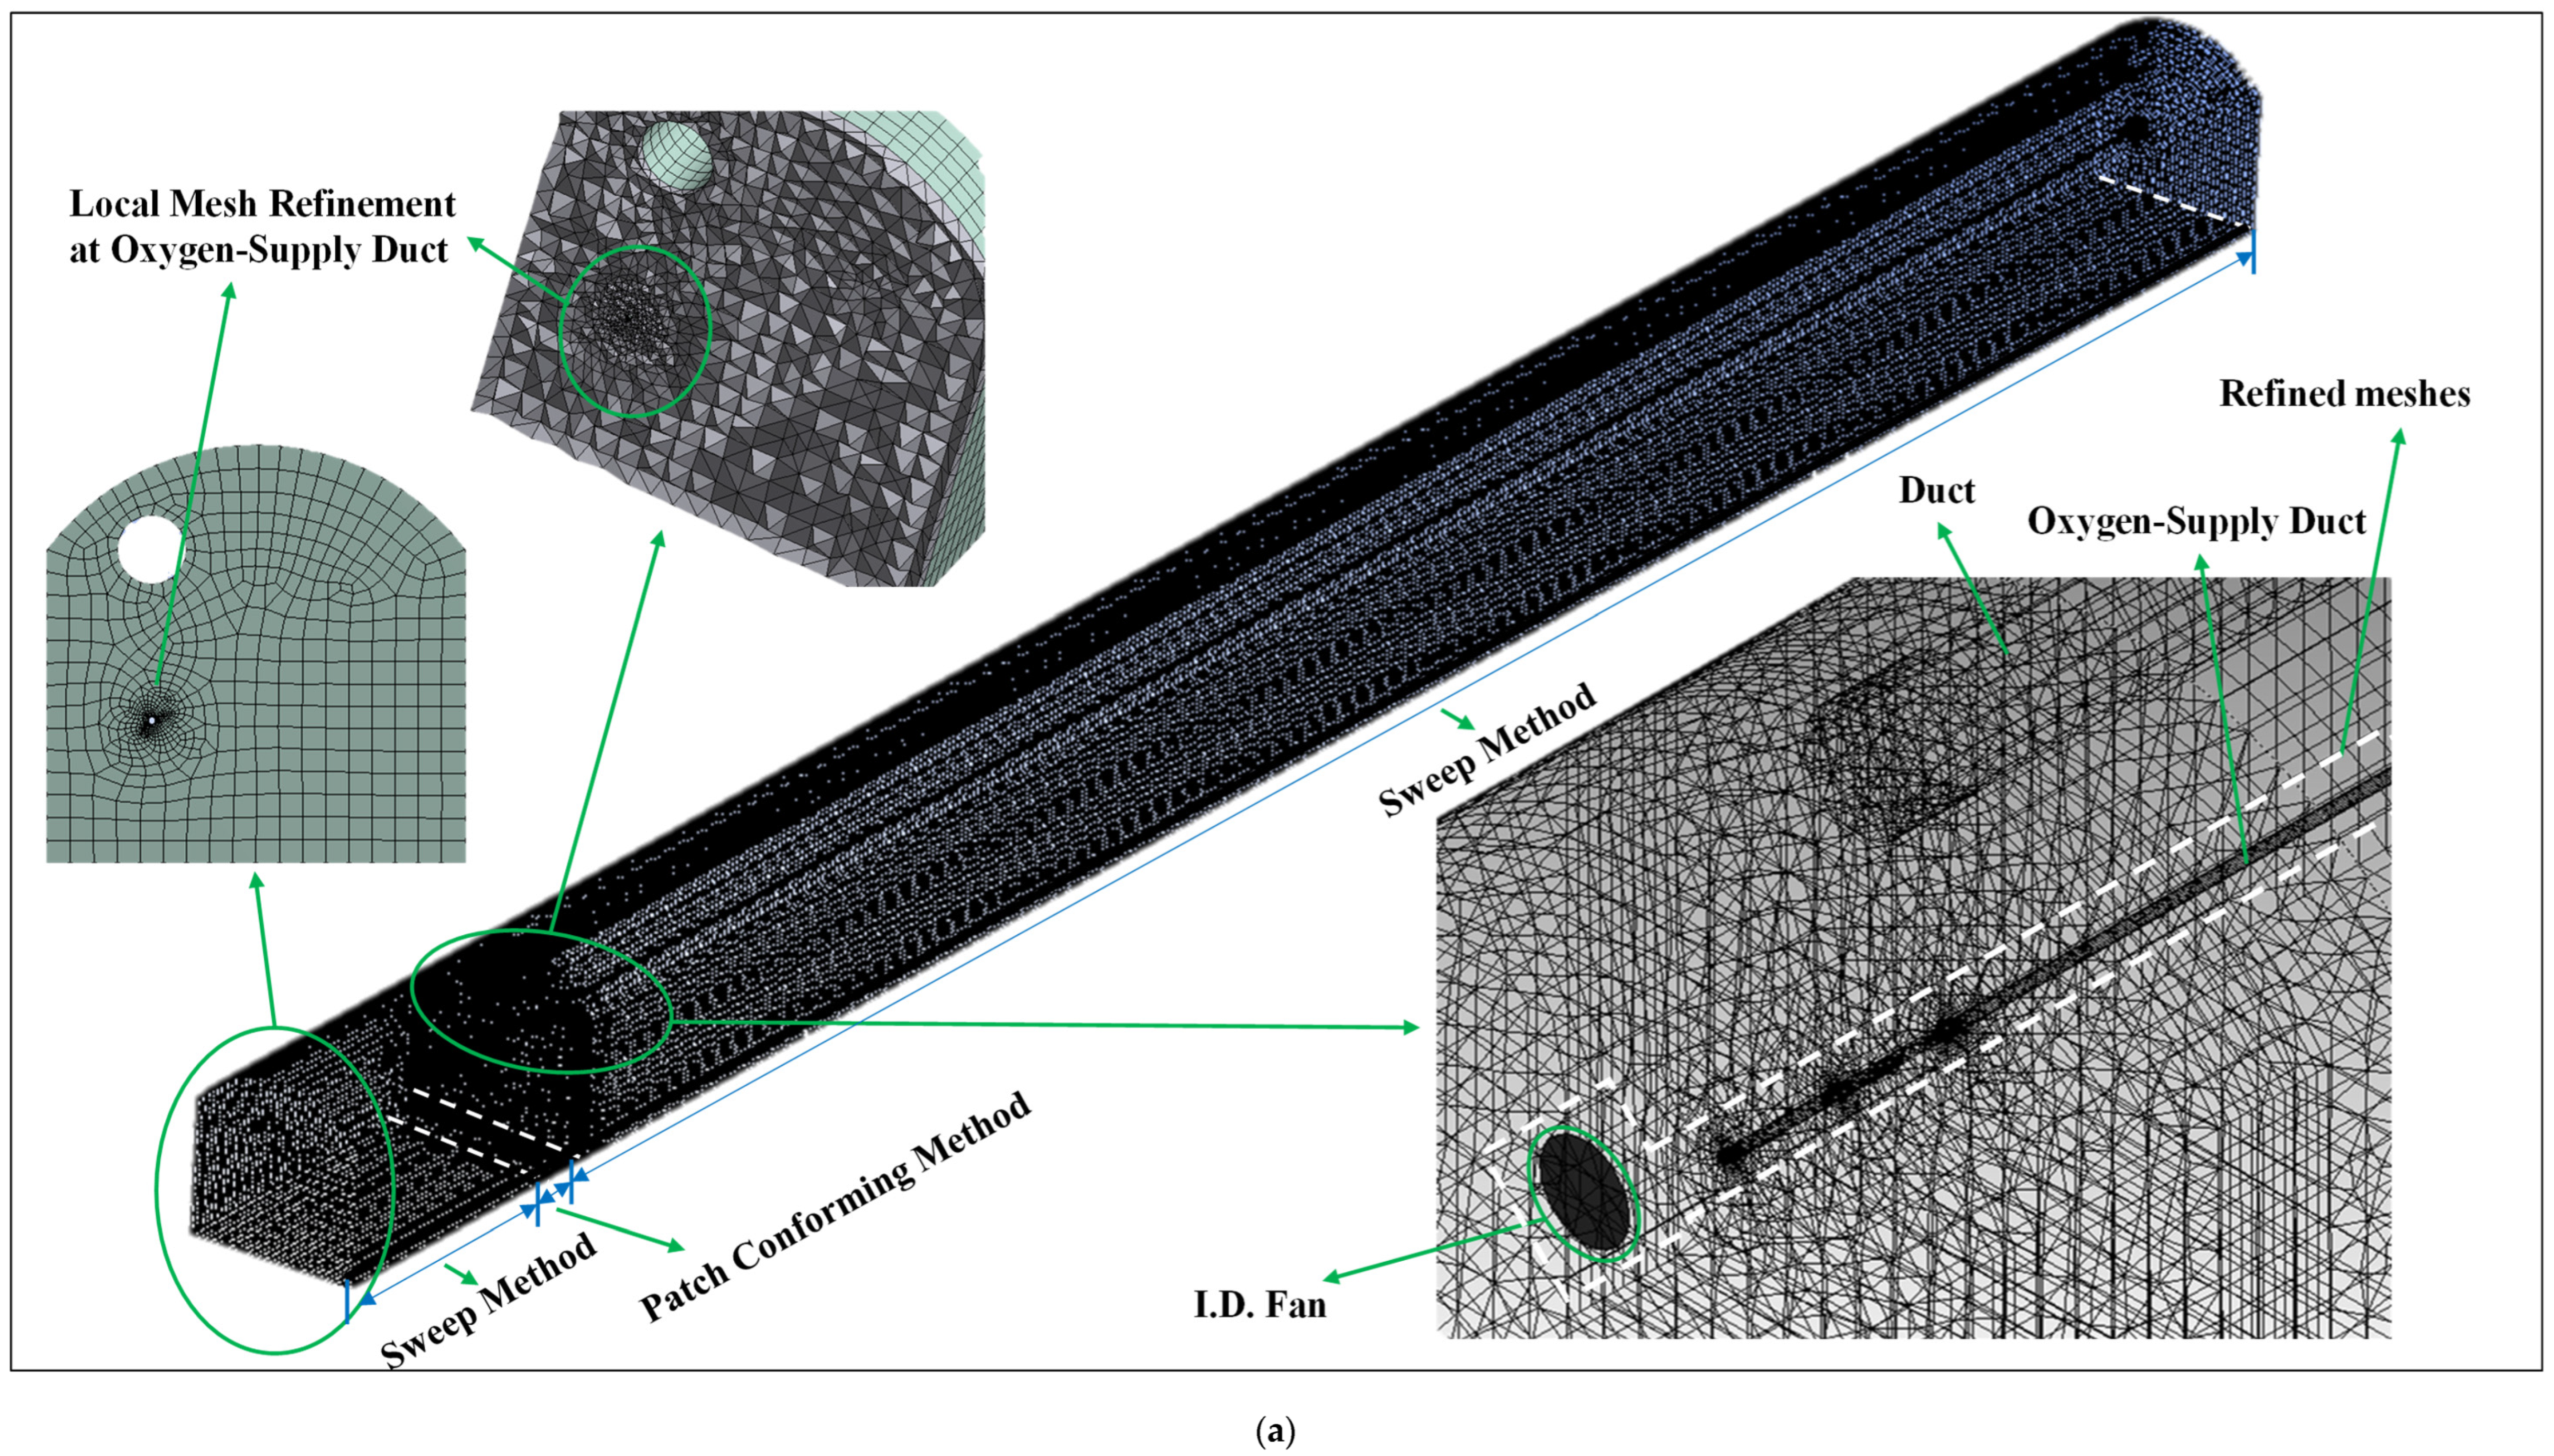
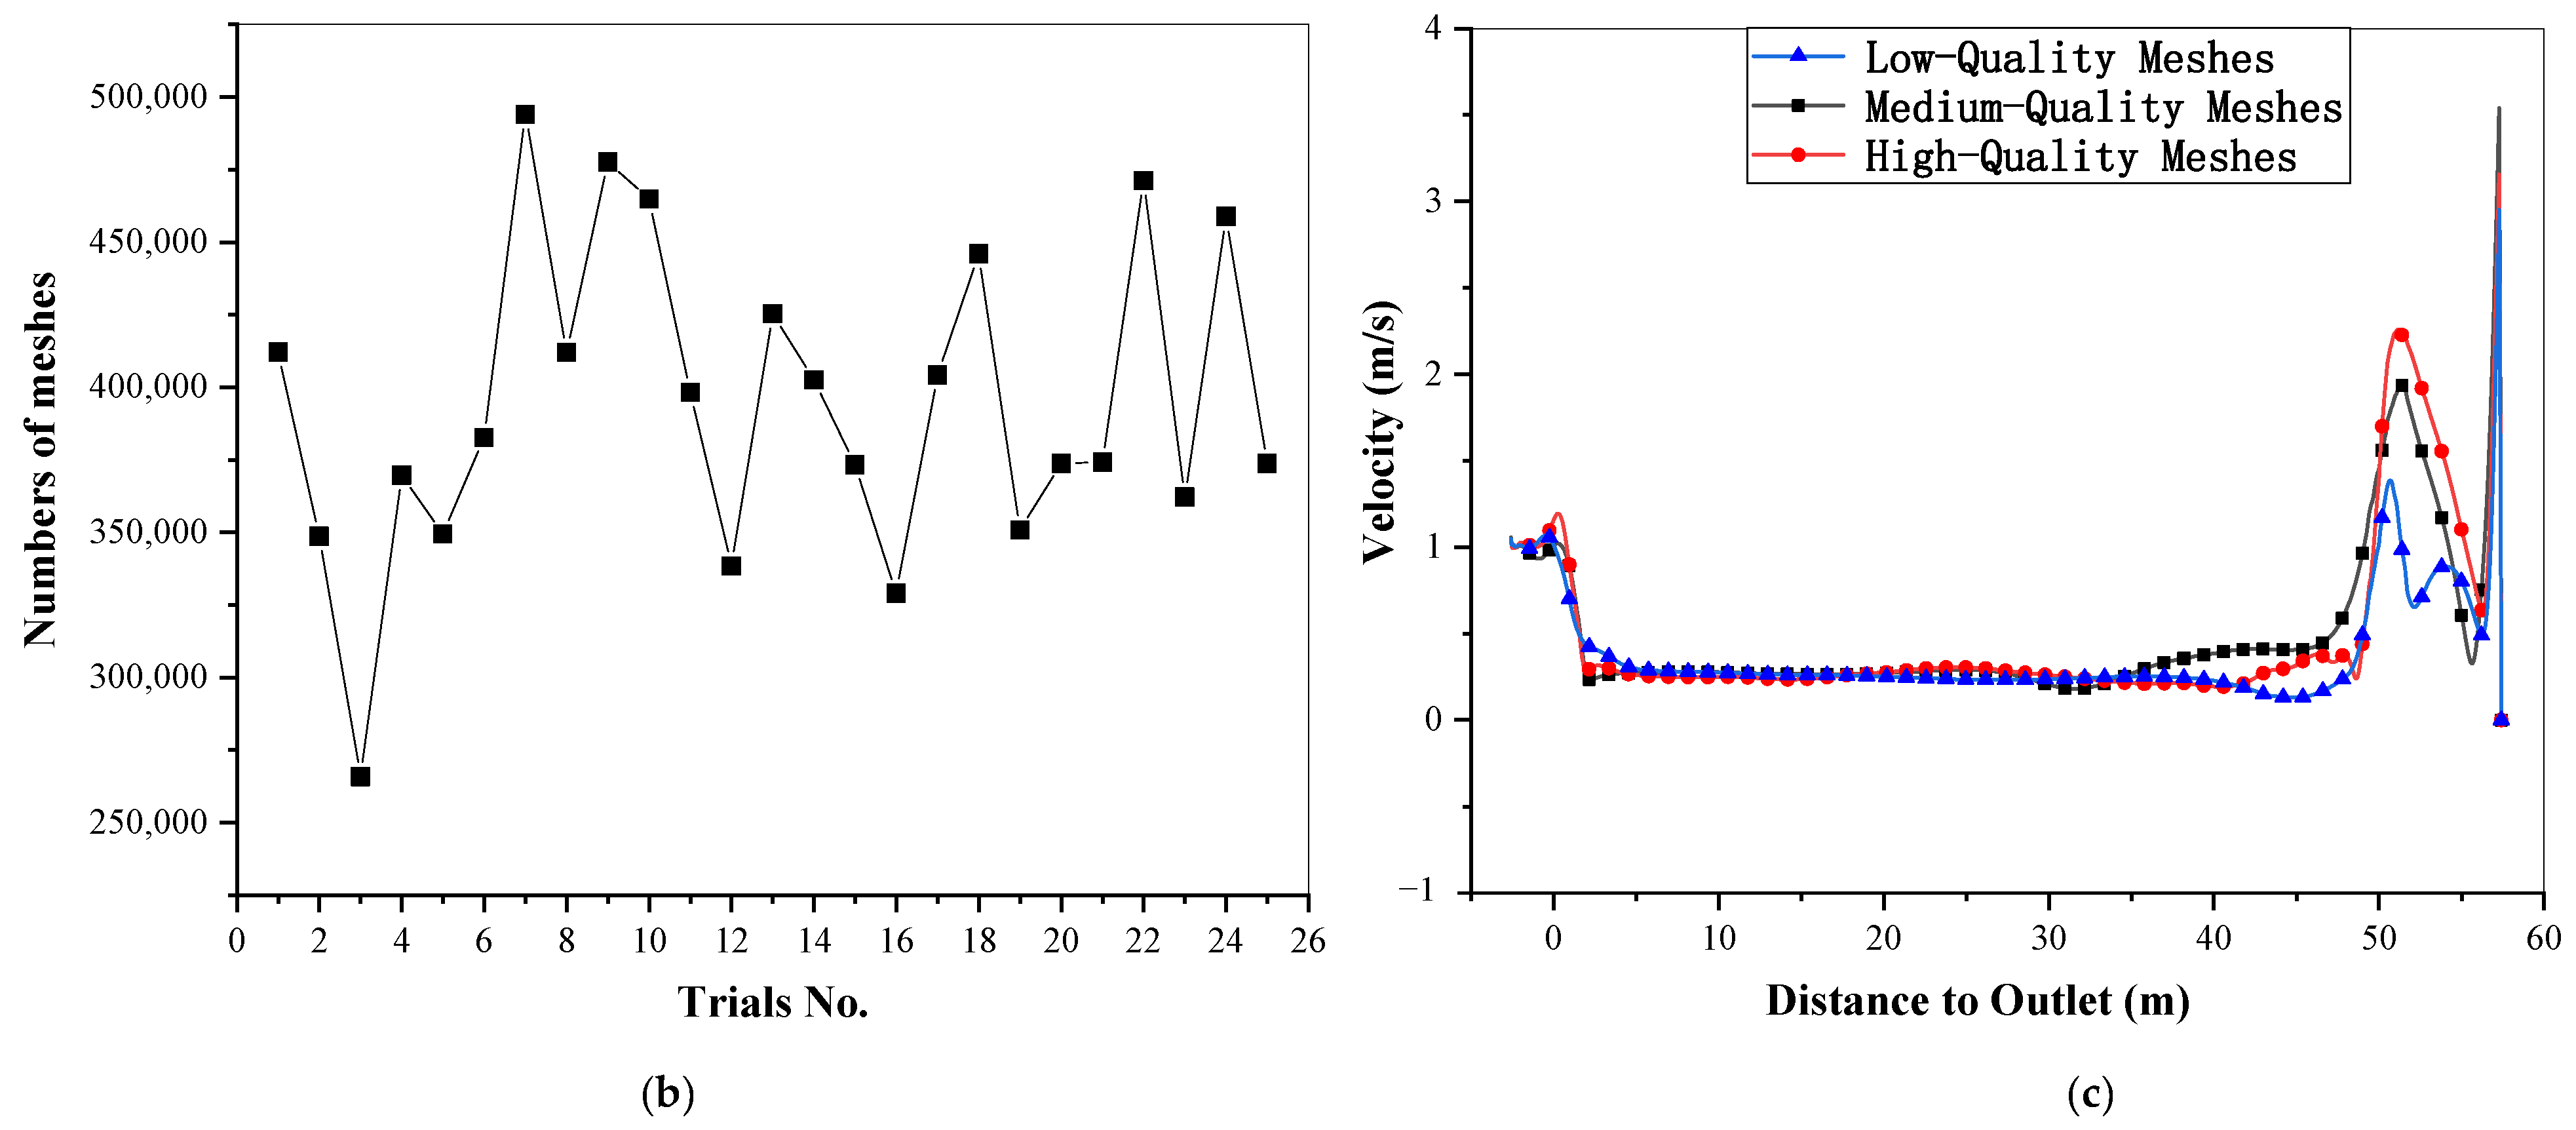
2.3.3. Meshing and Independent Verification Test

Meshes were generated for the model, as shown in Figure 3a. The numbers of meshes for each trial are shown in Figure 3b. To ensure that the CFD simulation results are independent of the size of meshes, CFD simulations using three different sizes of meshes of the same trial were tested. The comparison results are shown in Figure 3c. Figure 3c shows that the result of medium-quality meshes almost overlaps with the result of high-quality meshes, with a relative error of only 1.55%, so the medium-quality meshes with an average size of 2 × 10⁻² m were finally chosen for the CFD simulations because the medium-quality meshes required the least convergence time to obtain the optimal result.

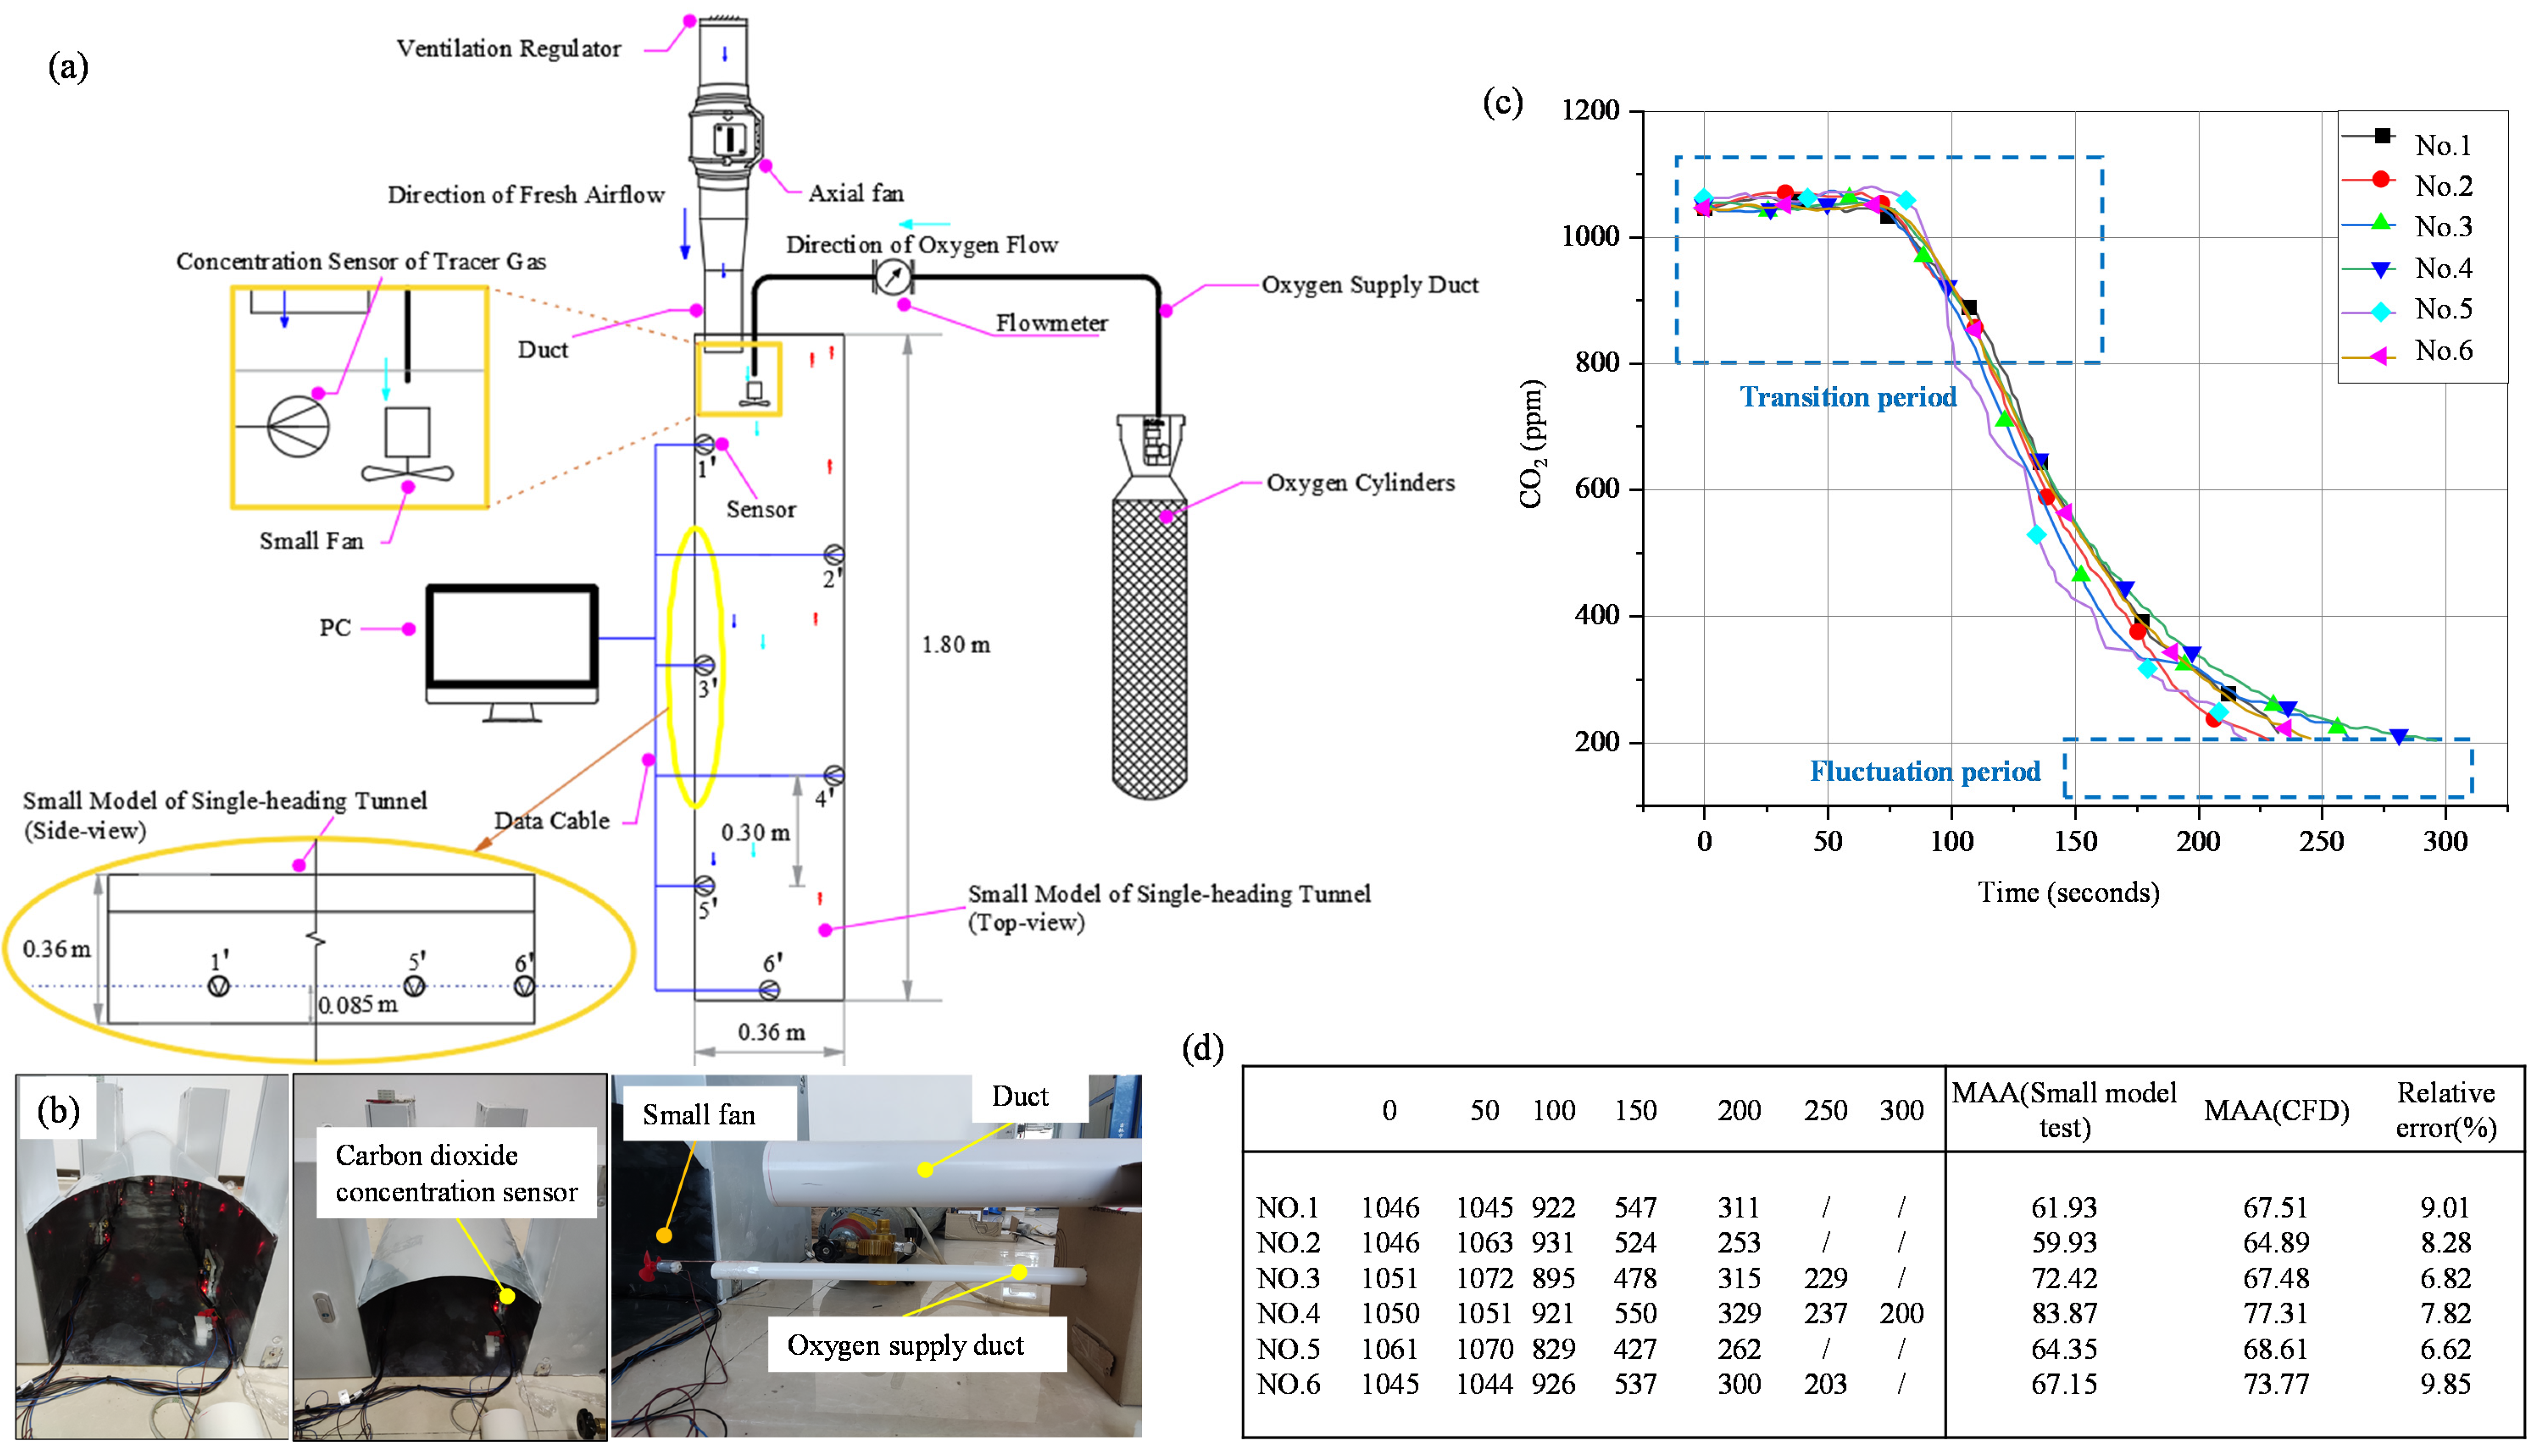
2.3.4. Validation of CFD Analysis

The tracer gas concentration decay method is the main method for measuring the age of air in field experiments [26,27,28], which requires injecting a large amount of tracer gas into the closed measurement space to make the concentration of tracer gas uniform everywhere in the measurement space. However, due to the large space volume of the Pulang copper mine single-heading tunnel, it would be very expensive and extremely difficult to use this method in field experiments. Thus, a small model of the single-heading tunnel was used, and measurement experiments were conducted using this small model. Additionally, the experiment results were compared with the CFD analysis results of the small model to verify the agreement of the age of air in the small model with its CFD simulation results, and then to verify the accuracy of the CFD methods and numerical model setting. The schematic diagram and the physical diagram of the small model test are shown in Figure 4a,b. Using the tracer gas concentration decay method, the concentration sensors are positioned at 6 measurement points within the small model to obtain the decay curve of the tracer gas concentration at the measurement points with time. CO2 was chosen as the tracer gas for this research due to its advantages of low cost, non-explosiveness and non-toxicity [28]. The air age at the measurement point was calculated using Equation (16):
τ p = t 0 ( C t C B ) d t C t 0 C B
where τp is the age of air; Ct is the CO2 concentration at the measurement time t; CB is the background concentration of CO2 in the laboratory; and t0 is the initial time of the concentration decay curve.
The conditions of the small model were as follows. The position of the duct was on the same side as the oxygen supply duct and the small fan. The oxygen supply duct’s diameter was 0.025 m. The duct diameter was 0.082 m. The distance between the outlet of the duct and the heading face was 1.8 m. The flow velocity at the outlet of the oxygen supply duct was 0.02 m/s. The flow velocity at the outlet of the duct was 1.15 m/s. The differential pressure of the I.D. fan was 3 Pa. The diameter of I.D. fan was 0.05 m. Additionally, the air pressure of the lab was 100,110 Pa. The distance between the outlet of the oxygen supply duct and the small fan and the distance between the outlet of the oxygen supply duct and the duct outlet are both 0.075 m. The axis of the oxygen supply duct is 0.123 m from the ground. The axis of the duct is 0.270 m from the ground.
The measurement procedure was as follows: first, we measured the background concentration of CO2 in the lab, sealed the small model, injected CO2, and evenly distributed it inside using a fan; then, we unsealed the small model, inserted the ducts and the small fan, turned on the axial fan, the valve of oxygen and the small fan, and recorded the CO2 decay curve; following this, we used the middle section of the curves to calculate the age of air to prevent the “transition period” at the beginning and the “fluctuation period” at the end from influencing the results [28], as shown in Figure 4c. After removing the “transition period” and “fluctuation period” of the CO2 concentration decay curve obtained from each sensor, Equation (16) was used to obtain the air age at each sensor location in the experiment. Additionally, a CFD case of the small model was developed using the methods presented in Section 2.3.1, Section 2.3.2 and Section 2.3.3. The comparison of the two results is shown in Figure 4d, which indicates that the experimental results and CFD results are in considerable agreement with the error tolerance. The CFD model developed in this study has a high agreement with the real situation, too.

3. Results

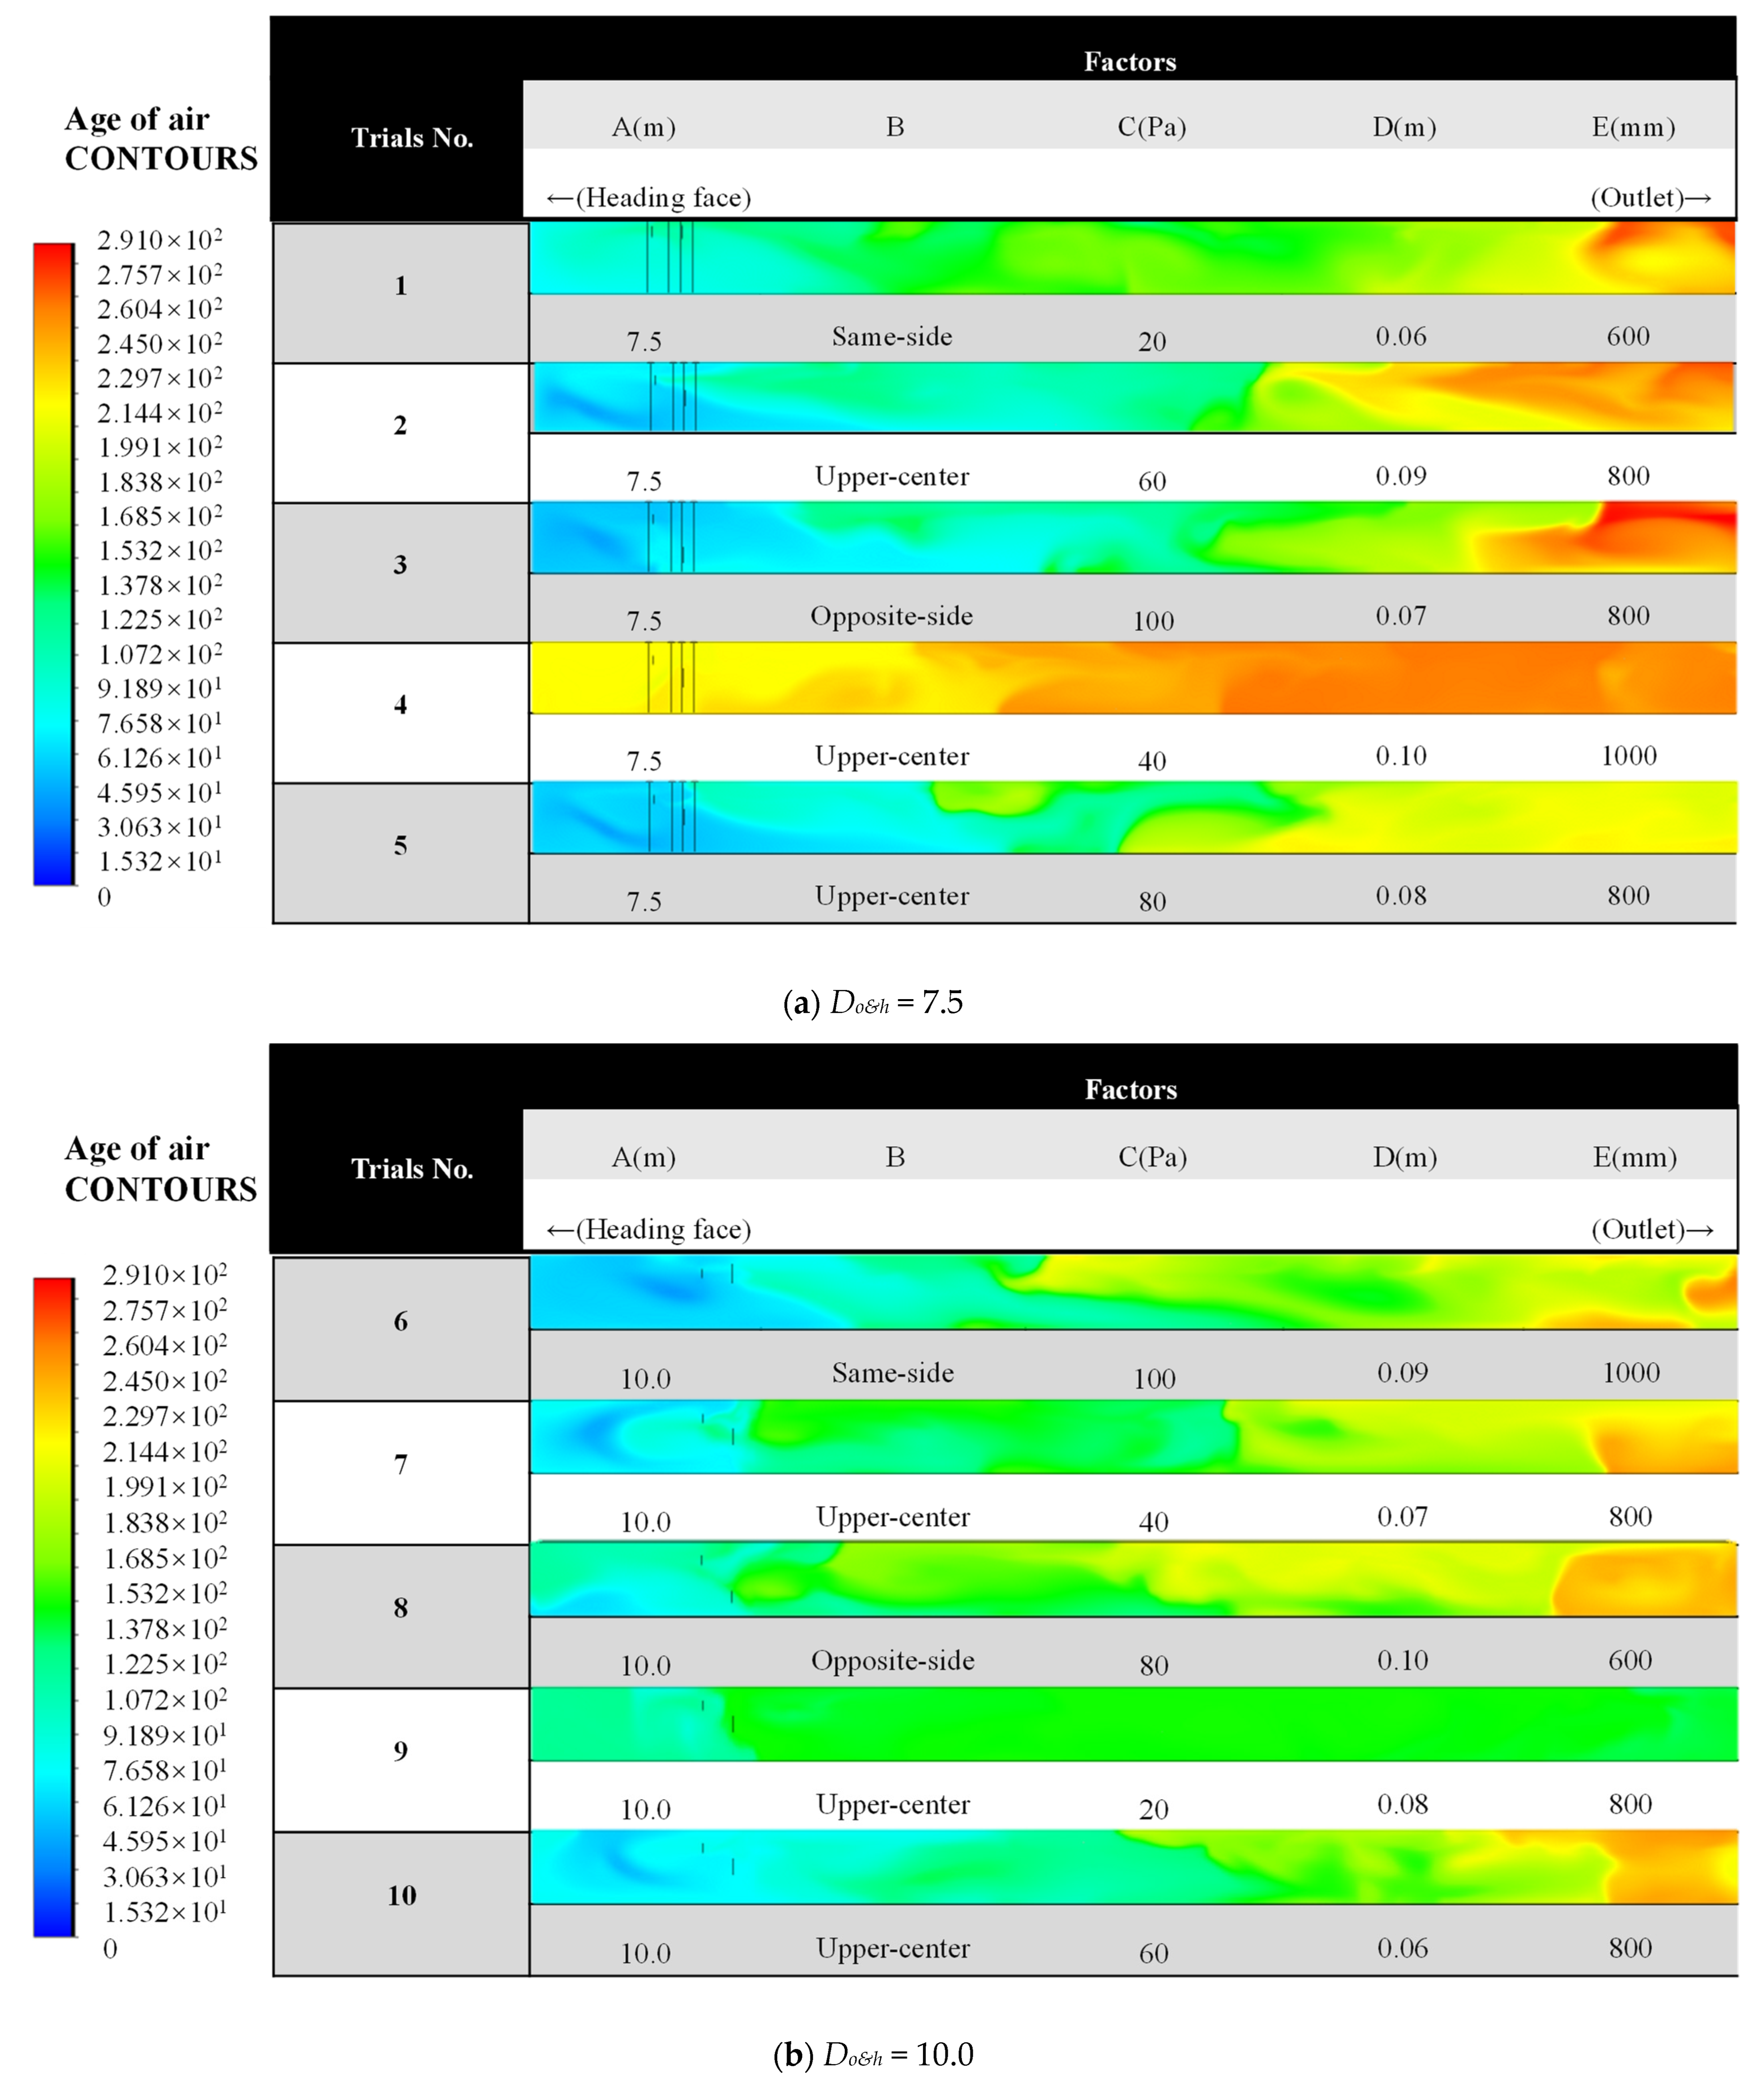
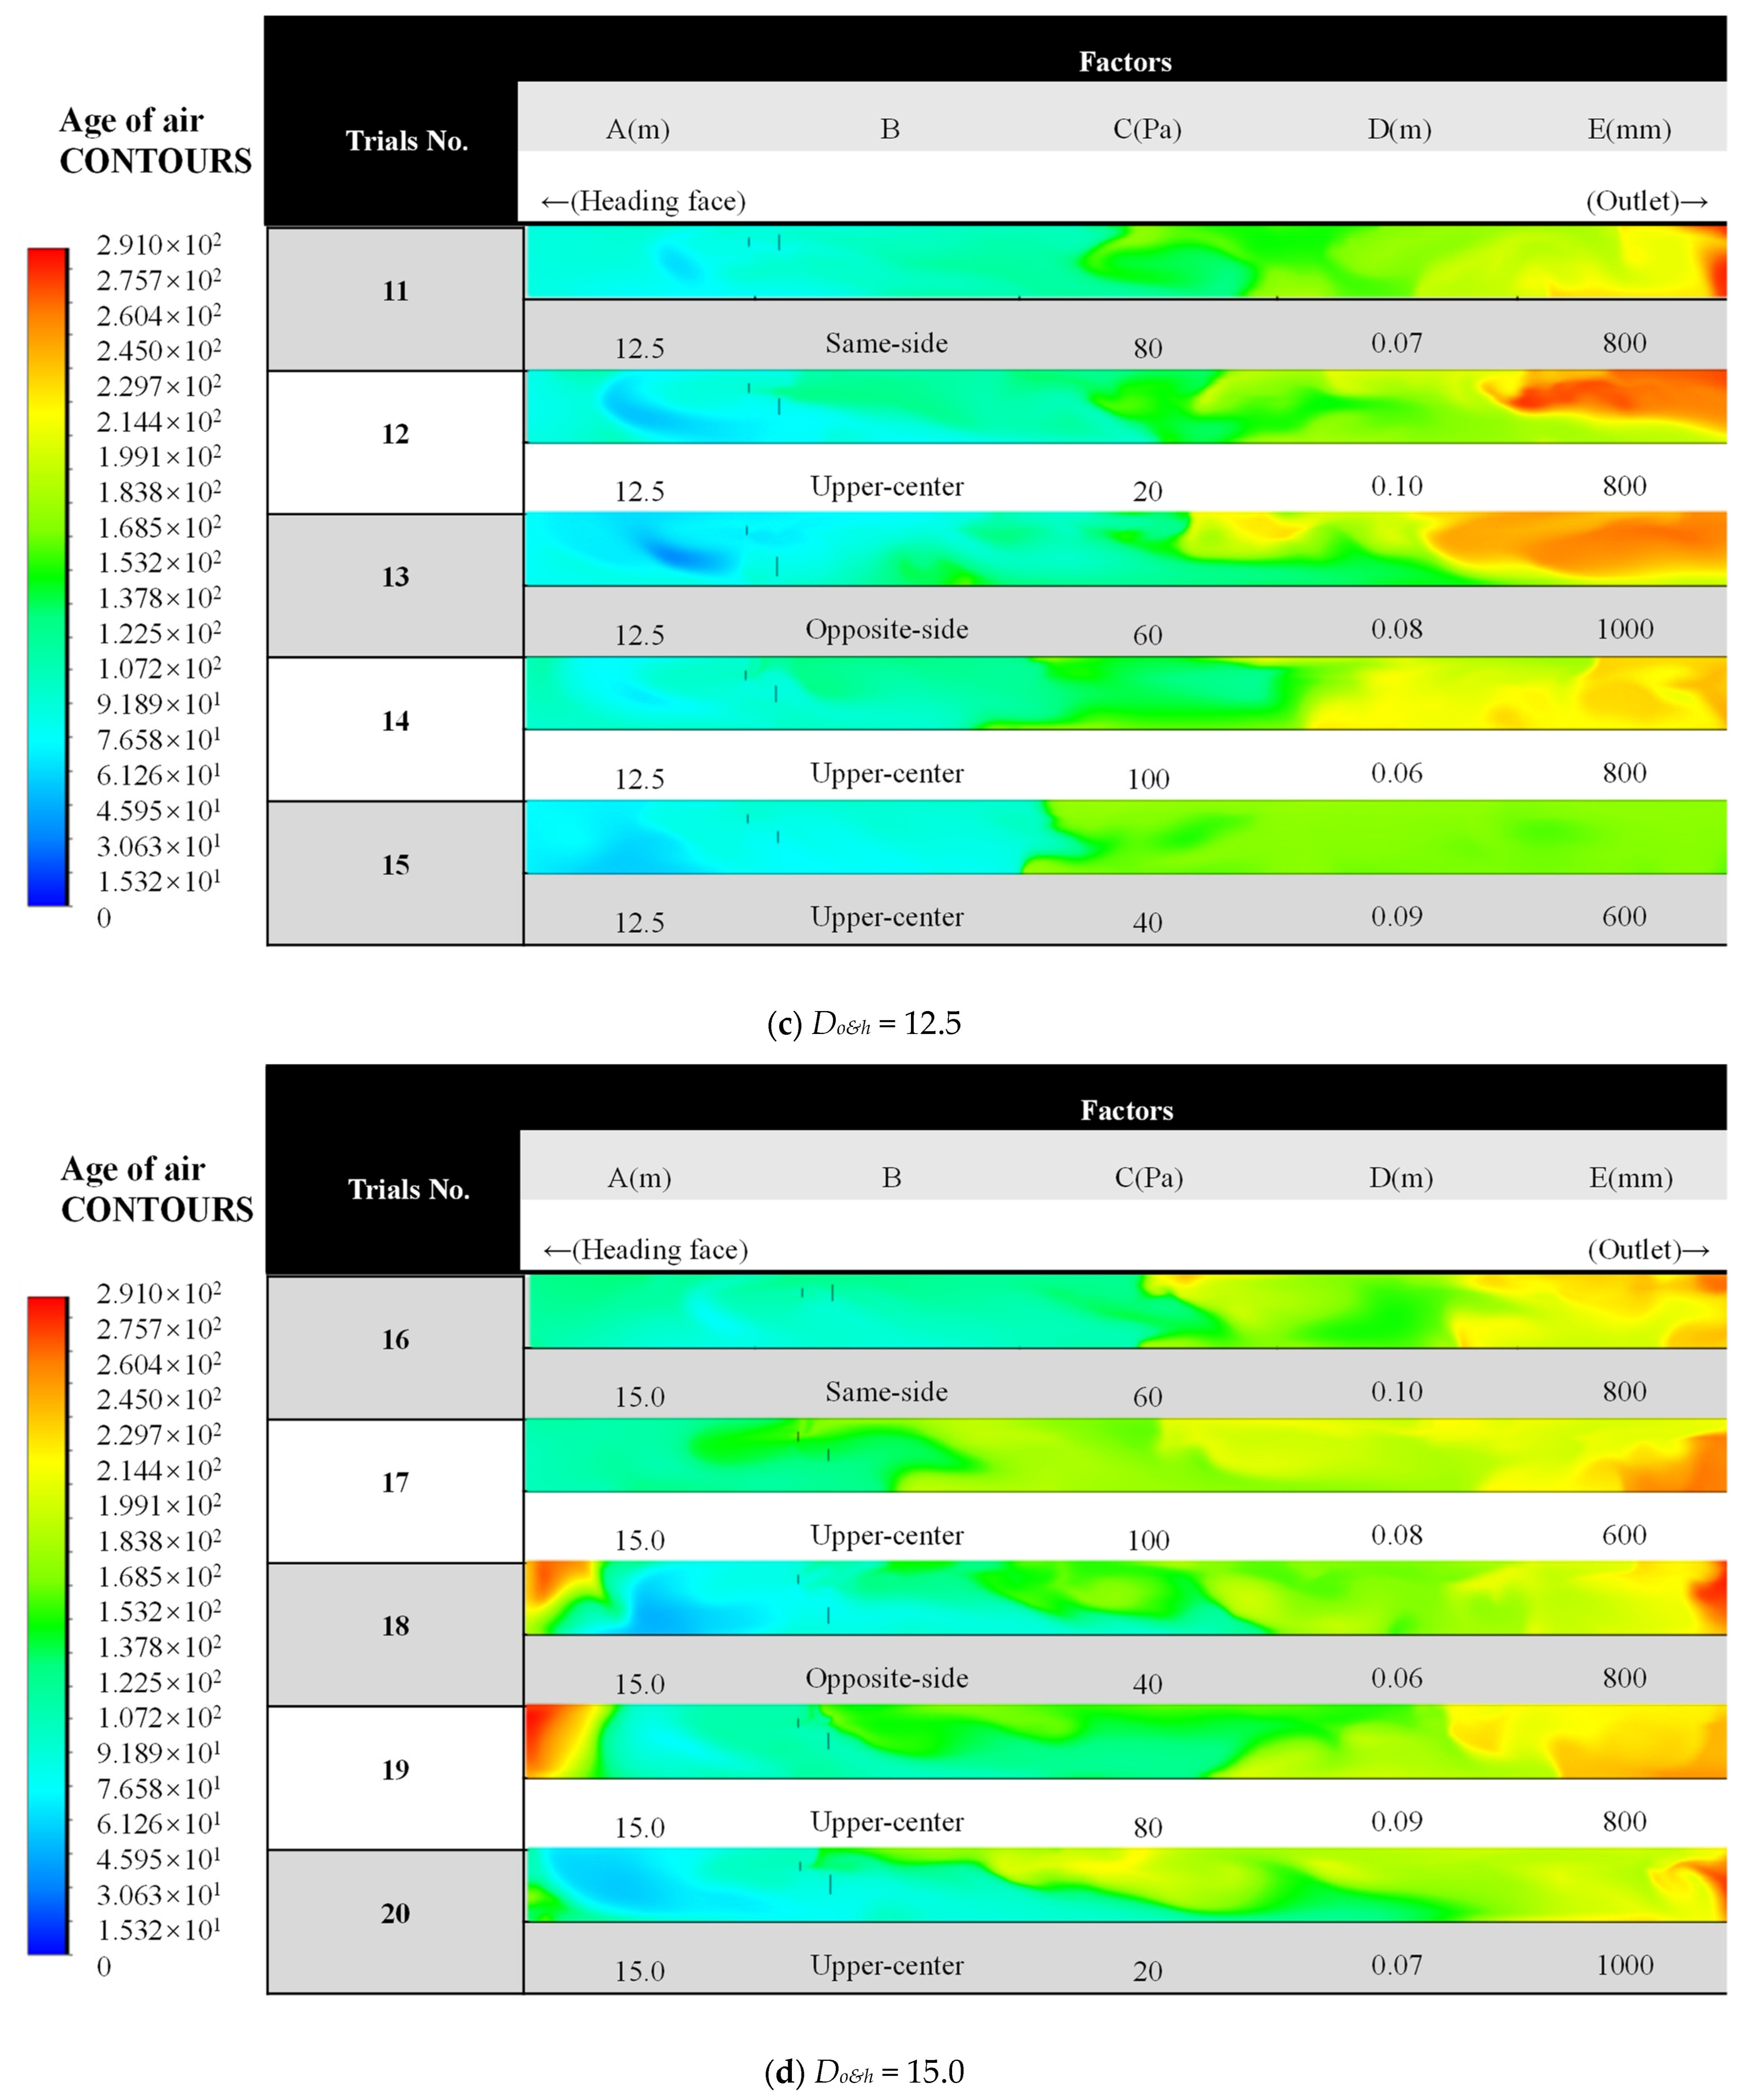
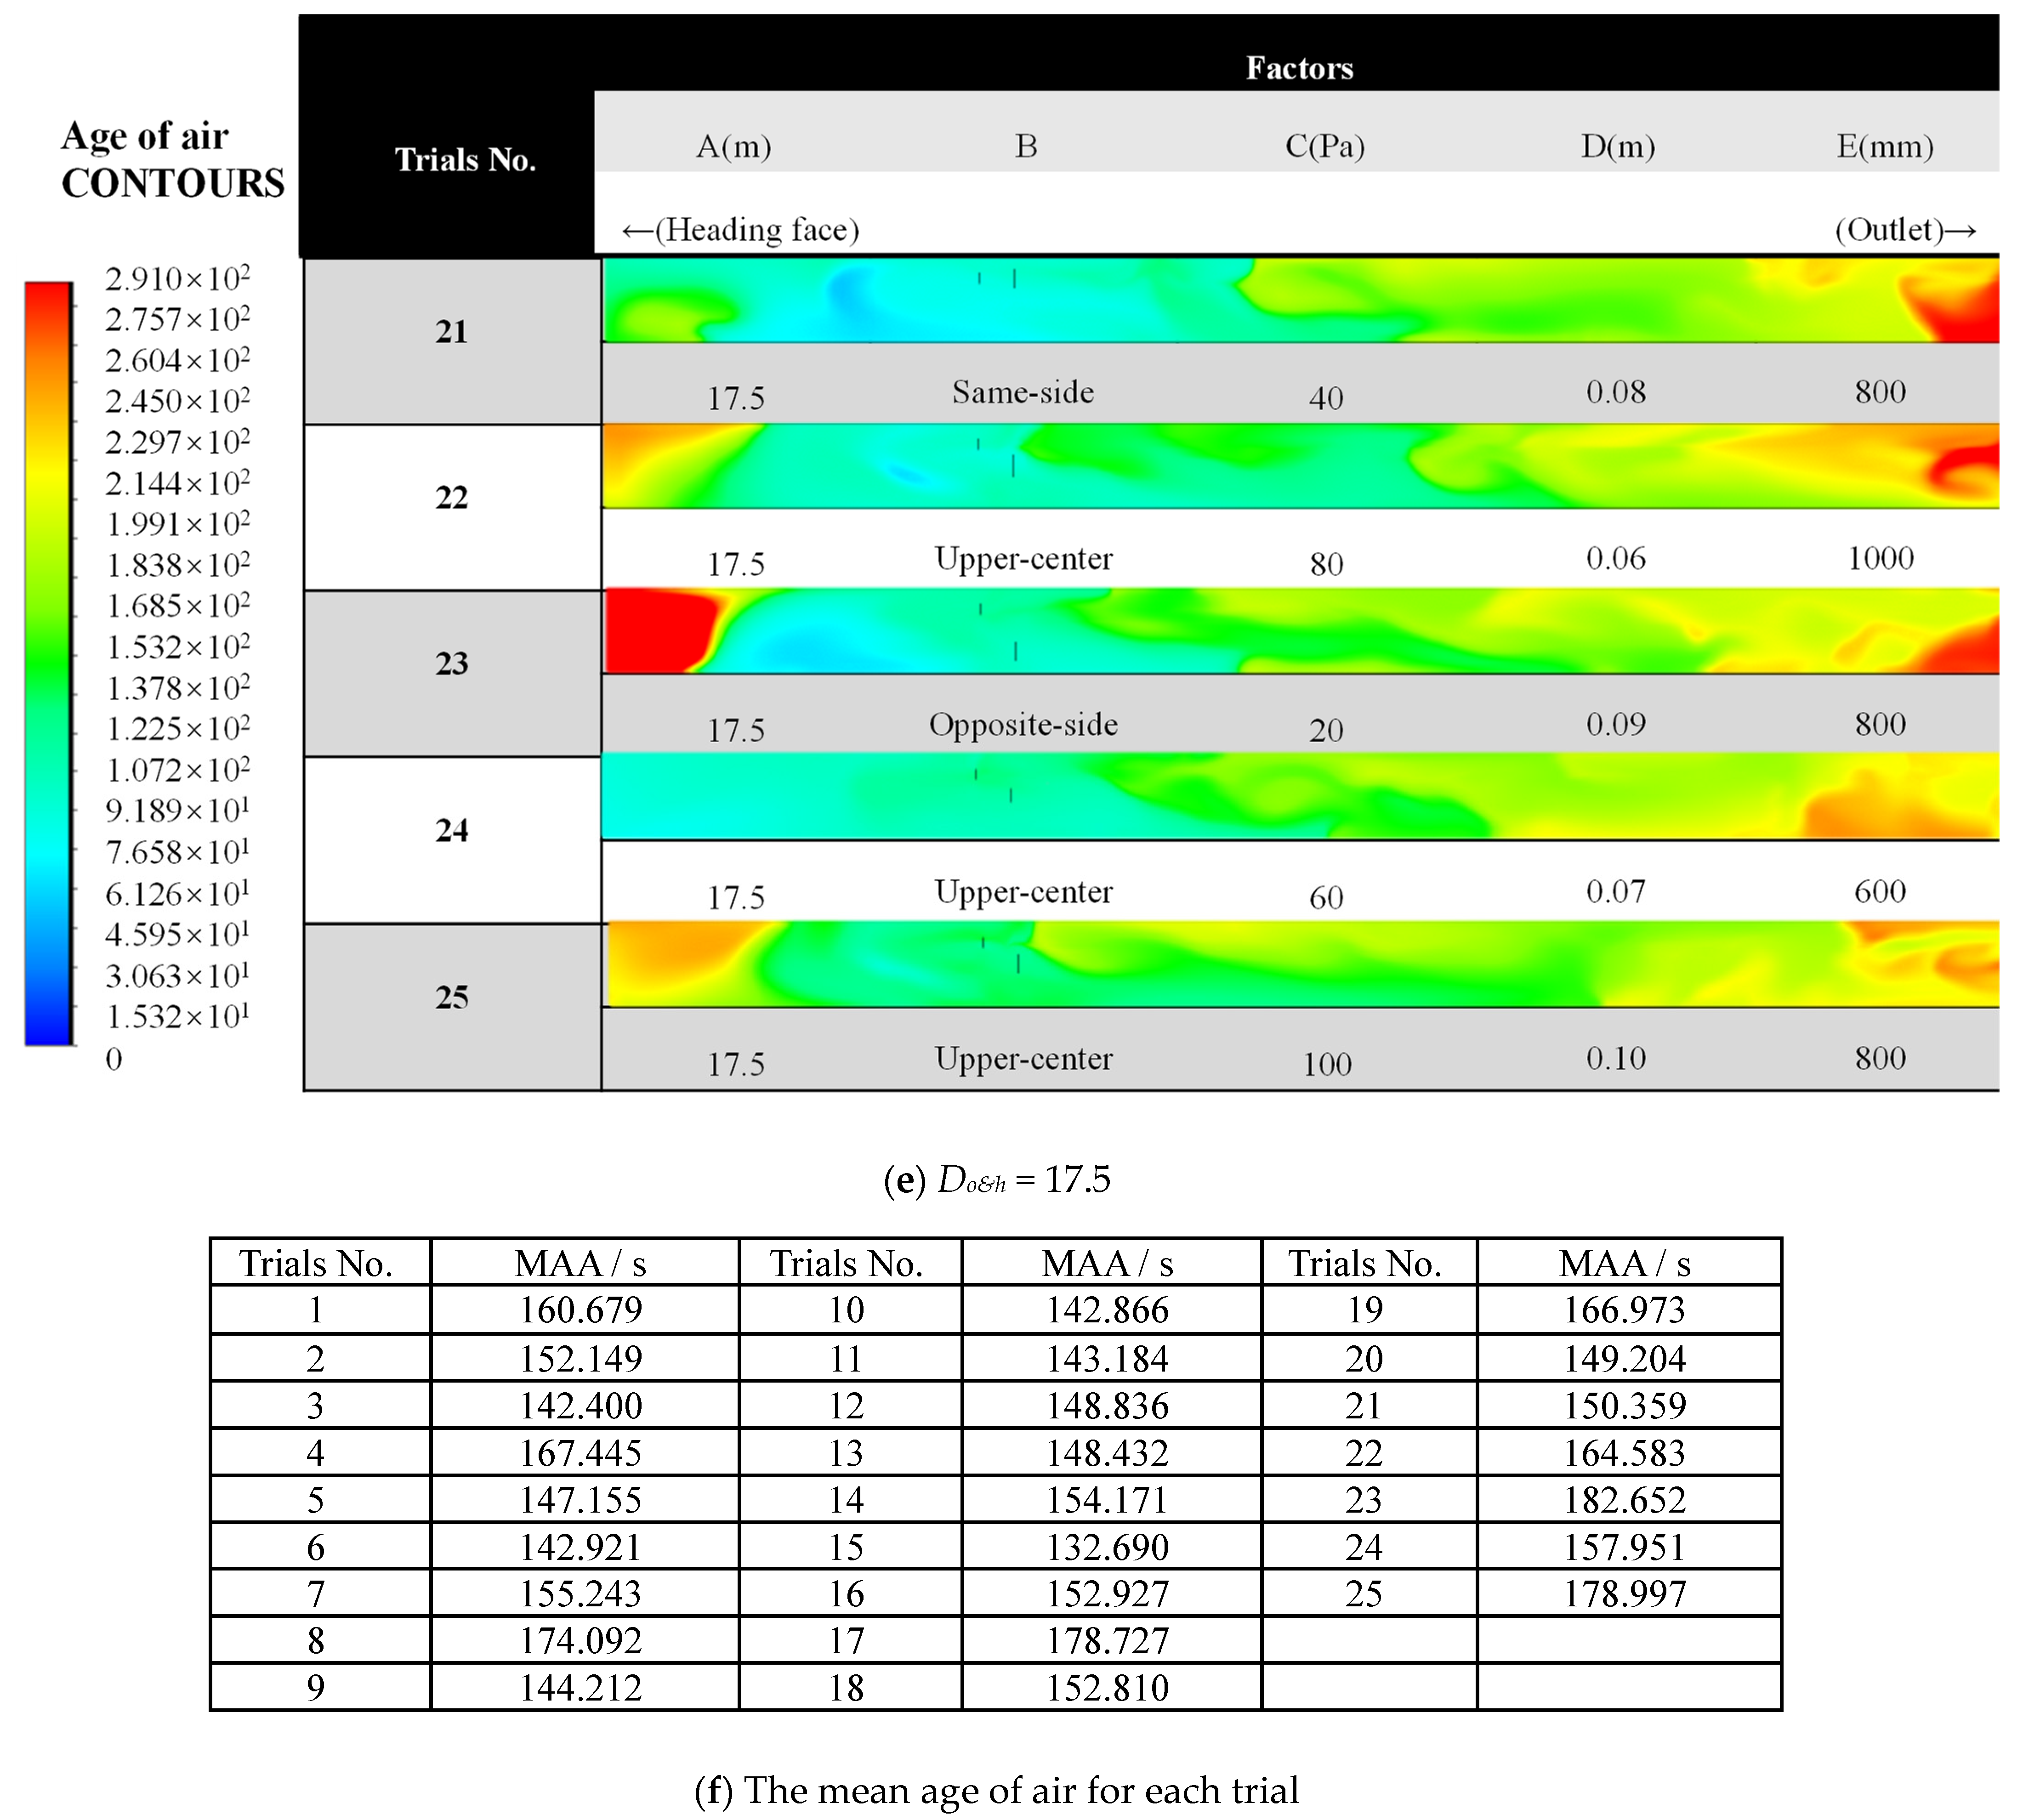
3.1. Simulation Results

The results of simulation are shown in Figure 5 (unit: seconds). Figure 5 shows the age of air contours of the single-heading tunnel at a height of 1.5 m from the floor, which is often considered to be the height of the breathing zone, and the air quality at this height can have a significant impact on the respiratory health of the workers. By taking the average of the age of air for each trial in the breathing zone, the mean age of air for each trial was obtained as shown in Figure 5f.

3.2. Sensitivity Analysis

When analyzing the sensitivity of factors using range analysis method, the aim was to assess the influence degree of the factors in an orthogonal experiment. The range analysis method requires two important statistics: Kij and Rj, where Kij is the sum of results at the i-th level of a factor, and Rj is the difference between the maximum Kij and the minimum Kij of a factor, i.e., Rj = Kij (MAX) − Kij (MIN). The magnitude of Rj can indicate the influence degree of the factor; the larger the Rj, the greater the influence degree its corresponding factor has.
It is worth noting that when the number of levels of each factor is exactly the same, the relationship of the factors’ influence can be determined by Rj. When the number of levels of each factor is not equal, Rj cannot be compared directly because the Rj of the factors with fewer levels would be lower than normal, so the Rj should be corrected by a coefficient at this point [29]. The correction is shown in Equation (17).
R j = R j d n
where Rj is the corrected Rj; d is the correction coefficient, and the value of d is shown in Table 3; and n is the number of results for each level. In this study, the value of n for the factor in five levels is 25/5 = 5, and the value of n for the factor in three levels is 25/3 = 8.33.
The results of the sensitivity analysis of the experiment are shown in Table 4. By comparing the Rj of five factors, the relative influence of the five factors on the MAA can be obtained: distance between the outlet of the duct and the heading face (A) > position of the duct (B) > diameter of oxygen supply duct (D) > diameter of duct (E) > differential pressure of the I.D. fan (C), which shows that the distance between the outlet of the duct and the heading face (Do&h) has the greatest influence on the MAA in the single-heading tunnel. Changing the diameter of the oxygen supply duct has a smaller effect on the MAA than changing Do&h. The effect of the position of the duct in the cross-section on air exchange in the single-heading tunnel is also considerable. The diameter of the oxygen supply duct and the diameter of the duct have a smaller effect on MAA, in which the differential pressure of the I.D. fan has the smallest effect.
The relationships between each factor and MAA are shown in Figure 6. It shows that MAA increases monotonically as the duct moves from the same side as the oxygen supply duct to the opposite side (Factor B), because when the duct and oxygen supply duct are not on the same side, the airflow and oxygen flow will inevitably interfere with each other, resulting in the appearance of large swirls and increasing MAA. This means that in real work, the air duct needs to be placed on the same side as the oxygen supply duct to optimize air exchange.
In terms of Do&h (Factor A), as the Do&h increases, the MAA overall increases. This is due to the increased spacing, which significantly increases the flow distance of air, which in turn leads to an increase in motion time; at the same time, when the airflow pressure drop is constant, the increase in distance will cause the heading face to be outside the effective distance of the airflow, causing the airflow to rotate more and more intensely at the heading face, as shown in Figure 7, which also increases MAA. The increase in Tu in Figure 7 also shows the intensification of rotating of the airflow. It can also be obtained from Figure 6 that MAA does not increase monotonically with Do&h, but decreases first and then increases, meaning that there is a certain value of Do&h that could minimize the MAA. Additionally, as shown in Table 4, a suitable Do&h can reduce MAA by about 14.7% on average.
When keeping the oxygen mass flow rate constant and increasing the diameter of the oxygen supply duct (Factor D), MAA increases overall, too. Because increasing the duct diameter in the case of a constant mass flow rate means lower flow velocity, and lower flow velocity inevitably leads to bad air exchange and increased MAA. The range analysis shows that the effect of Φosd on MAA is considerable and much higher than the effect of Φfad on MAA. As with Do&h, MAA decreases and then increases as Φosd changes, implying that there is a certain value of Φosd that minimizes MAA.
To explore a convenient way to find the specific values of the above two factors which minimize the air age, two sets of simulations (G1 and G2) were conducted. In G1, the duct was set on the same side as the oxygen supply duct in the CFD model, and then Do&h was changed to read the MAA on three lines in the breathing zone of each trial: a center line (line 1), a line on the same side as the ducts (line 2) and a line on the opposite side to the ducts (line 3), as shown in Figure 8. In G2, the duct was set in the upper center, then we changed Φosd and read MAA on Lines 1, 2, and 3.
The results of G1 are shown in Figure 8 and the results of G2 are shown in Table 5. It can be obtained from Figure 8 and Table 5 that the MAA on Line 2 in G1 and Line 1 in G2 has the smallest difference of only 4–6% from the MAA in the breathing zone. The two lines have the following in common: both lines are projected from the axis of the duct to the breathing zone. Based on this finding, when searching for the optimal Do&h and Φosd in real-world work, it is possible to set only a smaller number of sensors on the projection line of the duct in the breathing zone, and then change the Do&h and Φosd and judge the change in MAA to obtain a result that maximizes the air exchange rate within the whole breathing zone. This can reduce the measuring workload and cost.
The weakest correlation was demonstrated between the differential pressure of the I.D. fan (Factor C) and the MAA. MAA shows a U-shaped trend with the increase in the differential pressure of the I.D. fan (Factor C), and then tends to remain constant. The streamlines through the I.D. fan are shown in Figure 9. It can be seen that when the differential pressure is 40 Pa or 60 Pa, the scale of swirls is significantly smaller, which leads to a decrease in MAA. This proves that the differential pressure in the range of 40–60 Pa has good compatibility with this tunnel and can reduce the rotational motion of the airflow nicely, and either increasing or decreasing the differential pressure outside of this range will increase the scale of the swirls. When the differential pressure increases to a certain level, the swirls of the airflow expand to the same scale as the tunnel section and no longer expand, leading to almost stopped changes in MAA.
The effect of the three most commonly used Φfad (Factor E) in real work on the MAA of single-heading tunnels was studied. The 600 mm diameter duct will result in the worst air exchange in the single-heading tunnel, as shown in Figure 6. The 800 mm and 1000 mm diameter ducts can both significantly reduce the MAA of the tunnel, in this study by 4.2%, as shown in Table 4. In real work, one of the two diameters can be chosen according to the needs.

4. Conclusions

(1)
Through CFD analysis, the age of air in the breathing zone of the single-heading tunnel in the Pulang copper mine was obtained, and the MAA under different working conditions was calculated for comparison, providing an optimized reference for air exchange in this tunnel or similar tunnels.
(2)
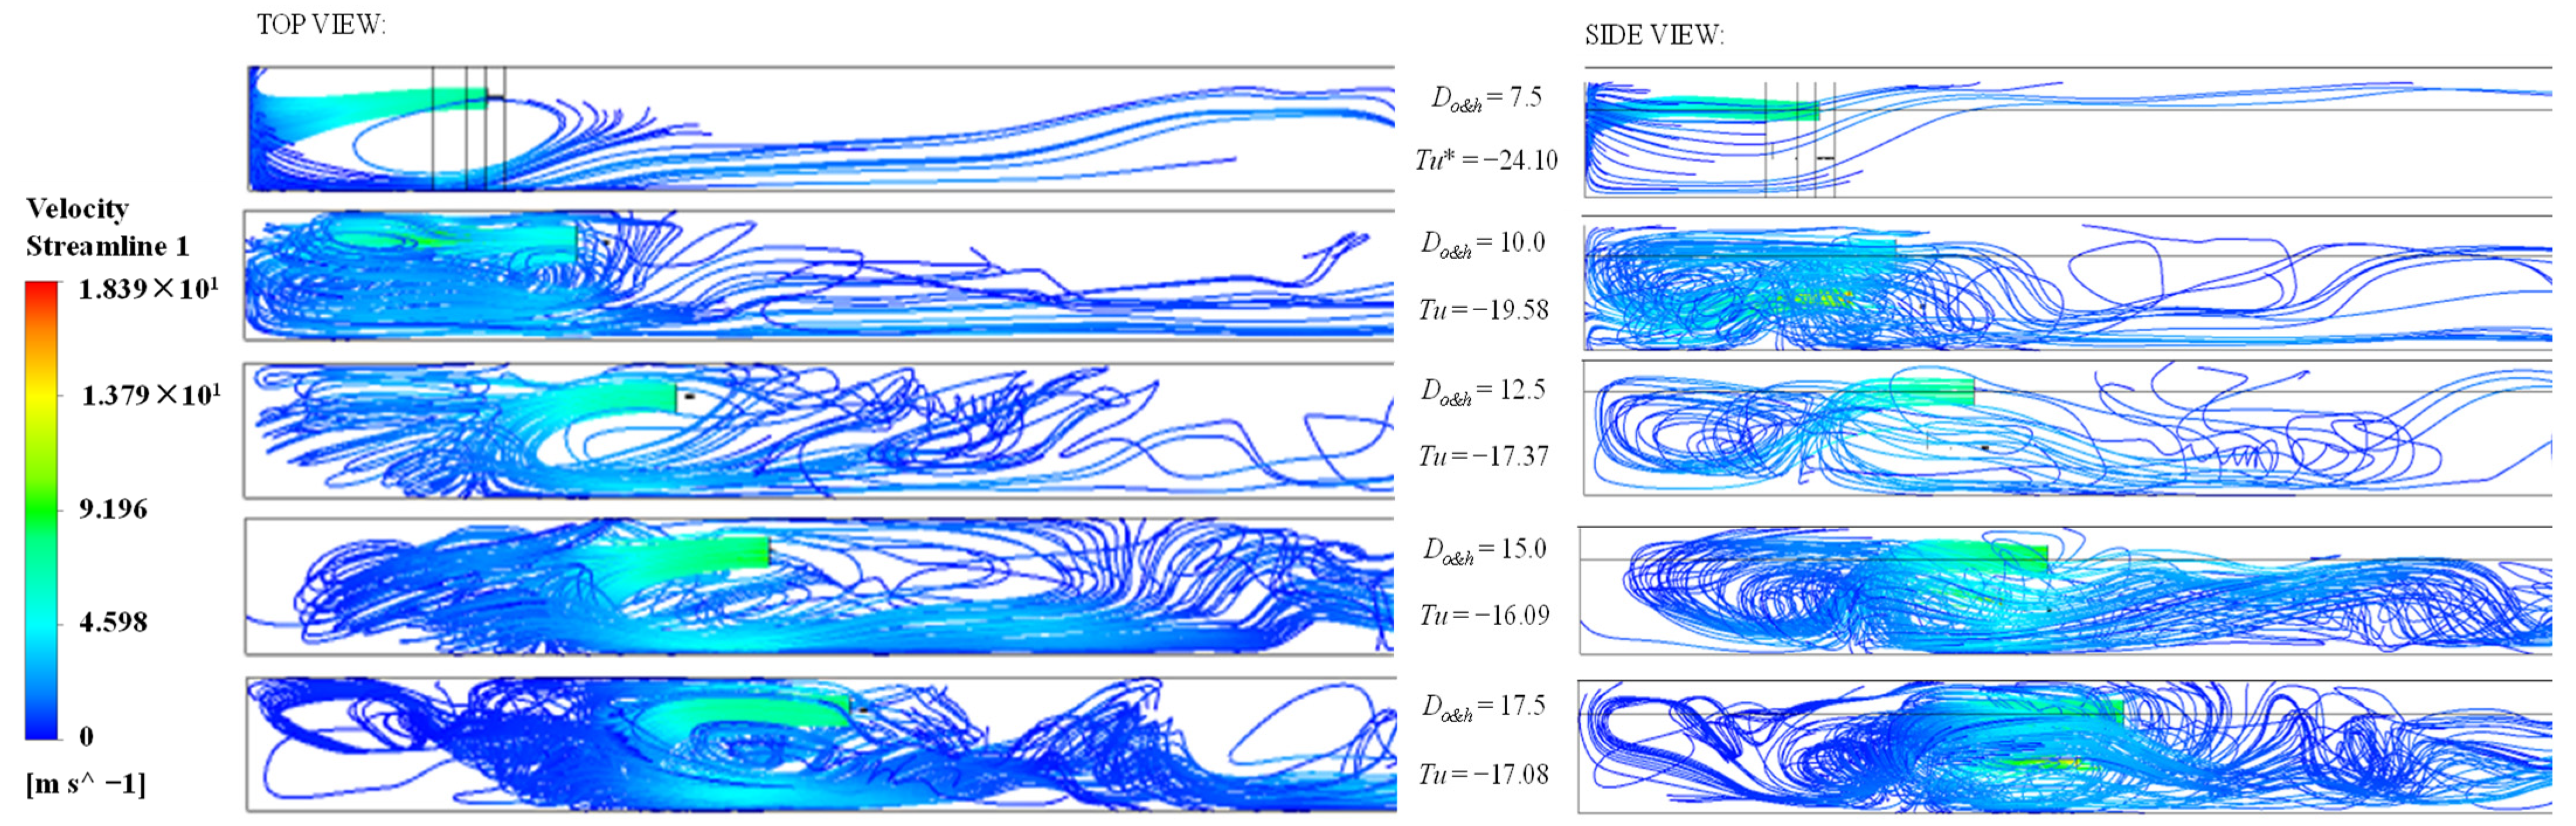
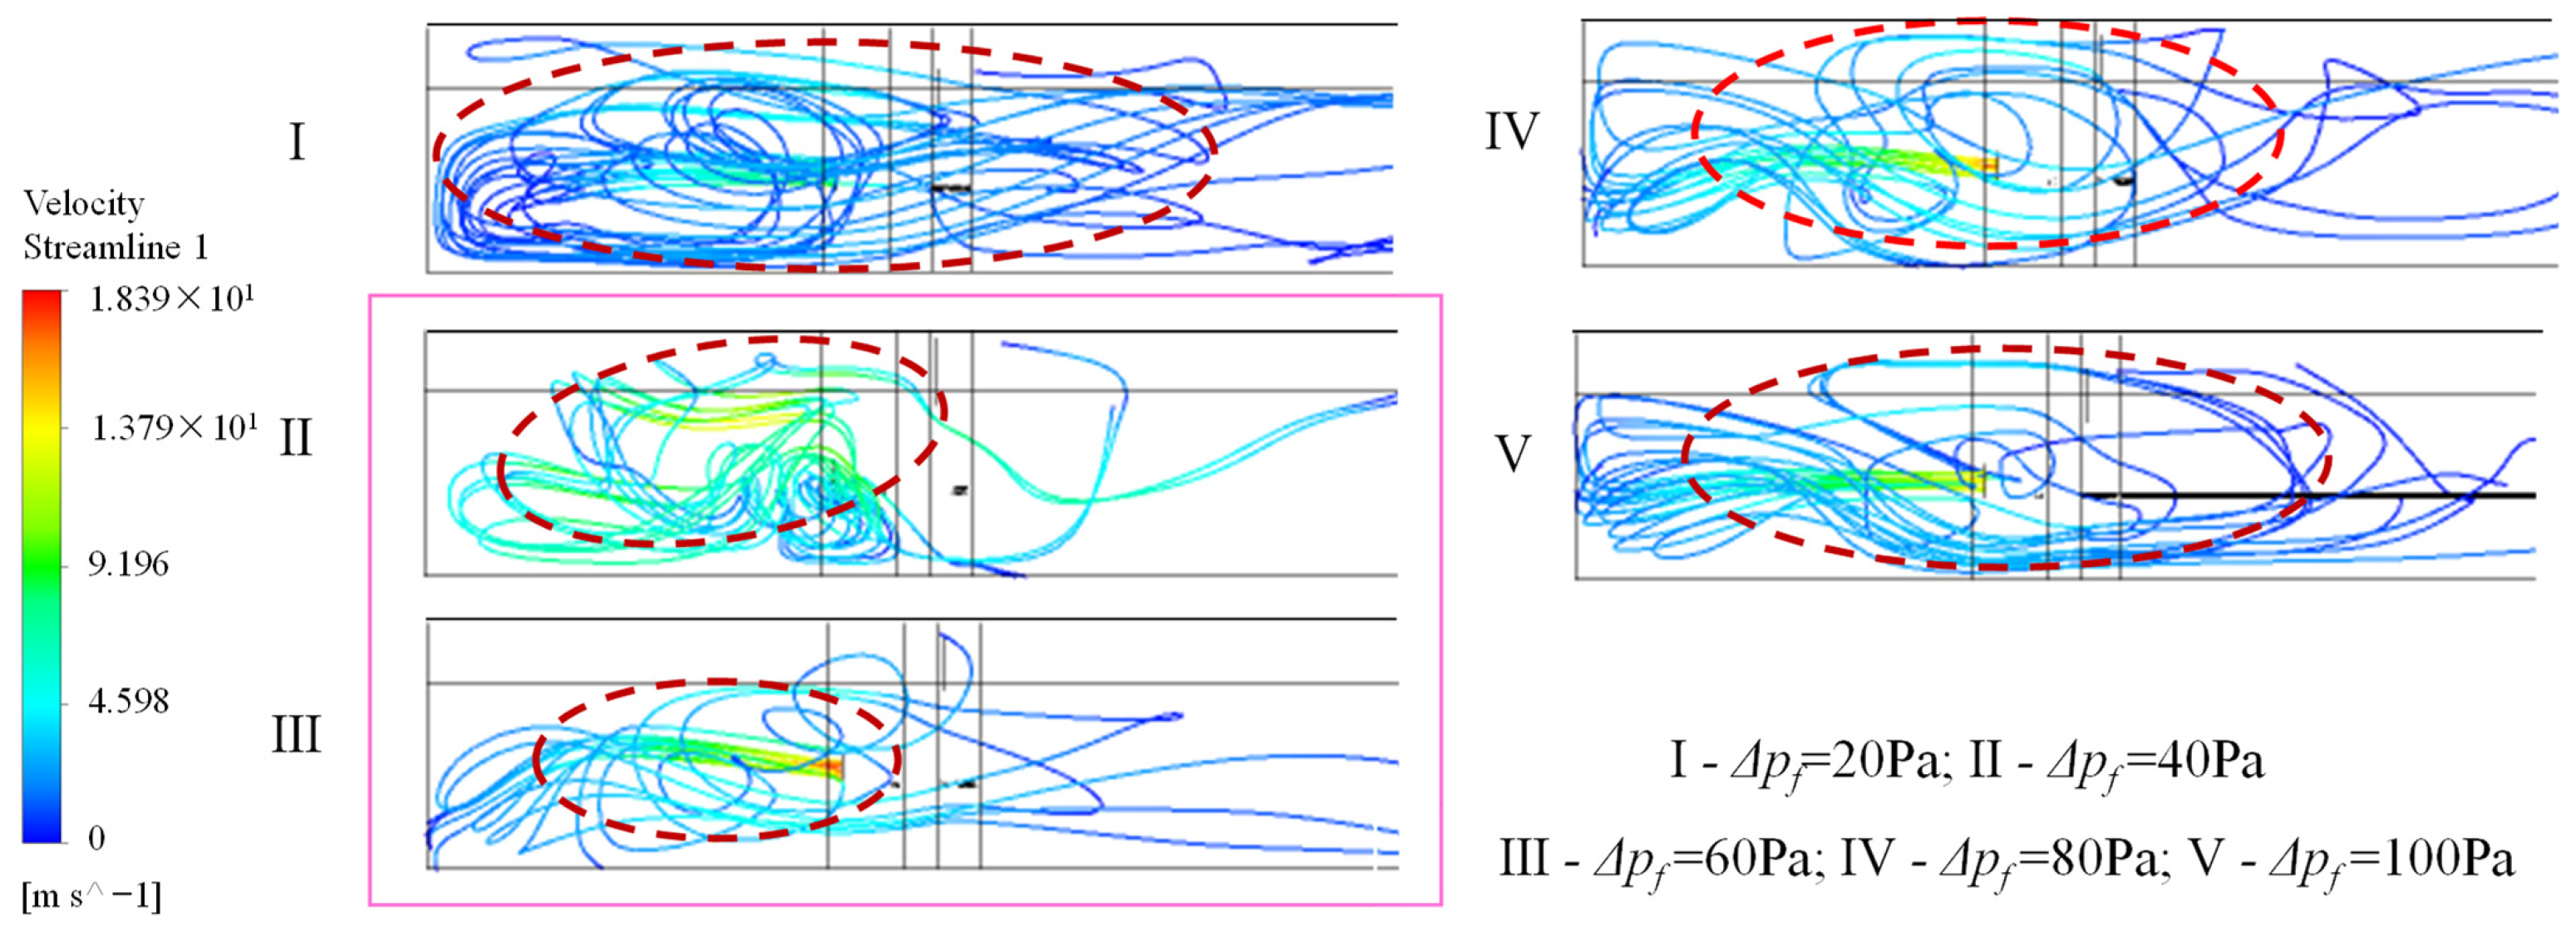
The MAA in the breathing zone of the single-heading tunnel shows an overall rising trend with the increase in Do&h and Φosd, but it will be negative for air exchange if Do&h and Φosd are too small. Using a duct with an inner diameter of 800 or 1000 mm and placing it on the same side as the oxygen supply duct can help reduce MAA. It has no obvious effect on improving air exchange in the tunnel when the differential pressure of the I.D. fan is low; when the differential pressure is increased to a certain range, the I.D. fan will significantly improve air exchange, but too large a differential pressure will worsen air exchange instead.
(3)
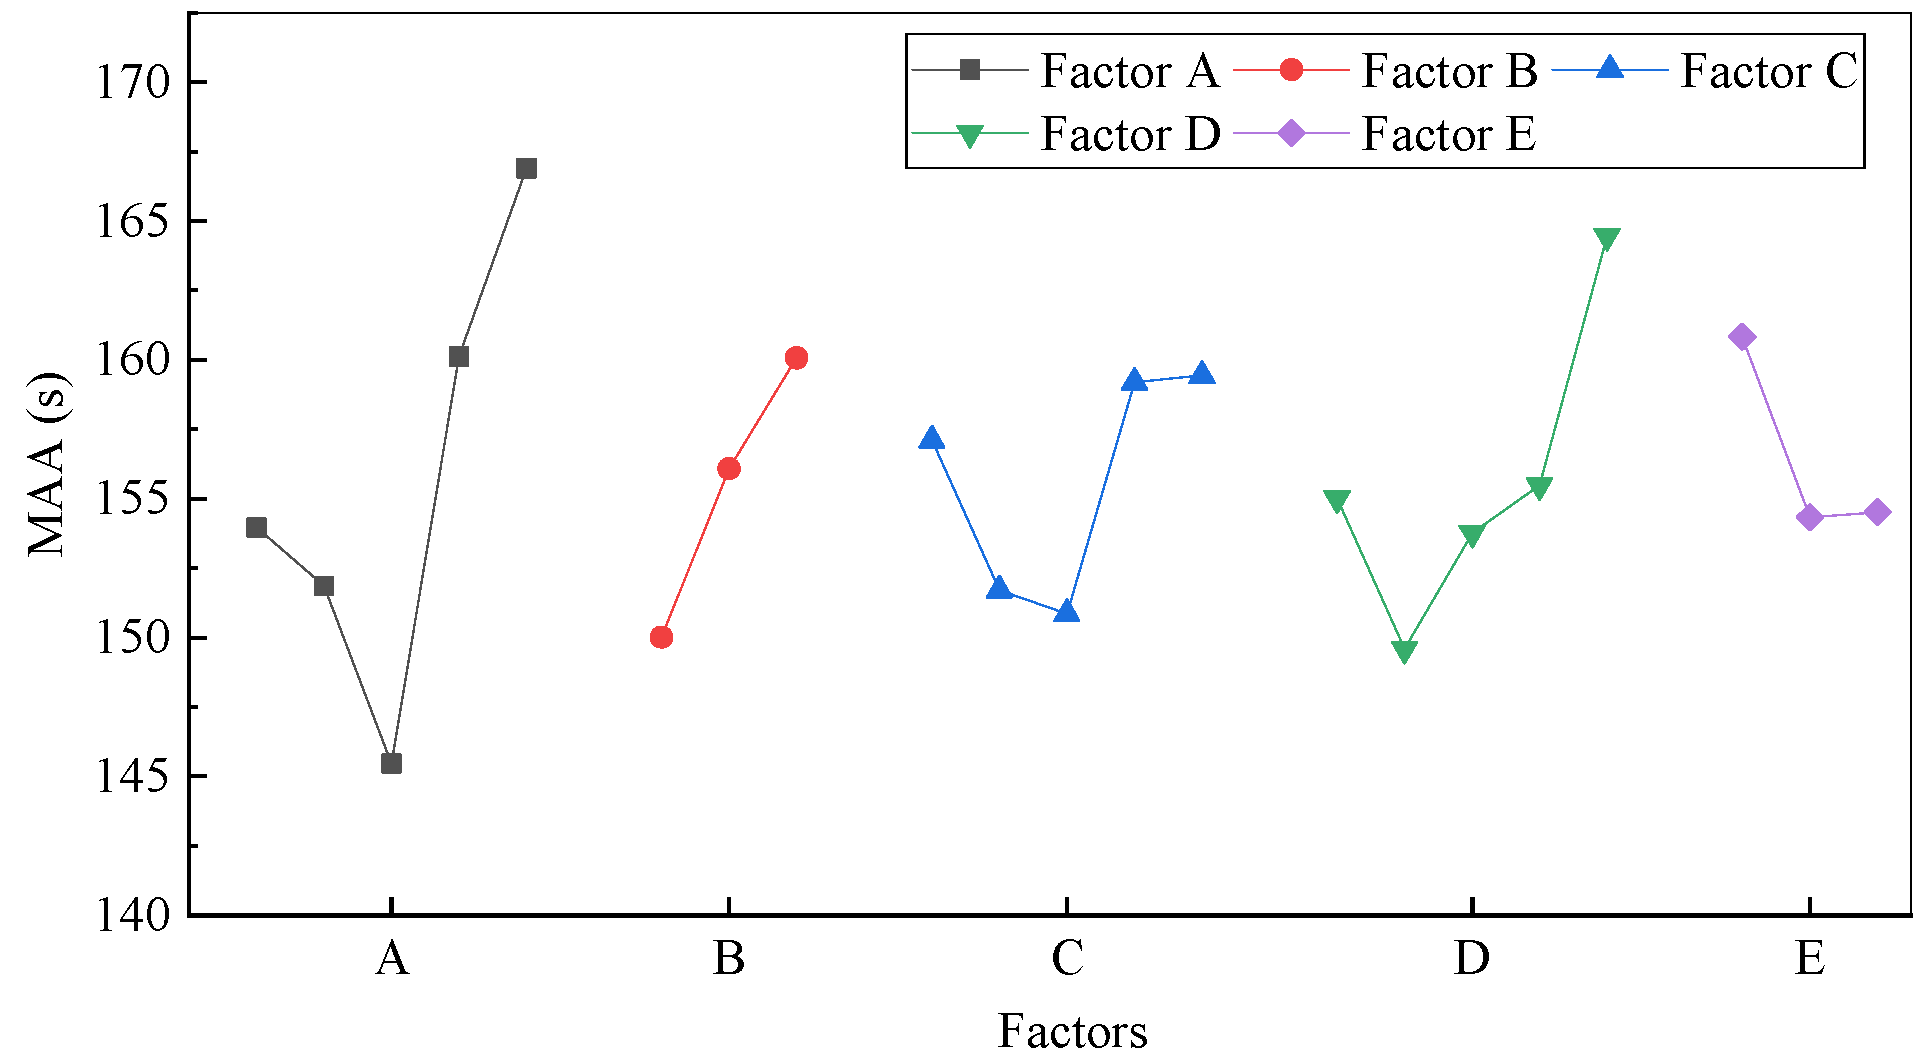
The influence degree ranking of five factors on the MAA: distance between the outlet of the duct and the heading face > position of the duct > diameter of oxygen supply duct > diameter of the duct > differential pressure of the I.D. fan. In real work, adjusting the factors with a high degree of influence can provide a more obvious the effect.
(4)
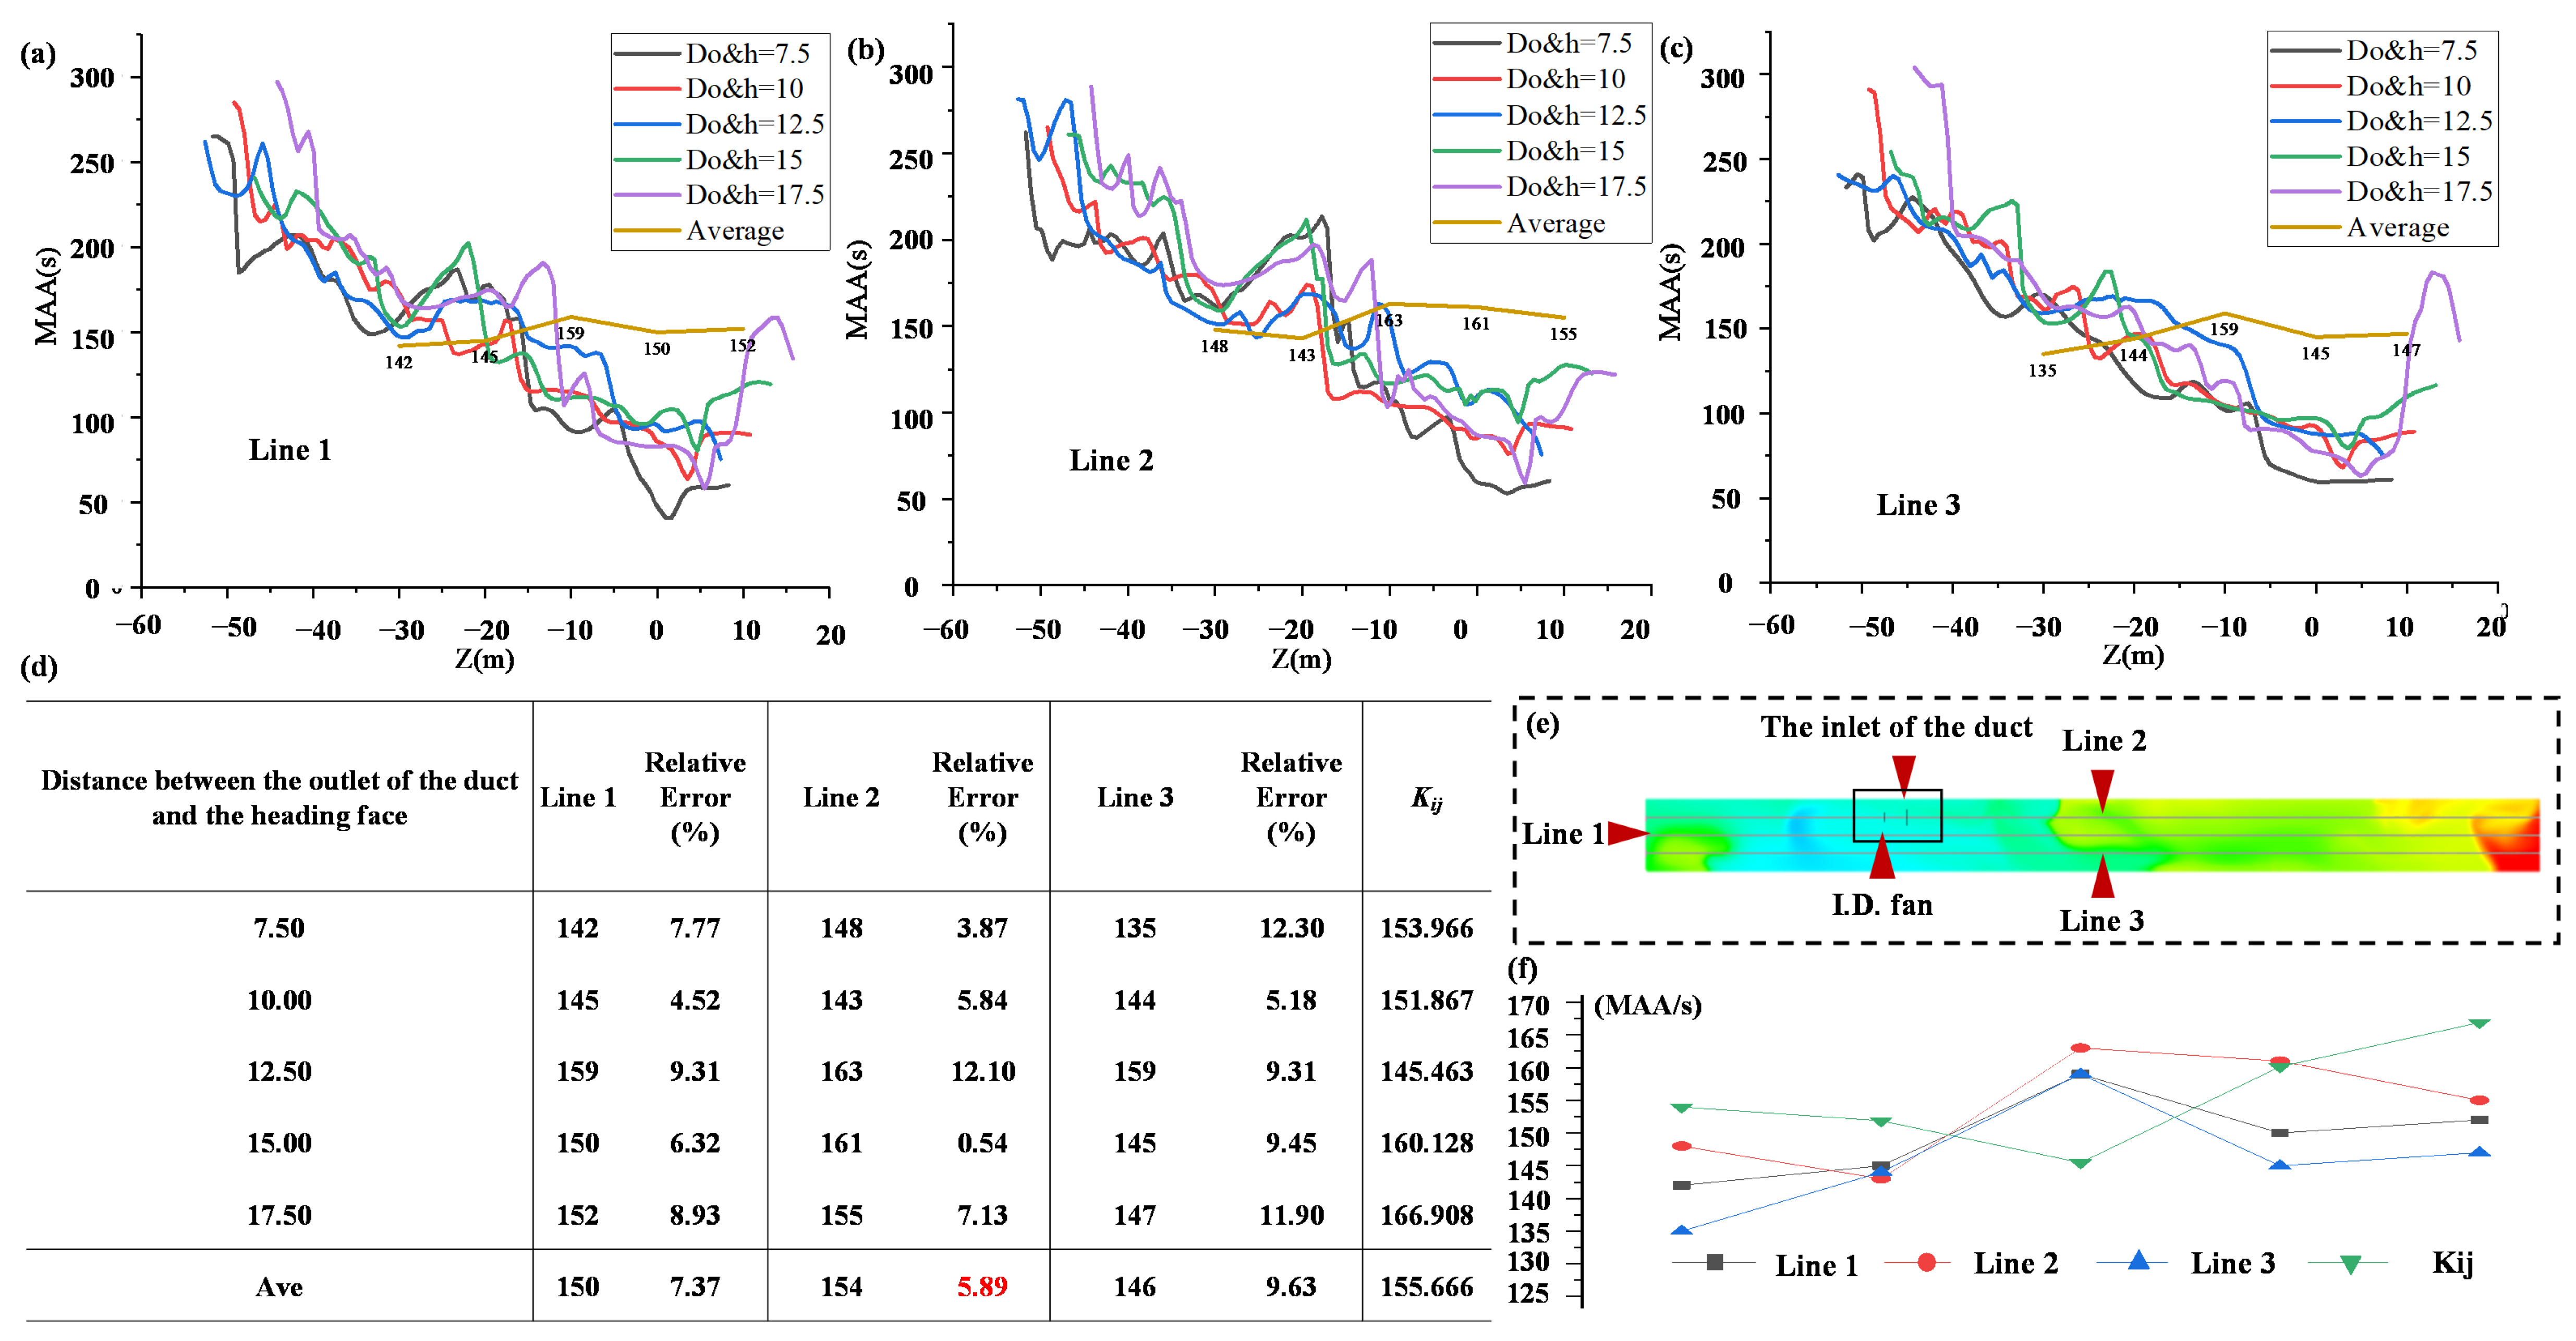
The MAA on the projection line of the duct in the breathing zone has good agreement with the MAA within the entire breathing zone. In real work, the placement of sensors along this projection line enables a low-cost and highly efficient evaluation of air exchange effects for the entire tunnel.
This study seeks to optimize air exchange in high-altitude single-heading tunnels and protect workers’ respiratory health, providing guidance and references for real ventilation optimization work. The findings of the study are also applicable to the optimization of air exchange in high-altitude highway tunnels or railway tunnels under excavation.

Author Contributions

Conceptualization, N.Z.; methodology, M.L., N.Z. and J.W.; software, M.L., N.Z. and J.W.; validation, N.Z. and J.W.; formal analysis, M.L., N.Z. and J.W.; investigation, X.F.; resources, M.L. and X.F.; data curation, N.Z.; writing—original draft preparation, N.Z.; writing—review and editing, M.L. and X.F.; visualization, N.Z.; supervision, M.L. and X.F.; project administration, M.L.; funding acquisition, M.L. All authors have read and agreed to the published version of the manuscript.

Funding

This research was funded by the National Key R&D Program of China (No. 2022YFC2903901; No. 2018YFC0808404).

Institutional Review Board Statement

Not applicable.

Data Availability Statement

Not applicable.

Conflicts of Interest

The authors declare no conflict of interest.

References

  1. Zhang, G.; Jiang, Z.A.; Yang, B.; Yao, S.H.; Peng, Y.; Wang, Y.P. Numerical simulation of the minimum mine dust exhausting wind speed under high altitude environment. J. China Coal Soc. 2021, 46, 2294–2303. [Google Scholar]
  2. Parra, M.T.; Villafruela, J.M.; Castro, F.; Mendez, C. Numerical and experimental analysis of different ventilation systems in deep mines. Build. Environ. 2006, 41, 87–93. [Google Scholar] [CrossRef]
  3. Grove, T.; Van Dyk, T.; Franken, A.; Du Plessis, J. The Evaluation and Quantification of Respirable Coal and Silica Dust Concentrations: A Task-based Approach. J. Occup. Environ. Hyg. 2014, 11, 406–414. [Google Scholar] [CrossRef] [PubMed] [Green Version]
  4. Wang, H.; Wang, D.; Wang, Q.; Jia, Z. Novel Approach for Suppressing Cutting Dust Using Foam on a Fully Mechanized Face with Hard Parting. J. Occup. Environ. Hyg. 2014, 11, 154–164. [Google Scholar] [CrossRef]
  5. Lutz, E.A.; Reed, R.J.; Lee, V.S.; Burgess, J.L. Occupational Exposures to Emissions from Combustion of Diesel and Alternative Fuels in Underground Mining-A Simulated Pilot Study. J. Occup. Environ. Hyg. 2015, 12, D18–D25. [Google Scholar] [CrossRef]
  6. Sandberg, M. What is ventilation efficiency? Build. Environ. 1981, 16, 123–135. [Google Scholar] [CrossRef]
  7. Ascione, F.; De Masi, R.F.; Mastellone, M.; Vanoli, G.P. The design of safe classrooms of educational buildings for facing contagions and transmission of diseases: A novel approach combining audits, calibrated energy models, building performance (BPS) and computational fluid dynamic (CFD) simulations. Energy Build. 2021, 230, 110533. [Google Scholar] [CrossRef]
  8. Buratti, C.; Mariani, R.; Moretti, E. Mean age of air in a naturally ventilated office: Experimental data and simulations. Energy Build. 2011, 43, 2021–2027. [Google Scholar] [CrossRef]
  9. Chanteloup, V.; Mirade, P.-S. Computational fluid dynamics (CFD) modelling of local mean age of air distribution in forced-ventilation food plants. J. Food Eng. 2009, 90, 90–103. [Google Scholar] [CrossRef]
  10. Zhai, Z.; Xue, Y.; Chen, Q. Inverse design methods for indoor ventilation systems using CFD-based multi-objective genetic algorithm. Build. Simul. 2014, 7, 661–669. [Google Scholar] [CrossRef]
  11. Yin, H.; Li, Y.; Zhang, D.; Han, Y.; Wang, J.; Zhang, Y.; Li, A. Airflow pattern and performance of attached ventilation for two types of tiny spaces. Build. Simul. 2022, 15, 1491–1506. [Google Scholar] [CrossRef]
  12. Lee, D.-K. A Computational Flow Analysis for Choosing the Diameter and Position of an Air Duct in a Working Face. J. Min. Sci. 2011, 47, 664–674. [Google Scholar] [CrossRef]
  13. Park, J.; Jo, Y.; Park, G. Flow characteristics of fresh air discharged from a ventilation duct for mine ventilation. J. Mech. Sci. Technol. 2018, 32, 1187–1194. [Google Scholar] [CrossRef]
  14. Zhang, C.Z.; Yang, X.; Li, Z.; Liu, Y.; Zhao, Y.; Wang, H.; Ma, X.; Li, C.; Zhang, Y. Experimental and Numerical Model Investigations of Oxygen-Enriched Characteristics in Air-Conditioned Rooms. Appl. Sci. 2021, 11, 4733. [Google Scholar] [CrossRef]
  15. Hu, S.C.; Chuah, Y.K. Deterministic simulation and assessment of air-recirculation performance of unidirectional-flow cleanrooms that incorporate age of air concept. Build. Environ. 2003, 38, 563–570. [Google Scholar] [CrossRef]
  16. Ministry of Emergency Management of the China. Ventilation Technical Standards for Metal and Nonmetal Underground Mines; Ministry of Emergency Management of the China: Beijing, China, 2008; p. 10.
  17. Lv, W.; Ma, J.; Cui, H.; Zhang, X.; Zhang, W.; Guo, Y. Relative importance of certain factors affecting the thermal environment in subway stations based on field and orthogonal experiments. Sustain. Cities Soc. 2020, 56, 102107. [Google Scholar] [CrossRef]
  18. Bozhong, X. Orthogonal Experimental Method; Jilin People’s Press: Changchun, China, 1985. [Google Scholar]
  19. Fang, K. Orthogonal and Uniform Experimental Design; China Science Publishing & Media: Beijing, China, 2001. [Google Scholar]
  20. Krol, A.; Krol, M. Study on numerical modeling of jet fans. Tunn. Undergr. Space Technol. 2018, 73, 222–235. [Google Scholar] [CrossRef]
  21. Xiu, Z.; Nie, W.; Yan, J.; Chen, D.; Cai, P.; Liu, Q.; Du, T.; Yang, B. Numerical simulation study on dust pollution characteristics and optimal dust control air flow rates during coal mine production. J. Clean. Prod. 2020, 248, 119197. [Google Scholar] [CrossRef]
  22. Wu, T.; Lei, C. On numerical modelling of conjugate turbulent natural convection and radiation in a differentially heated cavity. Int. J. Heat Mass Transf. 2015, 91, 454–466. [Google Scholar] [CrossRef]
  23. Chen, T.; Feng, Z.; Cao, S.-J. The effect of vent inlet aspect ratio and its location on ventilation efficiency. Indoor Built Environ. 2020, 29, 180–195. [Google Scholar] [CrossRef]
  24. Damin, Z.; Xiugan, Y. Numerical solution of age of air. J. Beijing Univ. Aeronaut. Astronaut. 1997, 23, 35–40. [Google Scholar]
  25. Hua, Z.; Nailian, H.; Guoqing, L.; Jie, H. On the oxygen-intensifying ventilation technology for plateau mine tunneling via the application of the software Fluent. J. Saf. Environ. 2017, 17, 81–85. [Google Scholar]
  26. Li, X.; Cai, H.; Li, R.; Zhao, Y.; Ma, X.; Shao, X. A theoretical model to calculate the distribution of air age in general ventilation system. Build. Serv. Eng. Res. Technol. 2012, 33, 159–180. [Google Scholar] [CrossRef]
  27. Contrada, F.; Causone, F.; Allab, Y.; Kindinis, A. A new method for air exchange efficiency assessment including natural and mixed mode ventilation. Energy Build. 2022, 254, 111553. [Google Scholar] [CrossRef] [PubMed]
  28. Cui, S.; Cohen, M.; Stabat, P.; Marchio, D. CO2 tracer gas concentration decay method for measuring air change rate. Build. Environ. 2015, 84, 162–169. [Google Scholar] [CrossRef]
  29. Li, J.; Li, F.; Fan, J. Statistics; Nanjing University Press: Nanjing, China, 2020; p. 335. [Google Scholar]
Figure 1. (a) Front-view of the simulation model; (b) side-view of the simulation model; (c) 3D simulation model of the single-heading tunnel; (d) localized enlargement of the 3D simulation model.
Mathematics 11 01700 g001
Figure 2. Orthogonal experimental factors of the study.
Mathematics 11 01700 g002
Figure 3. (a) Meshes of the 3D simulation model; (b) numbers of meshes for each trial; (c) independent verification test results of the meshes: comparison of flow velocity line graphs for different quality meshes (the flow velocity on the centerline of 1.5 m height from the floor was compared).
Mathematics 11 01700 g003aMathematics 11 01700 g003b
Figure 4. (a) The schematic diagram of the small model test; (b) the physical diagram of the small model test; (c) decay curves of CO2 concentration at each monitoring point of the small model by experiment; (d) comparisons of the experiment and simulation results.
Mathematics 11 01700 g004
Figure 5. Contours of age-of-air CFD analysis in the single-heading tunnel and the MAA for each trial.
Mathematics 11 01700 g005aMathematics 11 01700 g005bMathematics 11 01700 g005c
Figure 6. Relationship between factors and MAA in the single-heading tunnel (Each point on the curves represents a reasonable level of that factor, and the order is shown in Section 2.2.2).
Mathematics 11 01700 g006
Figure 7. Streamlines of airflow in the single-heading tunnel as Do&h increases (the streamlines’ color represents the flow velocity) and change in the turbulence intensity of the single-heading tunnel as Do&h increases (*: Tu—turbulence intensity, ratio of the standard deviation of the localized air flow velocity to the localized mean flow velocity.
Mathematics 11 01700 g007
Figure 8. (a) The MAA on Line 1 when changing Do&h; (b) The MAA on Line 2 when changing Do&h; (c) The MAA on Line 3 when changing Do&h; (d) The average MAA on each line when changing Do&h and comparing with average Kij; (e) Three lines set in the breathing zone; (f) The curves of the average MAA on each line and average Kij.
Mathematics 11 01700 g008
Figure 9. Streamlines of the single-heading tunnel under different I.D. fan differential pressure; the dotted lines indicate the size of swirls, and the two trials in the pink rectangle reach the minimum size of swirls (50 lines for each, and the streamlines’ color represents the flow velocity).
Mathematics 11 01700 g009
Table 1. The mixed-level orthogonal experiments scheme of L25(53·32).
Trials No.Factors
ABCDE
17.5Same side200.06600
27.5Upper center600.09800
37.5Opposite side1000.07800
47.5Upper center400.101000
57.5Upper center800.08800
610.0Same side1000.091000
710.0Upper center400.07800
810.0Opposite side800.10600
910.0Upper center200.08800
1010.0Upper center600.06800
1112.5Same side800.07800
1212.5Upper center200.10800
1312.5Opposite side600.081000
1412.5Upper center1000.06800
1512.5Upper center400.09600
1615.0Same side600.10800
1715.0Upper center1000.08600
1815.0Opposite side400.06800
1915.0Upper center800.09800
2015.0Upper center200.071000
2117.5Same side400.08800
2217.5Upper center800.061000
2317.5Opposite side200.09800
2417.5Upper center600.07600
2517.5Upper center1000.10800
Table 2. The high-altitude environment parameters and boundary conditions of CFD analysis.
High-Altitude Environment ParametersValues
The air volume flow rates required at the heading face calculated using the minimum dust exhaust airflow velocity (Q)179.77 m3/min
The inlet flow velocity of the duct10.596 m/s (600 mm), 5.960 m/s (800 mm), 3.815 m/s (1000 mm)
The atmospheric pressure at the altitude of 3400 m (p3400)66.61 kPa
The temperature at the altitude of 3400 m (T3400)272.75 K
The air density at 3400 m altitude (ρ3400)0.85 kg/m3
The oxygen volume flow rates required (x)3.12 m3/min
The inlet flow velocity of the oxygen supply duct18.391 m/s (0.06 m), 13.512 m/s (0.07 m), 10.345 m/s (0.08 m), 8.174 m/s (0.09 m), 6.621 m/s (0.10 m)
Inlet type of duct and oxygen supply ductVelocity-Inlet
Oxygen mass fraction of duct and the single-heading tunnel20.9%
User-defined scalar boundary condition of inletsSpecified constant: 0 s
Outlet typePressure-Outlet
Relative pressure at the outlet0 Pa
Turbulence intensity4.19%
Turbulent viscosity ratio66.07
Table 3. The correction coefficient.
LevelsCorrection Coefficient dLevelsCorrection Coefficient dLevelsCorrection Coefficient d
20.7150.4080.34
30.5260.3790.32
40.4570.35100.31
Table 4. The results of the range analysis of the experiment.
Factors
ABCDE
K1j769.828750.070785.583775.109804.139
K2j759.3342341.202758.547747.9822314.934
K3j727.313800.386754.325768.885772.585
K4j800.641——795.987777.385——
K5j834.542——797.216822.297——
K1javg153.966150.014157.117155.022160.828
K2javg151.867156.080151.709149.596154.329
K3javg145.463160.077150.865153.777154.517
K4javg160.128——159.197155.477——
K5javg166.908——159.443164.459——
Range (Percents)14.7%6.7%5.7%9.9%4.2%
Rj21.44510.0638.57814.8636.499
Rj19.18115.1067.67213.2949.756
RankingA > B > D > E > C
Table 5. Three lines set in the breathing zone and the average MAA on each line when changing φosd.
φosdLine 1Relative Error (%)Line 2Relative Error (%)Line 3Relative Error (%)Kij
0.06141.888.48147.015.17138.3610.75155.022
0.07155.804.15159.086.34152.011.61149.596
0.08144.166.25148.113.69145.835.17153.777
0.09153.931.00164.425.75143.567.66155.477
0.1166.501.24166.611.31167.952.12164.459
Ave152.4544.224157.0464.452149.5425.462155.666
Disclaimer/Publisher’s Note: The statements, opinions and data contained in all publications are solely those of the individual author(s) and contributor(s) and not of MDPI and/or the editor(s). MDPI and/or the editor(s) disclaim responsibility for any injury to people or property resulting from any ideas, methods, instructions or products referred to in the content.

