Abstract
Accurate grasping state detection is critical to the dexterous operation of robots. Robots must use multiple modalities to perceive external information, similar to humans. The direct fusion method of visual and tactile sensing may not provide effective visual–tactile features for the grasping state detection network of the target. To address this issue, we present a novel visual–tactile fusion model (i.e., RFCT) and provide an incremental dimensional tensor product method for detecting grasping states of weak-stiffness targets. We investigate whether convolutional block attention mechanisms (CBAM) can enhance feature representations by selectively attending to salient visual and tactile cues while suppressing less important information and eliminating redundant information for the initial fusion. We conducted 2250 grasping experiments using 15 weak-stiffness targets. We used 12 targets for training and three for testing. When evaluated on untrained targets, our RFCT model achieved a precision of 82.89%, a recall rate of 82.07%, and an F1 score of 81.65%. We compared RFCT model performance with various combinations of Resnet50 + LSTM and C3D models commonly used in grasping state detection. The experimental results show that our RFCT model significantly outperforms these models. Our proposed method provides accurate grasping state detection and has the potential to provide robust support for robot grasping operations in real-world applications.
Keywords:
visual–tactile fusion perception; target grasping state detection; grasping; multimodal perception MSC:
68T40
1. Introduction
Recently, with the rapid increase in demand for robot operations in both industry and the service sector, the grasping ability of robots has become increasingly crucial [1,2]. Robot grasping is a complex problem that encompasses various research domains, with grasp stability prediction and post-grasp slip detection emerging as two key tasks garnering significant attention in the field of robot operations [3,4,5,6]. However, when robots are required to grasp objects with low stiffness, such as drinks made of paper, merely considering post-grasp slip detection is insufficient. However, when robots are tasked with grasping objects of low stiffness, such as paper-based beverages, solely focusing on post-grasp slip detection proves inadequate. This is because it may result in excessive deformation or missed grasps even before lifting the object [7,8,9]. Therefore, it becomes imperative to comprehensively address both grasp stability prediction before lifting and post-grasp slip detection when dealing with deformable objects. In this study, we define the problem of evaluating the grasp status of deformable objects as a five-class classification task. This classification comprises the object’s grasp status before lifting (no contact, moderate contact, excessive contact) as well as its grasp status after lifting (slip, no slip). Collectively, these five status detections are referred to as grasp status detection throughout this paper. Solving the grasping problem for robots is a complex task because it involves recognizing various factors, such as the shapes, surface materials, weights of different objects, and the robot hand’s posture. Convolutional Neural Networks (CNNs), as deep learning tools, possess robust feature extraction and modeling capabilities, aiding in capturing these complexities. Compared to traditional methods, they excel at learning from data and addressing nonlinear problems more effectively.
Numerous studies have used visual and tactile direct fusion (DF) methods, as shown in Figure 1, to detect the grasping states of targets [5,6,10], obtaining promising results. Although the DF method integrates inherent visual and tactile characteristics, it does not characterize interrelated features [11]. To better fuse these features, we add a dimension and find the tensor product after extracting visual and tactile features separately, as shown in Figure 2. The initial fused visual–tactile feature (IVTF) method characterizes the correlations and inherent properties of visual and tactile sensations, but because the incremental dimensional tensor product (IDTP) feature fusion method may lead to redundant information in the IVTF, it is difficult for the subsequent classification network to make relative judgments. Inspired by the added efficacy of attention mechanisms, the convolutional block attention mechanism (CBAM) [12] has been introduced to channels and spaces to reduce redundant information and capture the most important IVTFs. Traditional target grasping state detection problems use rigid bodies that are resilient to deformation; thus, their gripping and slip success markers are constant. However, in real industrial scenarios, it is important to consider targets with weak-stiffness characteristics, because their lack of rigidity will defy the predominant success markers.
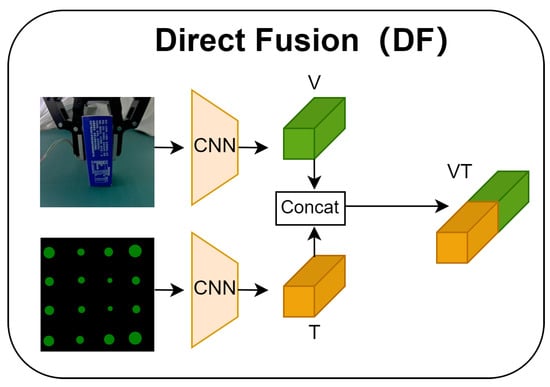
Figure 1.
Direct fusion method for visual and tactile features.
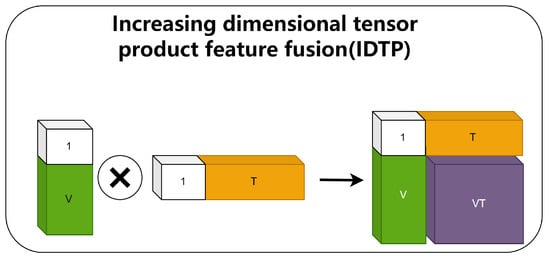
Figure 2.
Visual and tactile method of increasing dimensional tensor products (IDTP).
To address this need, we add the detection of a target’s deformation degree based on slip detection, including “no contact”, “moderate contact”, and “excessive contact” states. This variety of gripping states allows robots to adapt their gripping and slip controls more intelligently. We mimic humans’ neurologically driven tactile strategies to propose a new deep-learning visual–tactile fusion with deformation. We use normal red–green–blue (RGB) cameras as visual sensors and an array of Uskin tactile sensors, each with 16 points, providing three-axis (x, y, and z) information [13] for acquiring the corresponding sequence readings (Figure 3) in two lateral shear directions (x, y) on the target. The z-axis reflects the contact strength. This results in the extraction of more effective visual–tactile fusion features. In this report, we provide experimental results on the efficacy of visual and tactile information extracted using different feature fusion methods. An ablation study is also applied to understand incremental performance improvements based on model constituents.
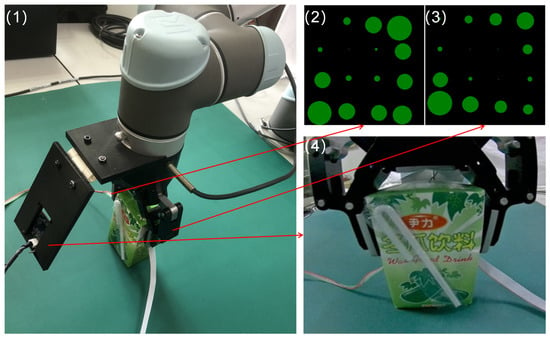
Figure 3.
Visual and tactile devices: (1) UR5 robot arm. (2) (3) Tactile data from the Uskin sensor. (4) Images taken by an external camera.
The primary contributions of this study include the following:
- (1)
- We propose a new visual–tactile fusion method for a target grasping state detection network to achieve more accurate detection of the grasping state of targets.
- (2)
- In grasping state detection of weak-stiffness targets, we introduce multiple grasping states based on adding deformation degree detection to the slip detection of the target to make the robot more dexterous and intelligent.
- (3)
- The IDTP method is proposed to obtain IVTF using the CBAM attention mechanism for the automatic capture of sensitive weights on channels and spaces to extract more important information on visual–tactile features, which has advantages over the DF method.
2. Related Works
Tactile sensors have been used extensively for target grasping [3,8] and manipulation [14,15]. We first introduce studies related to target grasping state detection and visual–tactile fusion learning, and thereafter introduce studies related to commonly used grasping state detection models.
2.1. Target Grasping Status Detection
Proper grasping state detection improves robot resilience and dexterity in manipulation tasks. Target deformation and slip during weak-stiffness target grasping remain challenging [7,8]. Robots with tactile sensors can pick up a variety of targets based on contact detection [16,17,18]. Yuan et al. [19] employed GelSight tactile images as inputs to a neural network to estimate target stiffness. Such optical tactile sensors offer abundant tactile information, but their processing times are often too long for real-time tasks. To prevent the grasped target from slipping out of the robot’s end-effector, researchers have applied a range of tactile sensors and gripping modalities. Kwiatkowski et al. [20] enhanced the ability to predict robot arm target slip by using an unsupervised feature learning method that incorporated external and self-sensation strategies. In [21], 3972 samples were used to explore the effects of dataset composition on classifier performance. While maintaining similar overall precision, the ability to detect grip failures was found to be significantly affected by the dataset composition. Yi et al. [22] extracted tactile features from signals and proposed a new genetic algorithm-based integrated hybrid sparse limit learning machine for grasp stability recognition tasks. Han et al. [23] introduced a Transformer-based robotic grasping framework for rigid gripper robots, leveraging tactile and visual information to ensure secure object grasping. Evaluation on slip detection and fruit grasping datasets demonstrated that Transformer models exhibit higher grasping accuracy and computational efficiency compared to traditional CNN + LSTM models. As it is challenging to accurately model the contact state between an end-effector and a target, Funabashi et al. [24] utilized a convolutional neural network (CNN) with a long short-term memory (LSTM) to process high-dimensional tactile information and achieve stable robot hand operations. This method facilitates the processing of complex tactile information and enhances the dexterity of robotic multiple-fingered hand operations. Numerous studies have focused on single modality input to learning models. For example, extensive overviews of different modalities have been published [25,26]. Although significant progress has been made in related fields, not enough attention has been paid to effectively integrating visual and tactile information.
Cui et al. [7] extracted visual and tactile information as features in three dimensions and used fully connected layers to derive the corresponding grasping states. The closest visual–tactile fusion model to ours is the CNN + LSTM, which was first proposed by Sainath et al. [27]. As our primary improvement, we replace the LSTM [28] with a temporal convolutional neural network (TCN) [29]. First, note that the core of the LSTM network is cyclic, and thus, it does not lend itself to parallel processing, resulting in slow training speeds, even with state-of-the-art graphics processing units (GPUs). Second, the importance of early training data is often overlooked during new inputs owing to the fixed capacity of the hidden state. Finally, as feature sequences become longer, long-term temporal dependencies may be lost. For grasping status determination, Li et al. [5] found that shorter sequences are better and that moderate sequences are more descriptive. Using the TCN model, the output states share a wider perceptual field than with LSTM via the introduction of a null convolution and a multitemporal data treatment method that equalizes the importance levels at each phase, allowing the TCN to effectively correlate earlier and later information. In sequence-to-sequence learning [30,31], TCN networks are already preferred as they outperform LSTMs [3,30] on several tasks. To our knowledge, TCN has rarely been used with visual and tactile sequence data. Because TCN uses far fewer parameters than LSTM, faster detection speeds are provided for detecting robot grasping status [28].
2.2. Visual–Tactile Fusion Learning
Visual and tactile senses are the two main sensory modalities used by humanoid animals to understand and interact with their environment [32,33]. Our aim is for robots to integrate visual and tactile senses in state-detection tasks [34,35]. Visual sense provides information about the target surface, which facilitates the robot to grasp the position [36], while tactile information provides more detailed textures [37], roughness [38], and other invisible characteristics. Combining this information allows for more accurate detection of target deformation and slip trends [9,39]. Effectively combining information from both modalities is very important in state-detection tasks. We would like the robot to integrate visual and tactile senses in state-detection tasks [35,40]. In the brain, interactions between visual and tactile perceptions occur in the cerebral cortex, and these interactions are cross-modal, implying that visual perception can stimulate tactile perception [41]. Allen et al. [42] first proposed a combination of visual and tactile sensations to generate target surfaces, especially for curved targets. Numerous studies have focused on a single modality as an input to the model, for example, References [25,26] have completed extensive overviews based on the visual and tactile modalities. Although significant progress has been made in visual and tactile perception research, less attention has been paid to effectively integrating visual and tactile concerns. Calandra et al. [10] studied learning re-grasp strategies based on visual and tactile information after the initial grasp. Experimental results showed that the effective combination of visual and tactile sensations can significantly improve grip performance. However, most of the targets they used in their experiments were rigid bodies that do not require precise force magnitude control. Visual and tactile methods of DF have been studied extensively [5,6,7] with good results. The DF method can fuse intrinsic visual and tactile properties without characterizing the correlation between visual and tactile features.
Previous studies focused on different visual and tactile learning tasks and reported that a combination of visual and tactile sensations was superior to a single modality. Unfortunately, existing deep-learning-based visual–tactile fusion approaches combine features of visual and tactile modalities directly and then perform subsequent classification or regression. Owing to the simple structure, the DF method may fail to construct effective visual–tactile features. We believe that an effective fusion approach of features is possible to significantly improve the performance of the target grasp-state detection model.
This study aims to provide effective visual–tactile features for grasping state detection. The input includes continuous and fixed numbers of visual () and tactile () signal frames, with the visual signal containing 224 × 224 × 3 image pixel information and the tactile signal containing 4 × 4 × 3 matrix information.
Firstly, the corresponding visual features V and tactile features T are extracted by the visual () and tactile () feature extractors, Resnet50 [43], and the custom neural network (as shown in Figure 4).
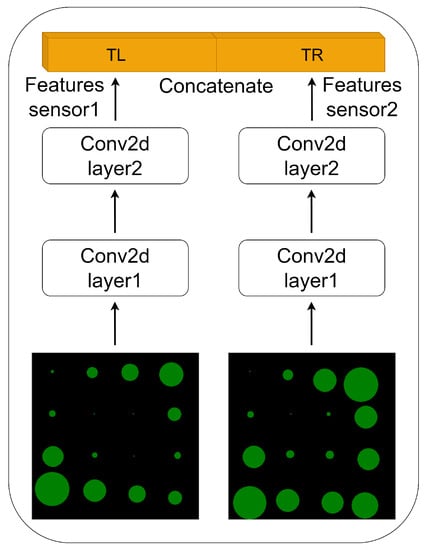
Figure 4.
Structure of a tactile convolutional neural network.
Secondly, visual and tactile features are fused using the IDTP method constructed in this study. Compared with the DF method, the IDTP method is easier to interpret and semantically more meaningful. Therefore, subsequent classification networks can easily decode meaningful information about the visual–tactile features. Although IVTF has enhanced correlation between visual and tactile modalities, it may have some redundant information. As the IDTP method may add some unimportant information to the space and channel of IVTF, it is not adapted for subsequent classification networks. Inspired by the CBAM attention mechanism and combined with the drawbacks brought by the IVTF approach, the feature mapping of the attention mechanism is performed along two independent dimensions of IVTF, channel and space, to perform adaptive feature refinement on the input feature map. IVTF undergoes CBAM attention mechanism to eliminate some redundant information and focus more on relatively important features. To some extent, it is easier to characterize the correlation and inherent properties between different modalities using the IVTF of the CBAM attention mechanism, and here, the feature is called the final visual–tactile feature (FVTF).
Finally, FVTF is input into the TCN network, which outputs the grasping state corresponding to the target: output for 0, 1, 2, 3, and 4 (0 for no contact, 1 for moderate contact, 2 for excessive contact, 3 for slip, and 4 for no slip).
In our proposed RFCT model, the visual feature extraction module and the tactile feature extraction module , the IDTP method + CBAM (VTFCB) module, and the TCN network are implemented by neural networks with different structures and parameters. The steps are illustrated in Figure 5, where we describe the three modules. Below are the specific details of our network model implementation.
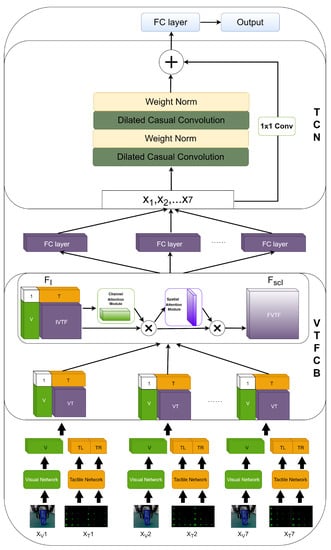
Figure 5.
RFCT network architecture diagram.
3. Methods
3.1. Visual and Tactile Feature Extraction Networks
First, the visual features are extracted using the Resnet50 network. We process the tactile signal into the form of a 4 × 4 × 3 tactile matrix and use the custom network structure in Figure 4 for feature extraction. For each tactile matrix, two neural network structures have access to weight normalization and a rectified linear unit (ReLU) activation function after each layer. The first layer contains three 3 × 3 kernels with a step size of one, filled with 1 × 1 convolutions. The second layer contains eight 3 × 3 kernels with a step size of one, filled with 1 × 1 convolutions. Instead of pretraining, the visual and tactile feature networks are trained along with the rest of the network.
where , , and are the height, width and feature channel dimensions of V, respectively. These notations are similar for the tactile feature T.
3.2. VTFCB Module
The main task of the VTFCB module is to perform effective feature characterization using the visual and tactile features outputted above. Most existing methods for visual and tactile fusion use direct splicing of features from two different modalities (as shown in Figure 1). However, the DF approach is still at the primary stage of feature fusion.
Unlike the DF method, the VTFCB module is divided into two stages to extract the visual–tactile fusion features. Firstly, the visual and tactile senses are used to obtain the IVTF through the IDTP method. Secondly, the CBAM attention mechanism module is executed on the IVTF to obtain the FVTF as detailed below for the fusion between modalities: (1) Visual and tactile features were obtained in Resnet50 and neural networks for visual and tactile are customized for each channel. The length and width of the visual and tactile feature maps are flattened, and an additional dimension is added, after which the visual and tactile features are subjected to a tensor product operation; the result is shown in Figure 2. IVTF has visual, tactile, and visual–tactile correlated features. Feature fusion is performed in the above manner, which lays the foundation for subsequent modal fusion between arbitrary channel spatial locations for the CBAM attention module, capturing visual–tactile properties. Because tensor fusion is mathematically interpreted as formed by the outer product of features, it has no learnable parameters. (2) IVTF is compared to the DF method of feature direct splicing. Based on Figure 2, we can suspect that it may contain a lot of redundant and noisy information, which is not conducive to be used as a classification feature of the classification network. We use the channel and spatial attention mechanism (CBAM) structure (Figure 6) to further streamline and capture the visual–tactile features that are beneficial to the task. It achieves the effect of the attention mechanism by adding different weights to different channels and spaces of IVTF, and we believe that this operation can make VTF more capable of providing effective visual–tactile features for grasping state detection models to learn.
where is the IVTF, stands for the height and width of V, which is paved, the number of channels remains the same, and is treated similarly. Moreover, , , , and ⊗ represents broadcast and element-wise multiplication.
where denotes the sigmoid function, and is the output of convolution layers. Then, we get , where ⊗ represents broadcast and element-wise multiplication.
where denotes the sigmoid function and denotes a 3 × 3 convolution with 1 × 1 padding. Then, we get , where ⊗ represents broadcast and element-wise multiplication.
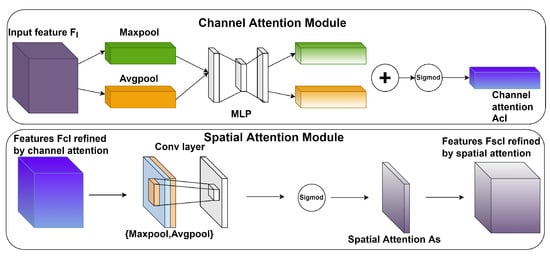
Figure 6.
CBAM attention mechanism.
3.3. TCN Module
TCN is used for time series modeling and prediction of the series using a fully connected layer. The TCN model consists of two dilated convolutional layers, each of which is weight normalized. Residual connectivity (1 × 1 convolution) is also used to help the model learn temporal relationships. The output of the last time step of the temporal convolutional network is connected to another fully connected layer, which generates five predicted values.
where Activation( · ) is the Relu function, S( · ) is the backbone of the TCN model, x is the residual connection, and Output is the grasping state of the output. Output ∈ 0, 1, 2, 3 and 4.
4. Data Collection and Experimental Setup
4.1. Data Collection
Our experiments were conducted using the UR5 robotic arm and Robotiq shown in Figure 3 to grasp the state evaluation targets. The maximum opening distance of the end-effector was 85 mm, which was reduced to 75 mm due to the two Uskin tactile sensors affixed inside. The two tactile sensors gathered 2 × 4 × 4 × 3 = 96 signals, and the camera was mounted to the side of the end-effector, the angle of which could be adjusted while capturing 224 × 224 × 3 RGB image signals. The 15 weak-stiffness targets are shown in Figure 7, for which the grasping states were divided into the five types discussed.
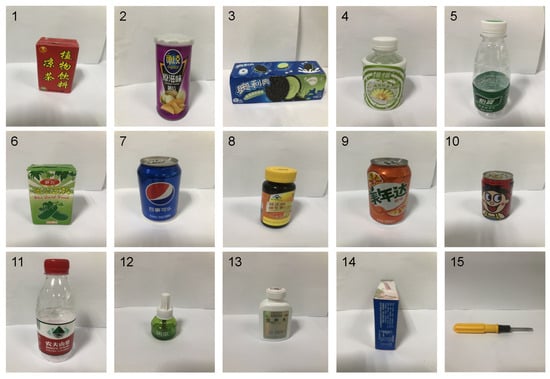
Figure 7.
Weak-stiffness targets used in our experiments.
Noting that target deformations are mainly caused by internal characteristics, such as the elasticity of the target material and/or the applied external force, the dataset was constructed in two stages. To increase data diversity, the initial crawl position of each target was randomized, and the width of each was measured. The width of the end-effector to which the tactile sensor was attached was then set 5-mm greater than the target estimation. The two Uskin sensor contacts had relatively small differences in thickness, and the fingers were slightly tilted. The motion of the end-effector was set to squeeze the target from both sides to a random constriction between 0 and 25 mm, which corresponds to real target dynamics in industrial situations. For output, deformation labels were created using one of three categories (i.e., “no contact”, “moderate contact”, and “excessive contact”). When the distance between the end-effector was greater than the width of the target, the system classified the scenario as “no contact”. When the distance between the end-effectors was 0–15 mm shorter than the originally estimated width of the target, the label was marked as “moderate contact”. When the distance was between 15 and 20 mm, the state was labeled “excessive contact”. After grasping the target, the end-effector was programmed to move at a constant speed of 10.0 mm/s as data were collected simultaneously by the camera and the Uskin tactile sensor at a rate of 40 Hz. We conducted 30 tests per contact state for a total of 90 “catches”. Because the input formats included 1–7 frames, 2–8 frames, and 34–40 frames, the deformation dataset ultimately consisted of 45,900 seven-frame visual image sequences and corresponding tactile image sequences.
Diversity was added to the slip datasets based on variations in contact positions. The distance of the end-effector was judged to be between 0 and 15 mm based on the deformation state of the first stage. The robot arm slowly lifted the target 3 cm at 40.0 mm/s, which is empirically sufficient to determine whether the target slips. We next performed 30 experiments for each of the two states, for a total of 60 experiments. This time, the slip dataset comprised 30,600 sequences of seven-frame visual images alongside their corresponding tactile image sequences. The deformation–slip dataset contained 76,500 data samples. Visual and tactile target grasps are shown in Figure 8. The model was then trained using deformation and slip data from 12 randomly selected targets, whereas data from three other targets were used for validation.
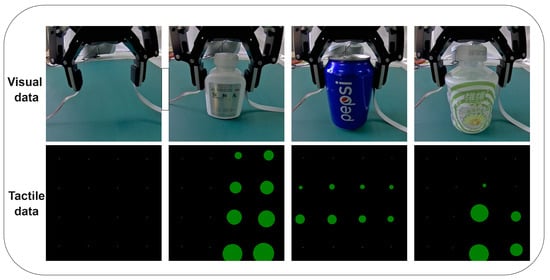
Figure 8.
Visualization of Uskin sensor readings. Starting from the left, the different targets are read. Each green dot represents a vertex of the 4 × 4 sensor matrix. The diameter (z-axis, normal force) and position change (x- and y-axis, shear force) of the green dots indicate the magnitude and direction of each three-axis (x, y and z) measurement.
4.2. Experimental Setup
The visual input for each of the following experiments was the raw data of size 224 × 224 × 3. The tactile signal input was data of size 4 × 4 × 3 that changed after contact to evaluate different models. The visual–tactile seven-frame input is shown in Figure 9.

Figure 9.
One sample of inputs. The first row is seven frames of image data. The second row is the tactile data acquired from the two tactile Uskin sensor matrices.
Single Visual: The input was visual data, the visual model was Resnet50 + LSTM. LSTM had two hidden layers.
Single Tactile: The input was tactile data, the visual model was CNN + LSTM, the CNN used for tactile feature extraction is shown in Figure 4, and the LSTM had two hidden layers.
RL: The input was 6–9 frames of visual and tactile data. The model was Resnet50 + LSTM. Unlike the study [5], the feature extraction network was different for visual and tactile. The visual and tactile feature fusion method was a feature DF method to find the optimal visual and tactile optimal input frames. The optimal number of visual and tactile data input frames in the experiment is called the optimal visual–tactile frame number.
C3D: The input was the optimal visual–tactile frame number, the model was C3D [7], and the visual features and tactile features fusion method was the DF method.
RT: The input was the optimal visual–tactile frames, the model was Resnet50 + TCN, and the visual features and tactile features were fused using the DF method.
RFL: The input was the optimal visual–tactile frames, the model was RL, and the visual and tactile feature fusion method was the IDTP method.
CF: The input was the optimal visual–tactile frames, the model was C3D, and the visual and tactile feature fusion method was the IDTP method.
RFT: The input was the optimal visual–tactile frames, the model was RT, and the visual and tactile features were fused using the IDTP method.
RFCL: The input was optimal visual–tactile frame number, the model was the basis of experiment RFL, and the CBAM attention mechanism module was added to IVTF.
CFC: The input was the optimal visual–tactile frame number, the model was the basis of experiment CF, and the CBAM attention mechanism module was added to IVTF.
RFCT: The input was the optimal visual–tactile frame number, the model was the basis of experiment RFT, and the CBAM attention mechanism module was added to IVTF.
For all models implemented in this study, we optimized each model using limited hardware resources owing to the large datasets. For all models, we used the Adam optimizer with cross-entropy loss function and a learning rate of 0.000001. All models were built using PyTorch 1.8 and NVIDIA RTX A4000 was used as the GPU.
5. Experimental Results and Analysis
We next discuss the performance of different models and visual–tactile feature combinations. Each method was evaluated according to the description in Section 4. To evaluate the performance of the proposed model more comprehensively and accurately, we compared the precision, recall, and F1 scores of the different models.
(1) Table 1 shows the results of the comparison of different models and visual–tactile fusion performance. The results show that the visual and tactile accuracies of the unimodal models were 41.90% and 69.50%, respectively. The tactile modality, to some extent, detected the grasping state of the target more easily than the visual modality. Because the tactile sensation was able to detect changes in the target directly in a very short time, images were measured indirectly. This shows that the tactile sensation information should be the primary information and the image information should be secondary when detecting the grasping state. The performances of the three visual and tactile fusion models were generally much higher than those of the single modality models. It can be concluded that visual and tactile sensations are more practical as inputs for deep learning.

Table 1.
Comparison of unimodal and multimodal networks.
(2) Different numbers of frames were input into Resnet50 + LSTM in Section 4 to find the optimal number of input frames. As shown in Table 2, the visual and tactile frames were the best with a precision of 76.17%, a recall rate of 72.03%, and an F1 score of 72.18% for all performance metrics at a visual and tactile frame rate of 7. This result implies that the sequence length is not proportionally related to the effectiveness of the LSTM network. Long sequences may introduce some noisy information, significantly reducing the capability of the classification network to classify the visual–tactile features. Subsequent experiments also used seven frames of data as input to the model.

Table 2.
Results for visual–tactile inputs of different sequence lengths.
(3) In the DF method, the performance ranking was RL, C3D, and RT in descending order. LSTM, as the most used network for visual–tactile fusion, showed superior performance in the DF method. As LSTM runs serially, earlier information may occupy less as the LSTM network runs later. The grasping state of the target needs to be compared with the earlier state; therefore, LSTM may not be applicable if the sequence is relatively long. However, the model is more suitable for the DF method. The performance of the C3D model is intermediate because C3D adds feature extraction to the temporal dimension, which is relevant to this dimension of time. However, visual and tactile sensations are separately processed by C3D feature extraction, and thus, relatively important information may have been lost before the link with the DF method, causing the C3D model to have certain limitations. TCN can solve the common problem of LSTM very effectively. Firstly, the TCN model solves the problem of long LSTM running time by running in parallel. Secondly, LSTM tends to lose excessive information initially because of the specificity of the grasping state task. The TCN model can capture long-term dependencies under different time scales by operating with convolutional kernels of different sizes, and thus, it has a better long-term dependency modeling capability than the LSTM network. However, in the DF method, the TCN performance is not better than that of LSTM and C3D. We believe that this is because the DF method does not sufficiently characterize the correlation between the modes, which prevents the TCN model from learning the corresponding parameters for correct classification. In the IDTP method, the RFCT model outperformed both the RFCL and CFC models, and the growth was the largest compared to the DF method. Here, it can be verified that the TCN model adapts relatively well to the representation of the visual–tactile fusion, whereas the simple DF method does not perform well.
(4) In Table 3, regarding the three different models of visual–tactile fusion, the IDTP method significantly outperformed the DF method, RFL (3.67% increase in precision), CF (5.3% increase in precision), and RFT (7.7% increase in precision). We believe that the main reason is that although the DF method preserves the characteristics of each mode, it does not reflect the correlation between the modes after fusion. After the IDTP method is fused, IVTF includes both the intrinsic properties of the modalities and the correlation of the fusion between the two modalities. This fusion method provides more easily characterized visual–tactile features for the following classification networks. The experimental performance comparison shows that the IDTP method expresses visual and tactile sensations better than the DF method.

Table 3.
Results of different feature fusion methods and whether to add the CBAM attention mechanism.
(5) The IDTP method is an outer product of two feature vectors from a mathematical perspective. This undoubtedly increases the parametric number of visual–tactile features in the channel and space. Although the IDTP method performs better than the simple DF method, the redundant information of the features is not desired because this may lead to poor performance and slow convergence of the model. Based on this observation, we also investigated whether the attention mechanism enhanced the representational ability of IVTF. It is well known that CBAM attention mechanisms mainly reinforce features in terms of channel and space. IVTF is just suitable for this situation, and thus, we intended to make IVTF more focused on the corresponding parameters in channel and space through the CBAM attention mechanism. The confusion matrix for the three models is shown in Figure 10. Experimental results show that the three models improved precision, recall rate, and F1 score with the CBAM attention mechanism, i.e., RFCL (0.17% increase in precision), CFC (0.57% increase in precision), and RFCT (1.13% increase in precision). This shows that our conjecture is correct. Although IVTF is well characterized by visual and tactile properties, it has a certain amount of redundant information. However, the CBAM attention mechanism enhances the features of IVTF, making the fused features more generally applicable to the network. We also hope to apply it to other visual and tactile integration tasks.

Figure 10.
Confusion matrix for RFCT, CFC and RFCL models. NC stands for “no contact”, MC stands for “moderate contact”, EC stands for “excessive contact” states, S stands for “slip”, and NS stands for “no slip”.
6. Conclusions
We proposed a new grasping state detection model, RFCT, that uses visual and tactile features as input targets. We improved the DF method to IDTP method to solve the problem of inadequate integration of visual–tactile features by the DF method. Because the IDTP method may introduce redundant information in channels and space in IVTF, we investigated whether the CBAM attention mechanism can eliminate such redundant information and enhance IVTF feature expression. We performed approximately 2250 grasping experiments using 15 different weak-stiffness targets, 12 of which were used for training and 3 for testing. When tested on untrained targets, the RFCT model achieved a precision of 82.89%, a recall rate of 82.07%, and an F1 score of 81.65%. We compared the proposed RFCT model with various combinations of the widely used Resnet50 + LSTM and C3D. The RFCT model outperformed various combinations of Resnet50 + LSTM and C3D. We also compared the IDTP method with the DF method and demonstrated that the IDTP method is more suitable for visual–tactile feature fusion. In the current version of our research, our primary focus has been on grasp status detection and slip detection for textured objects. Consequently, we did not include demonstrations for textureless objects. However, we acknowledge the significance of textureless objects in practical applications, and our future research directions will address this aspect. We provided examples of how visual information can be combined with tactile information to achieve better performance. We believe this work will be useful in the field of robot grasping. In future work, we will mount the camera on the robot, use our method for stable grasping, and use a larger training set to achieve higher recognition rates.
Author Contributions
Conceptualization, W.R. and W.Z.; methodology, W.R. and W.Z.; software, W.R. and Z.Z.; validation, K.W. and Q.L.; formal analysis, K.W., L.L. and Q.L.; investigation, W.Z. and Q.L.; resources, L.L.; data curation, Z.Z.; writing—original draft preparation, W.R.; writing—review and editing, W.Z. and W.R.; visualization, W.R.; project administration, Q.L. and W.-C.Y.; funding acquisition, W.Z. and Q.L. All authors have read and agreed to the published version of the manuscript.
Funding
This research is supported by the Guangdong Key Project (2021B010410002 and 2020B0404030001), Artificial Intelligence Application Service Platform for Industrial Applications (20200006509), and National Natural Science Foundation of China (62106048).
Institutional Review Board Statement
Not applicable.
Informed Consent Statement
Not applicable.
Data Availability Statement
Not applicable.
Conflicts of Interest
The authors declare no conflict of interest.
References
- Xiong, P.; Tong, X.; Song, A.; Liu, P.X. Robotic Multifinger Grasping State Recognition Based on Adaptive Multikernel Dictionary Learning. IEEE Trans. Instrum. Meas. 2022, 71, 1–14. [Google Scholar] [CrossRef]
- Billard, A.; Kragic, D. Trends and Challenges in Robot Manipulation. Science 2019, 364, eaat8414. [Google Scholar] [CrossRef]
- Yan, G.; Schmitz, A.; Funabashi, S.; Somlor, S.; Tomo, T.P.; Sugano, S. SCT-CNN: A Spatio-Channel-Temporal Attention CNN for Grasp Stability Prediction. In Proceedings of the 2021 IEEE International Conference on Robotics and Automation (ICRA), Xi’an, China, 30 May–5 June 2021; pp. 2627–2634. [Google Scholar]
- Veiga, F.; Peters, J.; Hermans, T. Grip Stabilization of Novel Objects Using Slip Prediction. IEEE Trans. Haptics 2018, 11, 531–542. [Google Scholar] [CrossRef]
- Li, J.; Dong, S.; Adelson, E. Slip Detection with Combined Tactile and Visual Information. In Proceedings of the 2018 IEEE International Conference on Robotics and Automation (ICRA), Brisbane, Australia, 21–25 May 2018; pp. 7772–7777. [Google Scholar]
- Yan, G.; Schmitz, A.; Tomo, T.P.; Somlor, S.; Funabashi, S.; Sugano, S. Detection of Slip from Vision and Touch. In Proceedings of the 2022 International Conference on Robotics and Automation (ICRA), Philadelphia, PA, USA, 23–27 May 2022; pp. 3537–3543. [Google Scholar]
- Cui, S.; Wang, R.; Wei, J.; Li, F.; Wang, S. Grasp State Assessment of Deformable Objects Using Visual-Tactile Fusion Perception. In Proceedings of the 2020 IEEE International Conference on Robotics and Automation (ICRA), Paris, France, 31 May–31 August 2020; pp. 538–544. [Google Scholar]
- Funabashi, S.; Kage, Y.; Oka, H.; Sakamoto, Y.; Sugano, S. Object Picking Using a Two-Fingered Gripper Measuring the Deformation and Slip Detection Based on a 3-Axis Tactile Sensing. In Proceedings of the 2021 IEEE/RSJ International Conference on Intelligent Robots and Systems (IROS), Prague, Czech Republic, 27 September–1 October 2021; pp. 3888–3895. [Google Scholar]
- Yan, G.; Schmitz, A.; Funabashi, S.; Somlor, S.; Tomo, T.P.; Sugano, S. A Robotic Grasping State Perception Framework With Multi-Phase Tactile Information and Ensemble Learning. IEEE Robot. Autom. Lett. 2022, 7, 6822–6829. [Google Scholar] [CrossRef]
- Calandra, R.; Owens, A.; Jayaraman, D.; Lin, J.; Yuan, W.; Malik, J.; Adelson, E.H.; Levine, S. More Than a Feeling: Learning to Grasp and Regrasp Using Vision and Touch. IEEE Robot. Autom. Lett. 2018, 3, 3300–3307. [Google Scholar] [CrossRef]
- Cui, S.; Wang, R.; Wei, J.; Hu, J.; Wang, S. Self-Attention Based Visual-Tactile Fusion Learning for Predicting Grasp Outcomes. IEEE Robot. Autom. Lett. 2020, 5, 5827–5834. [Google Scholar] [CrossRef]
- Woo, S.; Park, J.; Lee, J.-Y.; Kweon, I.S. CBAM: Convolutional Block Attention Module; Springer: Cham, Switzerland, 2018; pp. 3–19. [Google Scholar]
- Tomo, T.P.; Regoli, M.; Schmitz, A.; Natale, L.; Kristanto, H.; Somlor, S.; Jamone, L.; Metta, G.; Sugano, S. A New Silicone Structure for uSkin—A Soft, Distributed, Digital 3-Axis Skin Sensor and Its Integration on the Humanoid Robot iCub. IEEE Robot. Autom. Lett. 2018, 3, 2584–2591. [Google Scholar] [CrossRef]
- Yousef, H.; Boukallel, M.; Althoefer, K. Tactile Sensing for Dexterous In-Hand Manipulation in Robotics—A Review. Sensors Actuators A Phys. 2011, 167, 171–187. [Google Scholar] [CrossRef]
- Yamaguchi, A.; Atkeson, C.G. Combining Finger Vision and Optical Tactile Sensing: Reducing and Handling Errors While Cutting Vegetables. In Proceedings of the 2016 IEEE-RAS 16th International Conference on Humanoid Robots (Humanoids), Cancun, Mexico, 15–17 November 2016; pp. 1045–1051. [Google Scholar]
- Levine, S.; Pastor, P.; Krizhevsky, A.; Ibarz, J.; Quillen, D. Learning Hand-Eye Coordination for Robotic Grasping with Deep Learning and Large-Scale Data Collection. Int. J. Robot. Res. 2018, 37, 421–436. [Google Scholar] [CrossRef]
- Lee, H.; Sun, H.; Park, H.; Serhat, G.; Javot, B.; Martius, G.; Kuchenbecker, K.J. Predicting the Force Map of an ERT-Based Tactile Sensor Using Simulation and Deep Networks. IEEE Trans. Autom. Sci. Eng. 2023, 20, 425–439. [Google Scholar] [CrossRef]
- Yi, Z.; Xu, T.; Shang, W.; Wu, X. Touch Modality Identification With Tensorial Tactile Signals: A Kernel-Based Approach. IEEE Trans. Autom. Sci. Eng. 2022, 19, 959–968. [Google Scholar] [CrossRef]
- Yuan, W.; Srinivasan, M.A.; Adelson, E.H. Estimating Object Hardness with a GelSight Touch Sensor. In Proceedings of the 2016 IEEE/RSJ International Conference on Intelligent Robots and Systems (IROS), Daejeon, Republic of Korea, 9–14 October 2016; pp. 208–215. [Google Scholar]
- Kwiatkowski, J.; Cockburn, D.; Duchaine, V. Grasp Stability Assessment through the Fusion of Proprioception and Tactile Signals Using Convolutional Neural Networks. In Proceedings of the 2017 IEEE/RSJ International Conference on Intelligent Robots and Systems (IROS), Vancouver, BC, Canada, 24–28 September 2017; pp. 286–292. [Google Scholar]
- Kwiatkowski, J.; Jolaei, M.; Bernier, A.; Duchaine, V. The Good Grasp, the Bad Grasp, and the Plateau in Tactile-Based Grasp Stability Prediction. In Proceedings of the 2022 IEEE/RSJ International Conference on Intelligent Robots and Systems (IROS), Kyoto, Japan, 23–27 October 2022; pp. 4653–4659. [Google Scholar]
- Yi, Z.; Xu, T.; Shang, W.; Li, W.; Wu, X. Genetic Algorithm-Based Ensemble Hybrid Sparse ELM for Grasp Stability Recognition With Multimodal Tactile Signals. IEEE Trans. Ind. Electron. 2023, 70, 2790–2799. [Google Scholar] [CrossRef]
- Han, Y.; Yu, K.; Batra, R.; Boyd, N.; Mehta, C.; Zhao, T.; She, Y.; Hutchinson, S.; Zhao, Y. Learning Generalizable Vision-Tactile Robotic Grasping Strategy for Deformable Objects via Transformer. arXiv 2021, arXiv:2112.06374. [Google Scholar]
- Funabashi, S.; Ogasa, S.; Isobe, T.; Ogata, T.; Schmitz, A.; Tomo, T.P.; Sugano, S. Variable In-Hand Manipulations for Tactile-Driven Robot Hand via CNN-LSTM. In Proceedings of the 2020 IEEE/RSJ International Conference on Intelligent Robots and Systems (IROS), Las Vegas, NV, USA, 24 October 2020; pp. 9472–9479. [Google Scholar]
- Zhao, Z.-Q.; Zheng, P.; Xu, S.-T.; Wu, X. Object Detection with Deep Learning: A Review. IEEE Trans. Neural Netw. Learn. Syst. 2019, 30, 3212–3232. [Google Scholar] [CrossRef] [PubMed]
- Seminara, L.; Gastaldo, P.; Watt, S.J.; Valyear, K.F.; Zuher, F.; Mastrogiovanni, F. Active Haptic Perception in Robots: A Review. Front. Neurorobot. 2019, 13, 53. [Google Scholar] [CrossRef]
- Sainath, T.N.; Vinyals, O.; Senior, A.; Sak, H. Convolutional, Long Short-Term Memory, Fully Connected Deep Neural Networks. In Proceedings of the 2015 IEEE International Conference on Acoustics, Speech and Signal Processing (ICASSP), South Brisbane, Australia, 19–24 April 2015; pp. 4580–4584. [Google Scholar]
- Hochreiter, S.; Schmidhuber, J. Long Short-Term Memory. Neural Comput. 1997, 9, 1735–1780. [Google Scholar] [CrossRef]
- Bai, S.; Kolter, J.Z.; Koltun, V. An Empirical Evaluation of Generic Convolutional and Recurrent Networks for Sequence Modeling. arXiv 2018, arXiv:1803.01271. [Google Scholar]
- van den Oord, A.; Dieleman, S.; Zen, H.; Simonyan, K.; Vinyals, O.; Graves, A.; Kalchbrenner, N.; Senior, A.; Kavukcuoglu, K. WaveNet: A Generative Model for Raw Audio. arXiv 2016, arXiv:1609.03499. [Google Scholar]
- Kalchbrenner, N.; Espeholt, L.; Simonyan, K.; van den Oord, A.; Graves, A.; Kavukcuoglu, K. Neural Machine Translation in Linear Time. arXiv 2017, arXiv:1610.10099. [Google Scholar]
- He, B.; Miao, Q.; Zhou, Y.; Wang, Z.; Li, G.; Xu, S. Review of Bioinspired Vision-Tactile Fusion Perception (VTFP): From Humans to Humanoids. IEEE Trans. Med. Robot. Bionics 2022, 4, 875–888. [Google Scholar] [CrossRef]
- Johansson, R.; Flanagan, J. Coding and Use of Tactile Signals from the Fingertips in Object Manipulation Tasks. Nat. Rev. Neurosci. 2009, 10, 345–359. [Google Scholar] [CrossRef] [PubMed]
- McGurk, H.; MacDonald, J. Hearing lips and seeing voices. Nature 1976, 264, 746–748. [Google Scholar] [CrossRef]
- Gao, S.; Dai, Y.; Nathan, A. Tactile and Vision Perception for Intelligent Humanoids. Adv. Intell. Syst. 2022, 4, 2100074. [Google Scholar] [CrossRef]
- Ribeiro, E.G.; de Queiroz Mendes, R.; Grassi, V. Real-Time Deep Learning Approach to Visual Servo Control and Grasp Detection for Autonomous Robotic Manipulation. Robot. Auton. Syst. 2021, 139, 103757. [Google Scholar] [CrossRef]
- Yuan, W.; Zhu, C.; Owens, A.; Srinivasan, M.A.; Adelson, E.H. Shape-Independent Hardness Estimation Using Deep Learning and a GelSight Tactile Sensor. In Proceedings of the 2017 IEEE International Conference on Robotics and Automation (ICRA), Singapore, 29 May–3 June 2017; pp. 951–958. [Google Scholar]
- Yan, Y.; Hu, Z.; Shen, Y.; Pan, J. Surface Texture Recognition by Deep Learning-Enhanced Tactile Sensing. Adv. Intell. Syst. 2022, 4, 2100076. [Google Scholar] [CrossRef]
- Funabashi, S.; Isobe, T.; Hongyi, F.; Hiramoto, A.; Schmitz, A.; Sugano, S.; Ogata, T. Multi-Fingered In-Hand Manipulation With Various Object Properties Using Graph Convolutional Networks and Distributed Tactile Sensors. IEEE Robot. Autom. Lett. 2022, 7, 2102–2109. [Google Scholar] [CrossRef]
- Guo, D.; Liu, H.; Fang, B.; Sun, F.; Yang, W. Visual Affordance Guided Tactile Material Recognition for Waste Recycling. IEEE Trans. Autom. Sci. Eng. 2022, 19, 2656–2664. [Google Scholar] [CrossRef]
- Macaluso, E. Modulation of Human Visual Cortex by Crossmodal Spatial Attention. Science 2000, 289, 1206–1208. [Google Scholar] [CrossRef]
- Allen, P. Surface Descriptions from Vision and Touch. In Proceedings of the 1984 IEEE International Conference on Robotics and Automation Proceedings, Atlanta, GA, USA, 13–15 March 1984; Volume 1, pp. 394–397. [Google Scholar]
- He, K.; Zhang, X.; Ren, S.; Sun, J. Deep residual learning for image recognition. In Proceedings of the IEEE Conference on Computer Vision and Pattern Recognition, Las Vegas, NV, USA, 27–30 June 2016; pp. 770–778. [Google Scholar]
Disclaimer/Publisher’s Note: The statements, opinions and data contained in all publications are solely those of the individual author(s) and contributor(s) and not of MDPI and/or the editor(s). MDPI and/or the editor(s) disclaim responsibility for any injury to people or property resulting from any ideas, methods, instructions or products referred to in the content. |
© 2023 by the authors. Licensee MDPI, Basel, Switzerland. This article is an open access article distributed under the terms and conditions of the Creative Commons Attribution (CC BY) license (https://creativecommons.org/licenses/by/4.0/).