Abstract
In clinical surgery, the quality of endoscopic images is degraded by noise. Blood, illumination changes, specular reflection, smoke, and other factors contribute to noise, which reduces the quality of an image in an occluded area, affects doctors’ judgment, prolongs the operation duration, and increases the operation risk. In this study, we proposed an improved weighted guided filtering algorithm to enhance endoscopic image tissue. An unsharp mask algorithm and an improved weighted guided filter were used to enhance vessel details and contours in endoscopic images. The scheme of the entire endoscopic image processing, which included detail enhancement, contrast enhancement, brightness enhancement, and highlight area removal, is presented. Compared with other algorithms, the proposed algorithm maintained edges and reduced halos efficiently, and its effectiveness was demonstrated using experiments. The peak signal-to-noise ratio and structural similarity of endoscopic images obtained using the proposed algorithm were the highest. The foreground–background detail variance–background variance improved. The proposed algorithm had a strong ability to suppress noise and could maintain the structure of original endoscopic images, which improved the details of tissue blood vessels. The findings of this study can provide guidelines for developing endoscopy devices.
Keywords:
contrast enhancement; detail enhancement; endoscopic image; tissue structure; secondary weighted guided filtering MSC:
68U10
1. Introduction
With the development of science and technology, endoscopy has become a widely employed medical procedure [1]. Through endoscopy, doctors not only directly observe the tissue morphology and lesions of human internal organs but also further process endoscopic images to achieve excellent visual and diagnostic effects. However, owing to the particularity of human tissues and the limitation of imaging conditions, images obtained directly via endoscopy often have low contrast between blood vessels and surrounding tissues; thus, some vascular features are missing. Therefore, it is necessary to enhance endoscopic images [2,3,4].
Numerous image enhancement (IE) algorithms have been proposed to improve the quality of endoscope images. Retinal vascular enhancement in medical images [5] is achieved using image processing methods, such as the adaptive histogram equalization method, unsharpened mask algorithm [6], morphological method, Hessian matrix method [7], and multiscale filtering method [8,9,10]. The global and adaptive histogram equalization algorithms [11,12] are histogram-based IE algorithms. Wavelet analysis-based IE algorithms mainly include high-frequency wavelet transformation [13] and adaptive filtering [14]. Homomorphic filtering enhancement is typically used in image denoising [15] and dehazing [16]. Okuhata et al. [17] proposed a homomorphic filtering-based algorithm, wherein images containing brightness layer information are extracted from the original images and gamma correction is used to achieve high contrast. Considering the noise reduction, Gopi et al. [18] proposed a color image noise reduction method based on a dual-density dual-tree complex wavelet transform. Mo-hammed et al. [19] proposed a “tri-scan” IE algorithm that enhances the tissue surface and vascular characteristics. For the mucosal layer, the image R channel is processed using an adaptive sigmoid function to enhance the vascular contrast. Finally, tonal transformation is performed to enhance the structural characteristics of microvessels and tissues.
The quality of endoscopic images may be low due to some reasons; therefore, it is imperative to enhance endoscopic images. The deficiencies of endoscopic images are as follows. First, owing to the poor image quality of conventional photography, improving the image quality of an endoscope and enhancing image details are critical for accurate diagnosis. Second, the background of some tissues and blood vessels captured by an endoscope is red. The overall image contrast is insufficient, making distinguishing microvessels from the tissue background and finding lesions difficult, thereby affecting diagnosis. Third, during the shooting process using a complementary metal–oxide semiconductor (CMOS) camera, endoscopic images may have insufficient brightness because of light source problems or insufficient exposure, affecting the image observation. Finally, during endoscopy, the interior of the human tissue is smooth and some water droplets are present in the tissue, causing specular reflection areas in endoscopic images.
Therefore, in this study, we proposed an improved weighted guided filtering (WGF) algorithm for IE. Compared with the traditional guiding filter algorithm, the defect of noise residual can be overcome using our algorithm. The vascular detail and contour of endoscope images were enhanced by the proposed algorithm. The contrast enhancement of endoscopic images reduced the red component and enhanced the blue and green components so that the contrast between the background and vascular regions of endoscopic images could reach the maximum. A highlighted area in an endoscope image will induce errors in the feature point matching process of three-dimensional (3D) reconstruction; therefore, the detection and removal of the highlighted area are crucial. During the shooting process of a CMOS camera, an endoscope image may be taken with insufficient brightness due to an insufficient light source or exposure; thus, it is imperative to enhance the image brightness of an endoscope image with insufficient brightness. An adaptive and integrated neighborhood-dependent approach for nonlinear enhancement (AINDANE) algorithm [20,21] was employed to enhance the brightness of endoscopic images. Combined with the above algorithms, an endoscope image processing scheme was proposed in this study. The scheme included detail enhancement, contrast enhancement, brightness enhancement, and highlighted area removal, which could effectively improve the quality of endoscope images. The overall flowchart of this process is shown in Figure 1.
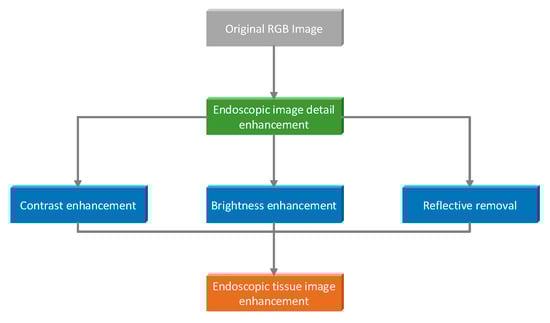
Figure 1.
Algorithm flowchart.
2. Methods
2.1. Guided Filtering
Guided image filtering (GIF) is a filtering algorithm proposed by He Kai-ming [22] and can be used for stereo matching, IE, image fusion, defogging, etc. To the best of our knowledge, GIF is the fastest edge-preserving algorithm and its complexity is O (N). The following linear relationship exists between the leading image G and the output image Q:
where denotes the filter window and and are constants in the window.
As the gradient between the texture of the output image and that of the guide image is the same, the equation is satisfied. Therefore, guided image filtering (GIF) can preserve edges to a certain extent. GIF’s energy function is defined as follows:
where denotes the regularization parameter, whose function is to prevent from becoming too large; represents the input image. Equation (3) is solved using the least-squares method as follows:
2.2. Weighted Guided Filtering
However, the regularization coefficient is fixed in the energy function of GIF and the effect of sharpening the prominent edge while denoising is not good. The λ in GIF is artificial and the differences in image textures between various windows are ignored. Therefore, some researchers have proposed a weighted GIF (WGIF) [23]. Thus, an edge weight factor is introduced in WGIF to adaptively adjust the regularization parameters as follows:
where denotes the center pixel of the current window and denotes the variance of the guiding image in pixel in the window. Currently, the window size is 3 × 3, and denotes the pixel size of the image. In this study, is and is the dynamic range of the input image. For 8-bit images, the value of is 256 and the value of is a fixed value of 0.065536. The energy function of Formula (6) can be expressed as follows:
WGIF outperforms GIF in terms of image sharpening and edge highlighting because of the adjustment of the edge weight factor. Furthermore, the algorithm complexity does not increase in WGIF compared with GIF.
2.3. Detail Enhancement of Endoscopic Images
(1) Determine parameter
In this study, is defined as the sharpening factor that controls the sharpening degree of the image. However, the factor is sensitive to noise and should be suppressed to control . Considering this factor, the following formula is used to calculate :
where denotes the total number of pixels of the grayscale image; denotes the gray image; and represents the R, G, and B channels of the image.
Endoscope images contain details, such as blood vessel information; therefore, the selected window radius should not be too large. Further, the influence of noise should be considered. Therefore, the window radius in the proposed endoscope IE algorithm was set to 16 and was 0.12.
(2) Quadratic improved WGF
The original endoscope image typically has some noise, whereas the noise of the WGF image is partially reduced. However, some residual noise exists in various frequency bands. A quadratic improved WGF algorithm was introduced to suppress the noise to overcome this defect.
First, the original endoscope image was filtered using the improved WGF algorithm to obtain the filtered image with a window radius of 16 and . Next, the original image was considered as the input image and as the guide image. The improved WGF was performed again.
2.4. Endoscopic Image Contrast Enhancement
In this study, an endoscopic blood vessel contrast enhancement algorithm based on spectral transformation was modified. To make the endoscopic image visually distinct, the maximization target of the tonal distance was defined as follows:
where represent the background and blood vessel areas of the original endoscopic image, respectively, and represent the background and blood vessel areas of the endoscopic image after the detail enhancement algorithm, respectively.
For the R channel component, the model linearly reduces its information using an attenuation factor of . For the G and B channel components, the model acts to improve the overall information; therefore, it uses a nonlinear function to process the endoscopic image to improve its contrast. The formula is as follows:
where can control the degree of translation of the function, can control the slope of the function, represents the input image, and represents the output image.
The model parameters were as follows.
endoscopic images and sets of parameters (each set of parameters are and , respectively) are selected for training. The steps of training parameters are as follows:
- (1)
- Input the th image, where the image size is 316 × 258. If is greater than , end the training and skip to S8; otherwise, execute S2.
- (2)
- Select the vessel and background regions of the endoscopic image.
- (3)
- Enter the th group of parameters. If is greater than , skip to S7; otherwise, go to S4.
- (4)
- A stretch is performed on each of the three channels using the following formula:
- (5)
- Both the original training image and processed image are in the RGB space and now they are converted to CIE space. The conversion formula is as follows:
- (6)
- Calculate the distance between the original image and blood vessel and the distance between the original image and background of the processed image; save the ratio in the array and go back to S3.
- (7)
- According to the maximization objective of Formula (12), a set of optimal parameters and of the original image can be obtained, and the optimal parameters of this set are saved in and , respectively; finally, go back to S2.
- (8)
- Take the average of and , and obtain a set of optimal parameters and ; finally, end the training.
After training on 20 images, the final results were , , , and .
2.5. Brightness Enhancement of Endoscopic Images
In the shooting process of a CMOS camera, the brightness of an endoscope image may be insufficient due to a light source problem or insufficient exposure. To solve this problem, it is imperative to enhance the brightness of the endoscope image. Li Tao et al. [24] proposed the AINDANE algorithm, which can improve the brightness of an image when the color of the endoscope image is dark due to the shooting equipment or surrounding environment. This function is mainly realized by the adaptive brightness enhancement module.
First, convert RGB images to grayscale images. The calculation process is expressed as follows:
where , , and represent the values of the R, G, and B channels , respectively, each of which is 8 bits.
Then, normalize using the following formula:
The calculation process of the nonlinear transfer function is expressed as follows:
This process is called dynamic range compression, where the parameter is related to the histogram of the image as follows:
When the cumulative distribution function value is 0.1, represents its corresponding gray value.
is used as an indicator of the brightness of an image. If the image is dark (), brightness enhancement is required; if the image is not so dark (), there is less need for brightness enhancement; if the image has sufficient brightness (), no enhancement is required. As such, the algorithm is adaptive. Figure 2 shows the cumulative distribution function of gray values at the gray level .
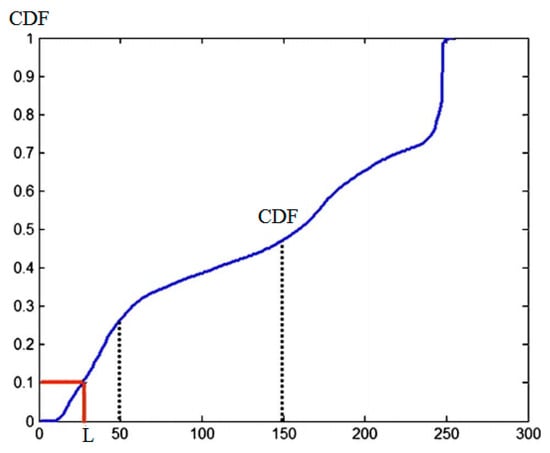
Figure 2.
Cumulative distribution function of the gray value: The red line is the cumulative probability; blue line is the CDF curve; gray line is the brightness value.
The transfer function is a combination of three simple functions. In Figure 3, curve 6 () is compared with the dotted line (line labeled 1), which represents the identity transformation. The first two terms are plotted as curve 2 and line 3, respectively, and their sum is curve 4. By adding the normalized curves 4 and 5 and dividing by 2, the transfer function shown in curve 6 was generated. The results showed that this transformation significantly increased the brightness of the darker regions and reduced the intensity of the brighter regions.
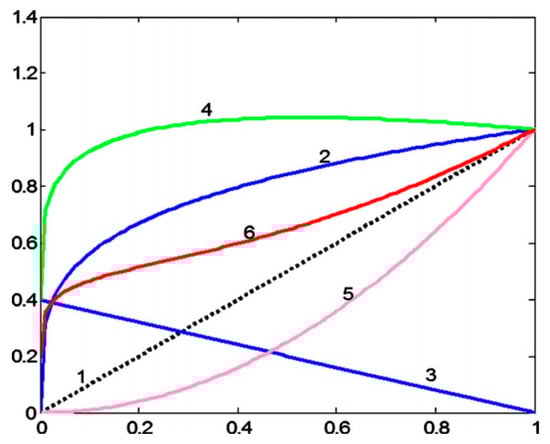
Figure 3.
Nonlinear transfer function: Line 1 is the identity transformation; Line 2 is the energy function; Line 3 is the first-order constraint term; Line 4 is the sum of lines 2 and 3; Line 5 is the first-order edge-aware constraint term; Line 6 is the line 4 and 5 phase Add and divide the normalized transfer function by 2.
Figure 4 shows the contrast of the brightness enhancement effect. Three original endoscope images with low brightness were enhanced using the proposed algorithm and their brightness was significantly improved.
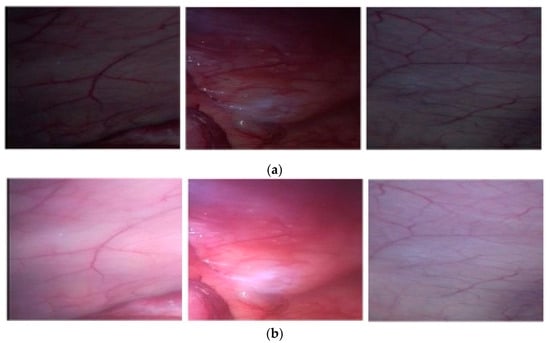
Figure 4.
Comparison of brightness enhancement effects: (a) original images and (b) after brightness enhancement.
2.6. Removal of Highlights from Endoscopic Images
(1) Highlight spot detection
First, the original image from the RGB model is converted to the HSV color model. To obtain absolutely bright areas, two thresholds and regarding saturation and lightness, respectively, are employed if the area is a highlighted area as follows:
However, the disadvantage of this method is that the rapid movement of the endoscope lens causes the misalignment of the color channels; therefore, the detected highlights can appear white or highly saturated R, G, or B.
The G and B channels, namely, and , can be normalized as follows:
Then, comparing 95% of the grayscale intensity of and with 95% of the intensity of , we obtain the following:
If a pixel is a highlighted area, it satisfies the following formula:
Then, the algorithm detects the parts of the endoscopic image where the highlights are not too intense. Its purpose is to compare each given pixel with a smooth, nonspecial surface color at the pixel location, which is estimated by local image statistics in the endoscopic image. A slightly lower threshold is set for the contrast intensity using a method similar to detecting brighter highlighted areas. Owing to the robustness and edge-preserving properties of the original image to outliers, it is essential to perform median filtering on the R, G, and B channels of the original image. Each detected highlighted region is then filled to the centroid of the pixel color within a fixed distance from the region outline. Then, this region of interest is isolated by complete separation of the masks obtained by performing two dilation operations on the masks of possible highlighted locations. For the dilation operation, disk-shaped structuring elements with radii of 2 and 4 pixels are used.
By comparing pixel values in the input image and median-filtered image, highlights are found as color outliers. For this comparison, several distance measures and ratios are possible. An example of such a metric is the Euclidean distance or the infinite norm of the difference in the RGB space. During the evaluation, it was found that the maximum ratio of the three color channel intensities in the original image to the median-filtered image yielded the best results. For each pixel position x, the intensity ratio maximum is calculated as follows:
where , , and denote the intensities of the median-filtered R, G, and B components, respectively.
Different color balance and contrast can cause this characteristic to vary significantly between images. These changes are compensated for using a contrast factor , which is calculated for the three color channels of each given image:
where denotes the sample mean of all pixel intensities in the color channel and denotes the sample standard deviation. Using the coefficients, Equation (22) is modified to obtain a contrast-compensated intensity ratio as follows:
If this pixel is a highlighted pixel, we have
The outputs of the first and second modules are connected using logical disjunctions that generate masks. The two modules complement each other well: the first module uses a global threshold, thus only prominent and bright specular highlights can be detected, whereas the second module detects less obvious highlighted regions by comparing the relative characteristics of surface colors. Owing to the high dynamic range of the image sensor, the second module alone can also achieve good results. However, because the sensor is easily saturated, the relative highlights become less intense such that no given area of the image is bright; thus, the first module still allows for detection in this case. Figure 5 shows the detection of the highlighted area of an endoscope.
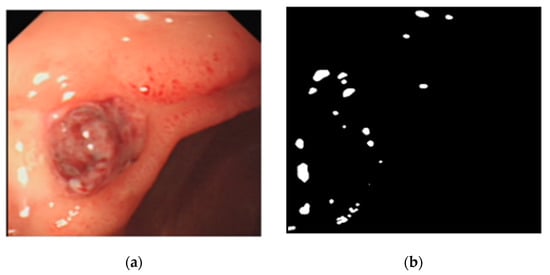
Figure 5.
Detection of highlighted regions in endoscopic images: (a) original specular image and (b) detected highlighted area.
(2) Repair of highlighted areas
Fill each detected highlight region with pixel color points within the range of the distance profile. Then, the Gaussian function is used to filter the image, which is similar to the median filtering after the image is filled, and, finally, a smooth image is obtained.
The binary mask of the highlighted area in the labeled image is converted to a smooth weighted mask. Smoothing is achieved by adding nonlinear attenuation to the contour of the mirror area. The weight of the pixels around the highlight in the weighted template is calculated according to the Euclidean distance from it to the contour of the highlighted area:
where the logical attenuation function ranges from to in the window, the distance range of the mapping is from 0 to , and .
The weighted sum between the integer-weighted mask , the original image , and the smooth image after the Gaussian filtering can obtain the repaired image . The calculation process is expressed as follows:
Figure 6 shows the comparison before and after the restoration of the highlighted area of the endoscope image. From the figure, the highlighted area was well repaired after using the proposed algorithm.
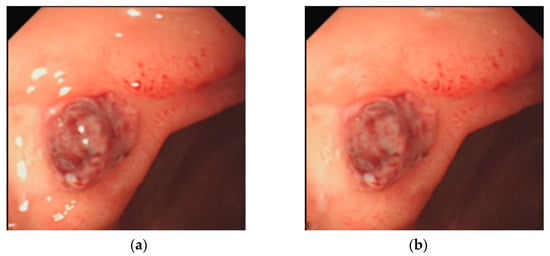
Figure 6.
Comparison of endoscopic image highlights before and after restoration: (a) original highlight and (b) restored highlight.
2.7. Specific Steps of the Endoscope IE Algorithm
The steps of the IE algorithm are as follows:
- (1)
- Categorize the original endoscope image into R, G, and B channels.
- (2)
- Obtain the base layer image of each channel using the quadratic improved WGF algorithm for the three channels.
- (3)
- Subtract the corresponding base layer images of R, G, and B of the three channels to obtain the images of the detailed layer of the three channels.
- (4)
- Multiply the detailed layer images of the three channels by the coefficient α to obtain the enhanced detailed layer images.
- (5)
- Add the detailed layer images and the corresponding base layer images of the three channels. Finally, merge the three channels to obtain the enhanced endoscope image.
2.8. Evaluation Method
In the endoscopic image evaluation, doctors’ subjective evaluation is still the main technique that is used to verify image quality. For laparoscopic endoscopic images, the establishment of a quantitative assessment is challenging because there are no available gold standards. In this study, to verify the performance of tissue vascular, brightness, and color enhancement, we defined the evaluation indexes for verifying IE: (1) peak signal-to-noise ratio (PSNR), (2) structural similarity index (SSIM), and (3) detail variance–background variance (DV-BV).
We used PSNR and SSIM to evaluate the image quality. In the experimental results, the higher the values of PSNR, the better the image quality. PSNR is a measure of image reconstruction quality as follows:
where MSE denotes the mean square error, denotes the maximum possible pixel value of the picture, denotes the original image, and denotes the noise image.
SSIM is used to measure the similarity of two images, where the larger the value, the more similar the two images are.
where μ denotes the mean, σ denotes the variance, and represents the covariance of and ; and are two constants, with and , and is the range of image pixels.
The image to be evaluated can be divided into two areas: detail and background. The local variance of the detailed area is obtained and then averaged. The detail variance (DV) can be obtained. The local variance of the background area is obtained and then averaged. The BV can be obtained. The calculation steps of the DV-BV value [25] are as follows:
- (1)
- Compute a histogram of the local variance values in the augmented image (each pixel is within a 5 × 5 field). The given threshold Tv is 5. Pixels that do not exceed this threshold are the detailed areas; otherwise, they are the background areas.
- (2)
- The DV-BV value is estimated as DV/BV. Its value is proportional to the degree of image detail enhancement.
3. Results
The experimental operating system was Windows 10, 64-bit. Matlab R2018b was used. The experimental dataset was provided by the Hamlyn Centre Laparoscopic/Endoscopy Video Dataset (http://hamlyn.doc.ic.ac.uk/vision/ (accessed on 2 September 2021)). with real laparoscopic images. The dataset contained 32,400 pairs of binocular endoscopic images. The size of an image was 384 × 192.
We filtered by inputting a grayscale image with three large difference grayscale values and then drew the corresponding histogram. The histogram distribution can measure the weakening of the halo. As shown in Figure 7, GIF had an obvious halo; EGIF had a small amount of halo; WGIF and GDGIF significantly improved the degree of halo reduction. The proposed algorithm was almost free of halos. Therefore, it was better than the other algorithms regarding the degree of halo reduction.
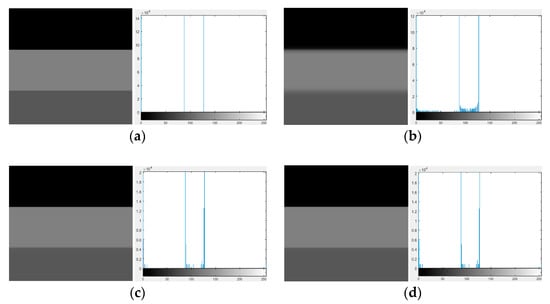
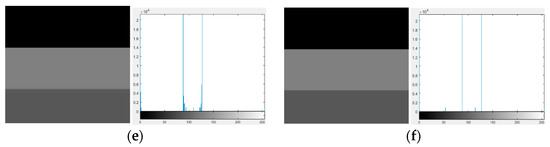
Figure 7.
(a) Original image (left) and histogram (right). Image after implementing (b) GIF (left), with filtered histogram (right); (c) WGIF (left), with filtered histogram (right); (d) GDGIF (left), with filtered histogram (right); (e) EGIF (left), with filtered histogram (right); and (f) proposed algorithm (left), with filtered histogram (right). The blue line is the halo distribution of the histogram.
As shown in Figure 8, GIF, WGIF [26], GDGIF [27], EGIF [28], and the proposed algorithm were used to process the original endoscopic images; six endoscopic images were enhanced by the endoscopic IE algorithm. The results of the endoscopic IE in Figure 7 revealed that although GIF and others enhanced the details of blood vessels, image distortion and noise amplification also occurred, which was attributable to the low edge maintenance ability of GIF and others. The noise retained by an image was amplified by a sharpening factor ; the image detail layer was obtained while retaining the noise. The edge retention capabilities of the proposed algorithm were superior to those of GIF, WGIF, GDGIF, and EGIF. Further, the proposed algorithm was less noisy and enhanced the details of the endoscopic tissue and blood vessels.
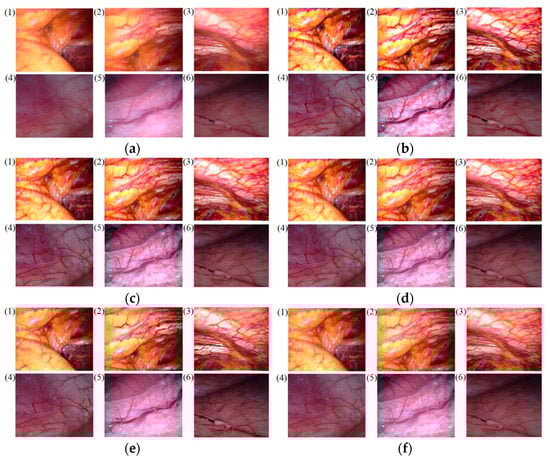
Figure 8.
(a) Original image, (b) GIF renderings, (c) WGIF renderings, (d) GDGIF renderings, (e) EGIF renderings, and (f) the proposed algorithm renderings. Subfigures (1)–(6) are randomly selected Hamlin laparoscopic images.
PSNR was used to measure the proportion of noise. Image quality is proportional to PSNR. To validate the proposed algorithm, we selected six images from the Hamlin Center Laparoscopy dataset. As shown in Table 1, the PSNR values of five algorithms were compared. Compared with GIF, WGIF, GDGI, and EGIF, the proposed quadratic WGF algorithm had the highest PSNR value, indicating that our technique made the tissue blood vessels clearer and had a better ability to suppress noise.

Table 1.
PSNR calculation results.
The similarity of two images can be measured using SSIM. The similarity of images is proportional to SSIM. As shown in Table 2, the proposed algorithm had the highest SSIM value compared with GIF, WGIF, GDGI, and EGIF, indicating that the proposed algorithm could better preserve the tissue structure of endoscopic images and had a higher structural similarity.
Table 2.
SSIM calculation results.
As shown in Table 3, the DV-BV value of the proposed algorithm was compared with the original endoscopic image. The DV-BV values of the images processed by the proposed algorithm were much higher than those of the raw endoscopic images, indicating that the proposed algorithm for enhancing image details and highlighting local information considerably improved the contrast. The enhancement effect was obvious.
Table 3.
DV-BV calculation results.
As shown in Table 1, Table 2 and Table 3, the average values obtained from the proposed improved quadratic WGF algorithm for the PSNR and SSIM were 32.6063 dB and 0.9391, respectively. The average DV-BV was 32.2309, which was 88% higher than that of the original image. We compared recent endoscopic IE algorithms, such as Sato et al.’s [29] endoscopic IE algorithm based on texture and color enhancement imaging (average SSIM = 0.9256), Wang et al.’s [30] vessel enhancement algorithm of nonlinear contrast stretching in multicolor space (DV-BV = 4.64, which was 54% higher than that of the original image), Qayyum et al.’s [31] single-shot deep image prior-based approach for retinal IE (PSNR = 22.47 dB and SSIM = 0.897), Fang et al.’s [32] endoscopic enhancement algorithm based on nonlinear unsharp mask and CLAHE (average PSNR = 24.5967 dB), and Gómez et al.’s [33] low-light IE algorithm based on convolutional neural networks (PSNR = 23.79 dB and SSIM = 0.88). Clearly, the proposed algorithm was superior to the comparison algorithms, which demonstrated the effectiveness of our technique.
4. Discussion
Because there are no corresponding reference materials for clinical endoscopic images, a more professional evaluation was needed to verify the effectiveness of the endoscopic IE methods. Therefore, we invited 10 chief physicians from the Affiliated Hospital of Southwest Medical University with more than 5 years of experience in laparoscopic surgery to score the enhanced images. The subjective evaluation score standard is shown in Table 4. Subjective evaluation criteria included edge sharpening, sharpness, invariance, and acceptability. The subjective quality evaluation results of the clinicians for different algorithms are shown in Table 5; the quality score adopted the mean ± variance.
Table 4.
Subjective evaluation score method.
Table 5.
Diagnostic quality assessment by different algorithms in Hamlin’s laparoscopic dataset (mean ± standard deviation).
In Table 4, edge sharpening, image sharpness, and acceptability were rated on a scale of 1 (worst) to 5 (best). A score of 1 indicated a nondiagnostic image, and a score of 5 indicated excellent diagnostic image quality. Meanwhile, pathological invariance was scored with 0 (change) or 1 (no change).
The evaluations of 10 clinicians are shown in Table 5; the proposed quadratic WGF algorithm obtained the best subjective quality evaluation, which was attributable to the improved unsharp masking algorithm of WGF. Images enhanced using WGF had better texture details. Compared to other filtering methods, WGF had advantages in clarity, invariance, and acceptability on the Hamlin Center laparoscopy dataset.
Figure 9 shows that the proposed algorithm can better preserve the basic structure of endoscopic images, as well as enhance tissue contours and vessel details. The brightness and contrast were considerably improved, and the dehighlight effect was better, validating the feasibility of the proposed algorithm.
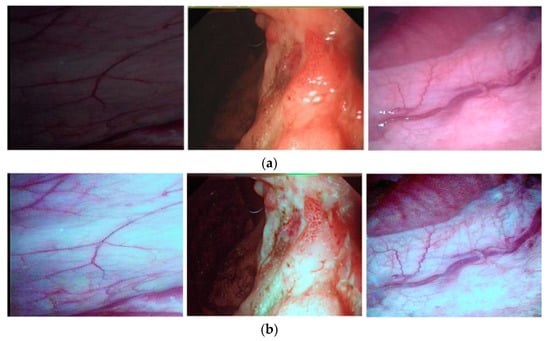
Figure 9.
Endoscopic IE results: (a) original images and (b) enhanced images using our algorithm.
In the subjective evaluation, objective evaluation, and comparison results, the proposed improved quadratic WGF algorithm made the endoscope image clearer and the vascular contrast was significantly enhanced. The performance of the proposed algorithm was superior to GIF, WGIF, GDGIF, and EGIF. A contrast-enhancing algorithm was used to train the endoscopic images after the detail was enhanced. By enhancing the G and B components of an image and reducing the R component, the tissue background and the tones of the blood vessels had a distinct contrast effect. Guided filtering based on the original image made the luminance and detail layers of each channel separated. The detailed layer with vascular features was enhanced. The contrast of the image was further enhanced, and a set of optimal parameters α = 0.75, m = 0.525, E = 2.15, and L = 1.241 were obtained. This ensured that the tissue background and blood vessels met the relevant requirements of the human visual angle.
5. Conclusions
An image enhancement algorithm based on secondary weighted guided filtering was proposed for endoscopy, which is a widely employed procedure in minimally invasive surgery. In the proposed algorithm, four modules—detail enhancement, contrast enhancement, brightness enhancement, and highlighted area removal—were simultaneously used to achieve contrast and sharpness enhancement of image vessels and contours. The modules can also be operated individually. The effectiveness of the proposed algorithm was verified using experiments. Both subjective evaluations and objective results showed that the proposed algorithm could preserve edges, reduce halo effects, and detect and remove highlights. Compared with other algorithms, the endoscopic image quality improved considerably. It was demonstrated that the proposed algorithm can be applied to endoscopic image processing. Therefore, the proposed algorithm has clinical application prospects in endoscopic image processing. Compared with other algorithms, the proposed algorithm had the least noise, but there was still some noise. In future work, we will continue to optimize the filtering algorithm. To meet the real-time and accuracy requirements of clinical operations, we will conduct research on smoke removal, super-resolution reconstruction, and 3D reconstruction of endoscopic images based on deep learning methods.
Author Contributions
Conceptualization, Y.P. and W.S.; methodology and guidance of the project, W.S. and G.Z.; validation, formal analysis, and data analysis, W.S. and G.Z.; writing—G.Z., J.L., E.C., Y.P. and W.S. All authors have read and agreed to the published version of the manuscript.
Funding
This work was supported by the National Natural Science Foundation of China (grant no. U21A20447 and 61971079), the Basic Research and Frontier Exploration Project of Chongqing (grant no. cstc2019jcyjmsxmX0666), Chongqing Technological Innovation and Application Development Project (cstc2021jscx-gksbx0051), the Innovative Group Project of the National Natural Science Foundation of Chongqing (grant no. cstc2020jcyj-cxttX0002), the Regional Creative Cooperation Program of Sichuan (2020YFQ0025), the Science and Technology Research Program of Chongqing Municipal Education Commission (KJZD-k202000604), the Doctoral Innovative Talents Project of Chongqing University of Posts and Telecommunications (BYJS202107), Chongqing Natural Science Foundation of China (cstc2021jcyj-bsh0218), and the Chongqing Science and Technology Bureau of China (D63012021013).
Institutional Review Board Statement
Not applicable.
Informed Consent Statement
Not applicable.
Data Availability Statement
Not applicable.
Acknowledgments
The authors thank everyone who contributed to this article.
Conflicts of Interest
The authors declare no conflict of interest.
References
- Bray, F.; Ferlay, J.; Soerjomataram, I.; Siegel, R.L.; Jemal, A. Global cancer statistics 2018: Globocan estimates of incidence and mortality worldwide for 36 cancers in 185 countries. CA Cancer J. Clin. 2018, 68, 394–424. [Google Scholar] [CrossRef] [PubMed] [Green Version]
- Togashi, K.; Osawa, H.; Koinuma, K.; Hayashi, Y.; Miyata, T.; Sunada, K.; Nokubi, M.; Horie, H.; Yamamoto, H. A comparison of conventional endoscopy, chromoendoscopy, and the optimal-band imaging system for the differentiation of neoplastic and non-neoplastic colonic polyps. Gastrointest. Endos. 2009, 69, 734–741. [Google Scholar] [CrossRef]
- Li, T.; Ni, B.; Xu, M.; Wang, M.; Gao, Q.; Yan, S. Data-driven affective filtering for images and videos. IEEE Trans. Cybern. 2015, 45, 2336–2349. [Google Scholar] [CrossRef] [PubMed]
- Li, T.; Yan, S.; Mei, T.; Hua, X.S.; Kweon, I.S. Image decomposition with multilabel context: Algorithms and applications. IEEE Trans. Image Processing 2010, 20, 2301–2314. [Google Scholar]
- Schuellerweidekamm, C.; Schaeferprokop, C.M.; Weber, M.; Herold, C.J.; Prokop, M. CT angiography of pulmonary arteries to detect pulmonary embolism: Improvement of vascular enhancement with low kilovoltage settings. Radiology 2006, 241, 899–907. [Google Scholar] [CrossRef] [PubMed]
- Zhang, K.; Wang, H.; Yuan, B.; Wang, L. An image enhancement technique using nonlinear transfer function and unsharp masking in multispectral endoscope. In International Conference on Innovative Optical Health Science; International Society for Optics and Photonics: Bellingham, WA, USA, 2017; Volume 10245, p. 1024504. [Google Scholar]
- Yang, S.F.; Cheng, C.H. Fast computation of Hessian-based enhancement filters for medical images. Comput. Meth. Prog. Biomedcine 2014, 116, 215–225. [Google Scholar] [CrossRef]
- Oh, J.; Hwang, H. Feature enhancement of medical images using morphology-based homomorphic filter and differential evolution algorithm. Int. J. Control. Autom. 2010, 8, 857–861. [Google Scholar] [CrossRef]
- Yin, X.; Ng, B.W.; He, J.; Zhang, Y.; Abbott, D. Accurate image analysis of the retina using Hessian matrix and binarisation of thresholded en-tropy with application of texture mapping. PLoS ONE 2014, 9, e95943. [Google Scholar]
- Ajam, A.; Aziz, A.A.; Asirvadam, V.S.; Izhar, L.I.; Muda, S. Cerebral vessel enhancement using bilateral and Hessian-based filter. In Proceedings of the 2016 6th International Conference on Intelligent and Advanced Systems (ICIAS), Kuala Lumpur, Malaysia, 15–17 August 2016. [Google Scholar]
- Kim, J.Y.; Kim, L.S.; Hwang, S.H. An advanced contrast enhancement using partially overlapped sub-block histogram equalization. IEEE Trans. Circ. Syst. Vid. Technol. 2001, 11, 475–484. [Google Scholar]
- Ma, J.; Fan, X.; Yang, S.X.; Zhang, X.; Zhu, X. Contrast limited adaptive histogram equalization-based fusion in YIQ and HSI color spaces for underwater image enhancement. Int. J. Pattern Recognit. Artif. Intell. 2017, 32, 1854018. [Google Scholar] [CrossRef]
- Yang, Y.; Su, Z.; Sun, L. Medical image enhancement algorithm based on wavelet transform. Electron. Lett. 2010, 46, 120–121. [Google Scholar] [CrossRef]
- Thirumala, K.; Pal, S.; Jain, T.; Umarikarb, A.C. A classification method for multiple power quality disturbances using EWT based adaptive filtering and multiclass SVM. Neurocomputing 2019, 334, 265–274. [Google Scholar] [CrossRef]
- Tian, C.; Fei, L.; Zheng, W.; Xu, Y.; Zuo, W.; Ling, C.W. Deep learning on image denoising: An overview. Neural Netw. 2020, 131, 251–257. [Google Scholar] [CrossRef] [PubMed]
- Tchaka, K.; Pawar, V.M.; Stoyanov, D. Chromaticity based smoke removal in endoscopic images. In Medical Imaging 2017: Image Processing; International Society for Optics and Photonics: Bellingham, WA, USA, 2017; Volume 10133, p. 101331M. [Google Scholar]
- Okuhata, H.; Nakamura, H.; Hara, S.; Tsutsui, H.; Onoye, T. Application of the real-time Retinex image enhancement for endoscopic images. In Proceedings of the 2013 35th Annual International Conference of the IEEE Engineering in Medicine and Biology Society (EMBC), Osaka, Japan, 3–7 July 2013; pp. 3407–3410. [Google Scholar]
- Gopi, V.P.; Palanisamy, P. Capsule endoscopic image denoising based on double density dual tree complex wavelet transform. Int. J. Imag. Robot. 2013, 9, 48–60. [Google Scholar]
- Imtiaz, M.S.; Mohammed, S.K.; Deeba, F.; Wahid, K.A. Tri-Scan: A three stage color enhancement tool for endoscopic images. J. Med. Syst. 2017, 41, 102. [Google Scholar] [CrossRef] [PubMed]
- Zhang, S.; Wang, T.; Dong, J.; Yu, H. Underwater image enhancement via extended multi-scale Retinex. Neurocomputing 2017, 245, 1–9. [Google Scholar] [CrossRef] [Green Version]
- Zheng, S.; Han, D.; Yuan, Y. 2-D image reconstruction of photoacoustic endoscopic imaging based on time-reversal. Comput. Biol. Med. 2016, 76, 60–68. [Google Scholar] [CrossRef] [PubMed]
- Ren, S.; He, K.; Girshick, R.; Sun, J. Faster R-CNN: Towards Real-Time Object Detection with Region Proposal Networks. IEEE Trans. Pattern. Anal. 2017, 39, 1137–1149. [Google Scholar] [CrossRef] [Green Version]
- Li, Z.; Zheng, J.; Zhu, Z.; Yao, W.; Wu, S. Weighted Guided Image Filtering. IEEE Trans. Image Process. 2015, 24, 120–129. [Google Scholar]
- Li, T.; Asari, V.K. Adaptive and integrated neighborhood-dependent approach for nonlinear enhancement of color images. J. Electronc. Imaging 2005, 14, 043006. [Google Scholar]
- Ghimire, D.; Lee, J. Nonlinear transfer function-based local approach for color image enhancement. IEEE Trans. Consum. Electr. 2011, 57, 858–865. [Google Scholar] [CrossRef]
- Hong, G.; Koo, M.; Saha, A.; Kim, B. Efficient local stereo matching technique using weighted guided image filtering (WGIF). In Proceedings of the 2016 IEEE International Conference on Consumer Electronics (ICCE), Las Vegas, NV, USA, 7–11 January 2016; pp. 484–485. [Google Scholar]
- Zhao, D.; Xu, L.; Yan, Y.; Chen, J.; Duan, L.Y. Multi-scale Optimal Fusion model for single image dehazing. Signal. Process-Image 2019, 74, 253–265. [Google Scholar] [CrossRef]
- Fragkou, P.; Galiotou, E.; Matsakas, M. Enriching the e-GIF Ontology for an Improved Application of Linking Data Technologies to Greek Open Government Data. Procedia Soc. Behav. Sci. 2014, 147, 167–174. [Google Scholar] [CrossRef] [Green Version]
- Sato, T. TXI: Texture and color enhancement imaging for endoscopic image enhancement. J. Healthc. Eng. 2021, 2021, 5518948. [Google Scholar] [CrossRef] [PubMed]
- Wang, Q.; Tao, P.; Yuan, B.; Wang, L. Vessel enhancement of endoscopic image based on multi-color space. Opto-Electron. Eng. 2020, 47, 190268. [Google Scholar]
- Qayyum, A.; Sultani, W.; Shamshad, F.; Tufail, R.; Qadir, J. Single-Shot Retinal Image Enhancement Using Untrained and Pretrained Neural Networks Priors Integrated with Analytical Image Priors. TechRxiv 2021. Preprint. [Google Scholar] [CrossRef]
- Fang, S.; Xu, C.; Feng, B.; Zhu, Y. Color Endoscopic Image Enhancement Technology Based on Nonlinear Unsharp Mask and CLAHE. In Proceedings of the 2021 IEEE 6th International Conference on Signal and Image Processing (ICSIP), Nanjing, China, 22–24 October 2021; pp. 234–239. [Google Scholar]
- Gómez, P.; Semmler, M.; Schützenberger, A.; Bohr, C.; Döllinger, M. Low-light image enhancement of high-speed endoscopic videos using a convolutional neural network. Med. Biol. Eng. Comput. 2019, 57, 1451–1463. [Google Scholar] [CrossRef]
Publisher’s Note: MDPI stays neutral with regard to jurisdictional claims in published maps and institutional affiliations. |
© 2022 by the authors. Licensee MDPI, Basel, Switzerland. This article is an open access article distributed under the terms and conditions of the Creative Commons Attribution (CC BY) license (https://creativecommons.org/licenses/by/4.0/).