Abstract
Vibration response has been extensively used for fault diagnosis to ensure the smooth operation of mechanical systems. However, the data for vibration condition monitoring may be misconstrued due to channel quality issues and external disturbances. In particular, data packet losses that often occur during transmission can cause spectral structure distortion, and as multiple sensing nodes are often employed for condition monitoring, the differences in the spectral structure distortions for different sensing nodes can be significant. While retransmission can reduce packet loss, it is difficult to achieve good performance under the complex conditions. Excessive or insufficient retransmission of data streams can result in unacceptable delays or errors for online fault diagnosis. In this paper, we propose a Packet Loss Influence-inspired Retransmission Mechanism (PLIRM) to address this problem and improve the online diagnostic efficiency. First, we devise a scheme for zero padding based on packet loss model (ZPPL) to preserve intrinsic properties of frequency domain. Then, we formulate a dynamic retransmission scheme generated based on the optimal packet loss mode to minimize the effects of spectral structure distortions. To ensure that the data stream that is most sensitive to a fault will be preferentially transmitted, we apply a priority setting trick using maximum mean discrepancy (MMD) to evaluate the spectral structure discrepancies between a data stream and the historical datasets. We evaluate the retransmission scheme using a fault diagnosis model based on K-nearest neighbor (KNN) for timely online bearing fault diagnosis. Extensive experimental results showed that the proposed method can accurately identify the bearing faults in a timely manner, outperforming competitive approaches under packet loss condition.
1. Introduction
Bearings are the most critical mechanical components for various machinery and unexpected failures will lead to downtime that can result in heavy economical losses and even serious human casualties [1,2,3]. Thus, timely detection and accurate diagnosis of rolling bearing faults has a very high practical value.
Much attention has been focused on vibration-based diagnosis of mechanical faults in rotating machines [4,5]. Due to the rotating nature, a periodic or quasi-periodic impulse would appear in the waveform of vibration signals from a defective bearing. These telling features can be used to characterize the mechanical health using signal processing techniques [6,7] such as singular value decomposition [8], wavelet transform [9] and Hilbert-Huang transform [10]. Recently, many vibration-based offline diagnostic approaches have been developed using various feature extraction and fault classification techniques. In [11], statistical features based on the central limit theory were extracted for fault classification. Babu et al. [12] used a sparse auto-encoder combined with partial corruption to improve the robustness of feature representation and achieved superior performance in the field of induction motor fault diagnosis. Zhang et al. [13] used a time-singular-value sequence for noise suppression and feature extraction, which enhances the fault frequency for diagnosis. However, due to the influence of transfer paths, the fault features extracted from multiple sensors installed in different positions exhibit significant differences in most fault diagnosis methods, which leads to great differences between diagnostic performances [14,15].
More recently, efforts have been focused on fault diagnosis with vibration signals sampled from different channels [16]. In [17], an optimal sensor placement method based on the bond graph to digraph transformation was proposed for fault diagnosis and isolation. Mobed et al. [18] proposed an algorithm for sensor location, type and number optimization based on magnitude ratio and fault evolution sequences, while Huang et al. [19] provided a method for locating sensitive measurement points via sensitive measurement point analysis based on resonance-based sparse signal decomposition. As these above research on the sensitive measurement points had mostly concentrated on sensor location optimization, the multiple data streams transmission challenge due to the sensitivities of the measurement points still remains. For this, Tong et al. [16] had proposed a novel multiple data streams transmission scheme to identify bearing faults in a timely manner, but only when there is no packet loss.
While fifth generation network (5G) can provide transmission speed approaching the limit of the sampling theorem, its transmission is still restricted by channel quality and subjected to external interference and environmental conditions. For example, packet loss will most likely remain serious for long distance communication in underground mines, which affects remote diagnosis of mining equipment seriously. One obvious remedy is to select only data segments that do not have lost packets for signal processing and diagnosis. However, the selection of such data segments will incur time and computation which may be acceptable for offline diagnosis but not practical for online diagnosis.
Interestingly, the influence of packet loss caused by network channels has rarely been considered in machinery diagnosis. The spectral structure of the sensor signals can be polluted by the occurrence of packet losses in the process of transmission, while the different transfer paths and external disturbances will further accentuate the variations in the distortions in the spectral structures of the different sensing nodes. This can pose a critical challenge for online detection of bearing failure which is dependent of the timely detection of a periodic or quasi-periodic impulse in the waveform of the vibration signals of a defective bearing. Although retransmission can be used to mitigate the packet loss, insufficient retransmission of data streams can lead to inaccurate prediction results, while excessive retransmission of data streams can cause increased time in transmission. It is also difficult to achieve promising performance under complex and varying conditions.
The ability to properly transmit data streams collected from multiple sensors under the condition of packet loss for timely online detection of bearing failures is thus a key issue that requires much attention. To solve this problem, we propose a novel adaptive retransmission mechanism to improve the online diagnostic efficiency effectively in the packet loss scenario. The major contributions of this paper are as follows:
- (1)
- First, zero padding based on packet loss model (ZPPL) is proposed to preserve intrinsic properties of frequency domain, and a theoretical study referring to packet loss influences on spectral structures is presented and lays the groundwork for the choice of packet length and the determination of optimal packet loss mode.
- (2)
- Based on the results of theoretical analysis, a packet loss influence-inspired retransmission mechanism (PLIRM) is proposed. The dynamic retransmission scheme is designed based on the optimal packet loss mode to minimize spectral structure distortion, and a priority setting trick to search for the minimum spectral structure discrepancy between data stream and the historical datasets is established via maximum mean discrepancy (MMD) to ensure that the most sensitive data stream to the fault will be preferentially transmitted. We then employed an evaluation criterion embedded in a fault diagnosis model based on K-nearest neighbor (KNN) to evaluate the retransmission scheme.
- (3)
- Experimental results showed that PLIRM can efficiently detect bearing faults and significantly outperformed competitive approaches under packet loss condition.
2. Influence of Packet Loss on the Spectrum
Data packet loss is unavoidable in the process of transmission over networks and it can destroy the spectral structure of the sensor data streams. Data packet splicing (DPS) causes spectral structural distortion such as spectral line offset and characteristic information loss in condition of packet loss. In order to preserve the inherent spectral structure as much as possible, we can conduct zero padding operation when packet loss occurs. However, while zero padding retains the original spectral information, fake frequencies are also introduced in constructed spectrums. Furthermore, various packet lengths can also affect the spectral structure under packet loss condition. In this section, we present a theoretical study on the influence of packet loss on the spectral structures and propose a novel scheme for zero padding based on packet loss model (ZPPL).
2.1. Packet Loss Model
A number of studies have shown that packet loss is characterized by transient bursts and exhibits temporal dependency [20], i.e., if packet n is lost, then there is normally a higher probability that packet will also be lost. To capture temporal dependency, a generalized model referred to as the two-state Markov model or Gilbert model is often used to simulate packet loss patterns. A two-state Markov model is shown in Figure 1.
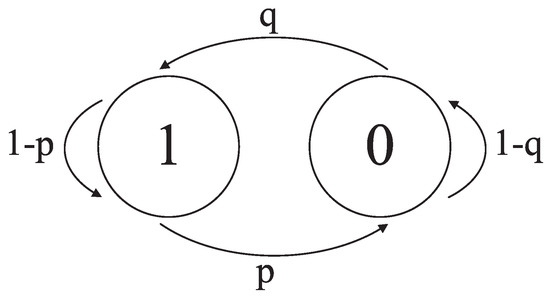
Figure 1.
Two-state Markov model.
In this model, one of the states represents the occurrence of packet loss while the other state represents the alternate case in which the packets are successfully transmitted. The transition probabilities between state 0 and state 1, as shown in Figure 1, are represented by p and q. Specifically, state 0 means that packet is lost and state 1 means that packet is not lost. p denotes the probability of transitioning from state 1 to state 0, and q is the probability of transitioning from state 0 to state 1. The probability that n consecutive packets are lost is given by . If , then the probability of losing a packet is greater after having already lost a packet than after having successfully received one.
2.2. Zero Padding Based on Packet Loss Model
For generality, we will denote the packet length as the number of sampling points in a data packet. In other words, if a test sample contains M data packets each with packet length N, then it consists of data points.
Suppose r data packets were lost in transmission, where . The packet loss rate and the process of packet loss in transmission is given in Figure 2a.
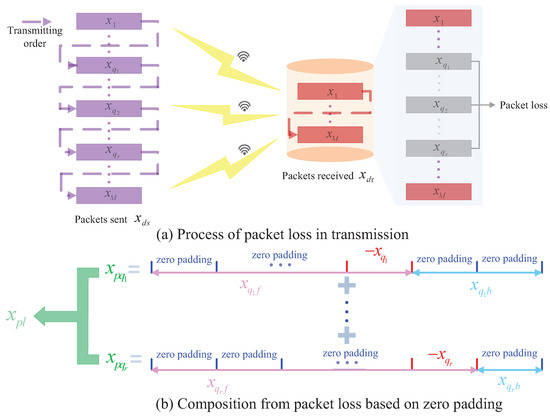
Figure 2.
The architecture of packet loss in transmission.
Let us denote the data sent as , and data received as , where , . Then can be expressed as:
where is a superposition of , which is illustrated in Figure 2b. is the th packet sent and . Take as an example, contains data points. The values of from th to th are and the other places are with zero padding. is denoted as:
Due to the superposition principle of linear transformation about fast Fourier transform (FFT), the frequency domain and can be derived according to Equations (1) and (2).
From Equation (3), the effects of ZPPL on the spectrum is determined by . Take as an example, is composed of zero padding and a data packet . According to Figure 2b and FFT, the frequency domain can be obtained as:
where . The spectral lines of can then be expressed as:
where and . According to Equations (3) and (4), ZPPL can be obtained as:
Spectral lines of ZPPL can thus be expressed as:
where and .
2.3. Effects Generated by Zero Padding Based on Packet Loss Model
Based on ZPPL and its spectral lines as expressed Equations (6) and (7). respectively, it is clear that the influences of packet loss on the spectrum are the superposition of frequency spectrum density from all lost packets, and fake frequencies and phase shifts are introduced when packet loss occurs. Remarkably, despite phase shifts are different, spectral amplitudes for different r are the same. Energies of characteristic frequencies about decreases as packet loss rate rises. For , phase shifts between FFT coefficients are when spectral line th. Phase shift between FFT coefficients when spectral line th is and extremums of amplitudes occur. With the increase of k, a spectral peak band (SPB) appears once phase shift becomes , which means that packet loss lead to spectral peak band. Essentially, these SPBs appear between frequency intervals of , which signifies that bandwidth of SPB is , where and N denote sample frequency and length of a packet. respectively. If is characteristic frequency of , the number of spectral speak bands or the number of spectral speak from 0 to .
It is worth noting that every fake spectral line is of a certain periodicity. For different , the periodicity of the same kth spectral line can be found in Equation (8).
Phase shift is the fundamental reason contributing to this phenomenon. It can be inferred from Equations (6)–(8) that this phenomenon directly affects results generated by three forms of packet loss as follows. (i) Packet loss occur in continuous position: Every spectral peak band will be divided into two parts and spectral peak will be reduced by half once a packet is lost. The more packets are dropped, the smaller the influences caused by spectral peak bands on the spectrum are. (ii) Packet loss occur in odd or even positions: The amplitudes of spectral peak bands will be strengthened when a packet is dropped, which essentially weakens the characteristic frequency. (iii) Packet loss occur in random position: The amplitudes of spectral peak bands will be suppressed to some extent when a packet loss occurs.
2.4. Validation with Numerical Simulation
To illustrate packet loss effects, let us consider a simulated vibration signal comprised of 3 harmonic components generated with a sampling frequency of Hz and a duration of 60 s. Equation (9) defines the generated synthetic signal:
where , , , Hz, Hz and Hz. Figure 3 shows the zoom-view of the generated signal and its corresponding spectrum calculating through fast Fourier Transform (FFT). Based on this simulated signal, three test samples comprising three kinds of packet lengths are constructed with the same number of packet. Specifically, the number of packet is selected as 100 and the packet length N of , and are set to 30, 50 and 200. respectively. In order to verify the effects of influence caused by packet loss, we introduce packet loss at 10% and 50%. For fair comparisons, we ensure that the packet loss positions are random and setup of packet loss positions are the same to , and . Figure 4 shows the different spectrums generated based on DPS and ZPPL under various conditions of packet losses.
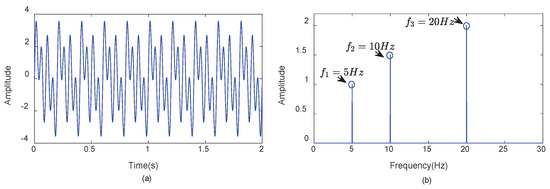
Figure 3.
(a) The zoom-in view of simulated vibration signal x; (b) the spectrum of x.
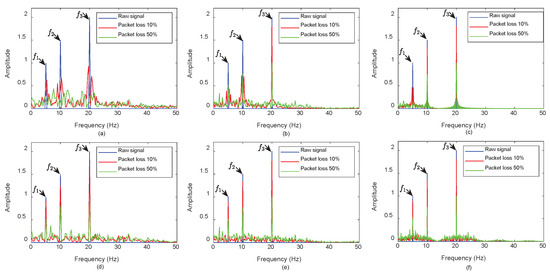
Figure 4.
(a) Spectrum of generated based on DPS; (b) spectrum of generated based on DPS; (c) spectrum of generated based on DPS; (d) spectrum of generated based on ZPPL; (e) spectrum of generated based on ZPPL; (f) spectrum of generated based on ZPPL.
Figure 4 shows that spectrum energy is inversely proportional to packet loss. We can observe that spectral structural distortion is more serious when the packet length is less than , where is characteristic frequency, and that the higher packet loss rate, the worse the damage on the spectrum. It shows that the structure of fault low frequency band is prone to be severely damaged based on DPS and fake frequencies are introduced, which decrease diagnostic accuracy. Although fake frequencies are also introduced, what is exciting is that characteristic frequency and its harmonic components on the spectrum generated based on ZPPL are clearly visible whatever the packet length is and it indicates that influences caused by packet loss from ZPPL are less than those from DPS.
In order to illustrate the influence introduced by ZPPL, one harmonic component of with characteristic frequency equal to is extracted for further exploration. Specifically, we take the spectrum shown in Figure 5 of from composed of 100 packets with packet length 200 as an example. Figure 6 shows the five forms of packet loss under the condition of packet loss 50%.
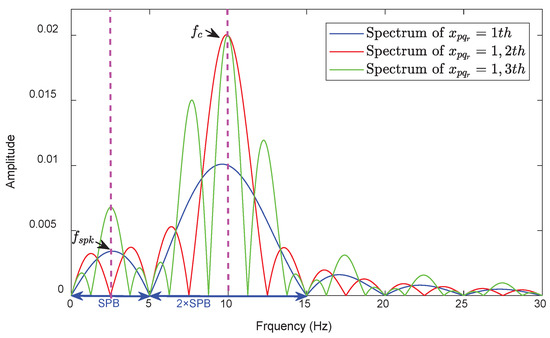
Figure 5.
The spectrum of .
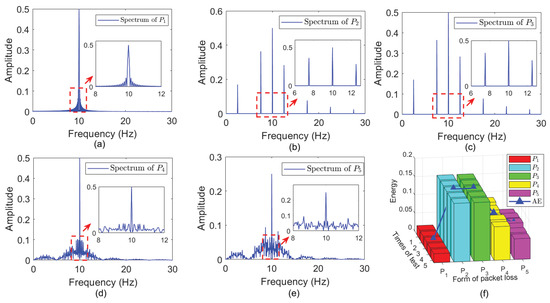
Figure 6.
(a) Spectrum based on that continuous packet loss; (b) spectrum based on that continuous odd position packet loss; (c) spectrum based on that continuous even position packet loss; (d) spectrum based on that random position packet loss; (e) spectrum based on that half odd position packet loss and half even position packet loss; (f) The sum of energy from .
From Figure 5, it is clear that packet loss causes SPB, and the width of SPB is equal to . The energies of SPB are uniformly reduced when packet loss happened in continuous position while the energies of SPB increase abnormally in other situations, and the root causes of above phenomenon is phase offset introduced by packet loss. Based on the results from Figure 6, has the minimum effect on raw signal and takes second place according to AE denoting average energy.
To sum up, in order to reduce the influence caused by packet loss as much as possible, two key points are acquired based on ZPPL: (a) The spectrums from are as similar as possible; and (b) the number of odd positions and even positions that packet loss occurs are as equal as possible. We devise two pivotal measures with respect to the choice of packet length and dynamic retransmission scheme Based on these observations in the next section.
3. Online Fault Diagnosis Based on Packet Loss Influence-Inspired Retransmission Mechanism
As mentioned, the spectral structure distortion and discrepancy caused by packet loss in the multisensor scenario can lead to unsatisfactory accuracy and effectiveness. To solve this issue, we propose a novel adaptive retransmission mechanism under packet loss condition for multiple data streams called PLIRM (Packet Loss Influence-inspired Retransmission Mechanism). The proposed framework of PLIRM is shown in Figure 7. First, ZPPL is constructed to preserve the intrinsic properties of spectral structure. Then, a dynamic retransmission scheme with embedded MMD is designed to minimize spectral structure distortion and search for the minimum spectral structure discrepancy, to ensure that the data stream that is most sensitive to the fault can be transmitted preferentially. Finally, a fault diagnosis model based on KNN is used to evaluate the retransmission scheme. The details of each part are elaborated in the following subsection.
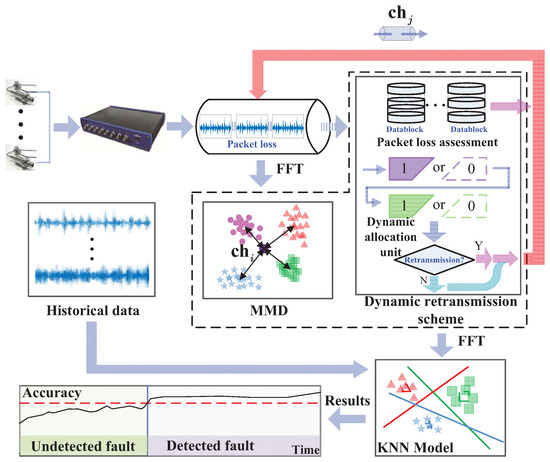
Figure 7.
The framework of packet loss influence-inspired retransmission mechanism (PLIRM) for online bearing fault diagnosis.
Packet Loss Influence-Inspired Retransmission Mechanism and Online Diagnosis
First, zero padding is applied to construct ZPPL by taking spectral structure distortion caused by packet loss into consideration. According to analysis of ZPPL on the spectrum in Section 2, in order to further reduce the influence caused by packet loss, one of the two key aspects is that inherent structure of each data packet in frequency domain should be as similar as possible. Therefore, the optimal packet length that the key parameter for constructing ZPPL should satisfy integral multiples of the number of sampling points during a period of fault characteristic frequency. Since the ratio is not generally an integer between sampling frequency and the fault characteristic frequency and the amount of data to transmit should be as small as possible for reducing transmission burden, the optimal packet length containing at least an integral periods of the maximum fault characteristic frequency from different fault types is adopted in our work. Then, the size of a test sample depends on the number of packets that influenced by packet loss rate. Packet loss rate is a serious situation, which means that the possibility of losing data is really high when the number of packet is not suitable. For this reason, the number of packet constituting a test sample is designed based on the Equation (10) and empirical values.
The selection of the optimal packet length does not guarantee that fake frequencies introduced by ZPPL can be effectively suppressed. Indeed, the optimal packet loss mode that the number of odd positions and even positions where packets loss occurs are as equal as possible is the other one key point for restraining spectral structure distortion. We design our dynamic retransmission scheme for this purpose as follows. First, the optimal number of retransmissions is determined based on packet loss assessment and a 2-sigma-limited Gaussian distribution shown in Equation (10), where ceil(·) is greater than or equal to the smallest integer of the expression.
denotes the probability that a packet is received during the nth retransmission and is the result of packet loss assessment, which can be obtained by calculating the ratio between the number of packets received and packets sent. When packet loss still occurs under the condition of , inspired by bisection method [21], is iteratively updated. Finally, is obtained. Then, dynamic allocation unit containing two packets is used to decide to whether to retransmit. As shown in Figure 1, ‘0’ and ‘1’ denotes packet loss and packet received. respectively and four possible consequences are obtained. Specific retransmission scheme is established based on these consequences which can be found in Table 1. ▲ and △ denote retransmission operation and no operation of retransmission. respectively. Note that remanent packets will be retransmitted when the previous packets have not been received.

Table 1.
Specific retransmission scheme.
In order to mitigate the influence of spectral structure discrepancies amongst different sensing nodes, a priority setting trick via MMD [16,22,23] is established on the basis of ZPPL and dynamic retransmission scheme. Once a fault occurs, the data distribution referring to the healthy condition of bearings is determined. If the distribution difference calculated by MMD is the smallest in frequency domain, then the spectral structure discrepancy between test data and historical dataset is the smallest and the resulting influences on efficent diagnosis can be reduced as much as possible. Hence, to achieve this, data packets of the kth channel that correspond to the smallest should be preferentially transmitted, where M denotes the number of data packets in a test sample and denotes the quantity of test samples.
Acquiring reliable diagnostic results in a timely manner is crucial for online fault diagnosis. We embed an evaluation criterion in the adaptive retransmission procedure as follows. A datablock constituted by and is the number of test samples is constructed for data preparation and fault diagnosis. KNN is introduced to build the fault diagnosis model in our work with the consideration of generalization error and diagnostic effectiveness. Following [24], we set , and adopt the Euclidean distance for the similarity measurement in construction of KNN-based model. Ultimately, online diagnosis is completed when multiple consecutive that diagnostic results obtained from datablocks exceed the alarm threshold. In retransmission assessment process, several evaluation indicators are defined as follows. defined as transmissive detection cost denotes whether this approach can detect bearing faults for online diagnosis. defined as transmissive time cost denotes the time cost resulting from the entire process beginning at the start of transmission and ending at the completion of diagnosis, and defined as transmissive data volume represents the number of datablocks when transmission and diagnosis are completed. Retransmission cost is defined as the average retransmission count in actuality.
The detailed steps of the packet loss retransmission mechanism can be summarized as follows:
- Step 1: At the beginning of transmission, determine packet length N and the number of packets M based on theoretical analysis referring to ZPPL and number multiple sensors randomly based on corresponding to relevant channels, and data packets on the site are transmitted by numbered sequence.
- Step 2: Construct test samples based on ZPPL and obtain the optimal retransmission via packet loss assessment.
- Step 3: Normalise test data streams and historical data in frequency domain and calculate the distribution differences between two datasets by using MMD [16], and are arranged in ascending order.
- Step 4: Perform specific retransmission scheme based on dynamic allocation unit according to Table 1. Data streams of the kth channel corresponding to the smallest will be preferentially transmitted until test samples are transmitted next. When the number of test samples reaches that the preset size of a datablock, which can be determined based on experience, go to Step 6.
- Step 5: between historical datasets and the latest data streams are updated via the latest value; then, are rearranged in ascending order. Next, go to Step 4.
- Step 6: Data preparation: Convert each transmitted test sample into frequency domian, and extract FFT amplitudes as corresponding fault features, and then, normalize this features by using mean values of zero and variances of 1.
- Step 7: Train the fault diagnosis model based on KNN by using preprocessed datasets including multiple types of healthy conditions related to bearings.
- Step 8: Obtain the diagnostic result based on a transmitted datablock according to fault diagnosis model.
- Step 9: Monitor that is updated continuously with the arrival of the latest datablock . When the number of multiple consecutive that exceed the alarm value , bearing fault diagnosis is completed and transmission evaluation indicators referring to , and are recorded.
The flowchart of online fault diagnosis based on the packet loss retransmission mechanism is shown in Figure 8.
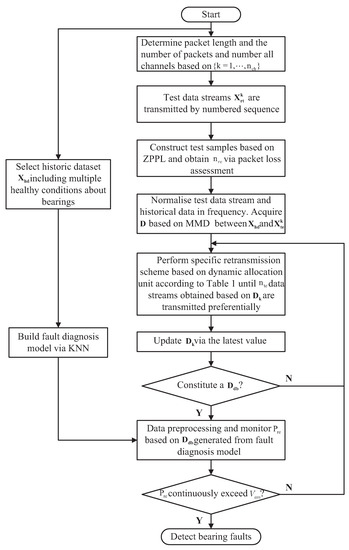
Figure 8.
Flowchart of online fault diagnosis based on packet loss influence inspired retransmission mechanism.
4. Experimental Evaluations
To verify the effectiveness of the proposed method, a bearing test rig for data collection and online diagnosis is used to compare the proposed approach with existing methods including STS, RTS and MDSTS [16]. STS and RTS are essentially conventional approaches namely, sequential transmission and random transmission. respectively, and MDSTS is a kind of multiple data stream transmission scheme. These competitive methods did not take the influence caused by packet loss into consideration.
4.1. Experimental Setup and Dataset Preparation
The experiments are carried out on the belt conveyor idler [16], as shown in Figure 9. One bearing without defects located in the bearing housing in the idler is closer to the motor. The other one is farther from the motor, and it could be replaced by the test bearings [23]. Eight accelermeters attached to the bearing housing with glue and magnetic bases are employed to collect and transmit the vibration signals of rolling bearing. The inner race fault (IF), outer race fault (OF), and ball fault (BF) are introduced to test rolling bearings.
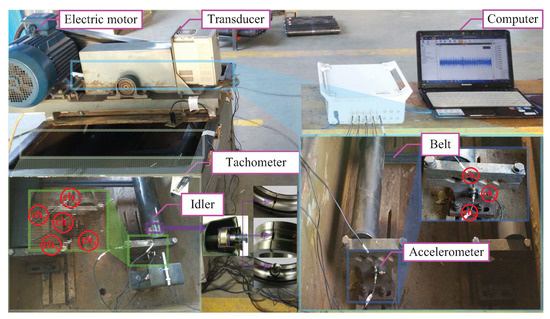
Figure 9.
Bearing test platform of the belt conveyor idler.
For the purpose of simulating the actual application so that the experimental results are more persuasive, in this experiment, four bearing conditions including NO (normal bearings), IF, OF and BF, are considered under the condition LOAD = 900 rpm, and raw vibration signals of eight accelerometers are sampled at 20 kHz on site. The type of bearing utilized is 6204, and its main parameters are displayed in Table 2.
Table 2.
Main parameters of the 6204 ball bearing.
The fundamental frequency in theory are calculated based on the bearing parameters. The characteristic frequencies of IF, OF and BF are 74.1495 Hz, 45.8505 Hz and 30.0345 Hz. respectively. The number of sampling points in a period are about 270, 436 and 667. respectively correspond to IF, OF and BF. In consideration of the parameter selection criteria and computational efficiency, the packet length N is set to 300 and the number of packets M is set to 20. The historical dataset contains data for four bearing conditions including NO, IF, OF and BF, with 200 samples for each health condition. Each sample contains 3000 Fourier coefficients acquired from FFT. is selected as 5 for spectral structure discrepancy evaluation. A datablock consists of test samples for predicting diagnostic result, and it is identified as the bearing fault when consecutive predicted values exceed , set based on a 2-sigma-limited Gaussian distribution.
To demonstrate the superiority of PLIRM, test samples from STS, RTS and MDSTS adopt DPS for comparison. In view of packet loss in long distance complex working environment, three levels of packet loss probabilities are considered in the experiment. Three maximum retransmissions times (MRT) are set. respectively for STS, RTS and MDSTS according to experience. In all, 108 different transmission tests under different conditions of packet loss and retransmission set are conducted, and a description of the experimental setup is shown in detail in Table 3.
Table 3.
Description of the experimental setup.
4.2. Diagnosis Results of the Proposed Method
The diagnostic results for the four transmission schemes are shown in Figure 10, Figure 11 and Figure 12. Each figure is composed of three subfigures under a particular packet loss probability and a specific fault type. The left of the symbol “-” in each figure represents the transmission scheme, and the right represents the retransmission times. The x-axis of every subfigure is the number of transmitted datablocks and the y-axis represents the detection accuracy for a datablock.
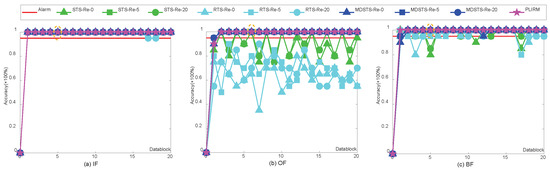
Figure 10.
Diagnostic results under the condition of 5% packet loss.
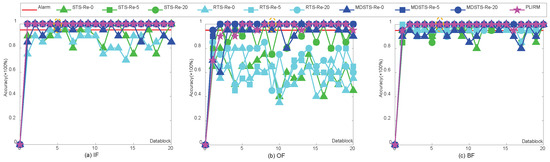
Figure 11.
Diagnostic results under the condition of 50% packet loss.
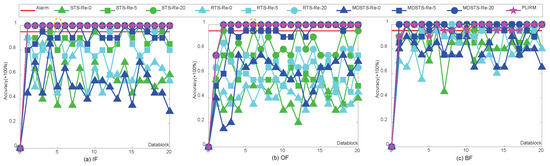
Figure 12.
Diagnostic results under the condition of 90% packet loss.
From the performance of the transmission schemes for online bearing fault diagnosis as shown in Figure 10, Figure 11 and Figure 12, it is clear that the performance of all the competitive methods dramatically declines with the increase in packet loss rates, and that the diagnostic results improve with increased retransmission times for every data packet. In terms of diagnostic performance, STS and RTS are similar and they both failed to diagnose faults in Figure 11 and Figure 12. Even when the packet loss rate is only 5% and the maximum retransmission times is 20, they still can not detect the outer race fault and ball fault in Figure 10b. MDSTS is superior to these two methods as shown in Figure 10b and Figure 11a,b. However, MDSTS still failed in its fault diagnosis when the packet loss reaches 90% and the maximum retransmission times <20, as shown Figure 12. However, our proposed PLIRM has outperformed others significantly. It can detect all faults in a timely manner even though the packet loss rate has reached 90% in Figure 12, and still its performance achieved 100% and it is very stable.
More details about the diagnostic results of the three healthy conditions under various packet losses can be found in Table 4 below. The computational accuracies of different transmission schemes are also shown in Table 5. The computational accuracy, indicated as , is defined as average ± standard deviation. The average accuracy is the average predicted value based on all transmissive datablocks. It is obvious that the more serious the packet loss is, the worse the performance of the competitive methods becomes, including greater time consumption and lower accuracy. Even if they can detect the faults in several cases (marked with * in Table 4), they are largely unstable. As shown in Table 5, the performance of STS, RTS and MDSTS are significantly unstable, whereas the results of PLIRM are more reliable and rapid for different packet losses under the condition of bearing outer faults. Due to the establishment of the dynamic retransmission scheme based on ZPPL and combining MMD, this phenomenon is significantly improved, which can be observed in Table 4 and Table 5. The time costs of STS, RTS and MDSTS remarkably increase with escalating packet loss. However, more importanly, PLIRM can always accurately detect faults in a timely manner.
Table 4.
Diagnostic performances under various packet loss schemes for online fault diagnosis.
Table 5.
Computational accuracies of different transmission schemes for online fault diagnosis under various conditions.
4.3. Discussion
Packet loss can pose spectral structure distortions and discrepancies in multiple data stream transmission, resulting in performance degradation for fault diagnosis and increased transmission costs. Thus, the key for effective online diagnosis is in reducing the influence caused by packet loss and transmitting the data streams most sensitive to the fault. In order to illustrate that the proposed method can achieve the above, we adopt the t-SNE technique [25] to visualize the transmitted data of mentioned methods in our experiment in a two-dimensional map. For illustration, we take the transmission test under the condition of 90% packet loss as an example in Figure 13 and Figure 14 for our discussion.
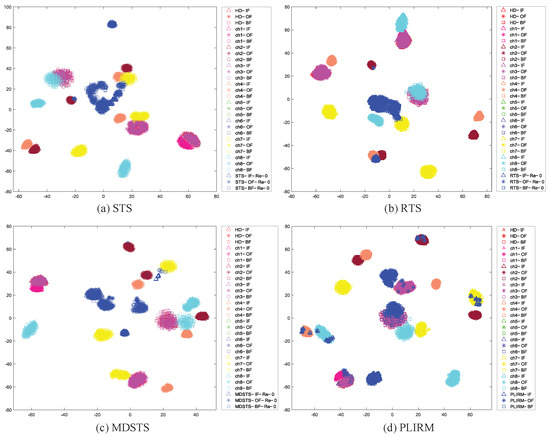
Figure 13.
Spectral structure discrepancies between transmitted data and different sensor nodes.
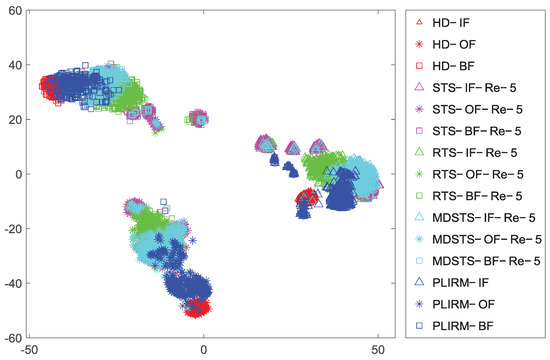
Figure 14.
Spectral structure discrepancies between different methods.
From Figure 13 and Figure 14, it is clear that there are significant discrepancies between data streams transmitted by STS, RTS and MDSTS without retransmission and different sensor nodes, which means that intrinsic properties from data streams transmitted by them are lost seriously. Besides, mode confusion between different fault types are pretty evident under a poor transmission condition. Although above influences are reduced slightly when retransmission times increases, the results are still not satisfied. As far as PLIRM is concerned, remarkably, despite there are slight differences between some intrinsic properties belonging to different domains, PLIRM can almost always transmit data streams referring to the most sensitivity to the fault, which indicates that influences involving spectral structure distortions and discrepancies are reduced dramatically. As stated above, compared with the competitive methods, our proposed method has obvious advantages.
5. Conclusions
In this paper, we have proposed an effective packet loss influence-inspired retransmission mechanism (PLIRM) for online fault diagnosis. Data streams exhibiting the smallest spectral structure discrepancy are preferentially transmitted or retransmitted based on dynamic retransmission scheme with embedded MMD. An evaluation criterion based on K-nearest neighbor is introduced in the processing of retransmission. Our experimental results under different transmission experimental scenarios with different packet loss probabilities and retransmission times have showed that the proposed method is indeed feasible and effective for remote online monitoring as it was able to address the performance issues of online diagnosis in multisensor scenarios with packet loss conditions successfully.
The future research will include extending the proposed method into online diagnosis of other rotating components involving multiple heterogeneous sensor signals such as motor current, torque and strain gauge. In addition, optimization of dynamic retransmission scheme when the retransmission time is fixed will also be further studied.
Author Contributions
Data curation, G.Z.; Methodology, Z.T., W.L. and E.Z.; Project administration, W.L.; Writing-original draft, Z.T. and B.Z. All authors have read and agreed to the published version of the manuscript.
Funding
This work is supported by the National Key R&D Program of China (2019YFB2006400) and the Fundamental Research Funds for the Central Universities (2019ZDPY08).
Institutional Review Board Statement
Not applicable.
Informed Consent Statement
Not applicable.
Data Availability Statement
Not applicable.
Acknowledgments
The authors thank See-Kiong Ng from National University of Singapore for his contributions to improving the quality of the paper.
Conflicts of Interest
The authors declare no conflict of interest.
References
- Gang, L.; Geoff, L.M.; Qing, Z. Sinusoidal synthesis based adaptive tracking for rotating machinery fault detection. Mech. Syst. Signal Process. 2017, 83, 356–370. [Google Scholar]
- Enrico, Z.; Giulio, G. A neuro-fuzzy technique for fault diagnosis and its application to rotating machinery. Reliab. Eng. Syst. Saf. 2009, 94, 78–88. [Google Scholar]
- Jalan, A.K.; Mohanty, A.R. Model based fault diagnosis of a rotor–bearing system for misalignment and unbalance under steady-state condition. J. Sound Vib. 2009, 327, 604–622. [Google Scholar] [CrossRef]
- Ruqiang, Y.; Robert, X.G.; Xuefeng, C. Wavelets for fault diagnosis of rotary machines: A review with applications. Signal Process. 2014, 96, 1–15. [Google Scholar]
- Wangpeng, H.; Yin, D.; Yanyang, Z.; Ivan, W.S. Sparsity-based algorithm for detecting faults in rotating machines. Mech. Syst. Signal Process. 2016, 72–73, 46–64. [Google Scholar]
- Yongbo, L.; Minqiang, X.; Yu, W.; Wenhu, H. A new rolling bearing fault diagnosis method based on multiscale permutation entropy and improved support vector machine based binary tree. Measurement 2016, 77, 80–94. [Google Scholar]
- Wanqing, S.; He, L.; Enrico, Z. Long-range dependence and heavy tail characteristics for remaining useful life prediction in rolling bearing degradation. Appl. Math. Model. 2022, 102, 268–284. [Google Scholar]
- Huiming, J.; Jin, C.; Guangming, D.; Tao, L.; Gang, C. Study on Hankel matrix-based SVD and its application in rolling element bearing fault diagnosis. Mech. Syst. Signal Process. 2015, 52–53, 338–359. [Google Scholar]
- Staszewski, W.J. Wavelet Based Compression and Feature Selection for Vibration Analysis. J. Sound Vib. 1998, 211, 735–760. [Google Scholar] [CrossRef]
- Ramesh Babu, T.; Srikanth, S.; Sekhar, A.S. Hilbert–Huang transform for detection and monitoring of crack in a transient rotor. Mech. Syst. Signal Process. 2008, 22, 905–914. [Google Scholar] [CrossRef]
- Wei, L.; Zhencai, Z.; Fan, J.; Gongbo, Z.; Guoan, C. Fault diagnosis of rotating machinery with a novel statistical feature extraction and evaluation method. Mech. Syst. Signal Process. 2015, 50, 414–426. [Google Scholar]
- Wenjun, S.; Siyu, S.; Rui, Z.; Ruqiang, Y.; Xingwu, Z.; Xuefeng, C. A sparse auto-encoder-based deep neural network approach for induction motor faults classification. Measurement 2016, 89, 171–178. [Google Scholar]
- Shangbin, Z.; Siliang, L.; Qingbo, H.; Fanrang, K. Time-varying singular value decomposition for periodic transient identification in bearing fault diagnosis. J. Sound Vib. 2016, 379, 212–231. [Google Scholar]
- Yaguo, L.; Zongyao, L.; Jing, L.; Fanbo, L. Phenomenological models of vibration signals for condition monitoring and fault diagnosis of epicyclic gearboxes. J. Sound Vib. 2016, 369, 266–281. [Google Scholar]
- Qing, X.; Yanhai, X.; Yiqiang, P.; Weihua, Z.; Yongjian, L. Low-speed rolling bearing fault diagnosis based on EMD denoising and parameter estimate with alpha stable distribution. J. Mech. Sci. Technol. 2017, 31, 1587–1601. [Google Scholar]
- Zhe, T.; Wei, L.; Bo, Z.; Fan, J.; Gongbo, Z. Online Bearing Fault Diagnosis Based on a Novel Multiple Data Streams Transmission Scheme. IEEE Access 2019, 7, 66644–66654. [Google Scholar]
- Alem, S.; Benazzouz, D. Bond graph to digraph conversion: A sensor placement optimization for fault detection and isolation by a structural approach. Sadhana 2014, 39, 1151–1164. [Google Scholar] [CrossRef] [Green Version]
- Mobed, P.; Maddala, J.; Pednekar, P.; Bhattacharyya, D.; Rengaswamy, R. Optimal Sensor Placement for Fault Diagnosis Using Magnitude Ratio. Ind. Eng. Chem. Res. 2015, 54, 9369–9381. [Google Scholar] [CrossRef]
- Wentao, H.; Zhiqiang, L.; Hongjian, S.; Hongyin, D.; Weijie, W. Sensitive measuring points analysis of fault vibration signal of wind turbine gearboxes based on resonance-based sparse signal decomposition. In Proceedings of the 2017 29th Chinese Control And Decision Conference (CCDC), Chongqing, China, 28–30 May 2017; pp. 4766–4771. [Google Scholar]
- Homero, T.; Deni, T.; Leopoldo, E. Simulation and Modeling of Packet Loss on VoIP Traffic: A Power-law Model. WTOC 2009, 8, 1053–1063. [Google Scholar]
- Xinhua, S.; Yilun, W.; Xuejing, K.; Ran, T. Nonconvex Truncated Nuclear Norm Minimization Based on Adaptive Bisection Method. IEEE Trans. Circuits Syst. Video Technol. 2019, 29, 3159–3172. [Google Scholar]
- Yiming, C.; Shiji, S.; Shuang, L.; Le, Y.; Cheng, W. Domain Space Transfer Extreme Learning Machine for Domain Adaptation. IEEE Trans. Cybern. 2019, 49, 1909–1922. [Google Scholar]
- Zhe, T.; Wei, L.; Bo, Z.; Fan, J.; Gongbo, Z. Bearing Fault Diagnosis Under Variable Working Conditions Based on Domain Adaptation Using Feature Transfer Learning. IEEE Access 2018, 6, 76187–76197. [Google Scholar]
- Pandya, D.H.; Upadhyay, S.H.; Harsha, S.P. Fault diagnosis of rolling element bearing with intrinsic mode function of acoustic emission data using APF-KNN. Expert Syst. Appl. 2013, 40, 4137–4145. [Google Scholar] [CrossRef]
- Laurensvander, M.; Geoffrey, H. Visualizing Data using t-SNE. J. Mach. Learn. Res. 2017, 9, 2579–2605. [Google Scholar]
Publisher’s Note: MDPI stays neutral with regard to jurisdictional claims in published maps and institutional affiliations. |
© 2022 by the authors. Licensee MDPI, Basel, Switzerland. This article is an open access article distributed under the terms and conditions of the Creative Commons Attribution (CC BY) license (https://creativecommons.org/licenses/by/4.0/).