1. Introduction
Queueing theory is very useful for modeling various real-world systems, contact centers, airports, banks, telecommunication, and retail networks, in particular. The queueing model considered in this paper has two main novel features: (i) the mechanism of customer’s arrival is dependent on the current rating of the system and (ii) consideration of self-service of customers via so-called self-service devices () or self-checkouts. Both these features are inherent for many real systems, e.g., entertainment systems, contact centers, food services, and retail networks. Thus, they have to be carefully taken into account in system design and management aiming to guarantee the effective operation of a system. The effective operation suggests earning the maximal profit received by the system via customers service and a high degree of customer satisfaction.
The standard queueing models considered in the literature suggest that the arrival flow of customers to the system does not depend on the system state. The flow entering the service may depend on this state via the mechanism of customers admission depending on the visibility of a queue, as well as its length and (or) the number of busy servers. In this paper, we assume the dependence of the arrival process not on the queue length but the rating of the system.
The rating is now the well-known notion that reflects the customers’ satisfaction and has an influence on the choice among the competitive service systems in which the customer can obtain service. Ratings of various service systems are now very popular and easily available, e.g., on the Internet. Checking ratings/reviews before making consumption decisions has become a ritual for many of today’s customers, see [
1]. The rating dynamically evaluates the current quality of customer service in this system. The rating of the system may cause so-called word-of-mouth advertising and has quite a strong influence on the preferences of the customers and their arrival rate to any system. In turn, this has a high impact on the profit earned by this system, and the ratings have to be taken into account in the management of the system operation. Analysis of queueing systems with an arrival process depending on the rating of the system is of high practical importance.
The existing literature about the queues with servers rating is not extensive. In [
1], a queueing model with two types of customers is considered. Sophisticated customers are well-informed of service-related information and make their joining-or-balking decisions strategically, whereas naive customers do not have such information and rely on online rating information to make such decisions. The problem of optimal pricing strategy is solved in [
1]. The queueing model containing two competitive systems with customers’ choice of the system to be joined via the comparison of the individual ratings of the systems was recently considered with the use of matrix analytic methods in [
2].
In modern retail networks, hotels, banks, airports, etc., there is a robust trend for extending the use of self-service devices (
) or self-checkouts.
s have been defined by the new technological interfaces (e.g., the Quick Response (QR) codes, image and face recognition, radio frequency identification (RFID)) that allow customers to produce services without a service employee’s involvement, see, e.g., [
3]. The human operator (administrator, assistant, etc.) is involved in the service only upon request of a customer who asks for help in resolving certain problems that he/she met during a service or in the case of violation of the established rules by a customer. The use of
is becoming very wide nowadays, in particular, in many retail networks worldwide due to many reasons. The main reason is that it is profitable for both owners of services and customers.
The owners save money via non-payment of salaries to service employees and other operational costs. This creates better opportunities for successful competition with very popular now online shopping that is associated for many customers with the safest (from the perspective of health safety) and convenient way of shopping. Statistics show that one human operator (administrator, assistant, etc.) can easily control 6–10 s. The s take up less space than the regular cash registers, which allows optimizing the store space. With their help, it is possible to unload the cash register area and to increase its throughput. Among other things, s encourage customers to make additional purchases. At one time, McDonald’s found out during an experiment that visitors spend an average of 30 percent more on purchases when they are not worried that the person behind the cash register will evaluate their choice. The use of s may allow the reduction of the actual and perceived waiting time that is strongly linked with customers satisfaction. In turn, this should imply higher loyalty of customers and the future profit of the owner.
The main profit gained by a customer consists of: (i) having a chance to avoid long waiting in the queue until the human server (cashier) will become available. Waiting generally is regarded as an undesirable activity that customers must undertake to complete the service. Waiting can lead to both emotional (anger, irritation, frustration, boredom, stress) and behavioral (e.g., abandonment or reneging) responses, especially when it is costly and limits the person’s ability to engage in more productive or rewarding ways to spend their time; (ii) getting more control over his/her shopping experience; (iii) obtaining a possibility of better distancing from other buyers what is very important in the current era of the COVID-19 pandemic. With the continuous improvement in technology and the promotion of self-service retail stores in the market, their numbers will increase. Furthermore, the scales of users and transactions will rapidly increase in the future. For more existing literature about the perspectives and attractiveness of the use of
s, see, e.g., [
4,
5,
6,
7,
8].
In the early beginning, the spread of the use of s was fully justified by the huge investment of the companies to enforce the use of the new perspective technologies. After they are already implemented in life, it is necessary to effectively manage the operation of each concrete service system. To this end, besides many administrative problems, a whole bunch of pure mathematical problems has to be resolved. One of these problems is a traditional problem in modeling service systems. Namely, given the actual or expected characteristics of the arrival process, the distribution of service time of one customer, and the required values of the service level indicators, it is necessary to optimally choose the number of required servers (s). Such indicators may be, e.g., the probability that the waiting time of an arbitrary customer will not exceed the given value with the fixed in advance value or the probability of customer abandonment.
It is known that, during the use of for purchases, the customers can meet problems related, e.g., to the search of the necessary good on the shelves, readability of RFIDs, correct use of the scales, damage of the goods. To resolve the potentially arising problems, usually, the stores have some additional staff of administrators (assistants, helpers, etc.). They provide help to a customer if at least one of the assistants is not busy. Otherwise, the customer should wait until one of the assistants becomes available. Therefore, the problem of the optimal choice of the number of s is supplemented by the problem of the optimal matching of the number of required assistants to the number of the s. The redundant number of assistants implies higher, unjustified operational costs. The insufficient number of assistants causes long waiting times for help for a customer. That, in turn, implies longer total service time of this customer, longer waiting time of other customers, the higher probability of the abandonment and reneging by an arbitrary customer from the system, and the loss of potential profit that could be earned by service of customers. In this paper, we solve the problem of computation of the values of performance indicators under any fixed set of the numbers of s and assistants. The problem is formulated and solved in borders of the matrix queueing theory. The usability of this result for the optimal choice of such a set is numerically illustrated.
Due to the practical importance of the effective use of
s, there are a lot of papers devoted to this topic. We mention only a few of them that operate with the notion of a customer waiting time. Analysis of the waiting time is one of the standard goals in queueing theory. In [
6], the usefulness of queueing theory for the analysis of systems with
is noted. The question of the relation of the actual waiting time of a customer and the perceived waiting time, as well as their strong link with customer satisfaction, are discussed. Customer satisfaction is strongly associated with the loyalty of the customers, which is very important for service providers. Therefore, analysis of the ways to increase the loyalty of the customers strongly correlates with an analysis of the actual waiting time of a customer. Such a time is one of the key performance indicators of the majority of queueing systems. Thus, queueing analysis is an important part of solving the problem of the optimal design of the systems of
s. However, the analysis of many queueing systems is quite complicated. This explains why analysis of these systems is often implemented not via the use of the analytical and algorithmic methods of queueing theory but via the computer simulation methods. Namely, the method of computer simulation is used for the experimental study of the systems of
s. In [
7], the correlation of the waiting time, customer experience, and satisfaction was discussed via the use of certain methods of sociology. The content of [
8,
9] is similar to [
7], and the methods of sociology are also used.
In our paper, we provide an analysis of the queueing model with
s and assistants. The existing literature about the queues with service assistants is quite scarce. The recent paper [
10] is devoted to the analysis of the set of
s described in terms of a tandem queueing model with a single-server first phase and a multi-server second phase. All distributions defining the system operation are exponential. The behavior of the system is described by a two-dimensional Markov chain that is the Quasi-Birth-and-Death-Process. This process is easily analyzed via the tools of the matrix-geometric method by M. Neuts, see [
11].
The queueing model of the self-checkout (self-service) system considered in our paper assumes the existence of two multi-server sub-systems. Let us denote the number of servers in these two systems as N and correspondingly. The first sub-system defines the service process of customers by themselves. Any arriving customer that does not abandon the system (due to too long, in his/her opinion, queue) obtains service in this sub-system and successfully departs from the system if he/she does not encounter service problems. If a problem occurs, the server from the second sub-system has to help in resolving this problem if they are available. If all servers of the second sub-system are busy, the customer that encountered the problem suspends their service until any server of the second sub-system becomes available. After the problem is resolved, the server in the first sub-system resumes the work while the corresponding assistant is released. A problem in service at the first sub-system can occur an arbitrary number of times. After service is completed, the customer departs from the system.
As follows from this brief description, our model does not belong to the class of tandem queues because the service of an arbitrary customer does not strictly consist of at most two sequential services at different queueing systems. This service may be the sequence of alternating services by servers from the first and the second sub-systems. Our model is more similar to the unreliable queue with repairmen. The first sub-system describes the service of customers, and the second sub-system describes the behavior of the pool of repairmen. However, the overwhelming majority of the papers devoted to this subject consider only the joint distribution of the number of non-broken servers and the number of busy repairmen. The duty of servers to provide service and a possible queue of customers are not taken into account; see the survey [
12], paper [
13], and references therein. In our model, namely, the characteristics of the customers’ service quality are in the focus of the study.
Models similar to our queueing models (however, without the rating consideration) are considered in the following papers. In [
14], the model with
N servers and
assistants (called in [
14] as the main servers and the consultant) is considered. Arrivals are defined by quite a general Markov Arrival Process (
); for definition, properties, and related research, see [
15,
16,
17,
18]. Other distributions characterizing the system are assumed to be exponential. The system is comprehensively analyzed using the matrix analytic methods. Extensive illustrative numerical examples to bring out the qualitative nature of the model are presented. In [
19], the model with
servers and
assistants is analyzed. All parameters of the system depend on the state of a finite state random environment. All involved distributions are assumed to be exponential. The system is analyzed using the matrix analytic methods. In [
20], the model with
servers and
assistants is analyzed. The input buffer is finite, and the number of opportunities to ask for help by each server is restricted. Service and help times have so-called phase-type (
) distributions, see [
11]. The system is analyzed using the matrix analytic methods. The model considered in [
21] assumes an arbitrary number of servers and assistants (called in this paper, specialist servers); the possibility of providing help by the assistant is only after the main service. Service cannot be continued after receiving help. Practically, this means the consideration of a tandem queueing model. The arrival process is the
, and the help times have
distributions. The system is analyzed using the matrix analytic methods. A little bit similar to our model under quite general assumptions about the arrival process (the Batch Markov Arrival process) and service times (phase-time distribution) was recently considered in [
22]. In that model, if the server does not succeed in finishing the service of a customer within a certain time, then the so-called backup server joins with the server for the service of this customer. When both servers serve a customer, the service speed increases. Another difference is that in [
22], after obtaining help from the backup server, the server mandatorily finishes the service. In our model, we suggest that the server can obtain help from the assistant many times, and the server and the assistant do not cooperate in service. During obtaining the help, service is not provided.
The additional two features of the model considered in this paper are the following.
The model suggests the visible queue. This means that the arriving customer can see the number of customers in the queue and can use this information to decide to join a queue or abandon (balk) it, e.g., queueing systems managed by ticket technology is widely used in service industries, as well as government offices, see [
23]. Upon arriving at a ticket queue, each customer is issued a numbered ticket. The number currently being served is displayed. An arriving customer balks if the difference between their ticket number and the displayed number exceeds their patience level. Analysis of a queueing model in [
23] was implemented via the use of matrix analytic methods. Systems with a visible queue were also previously considered, e.g., in [
24,
25]. In [
24], an empirical study of queue abandonment by the patients in an emergency department of a hospital is implemented by the methods of econometrics. In [
25], the queueing/inventory model with a visible queue was analyzed via the use of matrix analytic methods.
The model suggests the impatience of customers waiting in the buffer. Abandonment or balking means the refusal of a customer from joining the queue due to it being inappropriate for him/her in length. Another possible reason for customer loss is his/her impatience or reneging. Initially, a customer joins the queue. However, if his/her waiting time exceeds some critical (deterministic or random) level, the customer departs from the system. The phenomenon of impatience is important and received quite a lot of attention in the literature; for more references, see, e.g., [
26,
27,
28]. In [
27], in particular, the problem of wasting time by the server because the arriving customer decides to join a queue and receives a ticket but then departs from the system without canceling the ticket is considered. In [
29], the authors analyzed the model in which customers’ patience is exponentially distributed, and the system’s waiting capacity is unlimited. Such a model is both rich and analyzable enough to provide information that is practically important for call center managers. The distinguishing feature of the paper [
30] is that service time distributions in the considered multi-server queueing model are generally distributed. A simple and insightful solution is presented for the loss probability. The solution offered in [
30] is exact for exponential services and is an excellent heuristic for general service times. In [
31], a single server variant of the model from [
30] is under study. In [
32], the customer’s loss probability in
queue with impatient customers is expressed in a simple formula involving the waiting time probabilities in the
queue with patient customers. In that paper, a probabilistic derivation of this formula is given, and possible use of this general formula in the
retrial queue with impatient customers is outlined. In [
33,
34,
35,
36,
37,
38,
39], the retrial models with impatient customers are also considered. The model considered in [
40] assumes that the multi-server queue operates under the influence of the random environment, and the impatience rate depends on the current state of the random environment. In [
41,
42,
43], multi-server queues with the
or marked
arrival flows and impatient customers as the models of call centers were analyzed via the matrix analytic methods.
The remainder of the text of this paper consists of the following. In
Section 2, the mathematical model is completely described. In
Section 3, the process describing the dynamics of the system is defined as the continuous-time multi-dimensional Markov chain with level-dependent transitions. The generator of this chain is given.
Section 4 contains the ergodicity and non-ergodicity conditions for this Markov chain in the transparent form.
Section 5 briefly touches on the question of computation of the stationary distribution of the Markov chain. In
Section 6, expressions for computation of the key performance indicators of the system in terms of the computed stationary probabilities of the system states are presented.
Section 7 contains the results of the numerical experiment, the aim of which is to give insights into the shape of dependencies of the performance indicators on the number of servers and assistants. It is worth noting that the numerical realization of the elaborated paper algorithm results, are implemented not for a toy example with a small number of servers and assistants but for the system with realistic numbers of
s and assistants.
Section 8 concludes the paper.
2. Mathematical Model
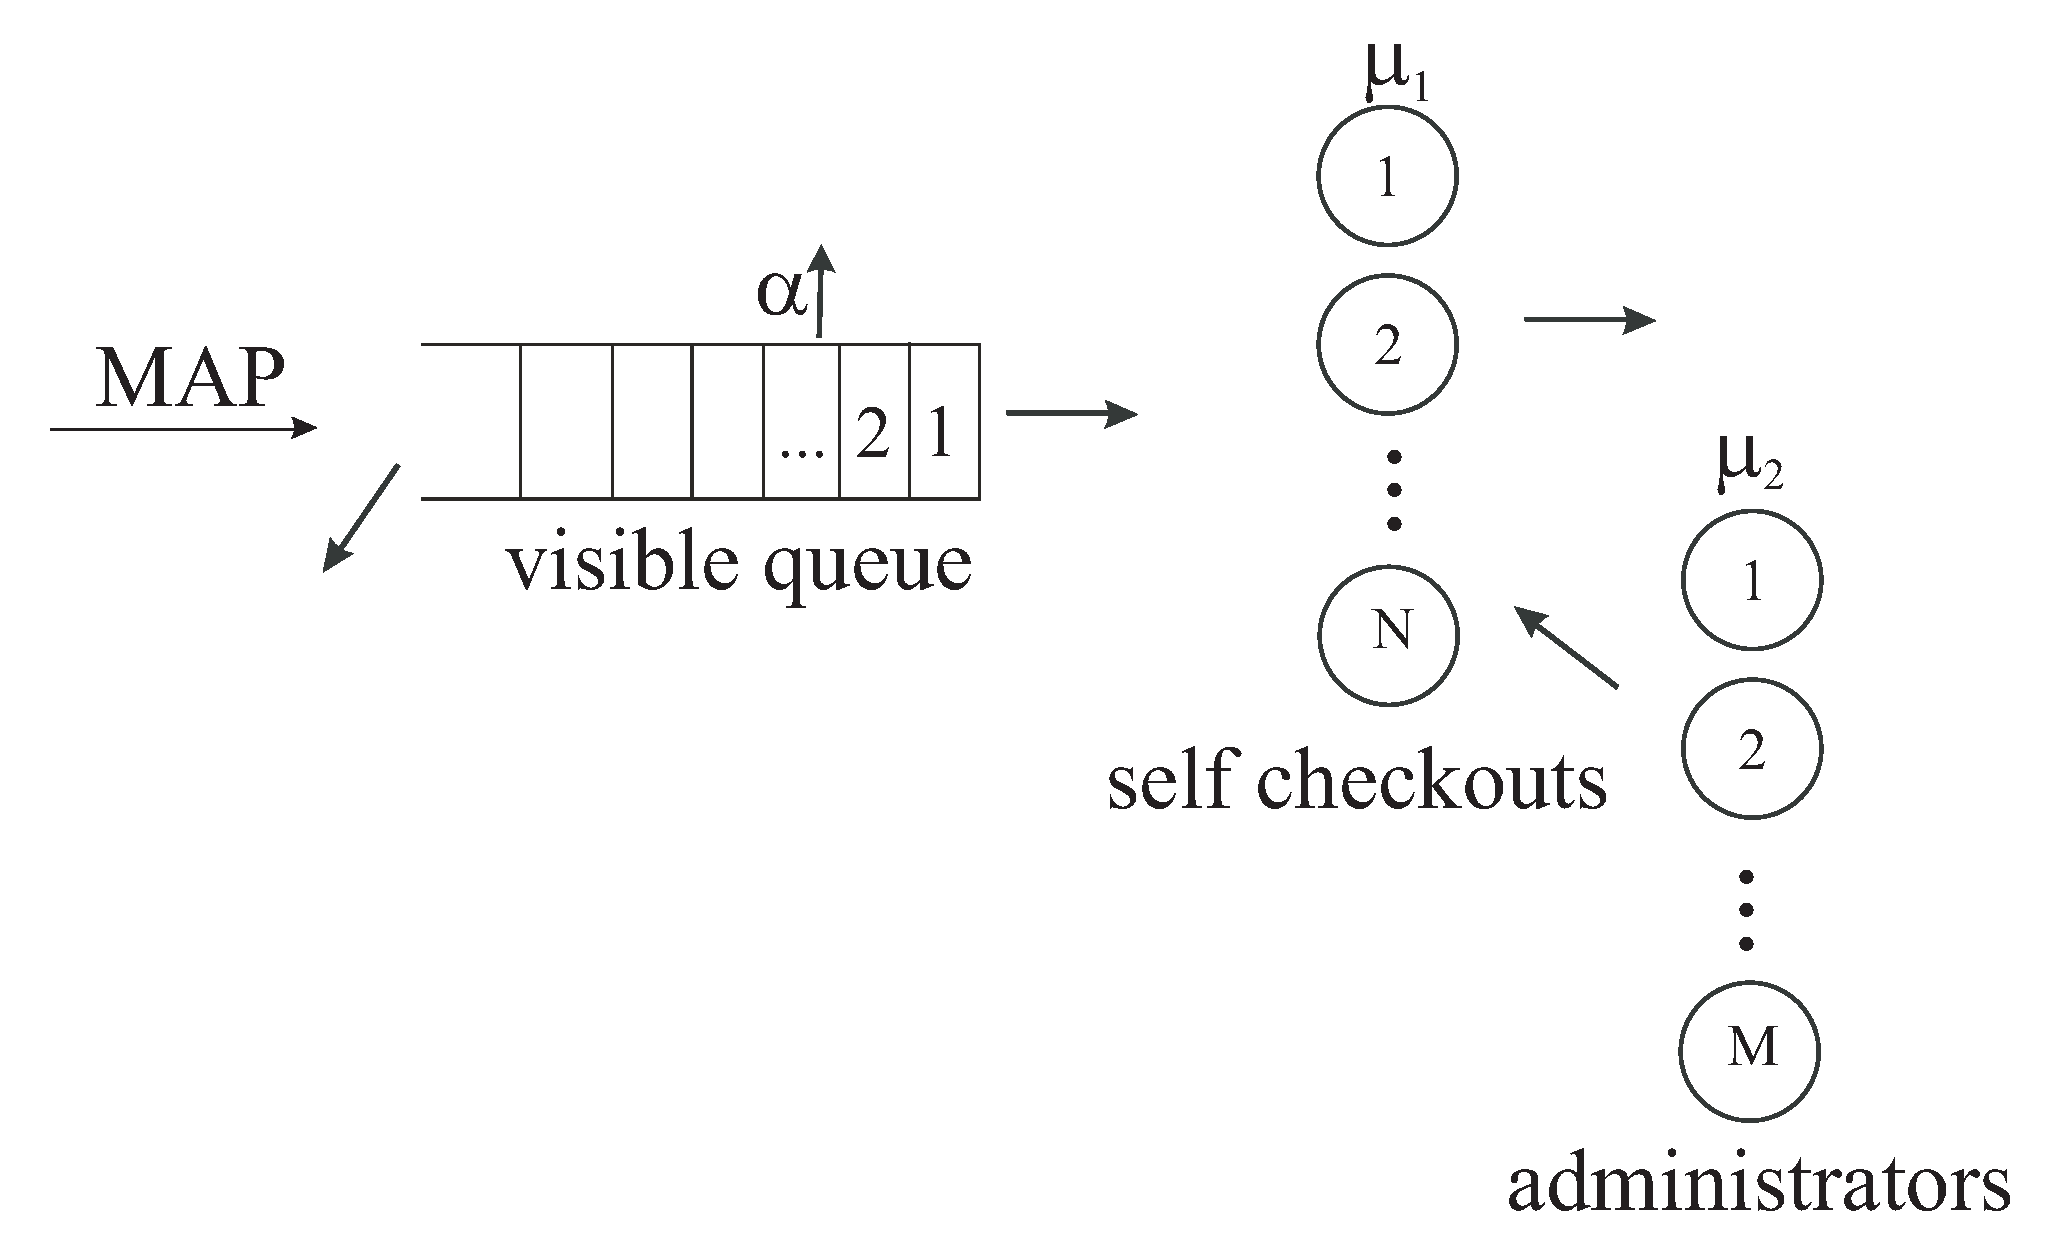
We consider a multi-server queueing system with an infinite buffer having two types of servers. The structure of the system is presented in
Figure 1.
The servers of the first type correspond to self-checkouts (self-service devices). The total number of such servers is equal to The servers of the second type correspond to administrators (assistants). The total number of assistants is equal to If a customer is accepted for service, he/she firstly occupies one first-type server for service during an exponentially distributed time with the parameter . After this time expires, with a probability of , the customer successfully finishes service and departs from the system. With the complementary probability, the customer meets a problem with service and requires some kind of help from an administrator. If at this moment, there is a free administrator, this administrator provides help to the customer to resolve the problem during an exponentially distributed with the parameter time. After that, the customer continues his/her service during an exponentially distributed time with the parameter . The number of moments during service when a customer asks the help of an administrator (not necessarily the same as in the previous moments) is unlimited. If the help of an administrator is required while there is no free administrator, the customer suspends their service and waits until any administrator will become available.
The process of customers’ arrival to the system is the generalization of the Markovian arrival process (
), see, e.g., [
15,
16,
17,
18], described below. Arrivals in the classical
are governed by the underlying Markov chain
with the state space
The generator
D of this chain is represented in the additive form
, where the components of the matrix
define intensities of transitions of the chain that are accompanied by the customer’s arrival. The non-diagonal components of the matrix
define the intensities of transitions of the chain that are not accompanied by the customer’s arrival. The diagonal components are negative. The moduli of these components define the rates of the exit from the corresponding state of the Markov chain.
In contrast to a classical
we assume that the transition intensities of the underlying process
additionally depend on the parameter
which defines the so-called current rating of the system. If the rating of the system is
then the
is characterized by the square matrices
and
of size
The average arrival rate of the
when the rating of the system is
r is denoted as
, which can be found as
where
is an invariant vector of the
defined by the matrices
and
, and
We do not specify the concrete form of the matrices
and
We only suggest that the increase in the rating cannot imply the decrease in the average arrival rate, i.e., we require that the following inequalities hold true:
The rating of the system can be dynamically changed during the system operation. We assume that if a customer is admitted to the system without waiting in the queue, its current rating immediately increases by one with the fixed small probability For example, if we fix the service of 1000 customers without waiting in the queue leads, on average, to the increase in the rating by one. If a customer abandons the system without service, the current rating decreases by one with the probability For example, if we fix , the loss of 100 customers leads, on average, to the decrease in the current rating by one. At the moment of the change of the rating, transition intensities of the underlying process immediately adjust their values to the new rating.
The queue is assumed to be visible. This means that an arriving customer can observe the number of customers in the queue and leave the system without service if he/she considers this number inappropriate. We assume that if during an arbitrary customer arrival epoch there is no free server and the number of customers in the buffer is the customer permanently leaves the system with the probability With the complementary probability, the customer joins the queue. We suggest that the limit exists, Additionally, we assume that customers can be impatient and leave the buffer and depart from the system, independently of each other, after an exponentially distributed with the parameter amount of time. In the case of the customers are patient.
Now, let us analyze the described queueing model.
3. Process of the System States
The behavior of the system under study can be described by the regular irreducible continuous-time Markov chain
where, during the epoch
is the number of customers in the system,
is the number of blocked (waiting for help from an assistant) servers,
is the current rating of the system,
is the state of the underlying process of the ,
Here and further, the notation means that the parameter n admits values from the set
To formally define the continuous-time Markov chain it is necessary to write down, for any pair of the states and the intensity of the transitions between these states.
To avoid bulky denotations, following the standard methodology of investigation of multi-dimensional Markov chains having one denumerable component, we enumerate the states of the Markov chain in the direct lexicographic order of the components and combine the set of the states with the value i of the component into the so-called level i,
Let be the matrix constituted by the transition intensities from level i to level j and let Q be the block matrix constituted by the blocks It is clear that the matrix Q is the infinitesimal generator of the Markov chain
Theorem 1. The generator Q of the Markov chain has the following block three-diagonal structure The non-zero blocks are defined as follows: where
⊗ indicates the symbol of the Kronecker product matrices, see [44]; where denotes the diagonal matrix with the diagonal entries listed in the brackets;
is the identity matrix having a size indicated in the suffix (if the size of the matrix is clear from the context, it can be omitted);
is a zero matrix having a size indicated in the suffix (if the size of the matrix is clear from the context, it can be omitted);
is a square matrix of size with all zero entries, except the entries which are equal to 1;
is a square matrix of size with all zero entries, except the entries which are equal to 1;
is a matrix of size with all zero entries, except the entries which are equal to 1;
is a matrix of size with all zero entries, except the entries which are equal to 1;
is a matrix of size with all zero entries, except the entries and , which are equal to 1;
is a matrix of size with all zero entries, except the entries and , which are equal to 1.
Proof. The proof of Theorem 1 is implemented via careful analysis of all possible transitions of the Markov chain and further combining the intensities of these transitions into the blocks of the generator.
The generator Q has all negative diagonal entries and non-negative non-diagonal entries. The diagonal entries of the generator Q define, up to the sign, the total intensity of leaving the corresponding state of the Markov chain In the case the Markov chain can leave the current state only if the underlying process of the arrival process makes a transition. The intensities of such transitions are defined as the modules of the diagonal entries of the matrix
In the case when the system is not idle, but the buffer is empty, the Markov chain can also change its state due to the finish of the service by a server or finish of help provided by an assistant. The intensities of such transitions are defined as the diagonal entries of the matrix
If the number of customers in the buffer is greater than zero, the Markov chain can also change its state due to the departure of some customers from the buffer due to impatience. The intensities of such transitions are defined as the diagonal entries of the matrix
The non-diagonal entries of the matrices define the intensities of transitions that do not lead to the change of the number of customers in the system i. Such transitions are the following:
(1) The underlying process of the arrival process transition, which does not imply the acceptance of a new customer to the system (the customer is not generated or lost). The intensities of such transitions are given as the non-diagonal entries of the matrix and the entries of the matrix for Note, that here the matrix defines the possible change of the system rating due to the loss of a customer;
(2) The number of blocked servers is increased by one. The intensities of such transitions are given as the entries of the matrix ;
(3) The number of blocked servers is decreased by one. The intensities of such transitions are given as the entries of the matrix .
The entries of the matrices define the intensities of transitions that lead to the increase in the number of customers i in the system by one. This can happen only in the case when the underlying arrival process makes a transition with the generation of a customer, and this customer is admitted to the system. The intensities of such transitions are given as the entries of the matrices in the case and the entries of the matrices if
The entries of the matrices define the intensities of transitions that lead to the decrease in the number of customers i in the system by one. This can happen if a customer leaves the system successfully serviced (the intensities of such transitions are given as the entries of the matrices ) and if a customer leaves the non-empty buffer due to impatience (the intensities of such transitions are given as the entries of the matrices ).
The blocks of the generator Q are zero matrices because the customers arrive and leave the system only one-by-one. □
4. Ergodicity Condition
An important step of analysis of any Markov chain with an infinite state space is establishing conditions for the ergodicity and non-ergodicity of this Markov chain (the stability condition). The ergodicity and non-ergodicity conditions for the Markov chain under study are given by the following Theorem.
Theorem 2. (a) If the impatience rate α is positive, the Markov chain is ergodic under all finite values of other parameters of the considered queueing system;
(b) If the limiting probability q is equal to 1, the Markov chain is ergodic under all finite values of other parameters of the considered queueing system;
(c) If the customers staying in the buffer are patient, i.e., , the Markov chain is ergodic if the following inequality is fulfilled: where are the probabilities that at an arbitrary moment when the system is overloaded, the number of assistants providing help to the servers is equal to
These probabilities are computed by the formula: (d) If the customers staying in the buffer are patient, i.e., , the Markov chain is non-ergodic if the following inequality is fulfilled: Proof. Let the generator of a Markov chain be the upper-Hessenbergian matrix, i.e., it has zero blocks below the first sub-diagonal and other blocks Let the matrix be the diagonal matrix, the diagonal entries of which also coincide with the modules of the diagonal entries of the matrix
If the following limits exist:
and the matrix
is stochastic; then the Markov chain belongs to the class of Asymptotically Quasi-Toeplitz Markov chains (
), see [
45].
The generator Q of the Markov chain describing the queueing system under study defined by Theorem 1 has the particular, with respect to the upper-Hessenbergian matrix, three-block diagonal structure.
If then it can be verified that for this Markov chain the matrices exist and are defined by:
If
then it can be verified that the matrices
exist and are defined by
where
and
T is the diagonal matrix the diagonal entries of which coincide with the modules of the diagonal entries of the matrix
Therefore, in both cases,
and
the limits
exist and it is easy to check that their sum is the stochastic matrix. This implies that the considered Markov chain belongs to the class of
The sufficient condition for the ergodicity of
see [
45], rewritten for the three-block diagonal generator is the fulfillment of the inequality:
where the vector
is the unique solution of equations
The sufficient condition for the non-ergodicity is the fulfillment of the inequality
Because for we have inequality (4) takes a trivial form: Thus, the chain is ergodic for all finite values of other parameters of the considered queueing system. Statement (a) of the theorem is proven.
Consider now the case
It can be verified that in this case system (4) and inequality (5) are equivalent to the system
and the inequality
It can be verified that
where
Using the so-called mixed product rule for Kronecker product of matrices, see [
44], it is possible to show that a solution of (6) has the representation
where the row vector
is a solution to the system
and the row vector
is a solution to the system
By the direct substitution into (9), it is possible to check that vector
defined by
is the solution of Equation (
9).
By the direct substitution into (10), it is possible to check that vector
is defined by
where probabilities
are given by Formula (2). Taking into account (8), (11), and (12) in (4), we obtain Formula (1).
It is clear that if inequality (1) is always true. This proves statement (b) of the theorem. Statement (c) is also proven. The proof of statement (d) is easily made analogously to the proof of (b). □
Remark 1. Inequality (1) is intuitively transparent. Usually, the ergodicity condition is equivalent to the requirement that in the situation when the system is very overloaded, the rate of customers admission is less than the rate of customers service. The left-hand side of (1) is the rate of customers’ admission to the system. As it is seen from (1), this rate here depends only on the arrival rate and does not depend on the rates This stems from the fact that the rating of the system, when it is very overloaded, is equal to 1 due to the abandonment (balking) of many customers. The right-hand side of (1) is the rate of customers’ departure from the service when the system is overloaded. The values are the probabilities that n assistants provide help to the servers and these servers do not serve customers. Correspondingly, the number of servers providing service with the rate is equal to It follows from the formula of total probability that the right-hand side of (1) indeed is the rate of customers’ departure from the service when the system is overloaded.
7. Numerical Example
The purpose of this example is to illustrate the dependencies of the main performance measures of the system on the number N of servers and the number M of assistants. Let us assume that the system can have up to 50 servers and up to 10 assistants. Thus, below we vary the parameter N over the interval and the parameter M over the interval with the same step 1.
We assume the following values of the parameters of the system:
The service intensity of an arbitrary customer by a server is
The probability p that a customer meets a problem with service and requires the help of an assistant is
The rate of help provided by an assistant is
The parameter R that defines the maximum possible rating of the system is
The probability of rating increasing is
The probability of rating decreasing is
The parameter describing the impatience rate of customers is equal to
The probabilities
that a customer will leave the system having
N servers during the arrival epoch when the number of customers in the buffer is
i, are defined as:
The MAP arrival flow of customers when the system has the rating
r is defined by the matrices
and
where the matrices
and
are defined by
The base arrival flow has the average intensity the coefficient of correlation of successive inter-arrival times and the coefficient of variation of inter-arrival times
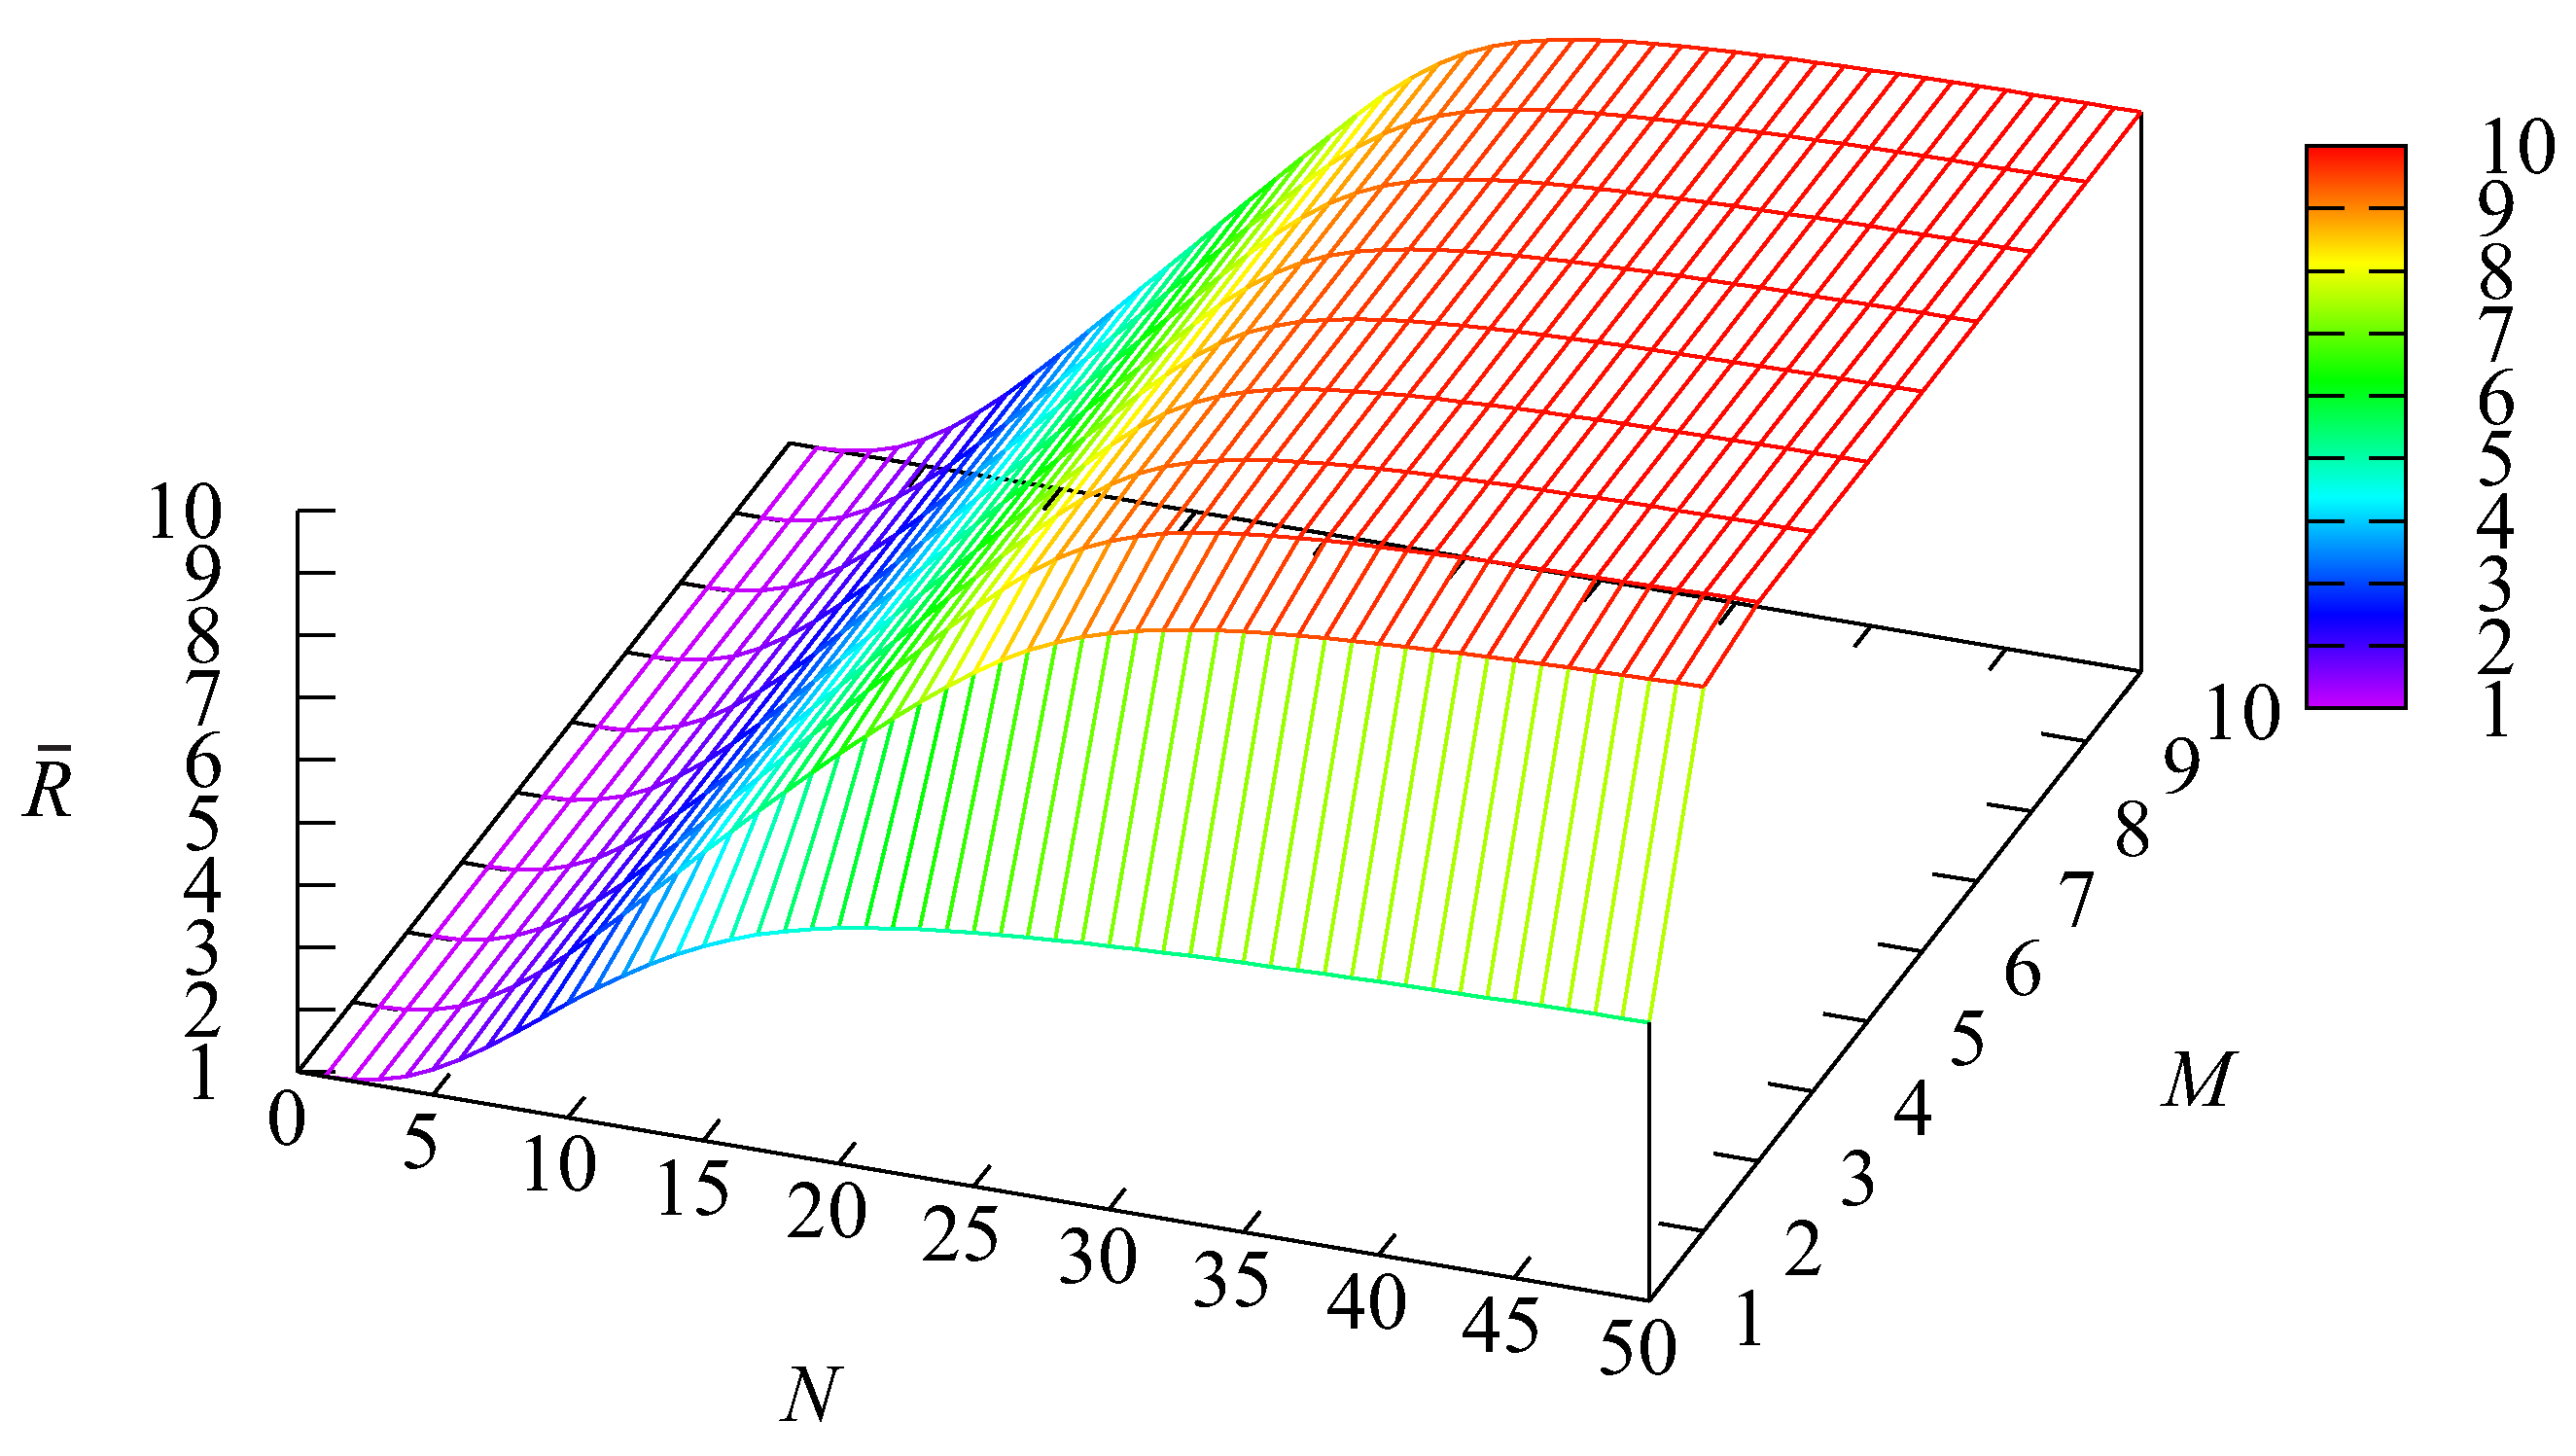
The dependence of the average rating of the system
on the parameters
N and
M is presented in
Figure 2.
As is seen in
Figure 2, the average rating increases with the increase in the number of servers and assistants. Here, we do not consider the situations when
It is evident that in such a situation, adding a new assistant does not improve the system performance, and the rating is not changed. In other cases, adding new servers and (or) assistants leads to a better quality of customer service. As the result, the average rating increases.
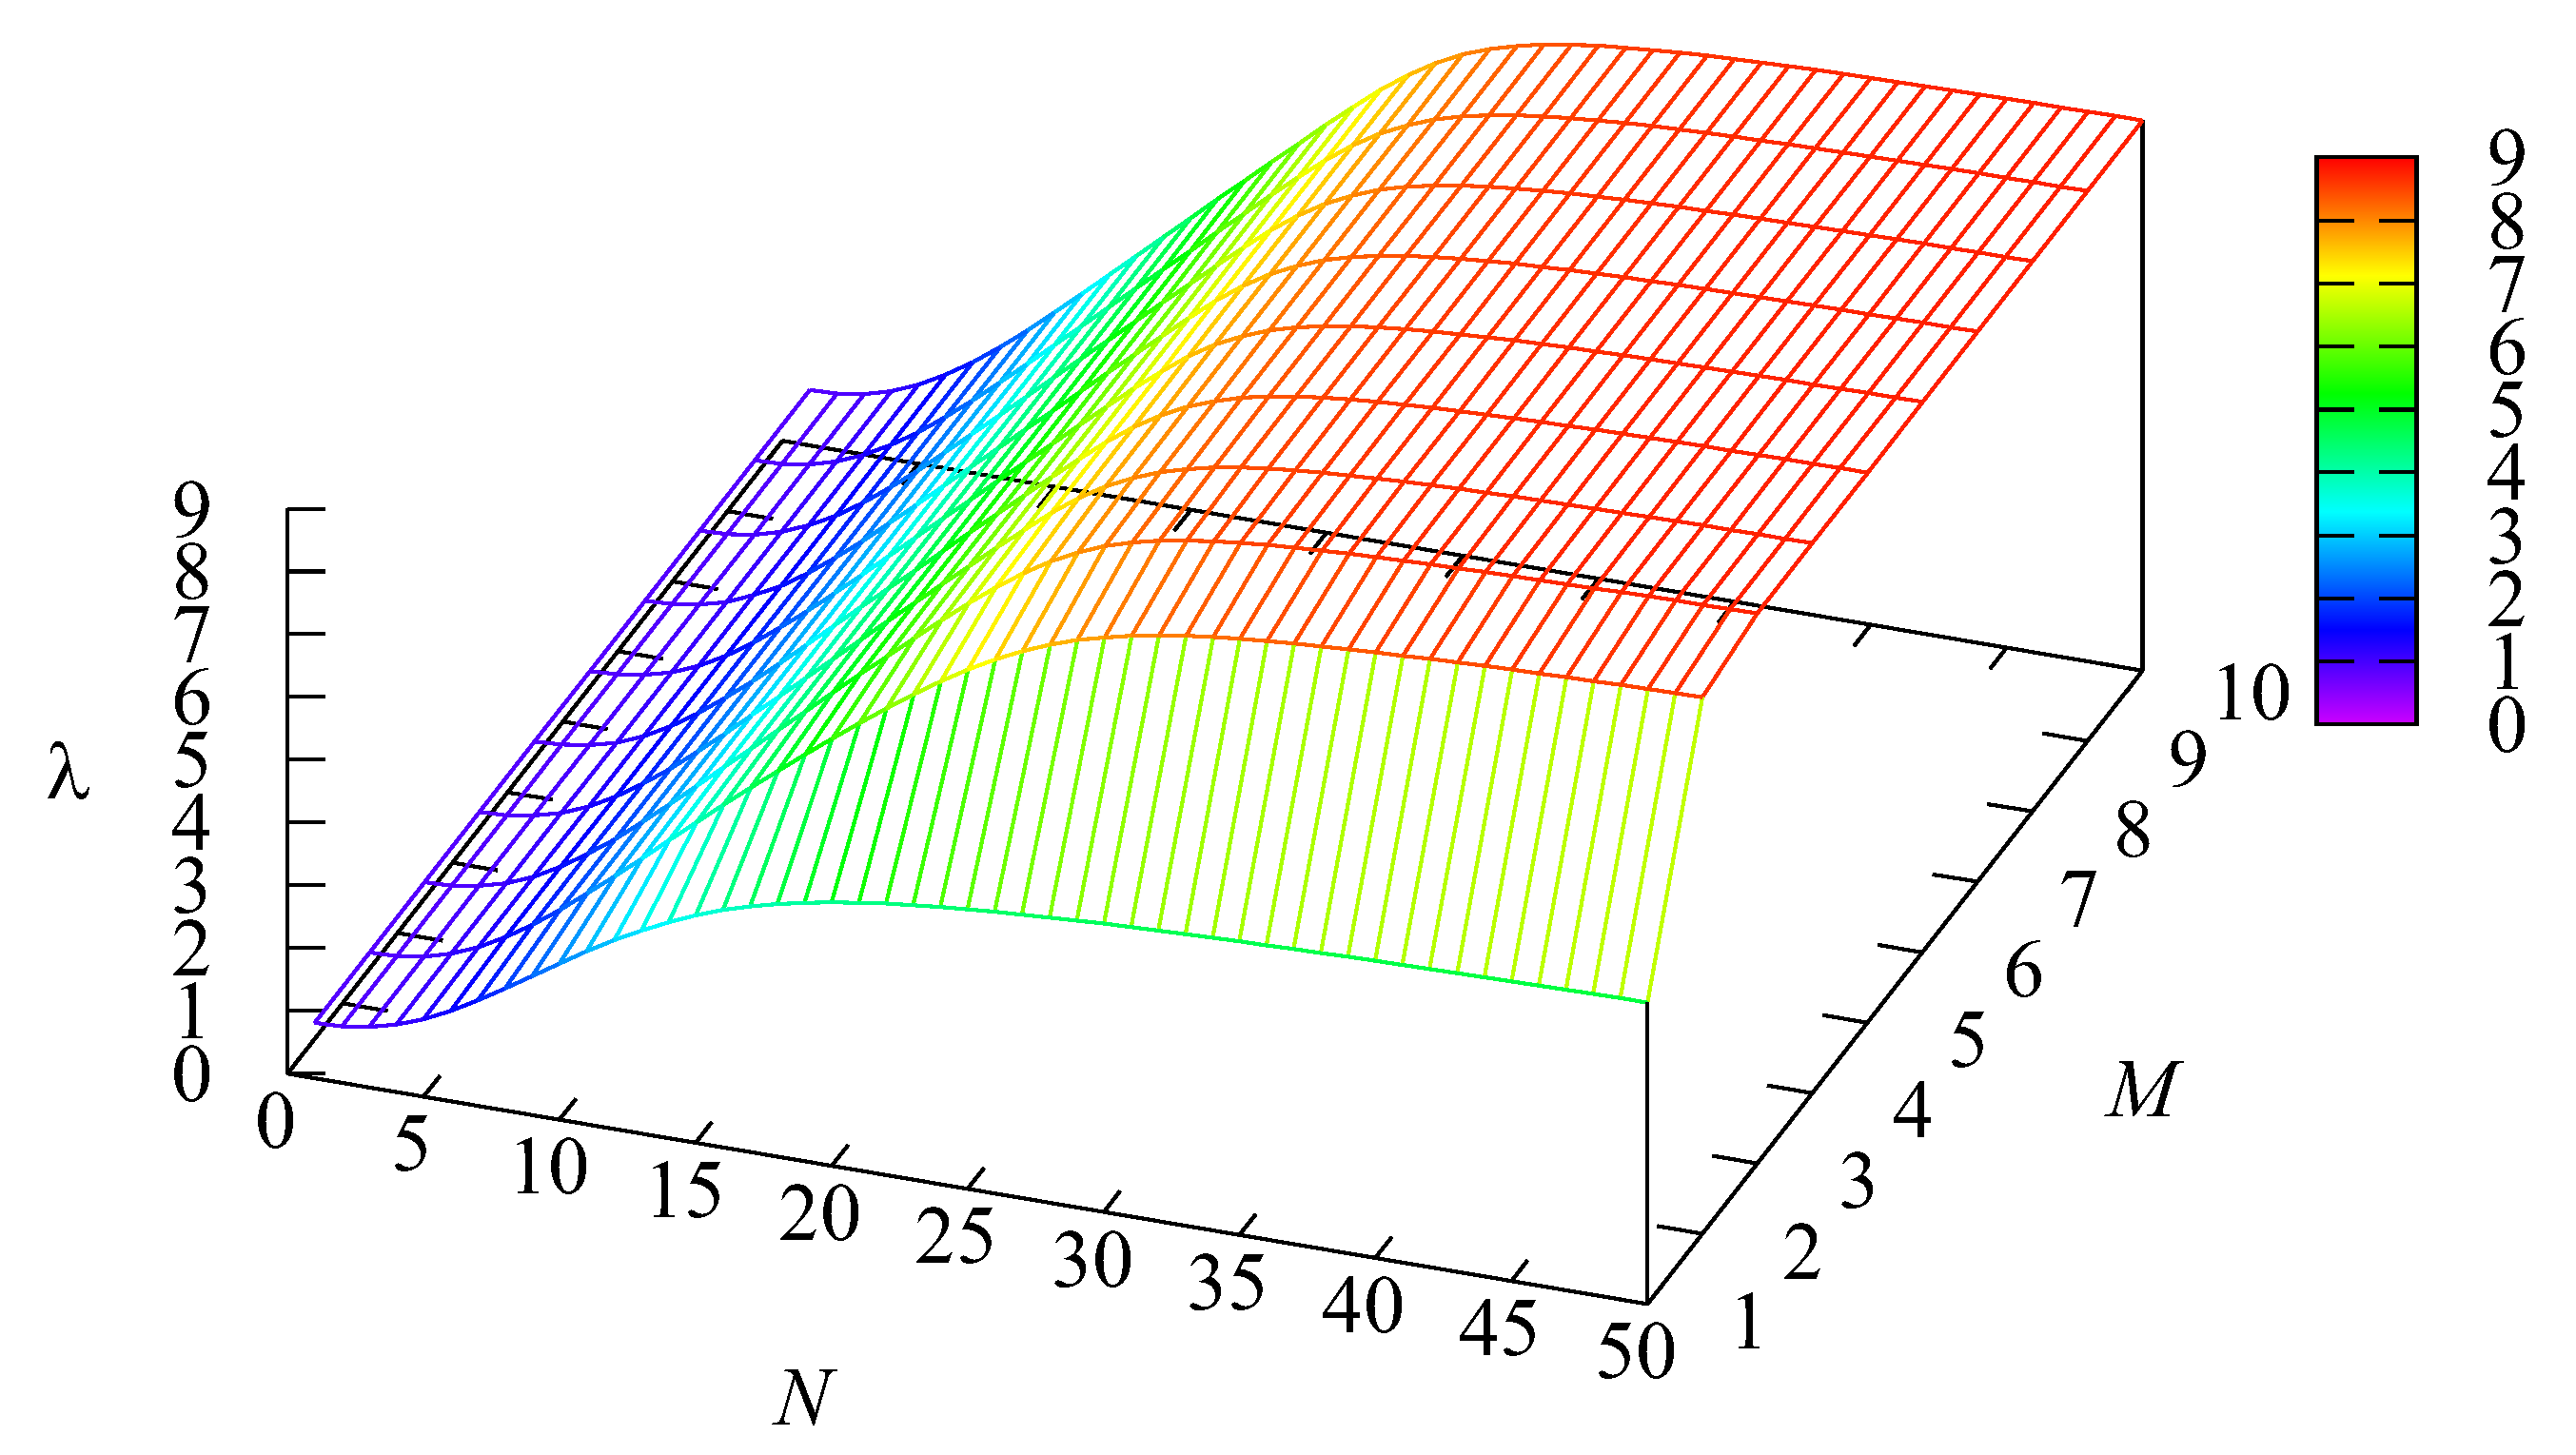
Figure 3 illustrates the dependence of the average customer’s arrival rate
on the parameters
N and
M.
The average arrival rate of customers also increases with the increase in the number of servers and (or) assistants. This is explained by the evident fact that a higher rating of the system leads to a higher arrival rate.
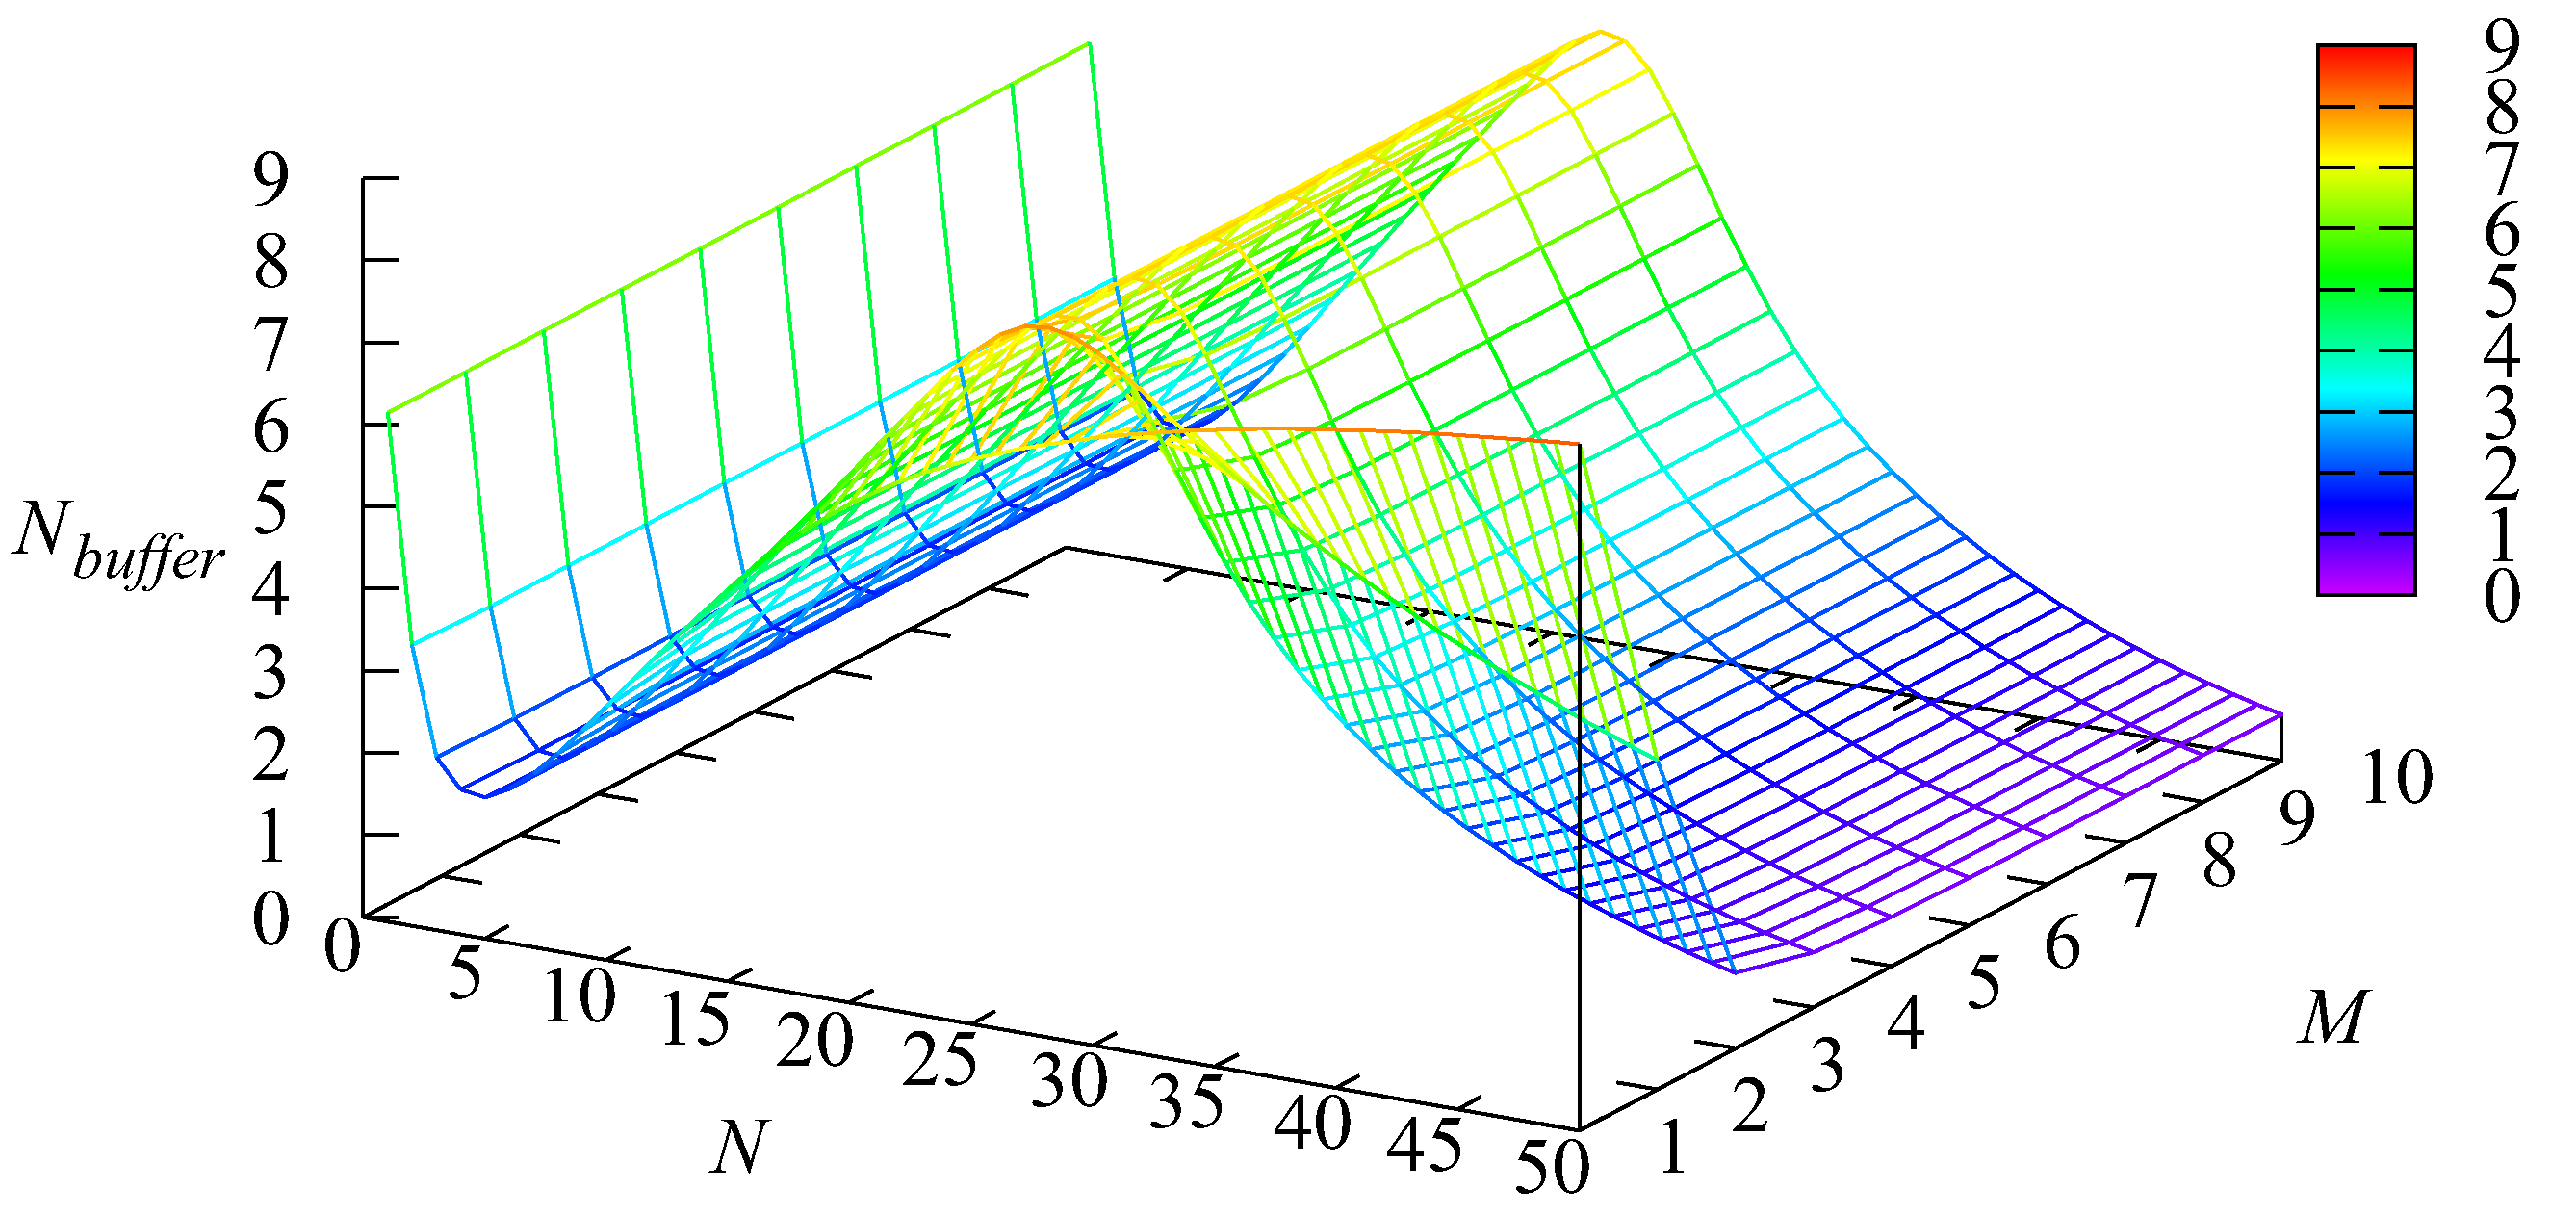
The dependence of the average number
of customers in the buffer on the parameters
N and
M is presented in
Figure 4.
The dependence of the average number of customers in the buffer on the parameters N and M is complicated and hardly predictable intuitively. On the one hand, as for a classical system, the increase in the number of servers leads to a decrease in the waiting time. However, for the considered system, the increase in the number of servers leads to an increase in the arrival rate that may imply an increase in the waiting time. As one can see from the figure, sometimes the first factor prevails over the second one, and the average number of customers in the buffer decreases with the growth of N and M; sometimes the situation changes oppositely.
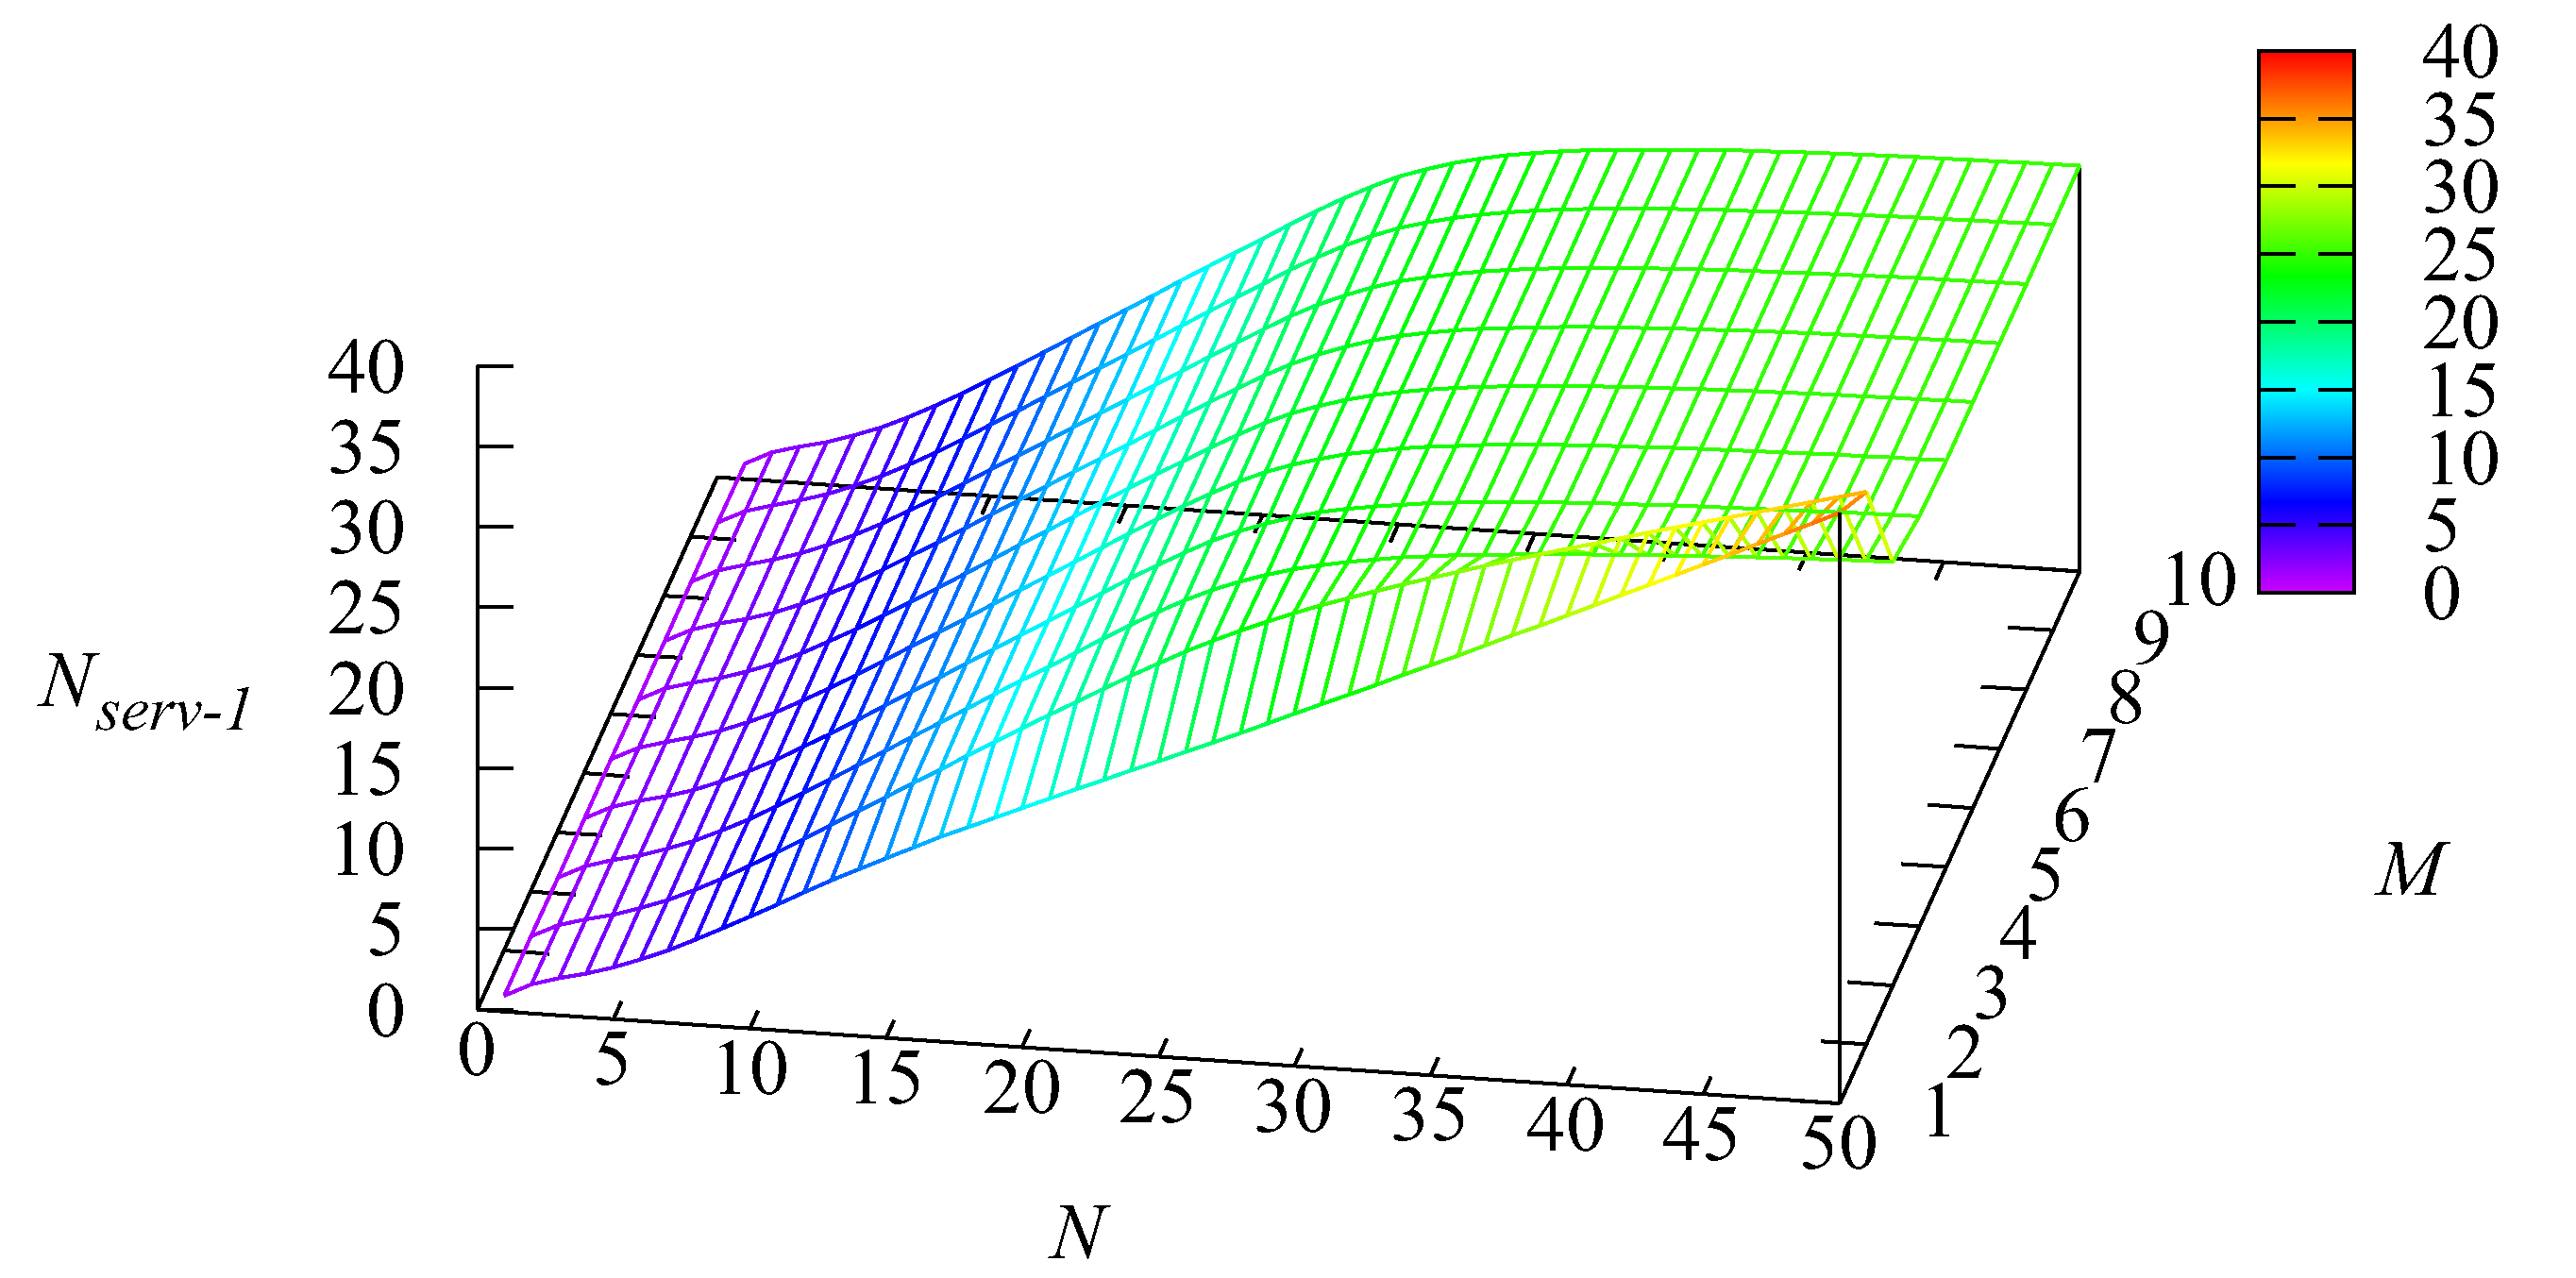
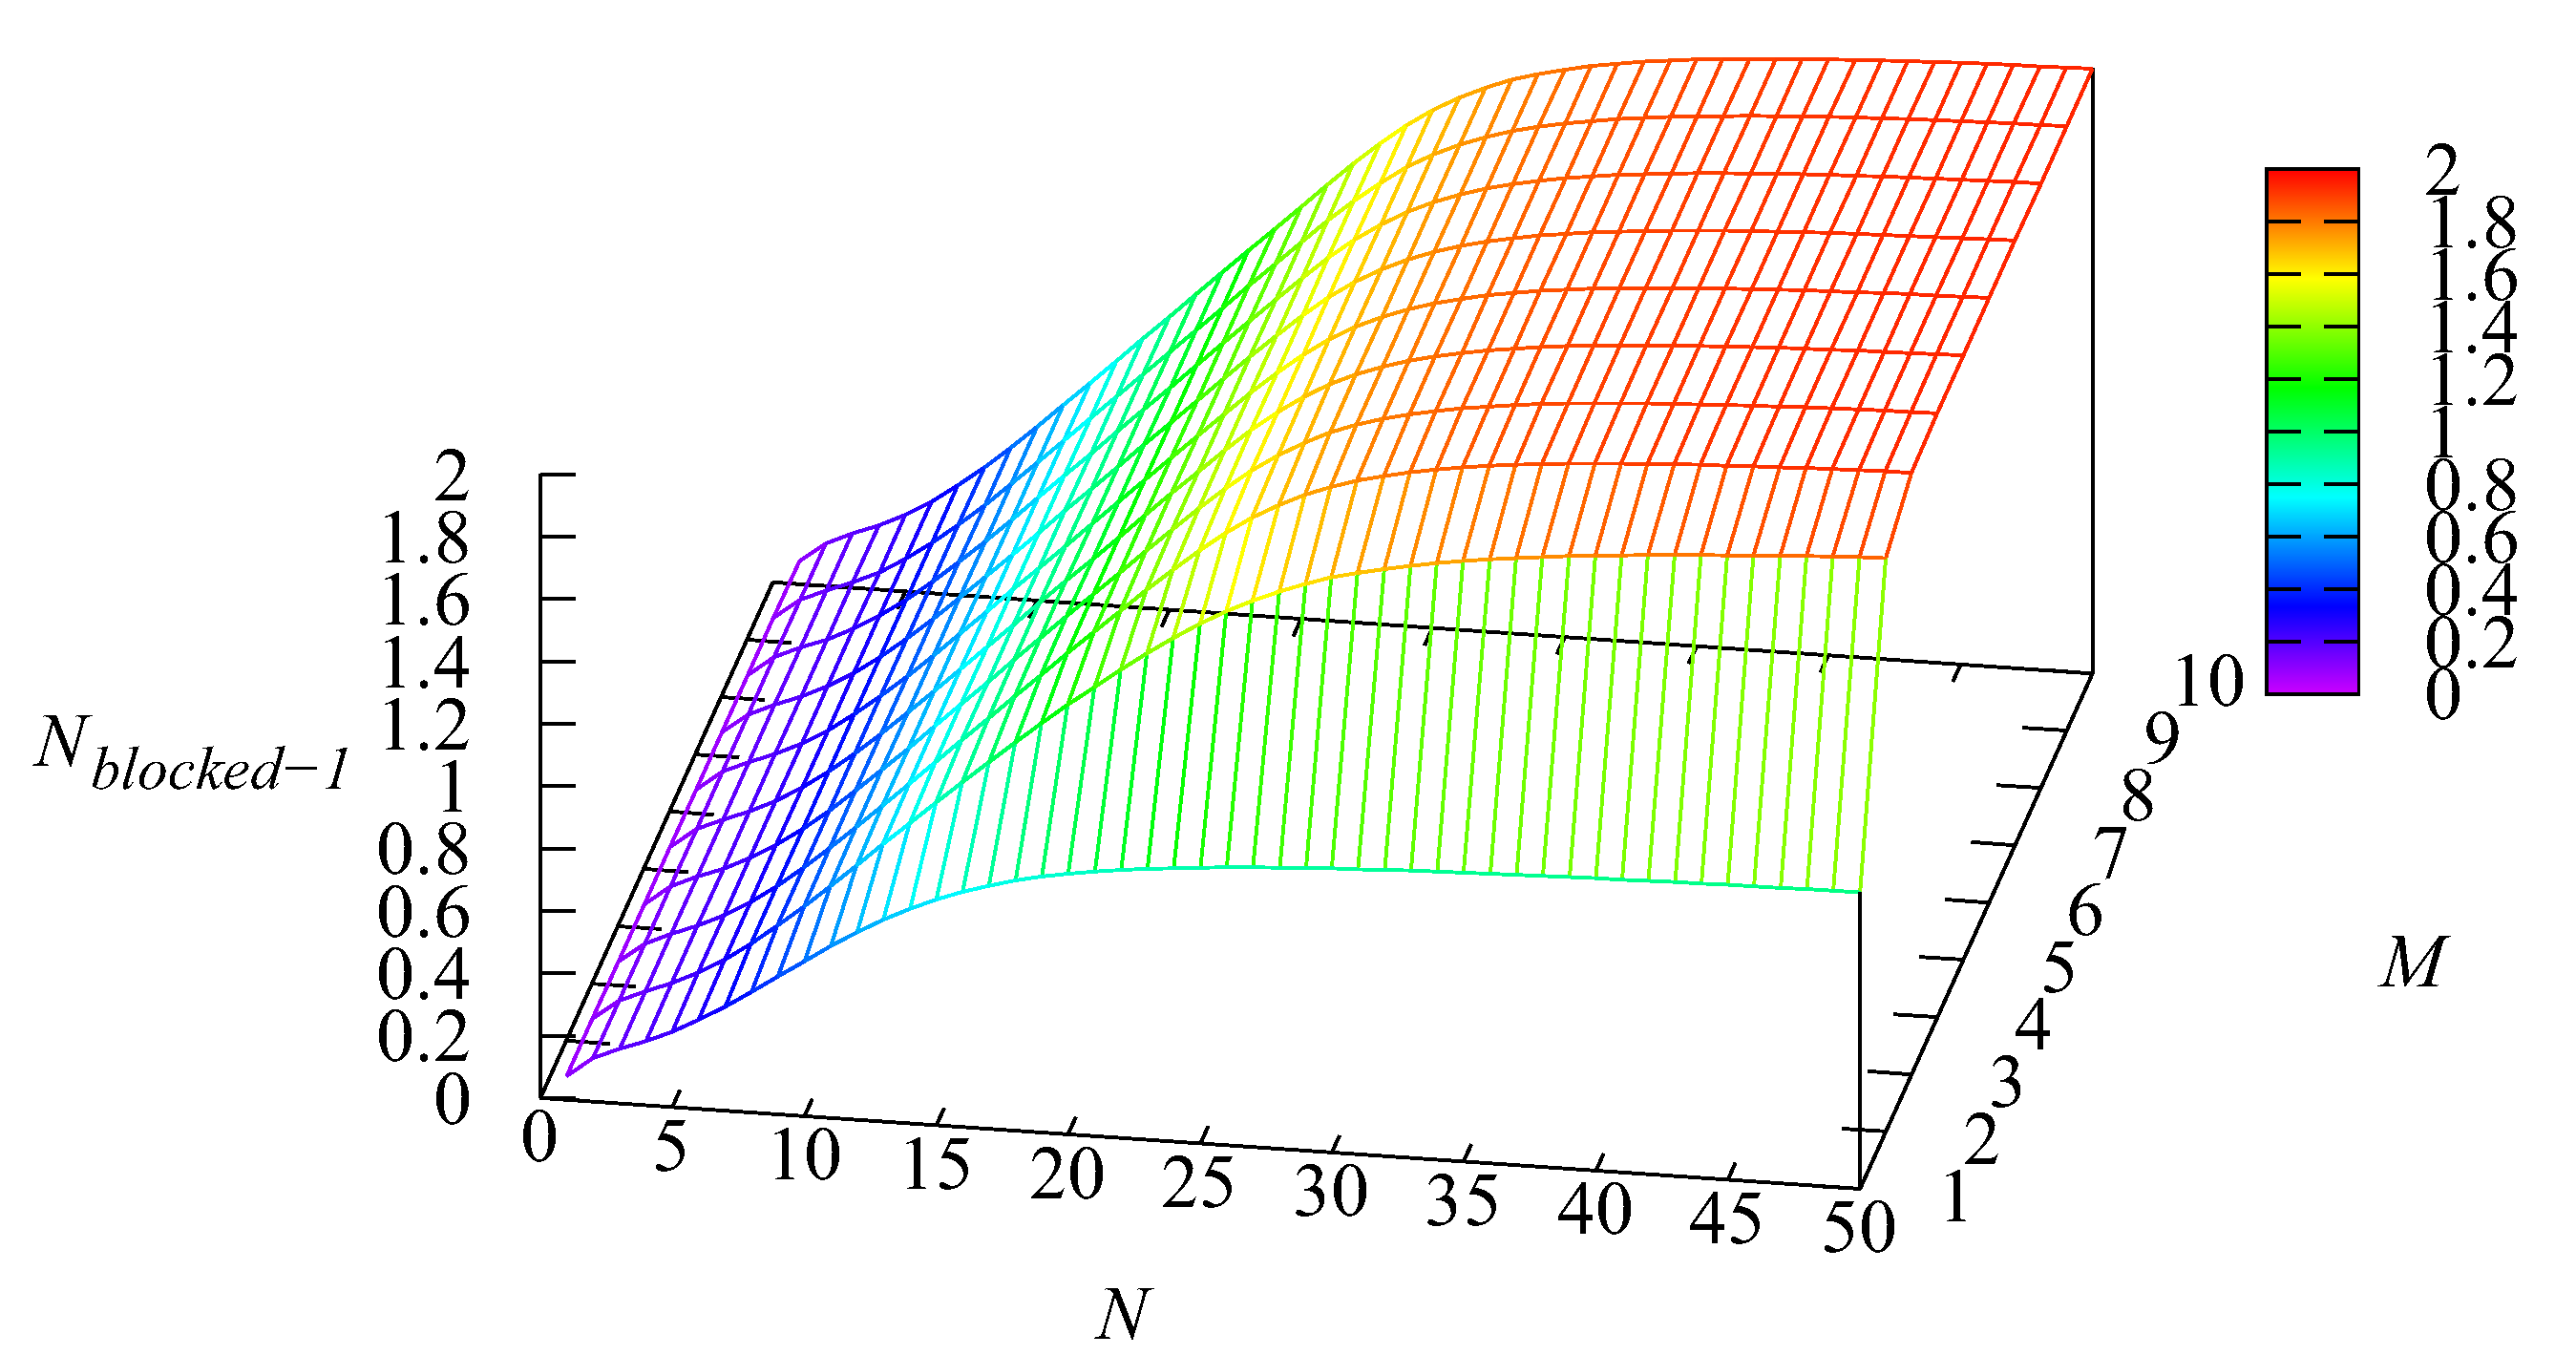
Figure 5,
Figure 6 and
Figure 7 illustrate the dependencies of the average number
of occupied servers, the average number
of blocked servers that are under unblocking by an assistant, and the average number
of blocked servers that are waiting until an assistant will become available on the parameters
N and
M.
The average number of occupied servers essentially increases with the increase in the total number of servers When the number of assistants M increases, the average number of blocked servers decreases if the average arrival rate is constant. Thus, the increase in the number of assistants M may lead to the decrease in the number of busy servers. However, with an increasing value of M, the rating and the intensity of the arrival flow can also increase, which may cause an increase in the number of busy servers. Therefore, the dependence of the number on the parameter M is hardly predictable.
The average number of blocked servers currently receiving the help of assistants increases with the growth of N and M. This growth is mainly caused by the increase in the average arrival rate. In the considered example, the average number of blocked servers that are waiting until an assistant will become available grows when the number of servers N grows and decreases with the increasing value of
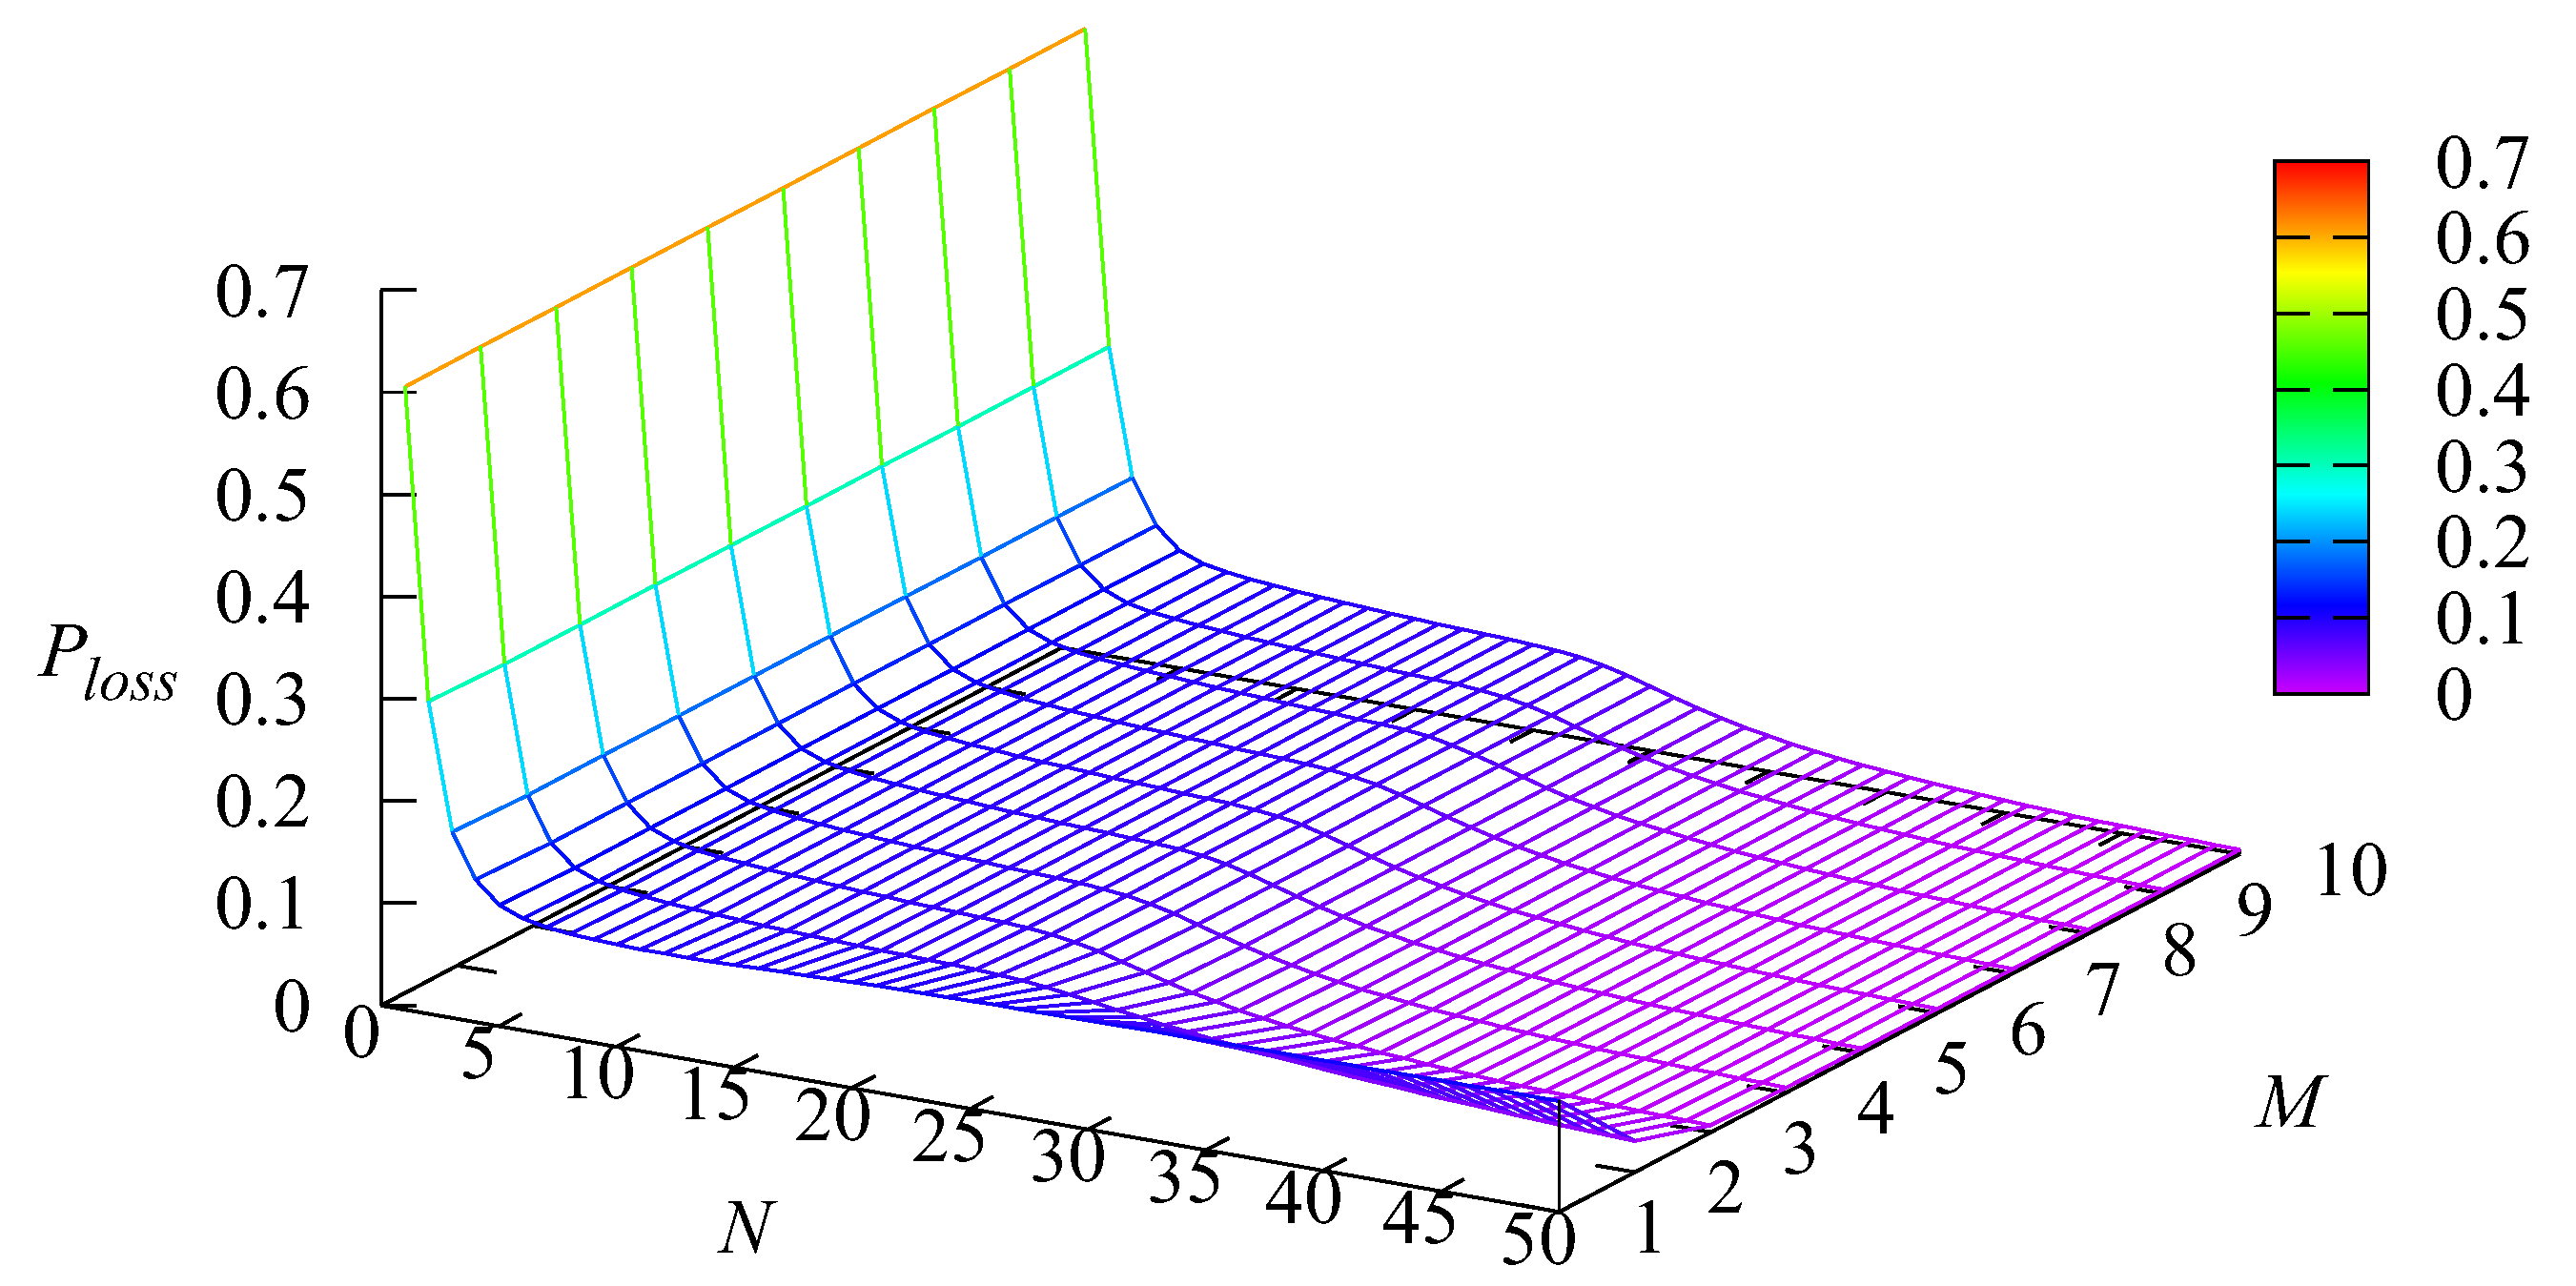
The dependence of the loss probability
of an arbitrary customer at the entrance to the system due to the unwillingness to wait in a long queue on the parameters
N and
M is presented in
Figure 8.
As it is seen from
Figure 8, the loss probability of an arbitrary customer at the entrance to the system decreases when the number
N of servers grows. The dependence of
on
M is less essential, and
may decrease or increase with the growth of
M.
The dependence of the loss probability
of an arbitrary customer due to impatience on the parameters
N and
M is presented in
Figure 9.
The behavior of the dependence of the loss probability
of an arbitrary customer due to impatience on the parameters
N and
M is also complicated. Note that the loss probability
essentially depends on the average number of customers in the buffer (see
Figure 4) and the average arrival rate
(see
Figure 3).
The dependence of the loss probability
of an arbitrary customer on the parameters
N and
M is presented in
Figure 10.
The loss probability is the sum of loss probabilities and Because in the considered case, the main losses occur due to customers’ impatience, the behavior of is similar to the behavior of the probability
We considered the dependencies of the main performance measures on the number of servers
N and the number of assistants
M and can conclude that these dependencies can be quite hardly predictable. Therefore, mathematical modeling with the use of the results presented in this paper is required for the exact estimation of the system performance characteristics. It is worth noting that, from the point of view of potential practical applications, the more important problem is to define the optimal number
N of servers and the number
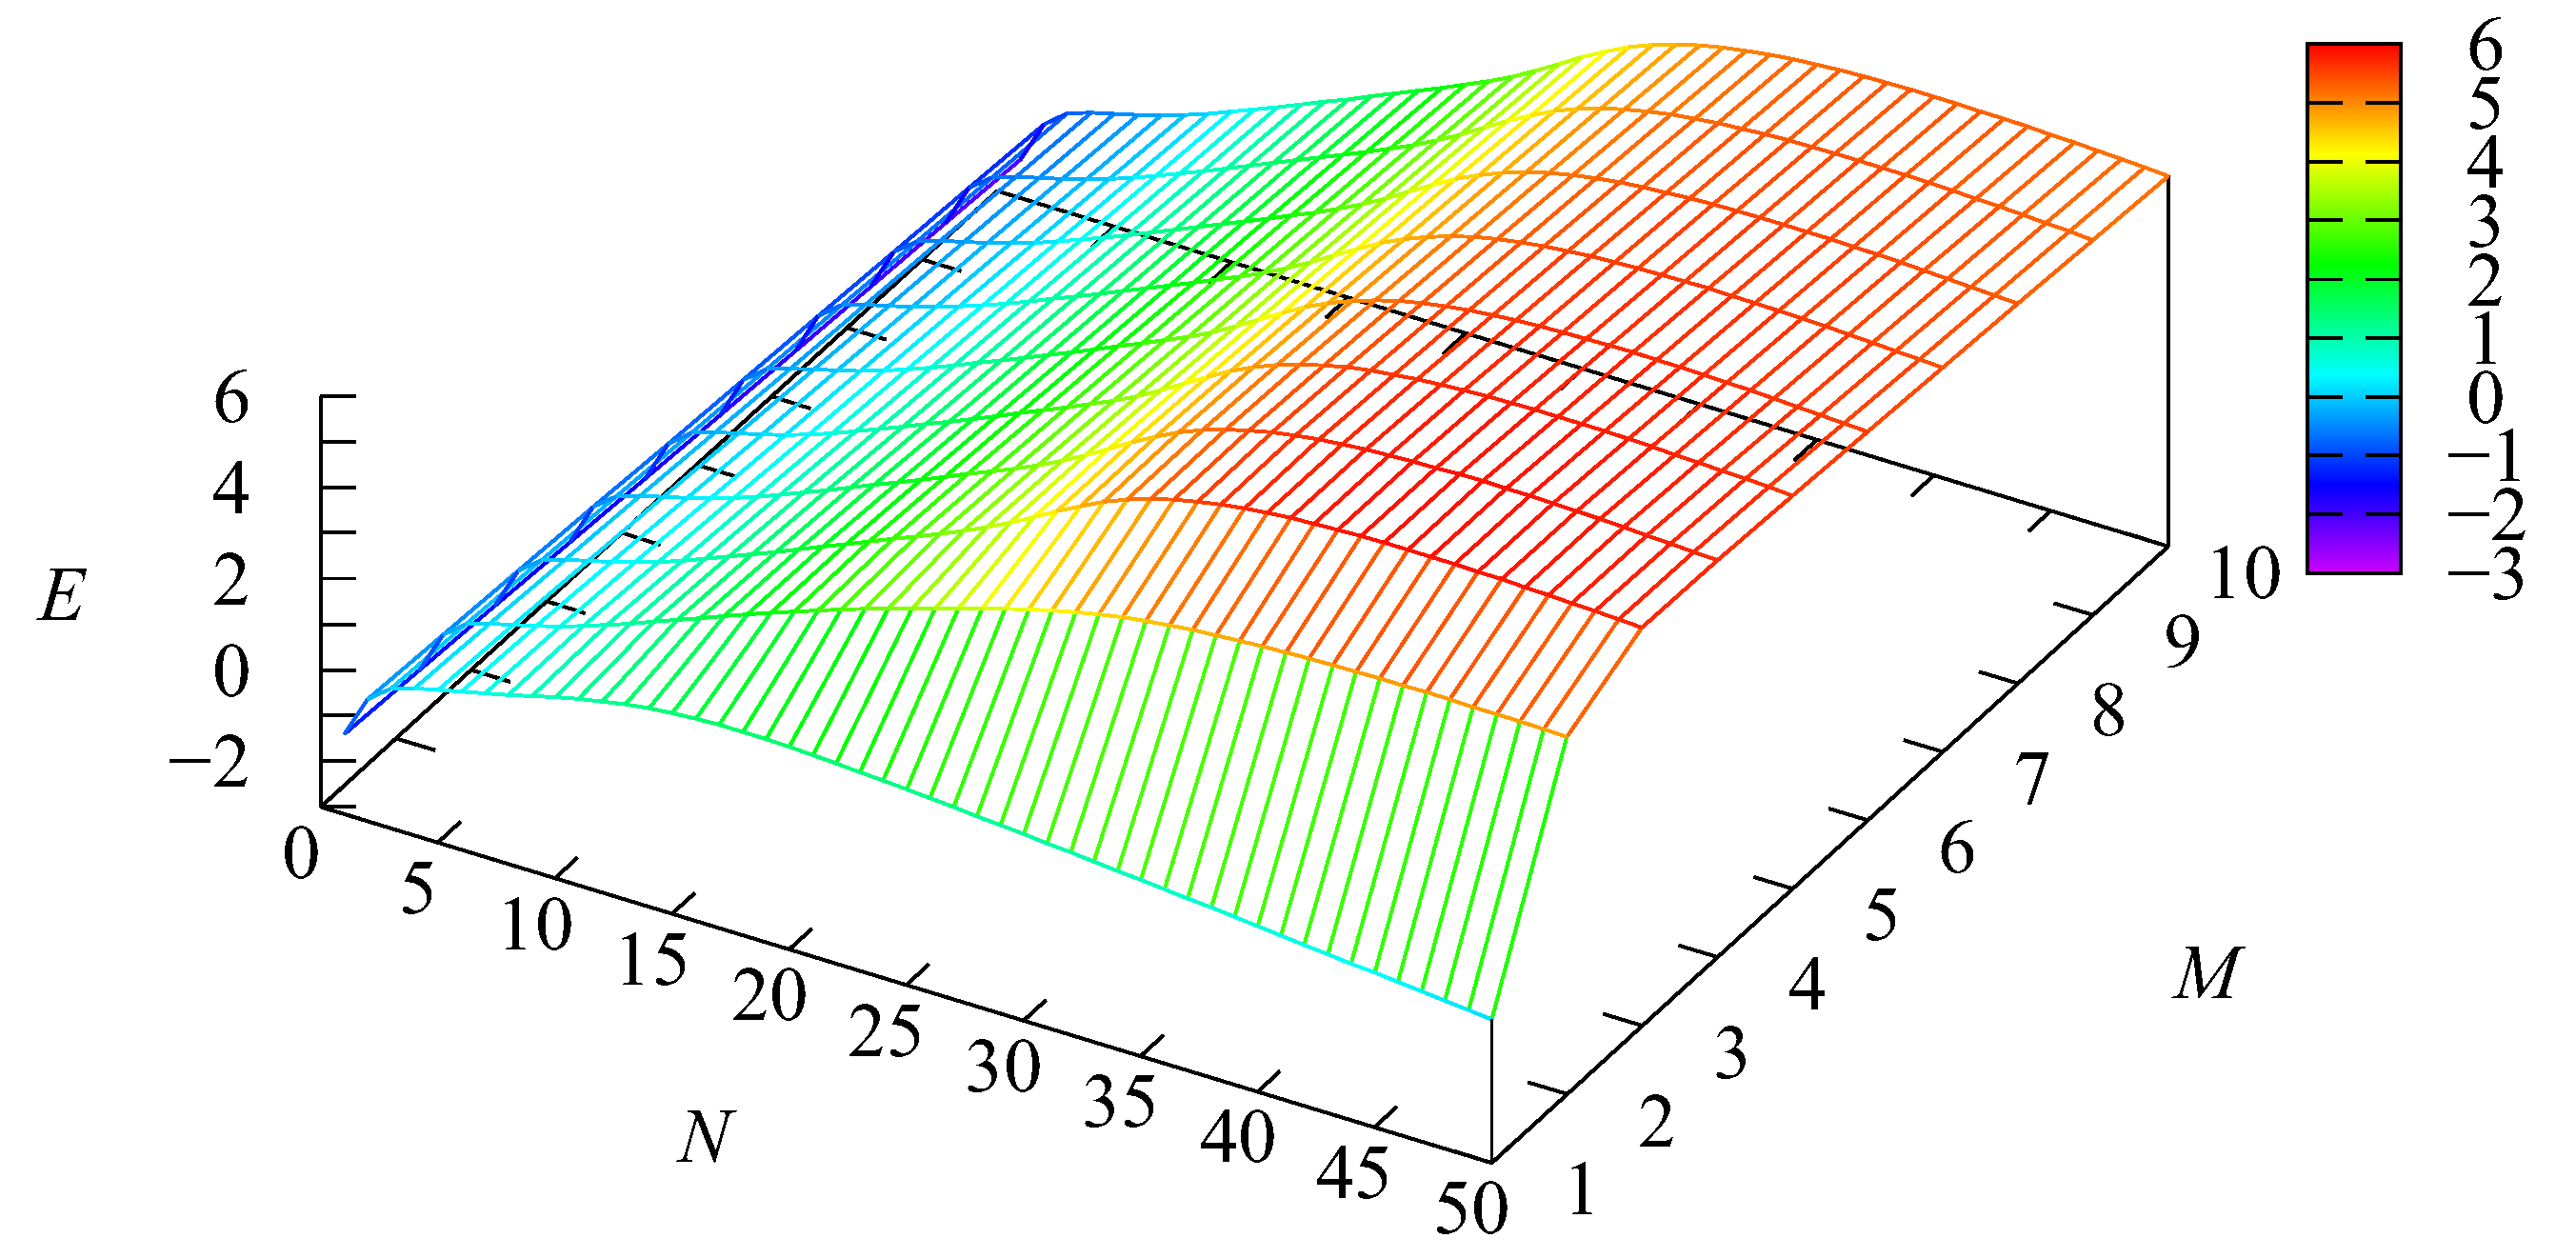
M of assistants. To find these optimal values, first of all, it is necessary to choose an appropriate cost criterion. In this paper, we assume that the quality of the system operation is characterized by the following economic criterion:
Here, the cost coefficients , and have the following meaning:
is the profit obtained by the system for the successful service of one customer;
and are the charges paid by the system for the loss of a customer at the entrance of the system and due to impatience, correspondingly;
and are the charges paid by the system for maintaining one server and one assistant per unit time, correspondingly;
Thus, the economic criterion E has the meaning of the average profit obtained by the system per unit of time.
In this numerical example, we fix the following cost coefficients:
We aim to maximize the average profit of the system.
Figure 11 illustrates the dependence of the economic criterion
E on the parameters
N and
As is seen from
Figure 11, the profit of the system essentially increases when the number of the exploited servers grows from 1 to about 30. When the number of servers grows from 30 to 40, the profit still increases, but not so essentially. A further increase in the number of servers
N leads to a slight decrease in the system profit because the cost of adding a new server exceeds the obtained additional profit from the service of customers. The same situation occurs when the number
M of assistants grows. Thus, it can be verified that in the considered example, the optimal value
of the economic criterion
E is
This optimal value is achieved when the number of servers is
, and the number of assistants is
It is worth noting that the maximal size of the blocks of the generator is defined by the number One of the goals of this numerical experiment was to demonstrate the feasibility of the elaborated algorithms for more or less realistic values of the number N of SSDs and the number M of assistants. In this experiment, we have fixed and and the range of rating as the set , which is quite enough for the modeling of even a quite large real hypermarket. Therefore, the maximal size of the block in this example is 510 W. Because the total number of points for which computations were performed to show the shape of the considered dependencies and solve the optimization problem is we restricted ourselves by the base of order 2, just to avoid long computations. For the maximal size of the block is more than 1000, and computation for 500 points takes several minutes. The increase in W does not create any essential problem in computations except the increase in computation time with the increase in Note that the use of the of order 2 is often enough for good matching the main characteristics of the flow to the corresponding characteristics of even quite bursty real flows.


