
Dimensionality Analysis of Entrepreneurial Resilience amid the COVID-19 Pandemic: Comparative Models with Confirmatory Factor Analysis and Structural Equation Modeling


Abstract
:1. Introduction
2. Literature Review
The Dimensionality of Entrepreneurial Resilience: Limitations in Previous Studies
3. Methodology
3.1. Sampling and Methods
3.2. Data Analysis Techniques
4. Results and Discussion
4.1. Demographics and Profiles of the Targeted Entrepreneurs
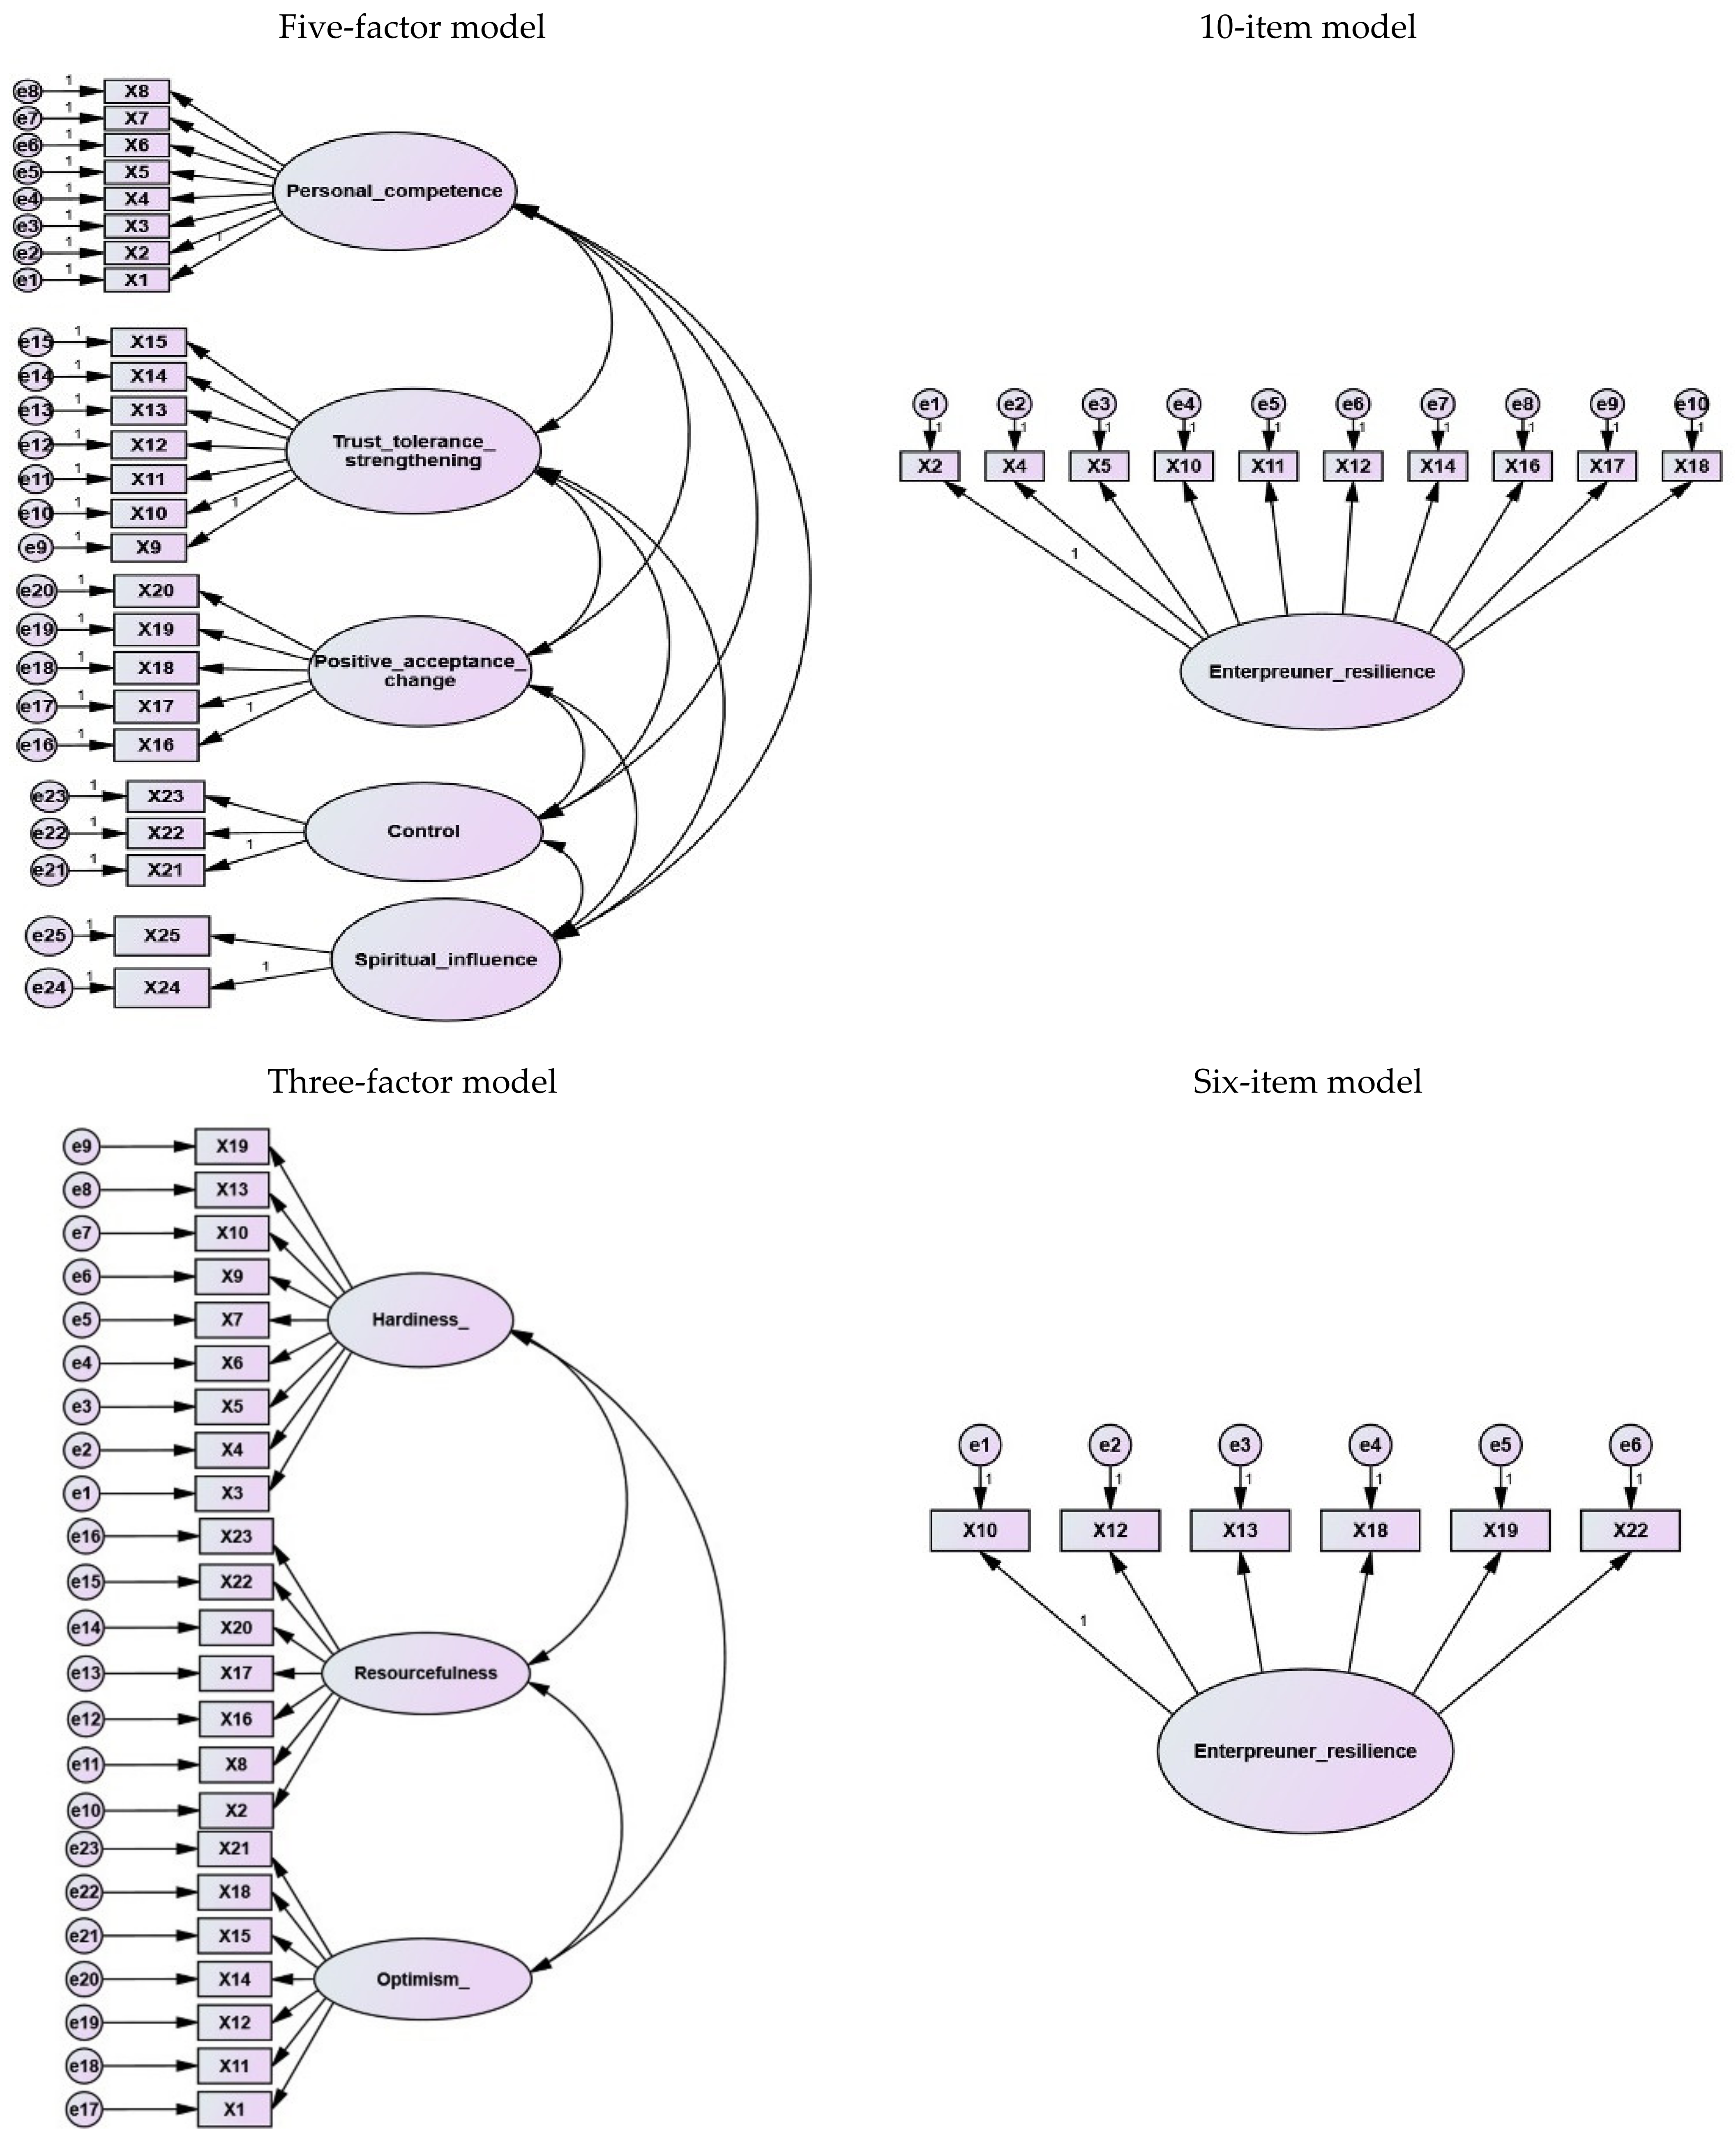
4.2. Model Comparison
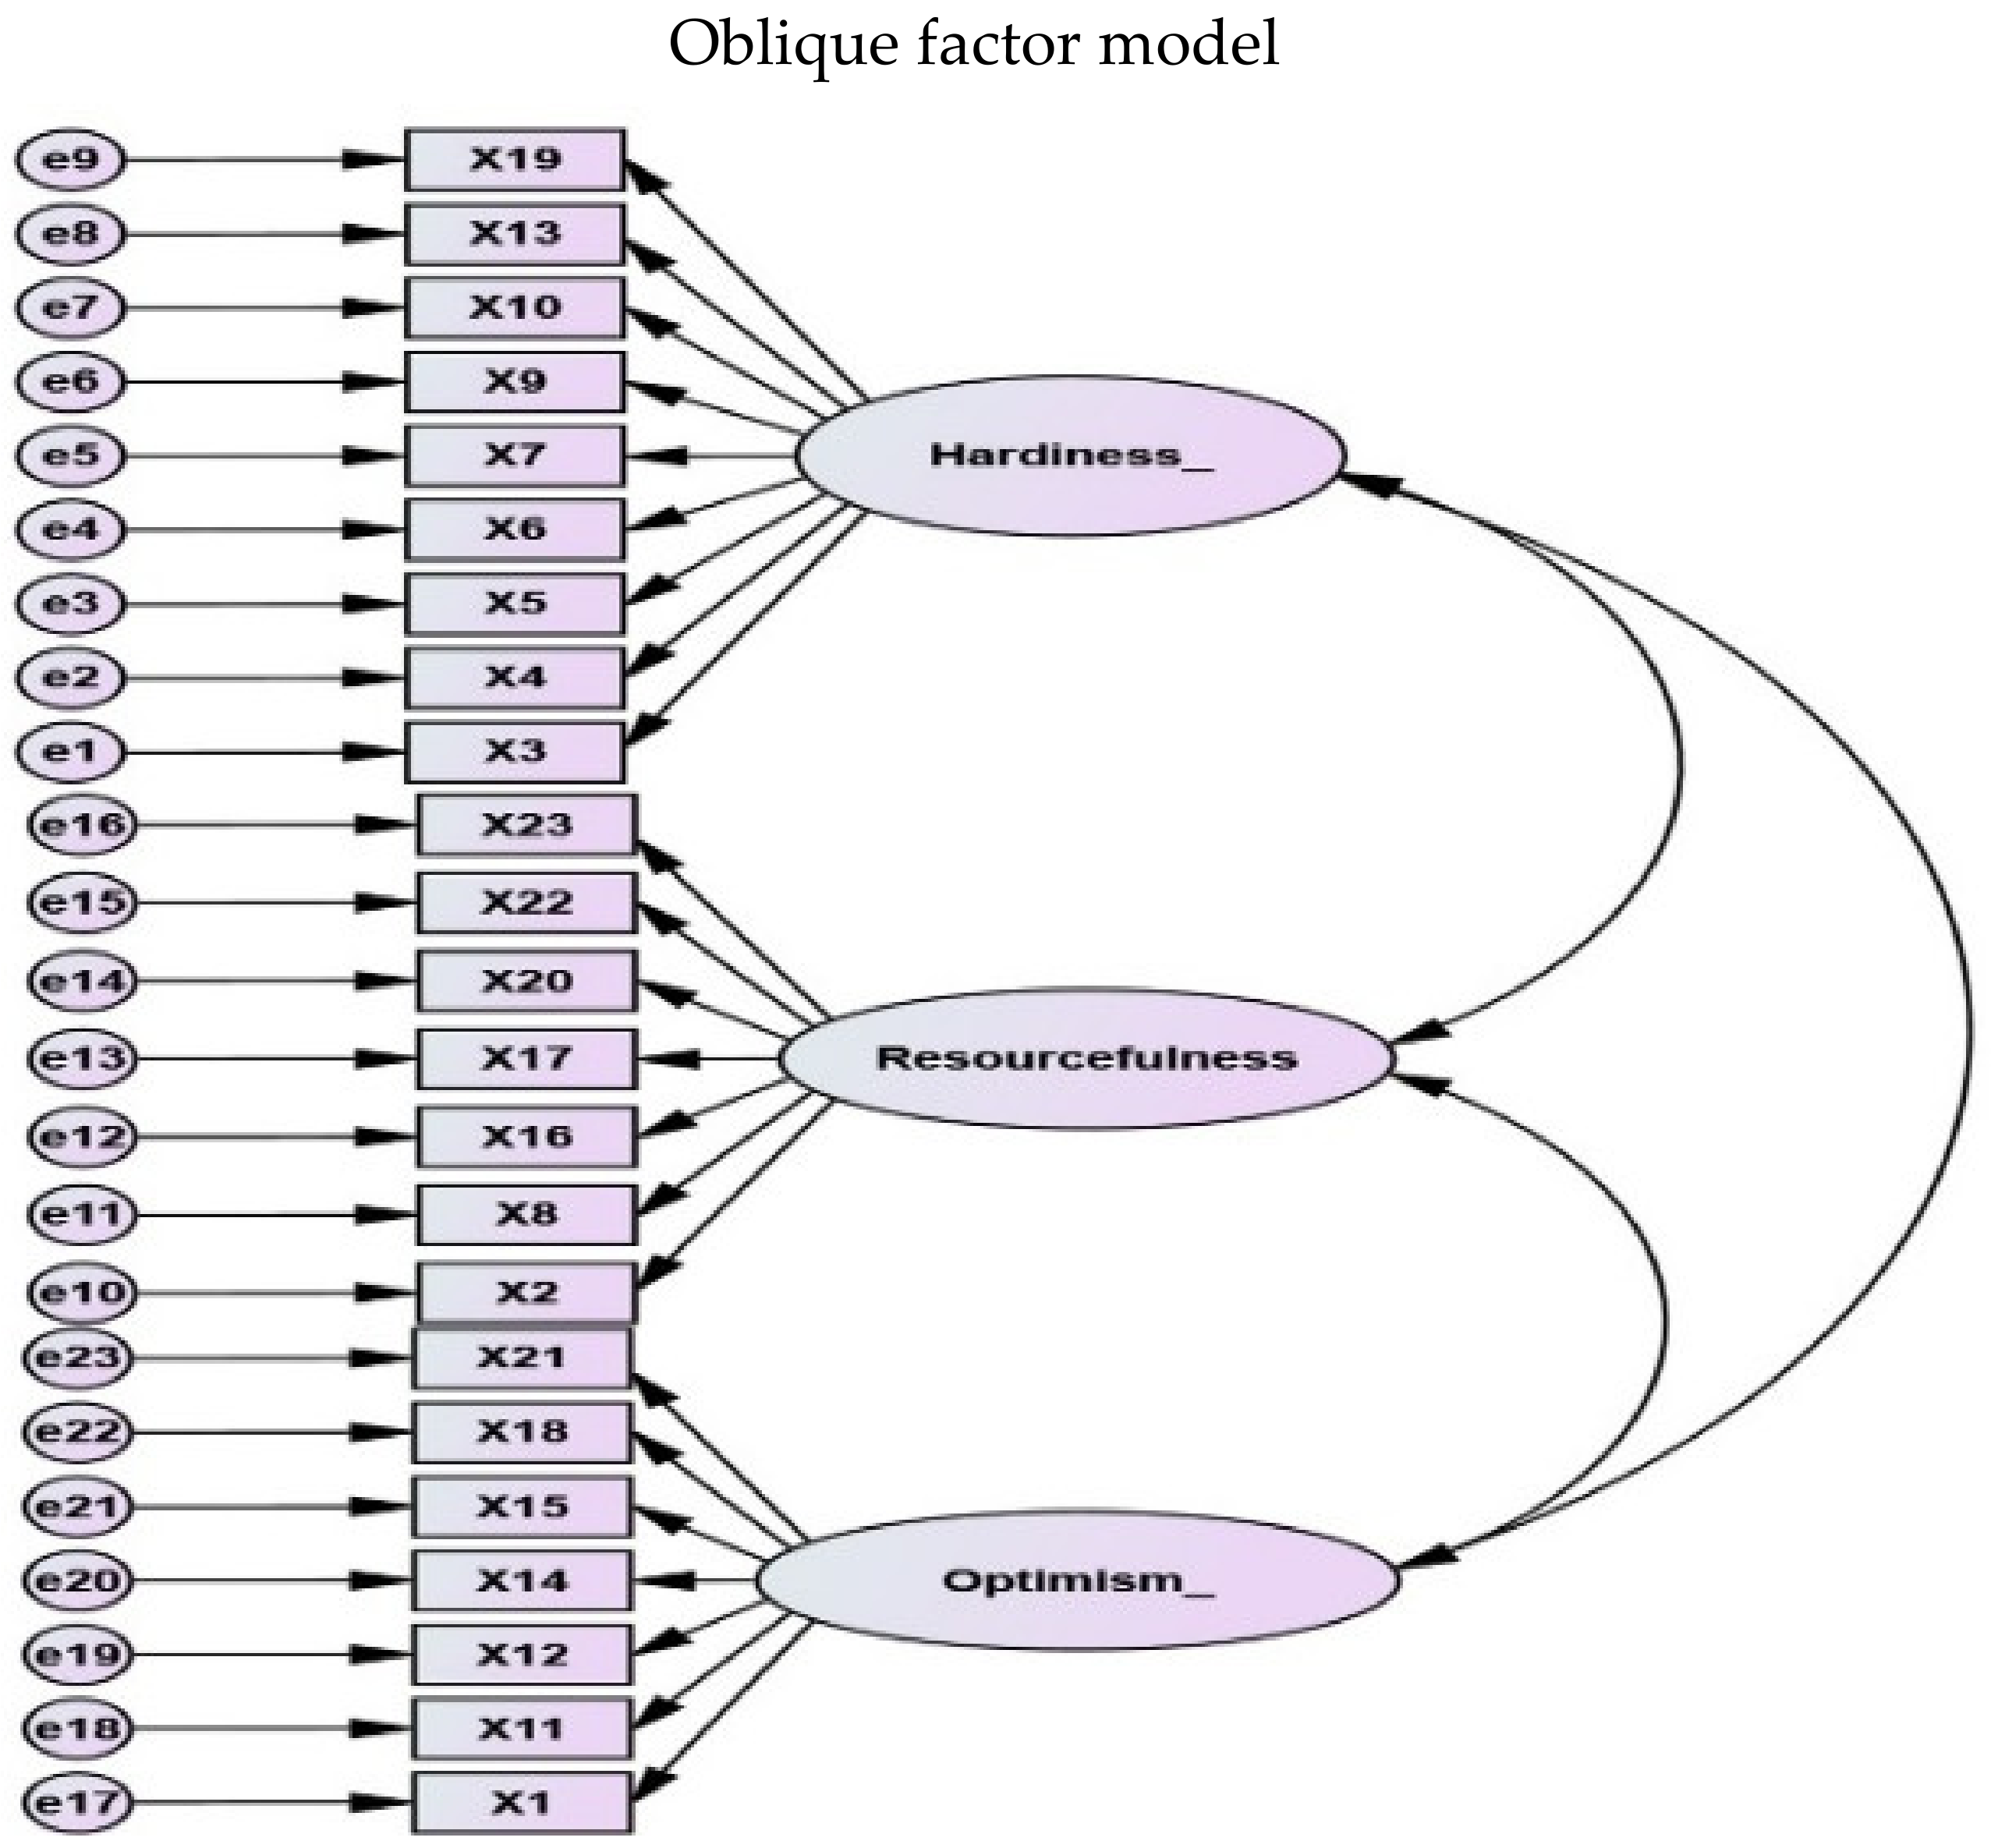
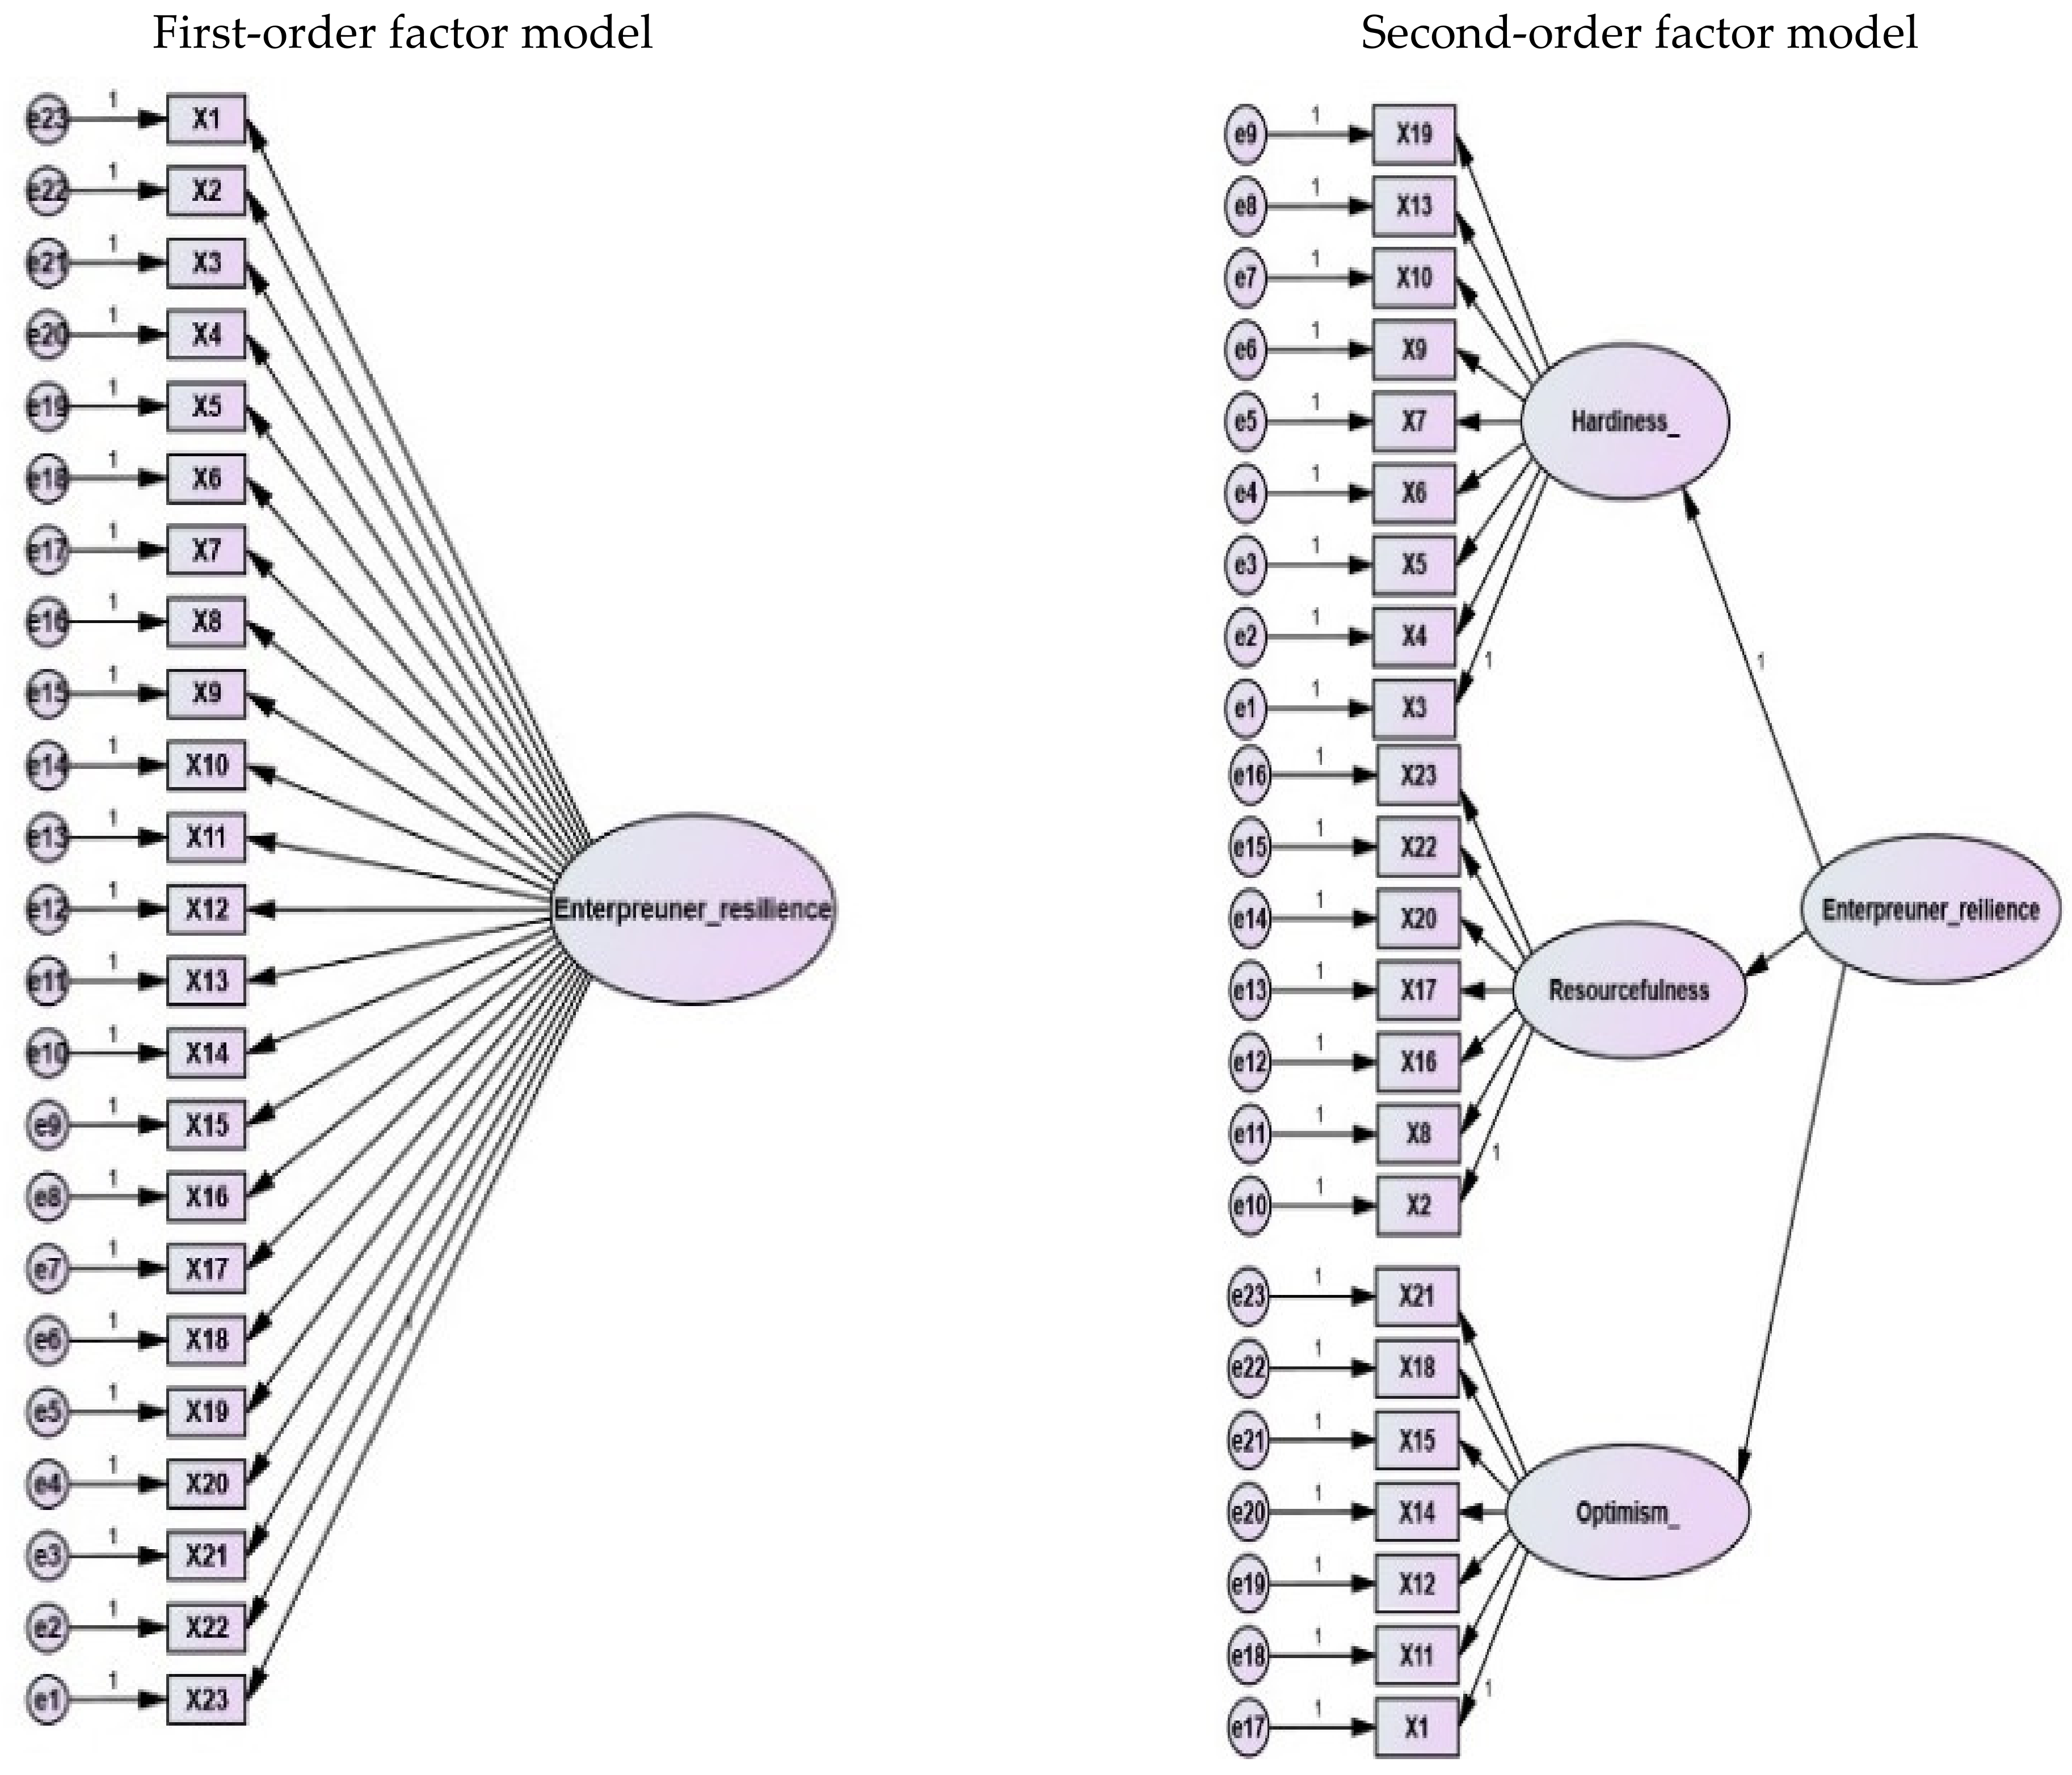
4.3. Best Fitting Model: Three Alternative Model Structures
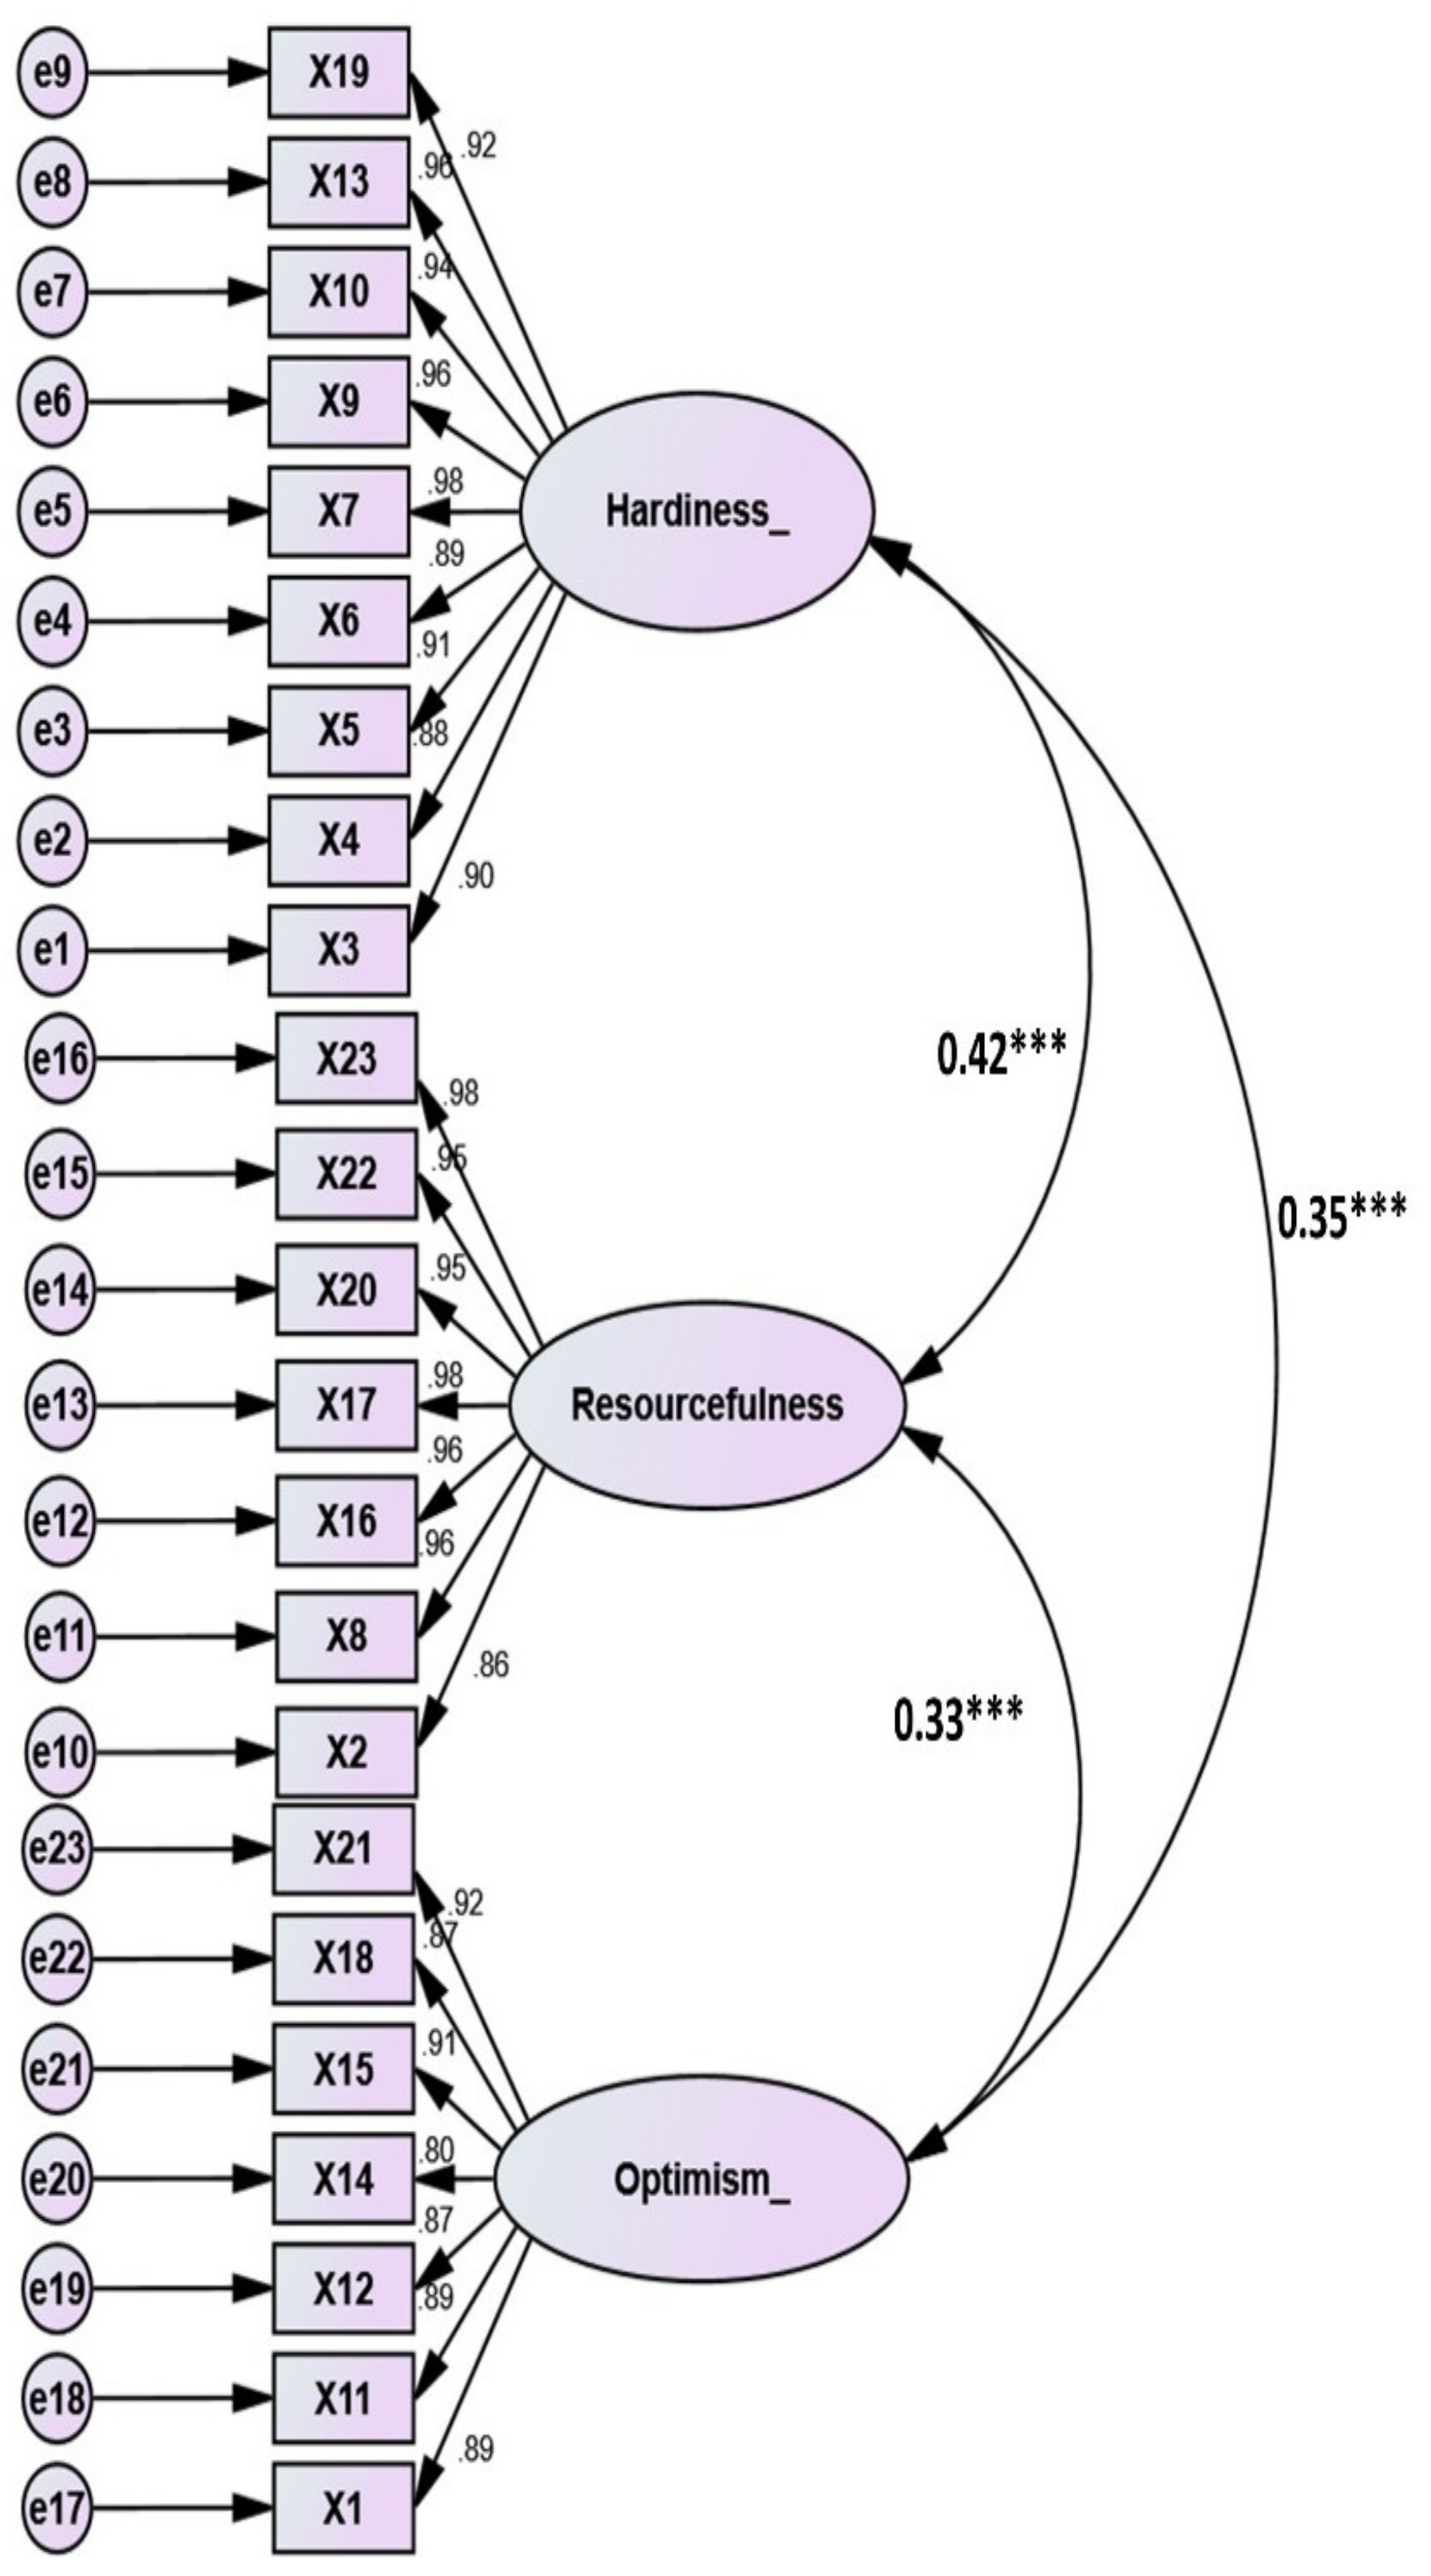
4.4. Manzano García and Ayala Calvo’s Three-Factor Model: Validity and Reliability Test
5. Conclusions
Funding
Institutional Review Board Statement
Informed Consent Statement
Data Availability Statement
Acknowledgments
Conflicts of Interest
References
- Haddoud, M.Y.; Onjewu, A.-K.E.; Al-Azab, M.R.; Elbaz, A.M. The Psychological Drivers of Entrepreneurial Resilience in the Tourism Sector. J. Bus. Res. 2022, 141, 702–712. [Google Scholar] [CrossRef]
- Prayag, G. Symbiotic Relationship or Not? Understanding Resilience and Crisis Management in Tourism. Tour. Manag. Perspect. 2018, 25, 133–135. [Google Scholar] [CrossRef]
- Sobaih, A.E.E.; Elshaer, I.; Hasanein, A.M.; Abdelaziz, A.S. Responses to COVID-19: The role of performance in the relationship between small hospitality enterprises’ resilience and sustainable tourism development. Int. J. Hosp. Manag. 2021, 94, 102824. [Google Scholar] [CrossRef]
- Elshaer, I.A.; Saad, S.K. Entrepreneurial Resilience and Business Continuity in the Tourism and Hospitality Industry: The Role of Adaptive Performance and Institutional Orientation. Tour. Rev. 2021. [Google Scholar] [CrossRef]
- Mandal, S.; Saravanan, D. Exploring the Influence of Strategic Orientations on Tourism Supply Chain Agility and Resilience: An Empirical Investigation. Tour. Plan. Dev. 2019, 16, 612–636. [Google Scholar] [CrossRef]
- Ketchen, D.J., Jr.; Craighead, C.W. Toward a Theory of Supply Chain Entrepreneurial Embeddedness in Disrupted and Normal States. J. Supply Chain. Manag. 2021, 57, 50–57. [Google Scholar] [CrossRef]
- Al-Hakimi, M.A.; Borade, D.B. The Impact of Entrepreneurial Orientation on the Supply Chain Resilience. Cogent Bus. Manag. 2020, 7, 1847990. [Google Scholar] [CrossRef]
- Al-Hakimi, M.A.; Borade, D.B.; Saleh, M.H. The Mediating Role of Innovation between Entrepreneurial Orientation and Supply Chain Resilience. Asia-Pac. J. Bus. Adm. 2021. [Google Scholar] [CrossRef]
- Branicki, L.J.; Sullivan-Taylor, B.; Livschitz, S.R. How Entrepreneurial Resilience Generates Resilient SMEs. Int. J. Entrep. Behav. Res. 2018, 24, 1244–1263. [Google Scholar] [CrossRef]
- Saad, M.H.; Hagelaar, G.; van der Velde, G.; Omta, S.W.F. Conceptualization of SMEs’ Business Resilience: A Systematic Literature Review. Cogent Bus. Manag. 2021, 8, 1938347. [Google Scholar] [CrossRef]
- Zutshi, A.; Mendy, J.; Sharma, G.D.; Thomas, A.; Sarker, T. From Challenges to Creativity: Enhancing SMEs’ Resilience in the Context of COVID-19. Sustainability 2021, 13, 6542. [Google Scholar] [CrossRef]
- Zighan, S.; Abualqumboz, M.; Dwaikat, N.; Alkalha, Z. The Role of Entrepreneurial Orientation in Developing SMEs Resilience Capabilities throughout COVID-19. Int. J. Entrep. Innov. 2021, 14657503211046849. [Google Scholar] [CrossRef]
- Hsu, B.-X.; Chen, Y.-M. Industrial Policy, Social Capital, Human Capital, and Firm-Level Competitive Advantage. Int. Entrep. Manag. J. 2019, 15, 883–903. [Google Scholar] [CrossRef]
- Muñoz, P.; Kimmitt, J. Social Mission as Competitive Advantage: A Configurational Analysis of the Strategic Conditions of Social Entrepreneurship. J. Bus. Res. 2019, 101, 854–861. [Google Scholar] [CrossRef]
- Sharma, S.; Sharma, S.K. Probing the Links between Team Resilience, Competitive Advantage, and Organizational Effectiveness: Evidence from Information Technology Industry. Bus. Perspect. Res. 2020, 8, 289–307. [Google Scholar] [CrossRef]
- Ferreira, J.; Coelho, A. Dynamic Capabilities, Innovation and Branding Capabilities and Their Impact on Competitive Advantage and SME’s Performance in Portugal: The Moderating Effects of Entrepreneurial Orientation. Int. J. Innov. Sci. 2020, 12, 255–286. [Google Scholar] [CrossRef]
- Fatoki, O. The Impact of Entrepreneurial Resilience on the Success of Small and Medium Enterprises in South Africa. Sustainability 2018, 10, 2527. [Google Scholar] [CrossRef] [Green Version]
- Awotoye, Y.; Singh, R.P. Entrepreneurial Resilience, High Impact Challenges, and Firm Performance. J. Manag. Policy Pract. 2017, 18, 28–37. [Google Scholar]
- Santoro, G.; Bertoldi, B.; Giachino, C.; Candelo, E. Exploring the Relationship between Entrepreneurial Resilience and Success: The Moderating Role of Stakeholders’ Engagement. J. Bus. Res. 2020, 119, 142–150. [Google Scholar] [CrossRef]
- Mason, C. The Coronavirus Economic Crisis: Its Impact on Venture Capital and High Growth Enterprises; Publications Office of the European Union: Luxembourg, 2020. [Google Scholar]
- Prayag, G.; Ozanne, L.K.; de Vries, H. Psychological Capital, Coping Mechanisms and Organizational Resilience: Insights from the 2016 Kaikoura Earthquake, New Zealand. Tour. Manag. Perspect. 2020, 34, 100637. [Google Scholar]
- de Oliveira Teixeira, E.; Werther, W.B., Jr. Resilience: Continuous Renewal of Competitive Advantages. Bus. Horiz. 2013, 56, 333–342. [Google Scholar] [CrossRef]
- Nyikos, G.; Soha, B.; Béres, A. Entrepreneurial Resilience and Firm Performance during the COVID-19 Crisis-Evidence from Hungary. Reg. Stat. 2021, 11, 29–59. [Google Scholar]
- Santoro, G.; Messeni-Petruzzelli, A.; Del Giudice, M. Searching for Resilience: The Impact of Employee-Level and Entrepreneur-Level Resilience on Firm Performance in Small Family Firms. Small Bus. Econ. 2021, 57, 455–471. [Google Scholar] [CrossRef]
- John, O.P.; Benet-Martínez, V. Measurement: Reliability, Construct Validation, and Scale Construction. In Handbook of Research Methods in Social and Personality Psychology; Cambridge University Press: Cambridge, UK, 2000. [Google Scholar]
- Blumberg, B.; Cooper, D.; Schindler, P. EBOOK: Business Research Methods; McGraw Hill: New York, NY, USA, 2014. [Google Scholar]
- Anderson, J.C.; Gerbing, D.W. Some Methods for Respecifying Measurement Models to Obtain Unidimensional Construct Measurement. J. Mark. Res. 1982, 19, 453–460. [Google Scholar] [CrossRef]
- Cortina, J.M. What Is Coefficient Alpha? An Examination of Theory and Applications. J. Appl. Psychol. 1993, 78, 98. [Google Scholar] [CrossRef]
- McGartland Rubio, D.; Berg-Weger, M.; Tebb, S.S. Using Structural Equation Modeling to Test for Multidimensionality. Struct. Equ. Modeling 2001, 8, 613–626. [Google Scholar] [CrossRef]
- Gerbing, D.W.; Anderson, J.C. An Updated Paradigm for Scale Development Incorporating Unidimensionality and Its Assessment. J. Mark. Res. 1988, 25, 186–192. [Google Scholar] [CrossRef]
- Nunnally, J.C. Psychometric Theory 3E; Tata McGraw-Hill Education: New York, NY, USA, 1994. [Google Scholar]
- Field, A. Discovering Statistics Using SPSS; Sage Publications Ltd.: Newbury Park, CA, USA, 2006. [Google Scholar]
- Hair, J.F.; Gabriel, M.; Patel, V. AMOS Covariance-Based Structural Equation Modeling (CB-SEM): Guidelines on Its Application as a Marketing Research Tool. Braz. J. Mark. 2014, 13, 44–55. [Google Scholar]
- Tabachnick, B.G.; Fidell, L.S.; Ullman, J.B. Using Multivariate Statistics; Pearson: Boston, MA, USA, 2007; Volume 5, pp. 481–498. [Google Scholar]
- Pallant, J. SPSS Survival Manual; Routledge: London, UK, 2001. [Google Scholar]
- Hooper, D.; Coughlan, J.; Mullen, M.R. Structural equation modelling: Guidelines for determining model fit. Electron. J. Bus. Res. Methods 2008, 6, 53–60. [Google Scholar]
- Byrne, B.M. Structural Equation Modeling with Mplus: Basic Concepts, Applications, and Programming; Routledge: London, UK, 2013. [Google Scholar]
- Kline, R.B. Principles and Practice of Structural Equation Modeling, 3rd ed.; Guilford: New York, NY, USA, 2011. [Google Scholar]
- Windle, G.; Bennett, K.M.; Noyes, J. A Methodological Review of Resilience Measurement Scales. Health Qual. Life Outcomes 2011, 9, 8. [Google Scholar] [CrossRef] [Green Version]
- Connor, K.M.; Davidson, J.R. Development of a New Resilience Scale: The Connor-Davidson Resilience Scale (CD-RISC). Depress. Anxiety 2003, 18, 76–82. [Google Scholar] [CrossRef]
- Rutter, M. Resilience in the Face of Adversity: Protective Factors and Resistance to Psychiatric Disorder. Br. J. Psychiatry 1985, 147, 598–611. [Google Scholar] [CrossRef]
- Kobasa, S.C. Stressful Life Events, Personality, and Health: An Inquiry into Hardiness. J. Personal. Soc. Psychol. 1979, 37, 1. [Google Scholar] [CrossRef]
- Lyons, J.A. Strategies for Assessing the Potential for Positive Adjustment Following Trauma. J. Trauma. Stress 1991, 4, 93–111. [Google Scholar] [CrossRef]
- Pangallo, A.; Zibarras, L.; Lewis, R.; Flaxman, P. Resilience through the Lens of Interactionism: A Systematic Review. Psychol. Assess. 2015, 27, 1. [Google Scholar] [CrossRef]
- Yu, X.; Lau, J.T.; Mak, W.W.; Zhang, J.; Lui, W.W. Factor Structure and Psychometric Properties of the Connor-Davidson Resilience Scale among Chinese Adolescents. Compr. Psychiatry 2011, 52, 218–224. [Google Scholar] [CrossRef]
- Jowkar, B.; Friborg, O.; Hjemdal, O. Cross-Cultural Validation of the Resilience Scale for Adults (RSA) in Iran. Scand. J. Psychol. 2010, 51, 418–425. [Google Scholar] [CrossRef]
- Manzano García, G.; Ayala Calvo, J.C. Psychometric Properties of Connor-Davidson Resilience Scale in a Spanish Sample of Entrepreneurs. Psicothema 2013, 25, 245–251. [Google Scholar]
- Ayala, J.-C.; Manzano, G. The Resilience of the Entrepreneur. Influence on the Success of the Business. A Longitudinal Analysis. J. Econ. Psychol. 2014, 42, 126–135. [Google Scholar] [CrossRef]
- Karaırmak, Ö. Establishing the Psychometric Qualities of the Connor–Davidson Resilience Scale (CD-RISC) Using Exploratory and Confirmatory Factor Analysis in a Trauma Survivor Sample. Psychiatry Res. 2010, 179, 350–356. [Google Scholar] [CrossRef]
- Campbell-Sills, L.; Stein, M.B. Psychometric Analysis and Refinement of the Connor–Davidson Resilience Scale (CD-RISC): Validation of a 10-Item Measure of Resilience. J. Trauma. Stress Off. Publ. Int. Soc. Trauma. Stress Stud. 2007, 20, 1019–1028. [Google Scholar] [CrossRef]
- Smith, B.W.; Dalen, J.; Wiggins, K.; Tooley, E.; Christopher, P.; Bernard, J. The Brief Resilience Scale: Assessing the Ability to Bounce Back. Int. J. Behav. Med. 2008, 15, 194–200. [Google Scholar] [CrossRef]
- Thomas, R.; Shaw, G.; Page, S.J. Understanding Small Firms in Tourism: A Perspective on Research Trends and Challenges. Tour. Manag. 2011, 32, 963–976. [Google Scholar] [CrossRef]
- Kittleson, M.J. Response Rate Via The. Health Values 1995, 18, 27–29. [Google Scholar]
- Parker, L. Collecting Data the E-Mail Way. Train. Dev. 1992, 46, 52–55. [Google Scholar]
- Wheaton, B.; Muthen, B.; Alwin, D.F.; Summers, G.F. Assessing Reliability and Stability in Panel Models. Sociol. Methodol. 1977, 8, 84–136. [Google Scholar] [CrossRef]
- Steiger, J.H. A Note on Multiple Sample Extensions of the RMSEA Fit index. Struct. Equ. Model. A Multidiscip. J. 1998, 5, 411–419. [Google Scholar] [CrossRef]
- Hu, L.; Bentler, P.M. Cutoff Criteria for Fit Indexes in Covariance Structure Analysis: Conventional Criteria versus New Alternatives. Struct. Equ. Modeling 1999, 6, 1–55. [Google Scholar] [CrossRef]
- Elshaer, I.A.; Augustyn, M.M. Testing the Dimensionality of the Quality Management Construct. Total Qual. Manag. Bus. Excell. 2016, 27, 353–367. [Google Scholar] [CrossRef]
- Kobasa, S.C.; Maddi, S.R.; Kahn, S. Hardiness and Health: A Prospective Study. J. Personal. Soc. Psychol. 1982, 42, 168–177. [Google Scholar] [CrossRef]
- Bullough, A.; Renko, M. Entrepreneurial Resilience during Challenging Times. Bus. Horiz. 2013, 56, 343–350. [Google Scholar] [CrossRef]
- Fornell, C.; Larcker, D.F. Structural Equation Models with Unobservable Variables and Measurement Error: Algebra and Statistics. J. Mark. Res. 1981, 18, 382–388. [Google Scholar] [CrossRef]
- Türkeș, M.C.; Stăncioiu, A.F.; Băltescu, C.A.; Marinescu, R.-C. Resilience Innovations and the Use of Food Order & Delivery Platforms by the Romanian Restaurants during the COVID-19 Pandemic. J. Theor. Appl. Electron. Commer. Res. 2021, 16, 3218–3247. [Google Scholar] [CrossRef]
- Azazz, A.M.S.; Elshaer, I.A. Amid COVID-19 Pandemic, Entrepreneurial Resilience and Creative Performance with the Mediating Role of Institutional Orientation: A Quantitative Investigation Using Structural Equation Modeling. Mathematics 2022, 10, 2127. [Google Scholar] [CrossRef]
- Elshaer, I.A.; Azazz, A.M.S. Amid the COVID-19 Pandemic, Unethical Behavior in the Name of the Company: The Role of Job Insecurity, Job Embeddedness, and Turnover Intention. Int. J. Environ. Res. Public Health 2022, 19, 247. [Google Scholar] [CrossRef]

| Original Connor–Davidson Resilience Scale (CD-RISC) (Five-Factor Structure—25 Items) | Campbell-Sills and Stein (2007) 10 Items, Unidimensional Scale | Brief Resilience Scale (BRS), 6 Items, Unidimensional Scale | Manzano García and Ayala Calvo 3-Fact Structure Scale—23 Items | |||
|---|---|---|---|---|---|---|
| Items | Hardiness: 9 items | Resourcefulness: 7 items | Optimism: 7 items | |||
| Factor 1: “Personal competence, high standards, and tenacity” | ||||||
| X1 | “I do my best effort no matter what”. | ✓ | ||||
| X2 | “I can achieve my goals”. | ✓ | ✓ | |||
| X3 | “When things look hopeless, I don’t give up”. | ✓ | ||||
| X4 | “Not easily discouraged by failure”. | ✓ | ✓ | |||
| X5 | “Think of self as a strong person”. | ✓ | ✓ | |||
| X6 | “I like challenges”. | ✓ | ||||
| X7 | “I work to attain my goals”. | ✓ | ||||
| X8 | “Pride in my achievements”. | ✓ | ||||
| Factor 2: “Trust in one’s instincts, tolerance of negative effects, and strengthening effects of stress” | ||||||
| X9 | “Prefer to take the lead in problem-solving”. | ✓ | ||||
| X10 | “Under pressure, I focus and think clearly”. | ✓ | ✓ | ✓ | ||
| X11 | “See the humorous side of things”. | ✓ | ✓ | |||
| X12 | “Coping with stress strengthens me”. | ✓ | ✓ | ✓ | ||
| X13 | “Make unpopular or difficult decisions”. | ✓ | ✓ | |||
| X14 | “Can handle unpleasant feelings”. | ✓ | ✓ | |||
| X15 | “Have to act on a hunch”. | ✓ | ||||
| Factor 3: “Positive acceptance of change, and secure relationships” | ||||||
| X16 | “Able to adapt to change”. | ✓ | ✓ | |||
| X17 | “Close and secure relationships”. | ✓ | ||||
| X18 | “Tend to bounce back after hardship”. | ✓ | ✓ | ✓ | ||
| X19 | “Can deal with whatever comes”. | ✓ | ✓ | ✓ | ||
| X20 | “Past success gives confidence for new challenge”. | ✓ | ||||
| Factor 4: Control | ||||||
| X21 | “Strong sense of purpose”. | ✓ | ||||
| X22 | “In control of your life”. | ✓ | ✓ | |||
| X23 | “Know where to turn for help”. | ✓ | ||||
| Factor 5: Spiritual influence | ||||||
| X24 | “Things happen for a reason”. | |||||
| X25 | “Sometimes fate or God can help”. | |||||
| Criteria | Explanation | Calculation | Threshold Value |
|---|---|---|---|
| X2/df | Chi-square divided by (DF) degrees of freedom | “The differences between the observed and estimated covariance matrix”. | Less than 5.0 |
| RMSEA | Root mean square error of approximation | “The discrepancy per degree of freedom, yet measures discrepancy in terms of the population, not just the sample used for estimation”. | Less than 0.05 |
| SRMR | Standardized root mean residual | “Average of the residuals between observed and estimated input metrics but standardized to be between 0 and 1”. | Less than 0.05 |
| CFI | Comparative fit index. | “The relative improvement in fit of the hypothesized model over the null model. CFI provides an unbiased estimate of its corresponding population value and is less sensitive to the sample size”. | More than 0.90 |
| NFI | Normed fit index | “Is a relative comparison of the proposed model to the null model”. | More than 0.90 |
| PCFI | Parsimonious comparative fit index | “Adjusts the CFI using PR”. | More than 0.5 |
| PNFI | Parsimonious normed fit index | “Is an extension of NFI by multiplying it by the parsimony ratio or PR (the ratio of degrees of freedom used by a model to the total degrees of freedom available)”. | More than 0.5 |
| N = 590 | % | Groups | ||||
|---|---|---|---|---|---|---|
| N = 590 | % | |||||
| Gender | Male | 543 | 92% | Fast food restaurants | 207 | 35% |
| Female | 47 | 8% | Food truck | 195 | 33% | |
| Marital status | Married | 443 | 75% | Mobile phone accessories | 35 | 6% |
| Unmarried | 147 | 25% | Estate management | 35 | 6% | |
| Age | <21 years old | 77 | 13% | Travel agents | 118 | 20% |
| From 22 to 45 years old | 236 | 40% | ||||
| From 46 to 60 years old | 236 | 40% | ||||
| >60 years old | 41 | 7% | ||||
| Education | High school degree or lower | 118 | 20% | |||
| College certificate | 413 | 70% | ||||
| MBA certificate | 59 | 10% | ||||
| Number of employees | <5 employees | 354 | 60% | |||
| 5 to 49 employees | 236 | 40% | ||||
| Years in operation | <5 years in operation | 236 | 40% | |||
| 5 to 10 years in operation | 325 | 55% | ||||
| >10 years in operation | 30 | 5% | ||||
| N = 590 | Minimum | Maximum | Mean | S.D. | Skewness | Kurtoses |
|---|---|---|---|---|---|---|
| Items | 1 | 5 | 4.13 | 0.903 | −1.096 | 1.292 |
| X1 | 1 | 5 | 3.29 | 1.059 | −0.529 | −0.468 |
| X2 | 1 | 5 | 3.30 | 1.063 | −0.520 | −0.476 |
| X3 | 1 | 5 | 3.29 | 1.058 | −0.522 | −0.469 |
| x4 | 1 | 5 | 3.31 | 1.052 | −0.524 | −0.435 |
| X5 | 1 | 5 | 3.30 | 1.053 | −0.501 | −0.461 |
| X6 | 1 | 5 | 3.31 | 1.057 | −0.546 | −0.415 |
| X7 | 1 | 5 | 3.26 | 1.104 | −0.534 | −0.543 |
| X8 | 1 | 5 | 3.30 | 1.051 | −0.534 | −0.415 |
| X9 | 1 | 5 | 3.30 | 1.053 | −0.536 | −0.421 |
| X10 | 1 | 5 | 4.13 | 0.903 | −1.096 | 1.292 |
| X11 | 1 | 5 | 4.11 | 0.930 | −1.153 | 1.398 |
| X12 | 1 | 5 | 3.30 | 1.059 | −0.539 | −0.414 |
| X13 | 1 | 5 | 4.12 | 0.924 | −1.227 | 1.067 |
| X14 | 1 | 5 | 4.13 | 0.895 | −1.078 | 1.233 |
| X15 | 1 | 5 | 3.28 | 1.068 | −0.526 | −0.462 |
| x16 | 1 | 5 | 3.27 | 1.087 | −0.515 | −0.523 |
| X17 | 1 | 5 | 4.10 | 0.979 | −1.271 | 1.640 |
| X18 | 1 | 5 | 3.27 | 1.087 | −0.515 | −0.523 |
| X19 | 1 | 5 | 3.27 | 1.097 | −0.541 | −0.541 |
| X20 | 1 | 5 | 3.27 | 1.082 | −0.527 | −0.508 |
| X21 | 1 | 5 | 3.28 | 1.085 | −0.545 | −0.487 |
| X22 | 1 | 5 | 4.08 | 0.981 | −1.211 | 1.429 |
| X23 | 1 | 5 | 4.06 | 1.009 | −1.204 | 1.206 |
| X24 | 1 | 5 | 4.06 | 1.009 | −1.204 | 1.206 |
| X25 | 1 | 5 | 4.13 | 0.903 | −1.096 | 1.292 |
| Comparative Models | Obtained GoF | |||||||
|---|---|---|---|---|---|---|---|---|
| Absolute Fit Measures (AFM) | Incremental Fit Measures (IFM) | Parsimony Fit Measures (PFM) | ||||||
| CMIN/df | RMSEA | SRMR | CFI | NFI | TLI | PNFI | PCFI | |
| Model 1: Original Connor–Davidson resilience scale (CD-RISC) (five-factor structure, 25 items) | 7.5 | 0.212 | 0.243 | 0.711 | 0.704 | 0.673 | 0.622 | 0628 |
| Model 2: Campbell-Sills and Stein (10 items, unidimensional scale) | 5.7 | 0.309 | 0.321 | 0.694 | 0.691 | 0.606 | 0.573 | 0.540 |
| Model 3: Brief resilience scale (BRS) (6 items, unidimensional scale) | 5.1 | 0.294 | 0.211 | 0.860 | 0.858 | 0.766 | 0.515 | 0.516 |
| Model 4: Manzano García and Ayala Calvo scale (three-factor structure, 23 items) | 2.725 | 0.030 | 0.027 | 0.934 | 0.925 | 0.926 | 0.830 | 0.838 |
| Suggested GoF | ||||||||
| ≤3.0 | ≤0.05; ≤0.08 | <0.05 | ≥0.90 | ≥0.90 | ≥0.90 | >0.5 | >0.5 | |
| Comparative Models | Obtained GoF | |||||||
|---|---|---|---|---|---|---|---|---|
| Absolute Fit Measures (AFM) | Incremental Fit Measures (IFM) | Parsimonious Fit Measures (PFM) | ||||||
| CMIN/df | RMSEA | SRMR | CFI | NFI | TLI | PNFI | PCFI | |
| First-order: oblique factor model | 2.725 | 0.030 | 0.027 | 0.934 | 0.925 | 0.926 | 0.830 | 0.838 |
| Second-order: higher-order factor model | 6.2 | 0.323 | 0.318 | 0.684 | 0.677 | 0.652 | 0.616 | 0.621 |
| Unidimensional: one-factor model | 6.9 | 0.232 | 0.287 | 0.684 | 0678 | 0.657 | 0.652 | 0.623 |
| Factors and items | Factor loadings | S.E. | t-Value | CR | AVE | MSV | 1 | 2 | 3 |
|---|---|---|---|---|---|---|---|---|---|
| 1. Hardiness (a = 0.903) | 0.985 | 0.862 | 0.176 | 0.929 | |||||
| X3 | 0.905 | F | F | ||||||
| X4 | 0.885 | 0.149 | 34.127 | ||||||
| X5 | 0.914 | 0.170 | 37.209 | ||||||
| X6 | 0.894 | 0.078 | 34.991 | ||||||
| X7 | 0.975 | 0.133 | 46.033 | ||||||
| X9 | 0.960 | 0.094 | 43.471 | ||||||
| X10 | 0.942 | 0.115 | 40.775 | ||||||
| X13 | 0.916 | 0.094 | 43.770 | ||||||
| X19 | 0.962 | 0.177 | 37.422 | ||||||
| 2. Resourcefulness (a = 0.921) | 0.984 | 0.900 | 0.176 | 0420 | 0.949 | ||||
| X2 | 0.859 | F | F | ||||||
| X8 | 0.957 | 0.032 | 36.090 | ||||||
| X16 | 0.959 | 0.031 | 38.126 | ||||||
| X17 | 0.978 | 0.031 | 35.749 | ||||||
| X20 | 0.953 | 0.032 | 35.711 | ||||||
| X22 | 0.953 | 0.032 | 38.126 | ||||||
| X23 | 0.976 | 0.031 | 37.927 | ||||||
| 3. Optimism (a = 0.937) | 0.960 | 0.890 | 0.123 | 0.350 | 0.330 | 0.880 | |||
| X1 | 0.887 | F | F | ||||||
| X11 | 0.888 | 0.033 | 32.284 | ||||||
| X12 | 0.873 | 0.034 | 31.062 | ||||||
| X14 | 0.803 | 0.030 | 34.319 | ||||||
| X15 | 0.911 | 0.035 | 30.639 | ||||||
| X18 | 0.868 | 0.032 | 35.486 | ||||||
| X21 | 0.924 | 0.033 | 26.165 | ||||||
| Correlation estimates | |||||||||
| Relationships | Estimates | CR | p | ||||||
Hardiness  Resourcefulness Resourcefulness | 0.42 | 14.639 | 0.001 | ||||||
| Hardiness Optimism | 0.35 | 12.531 | 0.001 | ||||||
| Resourcefulness Optimism | 0.33 | 11.825 | 0.001 | ||||||
Publisher’s Note: MDPI stays neutral with regard to jurisdictional claims in published maps and institutional affiliations. |
© 2022 by the author. Licensee MDPI, Basel, Switzerland. This article is an open access article distributed under the terms and conditions of the Creative Commons Attribution (CC BY) license (https://creativecommons.org/licenses/by/4.0/).
Share and Cite
Elshaer, I.A. Dimensionality Analysis of Entrepreneurial Resilience amid the COVID-19 Pandemic: Comparative Models with Confirmatory Factor Analysis and Structural Equation Modeling. Mathematics 2022, 10, 2298. https://doi.org/10.3390/math10132298
Elshaer IA. Dimensionality Analysis of Entrepreneurial Resilience amid the COVID-19 Pandemic: Comparative Models with Confirmatory Factor Analysis and Structural Equation Modeling. Mathematics. 2022; 10(13):2298. https://doi.org/10.3390/math10132298
Chicago/Turabian StyleElshaer, Ibrahim A. 2022. "Dimensionality Analysis of Entrepreneurial Resilience amid the COVID-19 Pandemic: Comparative Models with Confirmatory Factor Analysis and Structural Equation Modeling" Mathematics 10, no. 13: 2298. https://doi.org/10.3390/math10132298
APA StyleElshaer, I. A. (2022). Dimensionality Analysis of Entrepreneurial Resilience amid the COVID-19 Pandemic: Comparative Models with Confirmatory Factor Analysis and Structural Equation Modeling. Mathematics, 10(13), 2298. https://doi.org/10.3390/math10132298