Abstract
Summer Bridge Programs (SBPs) support students’ personal, organizational, content-related, and social challenges as they transition from high school to postsecondary education. However, the research is not conclusive on the overall effect of these programs on academic performance. Prior systematic reviews and meta-analyses have raised critical methodological concerns. Following the PRISMA framework, this scoping review examines the methodological aspects when assessing the academic effects of SBPs on incoming STEM (Science, Technology, Engineering, and Mathematics) students. The inclusion criteria were studies that quantitatively assessed the academic performance of SBPs offered during the summer prior to the start of classes for incoming first-year STEM students and that included a control group. We searched ERIC, Web of Science, SciELO, and ProQuest databases. This review included 37 studies evaluating 33 programs. The majority of academic evaluations relied on course performance, graduation or retention rates, and GPA (Grade Point Average) outcomes. Moreover, the evidence is mainly descriptive or observational, with no control variables. We found a lack of studies that used an experimental or observational approach while also controlling for participants’ background variables. Finally, the reported outcomes are mainly short-term, with only a small number of studies assessing longer-term effects of SBPs, such as graduation rates.
1. Introduction
The number of students in Higher Education Institutions (HEIs) has increased over the past decade and is expected to continue rising in the coming years (OECD, 2018). With the increase in access to tertiary education, students who were traditionally excluded from higher education are now enrolling in HEIs (Reed, 2016). For example, as significant progress has been made in closing historical gender gaps, women are now more likely to pursue post-secondary studies after graduating from secondary education (GEM Report UNESCO, 2024; OECD, 2018, 2021). This massification and democratization of higher education bring new challenges of equity, innovation, adaptation, and quality of education, among others (Hornsby & Osman, 2014).
In the transition to higher education, students face several challenges related to personal, organizational, content-related, and social aspects (Trautwein & Bosse, 2017). While addressing the traditional requirements of students, HEIs must also focus on the issues arising from increasing demographic diversity (Maringe & Sing, 2014). For example, a high proportion of students enter HEIs unprepared for the academic rigor of college or university courses (Bettinger & Long, 2005; Venezia & Jaeger, 2013). Students with marginalized identities (e.g., women, people who identify as sexual minorities and first-generation students) are more likely to experience chronic stressors during their transition to college (Kroshus et al., 2021). Additionally, first-generation students, unfamiliar with university culture and expectations, are more likely to drop out than their peers who are not first-generation students (Reed, 2016). Finally, women are underrepresented in engineering, manufacturing, and construction, as well as in information and communication technology studies (UNESCO, 2017), and they leave STEM disciplines at higher rates and are less likely to travel abroad for studies compared to men (GEM Report UNESCO, 2024).
In STEM disciplines, there are several challenges related to academics, performance and access. A recent meta-analysis found several interconnected barriers experienced by underrepresented groups in STEM education, such as socioeconomic factors, limited parental support, constrained school environments, and sociocultural norms (Liu & Kringos, 2025), which in turn impact students’ persistence in the field. Some factors identified are the lack of preparation or support students have when entering the tertiary education system (Burt et al., 2023; James & James, 2025; Masjutina et al., 2025) and lack of diversity (Blackburn, 2017; Botella et al., 2019; Scott & Martin, 2014).
Strategies to address these challenges include interventions that help students make sense of their academic experiences (Harackiewicz & Priniski, 2018). Many institutions that offer STEM programs have implemented Summer Bridge Programs (SBPs) to address these challenges in the context of higher education (Odeleye & Santiago, 2019). As Liu and Kringos (2025) state, targeted interventions specifically designed to support students from disadvantaged backgrounds can be aligned with specific barriers, such as the lack of preparation among students. SBPs typically occur during the summer before the first term starts, acting as a bridge from high school to college or university (U.S. Department of Education, Institute of Education Sciences, What Works Clearinghouse, 2016). However, the literature shows little consistency across definitions of SBPs (Sablan, 2014) because each program is tailored to an HEI’s specific goals and constraints, making each SBP unique. Sablan (2014) characterized SBPs by describing how they are similar and different across institutions and identified characteristics of program participation, administration, funding, and curriculum. Those characteristics can impact program evaluations (Baron, 2004; Calcagno & Long, 2009). For example, some SBPs aim to facilitate the transition to careers requiring a two-year degree (e.g., pharmacy students in Verdone et al., 2020), improve course placement in engineering (e.g., J. R. Reisel et al., 2012), or increase students’ self-efficacy (e.g., Hanlon & Schneider, 1999; Kilian, 2010). Other SBPs focus on a targeted subgroup, such as Latina women (e.g., Johnston et al., 2021), students from rural areas (e.g., Sheffield et al., 2018), migrant students (e.g., Gilbert, 1982), and African American students (e.g., J. M. Johnson, 2016).
Several variations in SBP implementation also exist within STEM fields. Some programs aim to increase the preparation of high school students by enhancing self-efficacy, motivation, and sense of belonging (e.g., Barth et al., 2021; Kassaee & Rowell, 2016), fostering interest in STEM careers and aspirations (e.g., Kitchen et al., 2018; Pong et al., 2011) or strengthening STEM identity (e.g., Knight et al., 2013).
1.1. Methodological Considerations When Evaluating Summer Bridge Programs
SBPs, like any other educational program, should be subject to evaluation. Evaluation aims to improve the quality of interventions (Owen, 2020). The evaluation process not only involves defining criteria and standards but also requires decisions about the type of evidence to collect and how to synthesize information. Behind any evaluation are different questions—epistemological, ontological, and normative—that guide methodological choices and method selection (Brandon & Singh, 2009; Chouinard & Cousins, 2009). Ultimately, the research design should align with specific questions being asked about a program (Cohen et al., 2008; Creswell & Creswell, 2023; Slavin, 2020). In this section, we outline some differences in the implementation of SBPs may pose challenges to evaluating them as a single, uniform intervention. Through examples of different STEM-specific SBP implementations, we show how different implementations translate into distinct methodological considerations when evaluating SBPs. We do not aim to create a comprehensive list of methodological considerations for each program, nor do we prioritize one method over others.
1.1.1. Differences in Implementation
Variances in implementation, such as format, social component, and duration, differ significantly across institutions depending on their goals. Some SBPs are entirely online (e.g., Tempelaar et al., 2011), others in-person or residential (e.g., Walter & Wade, 2024; Strayhorn, 2011), while other institutions have decided to implement a hybrid format with both online and in-person settings (e.g., Gibson et al., 2021). In a fully online or hybrid setting, students benefit from self-paced courses that provide greater autonomy and flexibility in their learning process compared to traditional face-to-face setting. However, online programs present unique challenges, such as differences in students’ time management, activity design, academic integrity, and assessment of online collaboration (Kearns, 2012). Thus, when evaluating these programs, some argue that research should avoid excessive focus on comparison studies between face-to-face and distance-delivered instruction, as the factors influencing these formats are not equivalent (Rovai, 2003).
In contrast, in-person (or residential) programs expose students to the culture of the university or college and foster relationships with peers and faculty members. These non-academic experiences, or “college knowledge” (Conley, 2008), can influence students’ social experiences prior to enrollment and enhance their sense of preparedness. For instance, if the social component includes female role models, SBPs may have a distinct impact on women (Herrmann et al., 2016; Rosenthal et al., 2013; Stout, 2013). Similarly, programs offering academic counseling or mentoring can help first-generation students set realistic expectations and strengthen their sense of belonging and self-efficacy (Hagler et al., 2024). Evaluating such programs requires incorporating diverse perspectives to analyze educational outcomes for varied learners. When examining the experiences of marginalized groups, broader structural factors should be considered to explain differences in academic outcomes (Jordan, 2010). Evaluations that account for cultural diversity are increasing globally, leading to the development of new methods, instruments, and statistical techniques (Boyce, 2017; Hood et al., 2015). For example, Nachbauer and Kyriakides (2020) found that decisions about equity indicators in educational outcomes involve choices such as whether to use longitudinal or cross-sectional measures, models of analysis, and class size considerations.
Finally, little attention has been given to program duration and the time allocated to specific activities (Sablan, 2014). Duration varies across SBPs, often depending on budgetary and logistical constraints. In some cases, SBPs serve as the starting point for extended interventions that include additional forms of support (Bradford et al., 2021), such as peer mentoring or extracurricular activities (e.g., Ikuma et al., 2019; M. Johnson et al., 2013; Lisberg & Woods, 2018).
1.1.2. Differences in Program Participation
Program participation and self-selection depend heavily on each institution’s decision regarding which students to target for each SBP. As institutions identify the characteristics of students who will receive support (Sablan, 2014), each SBP may target different subgroups. Some SBPs focus on all incoming students, regardless of their level of preparedness or academic skills (e.g., Ikuma et al., 2019). Others target students based on their high school performance (e.g., GPA or standardized entrance test such as the Scholastic Assessment Test, SAT in the US). Evidence shows that improving academic skills depends on the degree of support students need (Boatman & Long, 2018; Calcagno & Long, 2009).
Moreover, self-selection bias can occur if the program is offered to all incoming students, but registration is voluntary. In such cases, background characteristics may differ between students who register and those who do not (Baron, 2004), which could also impact participants’ future performance, regardless of their participation in the program. For example, a study conducted by Pain (2016) explored the relationship between the voluntary nature of remediation programs and students’ grades and completion rates, finding a decrease in math and English course grades after remediation became voluntary. Researchers should therefore consider selection bias when assessing the program effectiveness. This can be addressed by using an experimental approach or, if that is not feasible, employing carefully designed matched experiments to minimize selection bias (Gopalan et al., 2020; Slavin, 2002) or matching techniques such as Propensity Score Matching (PSM) (Adelson, 2013; Rosenbaum & Rubin, 1983). Consequently, decisions regarding how background variables are identified and measured, models used, stratification techniques, and effect estimation methods should be carefully planned (Fan & Nowell, 2011; Steiner et al., 2011). Other techniques to address selection bias include systematic sampling (Creswell & Creswell, 2023), statistical tests of group equivalence, or adding covariates in the analysis (Graham & Kurlaender, 2011).
1.1.3. Differences in Academic Content
Program academic content, completion criteria, and credits or placement in subsequent courses can also impact how students engage with the program and their post-program success. Most SBPs focus on mathematics and English because these subjects are foundational across most activities in HEIs (Henry et al., 2014; Peters, 2023). However, other programs focus on courses with low retention rates or high failure rates among first-year students (e.g., Harrington et al., 2016). Some programs include formative quizzes or tests to help students reflect on their learning (e.g., Gleghorn & Stwalley, 2011), which can also impact their performance at the end of the SBP, as students have the opportunity to address misconceptions identified during these evaluation (Morris et al., 2021).
Finally, students’ motivation to complete the program changes when completion is tied to a grade or placement in an advanced course (Chamberlin et al., 2023; Demszky et al., 2024; Rodríguez Rincón et al., 2024). Students who have an incentive to complete the program will differ in their engagement and effort from those who are intrinsically motivated to learn for skill improvement and college preparation.
1.2. Prior Research and Existing Knowledge
Despite the variation among different implementations of SBPs, research on specific programs shows that these programs can positively impact students’ experiences during their first year (Barth et al., 2021), persistence in higher education (Ikuma et al., 2019) and pass rates (Wathington et al., 2011). However, findings on the effectiveness of SBPs are mixed and often inconclusive (Calcagno & Long, 2009; Odeleye & Santiago, 2019), making it difficult to evaluate their overall effectiveness. A Randomized Control Trial (RCT) conducted by Barnett et al. (2012) in eight HEIs found that the programs did not affect the average number of credits attempted or earned. However, they did improve completion rates for first-year college-level courses in math and writing, but no evidence suggested an effect on persistence.
Nevertheless, there have been efforts to systematically collect evidence on SBPs. For example, Ashley et al. (2017) reported the goals of 30 STEM programs, categorized these goals into academic success, psychosocial, and department-level objectives, and evaluated the SBP’s success in meeting institutional goals. Finally, regarding the effect on academic outcomes in STEM majors, especially in GPA and retention rates, Bradford et al. (2021) synthesized 16 studies in the first meta-analysis of SBPs and reported that program participation has a moderate positive effect on first-year academic achievement. Similarly, the report by What Works Clearinghouse only found one study that met the group design standards (U.S. Department of Education, Institute of Education Sciences, What Works Clearinghouse, 2016).
Regarding methodological aspects, previous reviews and meta-analyses have identified several issues in evaluating the effectiveness of SBPs. For example, Odeleye and Santiago (2019) highlighted the need for research that focuses on longitudinal and quantitative assessments of SBPs and compares participants’ outcomes with those of a control group. Sablan (2014) also emphasized this issue and stressed the importance of considering differences and similarities among SBPs. Bradford et al. (2021) noted the challenge posed by the limited availability of detailed information about the methodologies employed.
Despite the limited number of studies addressing the effects of SBP on academic achievements, a significant gap persists in understanding the methodological approaches used to evaluate these programs. While earlier systematic reviews have identified common methodological limitations, no comprehensive review has systematically compared the diverse methodologies employed. This scoping review aims to provide an overview of how the literature assesses the evidence of the academic impact of SBPs offered to incoming students of STEM-related majors. Specifically, this review focuses on key elements such as outcomes of interest, study design (experimental or non-experimental), analytical approaches, confounding variables controlled in the analysis, sample size, and data collection period.
We focused solely on quantitatively measured academic outcomes for two main reasons. First, this provides a solid foundation for organizing existing research using comparable indicators relevant to SBP evaluation and HEI accountability (Mfengu & Raju, 2024; U.S. Department of Education, 2023). Second, there is significant diversity and little consensus on SBP implementation and its effects on students, particularly regarding non-academic outcomes (e.g., programs with role-modeling components influencing STEM identity). By emphasizing academic results, we also align with a consensus established by prior systematic reviews of SBP effectiveness (Bradford et al., 2021; Barnett et al., 2012).
Finally, the scope of this review is not to synthesize the overall effectiveness of SBPs but rather to identify studies that meet minimum methodological criteria for evaluating these programs. By building upon prior reviews and studies, this paper offers a more in-depth examination of the methods used and provides guidance for future researchers on how similar programs have assessed SBP effectiveness.
2. Materials and Methods
We selected the Systematic Scoping Review as the methodology for this review because we aimed to provide an overview of the evidence in the literature regarding the quantitative assessment of SBPs for STEM majors. To conduct this review, we followed the Preferred Reporting Items for Systematic Reviews and Meta-Analyses extension for Scoping Reviews (PRISMA-ScR) guidelines to establish the search protocol and selection criteria for relevant studies (Tricco et al., 2018). Specifically, we organized the review into the standard stages of (i) search and identification of records, (ii) eligibility definition using the Population Intervention Comparison and Outcome (PICO) framework (National Institute for Health and Care Excellence [NICE], 2014) to define inclusion/exclusion criteria, (iii) screening for title and abstract and duplicate removal, (iv) data extraction and (v) data synthesis of the studies included in the review (Tricco et al., 2018).
2.1. Search
To capture literature from leading engineering and STEM education journals, we searched a broad range of databases, including ERIC, Web of Science (Core Collection), SciELO, and ProQuest. Each database was queried using combinations of keywords and phrases, including logical connectors (AND, OR) with refined search parameters or filters applied to the title and abstract fields (see Table 1).

Table 1.
Databases and their corresponding search strategy.
Because we wanted to map the full range of methodological approaches, we chose not to apply a time restriction to publication dates. The last search was conducted in January 2025. We also searched Google Scholar for additional relevant papers to extend the search coverage to gray literature. Finally, as a supplementary search, we manually reviewed programs included in the review by Ashley et al. (2017) and the meta-review conducted by Bradford et al. (2021) to ensure inclusion of as many programs as possible.
2.2. Inclusion/Exclusion Criteria
The PICO framework helped organize the relevant parameters of the review. We structured the inclusion/exclusion criteria by clearly defining the population of interest, the intervention or activity undertaken by the population, comparisons or alternatives to the intervention, and outcomes measured. Table 2 provides a detailed description of each aspect.
Table 2.
PICO framework for the current review.
Generally speaking, all studies included in this review compare an experimental group with a control group and quantitatively evaluate outcomes related to academic performance. The SBP must occur exclusively during the summer prior to the fall semester and should not extend beyond that period. As part of the inclusion criteria, we limited the review to reports published in English. Table 3 outlines the reasons for exclusion.
Table 3.
Exclusion criteria reasons and description.
2.3. Study Selection/Screening
The screening, the second phase, followed the inclusion criteria described earlier. Two reviewers independently screened each record from the search results to assess its eligibility for inclusion. When there was no consensus on whether to include the paper in the next phase, the team met and discussed until an agreement was reached.
2.4. Data Extraction
For each eligible study, we extracted information about the SBP and the methodology used to assess the relevant outcomes. SBP-related information included the institution offering the program, country, program duration, eligibility criteria or target students, selection criteria, participants’ major, subject taught, voluntariness, and program name. For the methodology, we recorded the verbatim research question or aim of the study, dependent variables, covariates or controlled variables, study design, analytical approach, description of treatment and control groups, number of participants in each group, number of cohorts involved, and the data collection timeframe. Finally, we extracted the publication type and the publisher’s name.
2.5. Data Synthesis
We aimed to describe the methodological aspects of the literature in three areas: (1) outcomes of interest, (2) study design and analytical approach, and (3) participants and cohorts involved. Some papers addressed several research questions with different data collection sources and methods that could complement the methods described in the eligibility criteria. Those complementary methods and analyses, such as pre-post comparisons of the SBPs, were not reported in the results.
For outcomes, only quantitative academic measures were extracted. When a paper reported multiple measures using different methods, only the information about the methods related to the outcome of interest were extracted.
For study design, we adopted a broader categorization of research methods based on biomedical traditions. Thus, each record was classified as descriptive or analytical, depending on whether it aimed to establish or quantify a relationship between variables (Noordzij et al., 2009; Ranganathan & Aggarwal, 2018, 2019). Descriptive designs summarized outcomes using traditional descriptive statistics such as mode, mean, or median (Loeb et al., 2017; Thompson, 2006). These studies primarily identified trends in experimental and control groups but did not attempt to establish statistical relationships. Analytical studies were further categorized as experimental or observational. In experimental studies, participants were randomly assigned to experimental or control groups, whereas in non-experimental studies, no random assignment occurred (Creswell & Creswell, 2023; Thompson, 2006). Observational studies involved no manipulation of variables or participation in the intervention (i.e., SBP). For analytical studies, we identified whether they controlled for confounding variables beyond the group variable. If no controls were applied, outcomes were examined solely in relation to group assignment (experimental vs. control). We also recorded data analysis techniques, including statistical tests, models, and descriptive statistics.
Finally, the total number of participants in each group was aggregated, including cases where papers reported multiple control groups or disaggregated participant numbers by cohort.
3. Results
3.1. Search Results
As shown in Figure 1, we initially retrieved 4041 papers across the four databases of interest. After removing duplicates, 3789 records were considered for screening. Next, we applied the screening criteria described in Table 2, which resulted in a subset of 226 articles for further review. Ultimately, 37 reports were extracted (33 from the database search and 4 from the supplementary search). Figure 1 also illustrates the frequency of exclusion reasons for the remaining 192 studies that were not included.
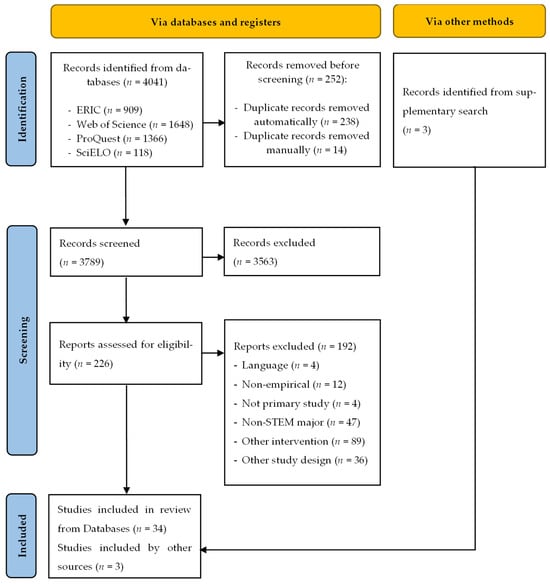
Figure 1.
PRISMA flow diagram.
The 37 reports corresponded to a total of 33 unique programs included in this review: one report considered two different programs (Wheatland, 2002), and three programs were considered by multiple reports—four reports (Cançado et al., 2018; J. Reisel et al., 2011, 2012, 2014), two reports (Wischusen et al., 2010; Wischusen & Wischusen, 2007), and two reports (Chariker et al., 2013; Hieb et al., 2015).
3.2. Description of the Included SBP
Table 4 summarizes the SBPs included in the review and their distinctive characteristics. As expected, most of the SBPs considered in the review were offered by institutions in the US. Although we identified several programs across different regions in the screening phase, only four met the inclusion criteria: two in Germany (Eitemüller & Habig, 2020; Zorn et al., 2011), one in Australia (Schmid et al., 2012), and one in Italy (Bozzi et al., 2019). Program duration ranged from five days to ten weeks, with an equal number of SBPs (n = 13) lasting one or two weeks and five or six weeks. Most SBPs were in-person (n = 23); five included both online and in-person activities, and only three were entirely online.
Table 4.
Description of included studies.
The eligibility criteria for participation varied significantly across programs. Programs established criteria based on academic performance, students’ major, targeted subgroups, and/or specific curricular courses. Most programs (n = 18) set criteria related to academic readiness, such as high school grades (e.g., Jackson et al., 2024), standardized entrance tests (e.g., Lecocke et al., 2019), or placement tests (e.g., Chingos et al., 2017); four of these programs targeted high-performing students (Jefferson et al., 2013; Steadman et al., 2014; Wheatland, 2002). Seven programs were open to all incoming students within the targeted major, and eight programs were restricted to specific subgroups, such as female students (e.g., Fletcher et al., 2001), particular ethnic groups (e.g., Pritchard et al., 2016), socioeconomically disadvantaged students (e.g., Oppenheimer et al., 2020), or first-generation students (e.g., Tomasko et al., 2016). Finally, four programs based their eligibility on enrollment in a single course during the first or second semester, such as Calculus I or Linear Algebra (Zorn et al., 2011) or introductory Biology Science (Wischusen et al., 2010; Wischusen & Wischusen, 2007).
As Table 4 shows, most SBPs targeted Engineering majors (n = 17), with strong emphasis on math preparation. Nine SBPs included STEM majors, two were oriented to SEM (Science, Engineering and Math) (Jura & Gerhardt, 2022; Wheatland, 2002), two targeted health science majors: biomedical basic science (Oppenheimer et al., 2020) and nursing (Pritchard et al., 2016), one focused on biology students (Wischusen et al., 2010; Wischusen & Wischusen, 2007), two were open to any student requiring an introductory chemistry course (Schmid et al., 2012; Eitemüller & Habig, 2020), and one targeted Computer Science students (Dones et al., 2022). Consequently, most programs included math classes (n = 20). Interestingly, four SBPs for Engineering majors did not include traditional first-year engineering courses (i.e., math, chemistry, or physics); instead, they focused their programs on interdisciplinary engineering topics (Steadman et al., 2014), engineering design (Kornreich-Leshem et al., 2015), electrical and computer engineering alongside mechanical and materials engineering (Jefferson et al., 2013) and engineering design combined with entrepreneurial thinking (Jackson et al., 2024). Other courses taught in the SBPs included chemistry (n = 12), computer science or introductory computing/software (n = 7), English (n = 5), physics (n = 4) and biology (n = 2).
Regarding program voluntariness, we identified only one program that required participation as a condition for college admission (Cançado et al., 2018; J. Reisel et al., 2011, 2012, 2014).
3.3. Methodological Considerations When Assessing SBP
Although programs varied in implementation, we identified common methodological elements used to assess them. We organized these aspects into outcomes, study design, analytical approach, and participant/cohort characteristics.
3.3.1. Outcomes
The evidence reported primarily addresses short-term effects of SBPs, with the most common outcome being performance in subsequent courses related to summer content (n = 21), followed by retention or graduation rates (n = 20) and GPA (n = 12). Interestingly, Chingos et al. (2017) also evaluated placement into higher-level courses as an academic outcome.
Regarding the first outcome which focuses on subsequent course performance, the program’s evaluation was based on students’ performance in the corresponding course during the first term or year. That performance was measured using course passing rate (e.g., Oppenheimer et al., 2020), average score on the final exam (e.g., Dockter et al., 2017; Harrington et al., 2016), average course grade or the percentage of students achieving a specific grade threshold, such as C or better (e.g., J. Reisel et al., 2011, 2012, 2014) or DFWI rates, the percentage of students who receive a D or F or withdraw (e.g., Jura & Gerhardt, 2022).
The second outcome was the retention or graduation rates. These outcomes were calculated as the likelihood of graduation (e.g., Murphy et al., 2010), as the ratio of students who remained in the same major, or as the percentage of students on track to graduate within a timeframe (e.g., Wischusen et al., 2010). Of the 16 studies reporting retention or graduation rates, 15 focused on retention; two reported both (Cançado et al., 2018; Oppenheimer et al., 2020); and only one assessed graduation (Murphy et al., 2010). Accordingly, the studies assessing graduation rates collected data longitudinally, from 3 to 6 years after SBP participation; the rest of the studies collected data at the end of the fall semester (e.g., Steadman et al., 2014), at the end of the first year (e.g., Pritchard et al., 2016), or after four years (e.g., Tomasko et al., 2016).
Finally, academic performance was also measured using cumulative GPA (e.g., Wheatland, 2002), GPA in a particular semester(s) (e.g., Wischusen & Wischusen, 2007) or GPA for a set of courses aligned with the SBP content, such as math courses (e.g., Chingos et al., 2017) or gatekeeper STEM courses (e.g., Jackson et al., 2024). These studies usually collected data at the end of the first semester or year.
3.3.2. Study Design and Analytical Approach
Considering study design, the evidence was mainly analytical, i.e., observational or experimental. We classified 14 SBP studies as descriptive. There is almost no experimental study design in the analytical studies, as only two studies randomly assigned participants to the experimental or control group (Dockter et al., 2017; Chingos et al., 2017). All other analytical studies were classified as observational (or non-experimental).
Within the analytical papers, most studies assessed the outcome of interest while controlling for one or more variables. However, we identified 10 studies whose inferential analyses did not involve any controlling variables. Figure 2 summarizes the study design and analytical approach used in the included studies.
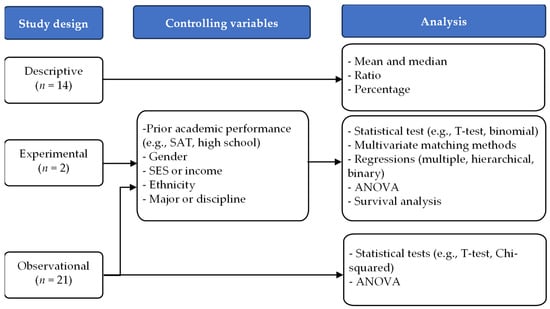
Figure 2.
Summary of different study designs and analytical approaches of included studies.
We found 14 studies that followed a descriptive approach. Those studies analyzed the academic performance of the SBP participants by comparing the experimental and control groups using traditional descriptive methods. For categorical outcomes, such as course grade or retention rate, the comparisons were made by examining the percentage of students in each group (e.g., Gleghorn & Stwalley, 2011). For numerical variables, such as GPA or exam scores, the mean (and sometimes the standard deviation) and median statistics were used to describe and compare the two groups (e.g., Pritchard et al., 2016). Studies that followed a descriptive approach provided insights by capturing trends and patterns. However, these studies offered limited analytical depth, as they primarily rely on percentages, ratios, and means (and occasionally standard deviations), with no manipulation of variables, which restricted interpretation. As a result, these studies lacked the ability to establish causal relationships or explain the underlying factors behind observed differences.
There were 23 analytical studies, most of which used an observational design (n = 21). Of the 21 studies, three used a matching technique to obtain two balanced groups because they did not use randomization to allocate participants to the groups (Kornreich-Leshem et al., 2015; Wischusen & Wischusen, 2007; Jackson et al., 2024). Some studies (including the experimental ones) also considered confounding variables that could explain students’ academic performance besides participation in the SBP. Those considering confounding variables used previous academic performance as a covariate or variable to be controlled in their analysis. Academic performance was often measured using external instruments such as SAT scores (e.g., Doerr et al., 2014), American College Testing (ACT) scores (e.g., Cançado et al., 2018), or high school GPA (e.g., Chingos et al., 2017). In contrast, in the study by Schmid et al. (2012), the variable controlled was students’ self-reported experiences and prior knowledge about the subject to be taught in the SBP; similarly, Evans (2014) considered the pre-health concentration of subjects. Furthermore, the studies by Hieb et al. (2015) and Jura and Gerhardt (2022) used an internal validated instrument developed by department members to measure academic readiness. After academic performance, the other covariates used were gender (n = 5), Socio-Economic Status (SES) or income (n = 2), ethnicity (n = 2), and major or discipline (n = 2). Interestingly, Hieb et al. (2015) also considered metacognitive and motivational factors in their analysis. Finally, three studies addressed the limitation of the lack of randomization in the groups by controlling for confounding variables: in their multivariate matching method, Kornreich-Leshem et al. (2015) considered SAT Math score, high school GPA, gender, ethnicity, and major as the covariates to be matched between treatment and control groups; Wischusen and Wischusen (2007) and Jackson et al. (2024) also considered high school GPA, ACT or SAT scores, major, and gender.
For studies that did not control for confounding variables, the analytical approach primarily involved statistical tests comparing means or proportions between groups. ANOVA or T-test was used for numerical outcomes, such as GPA (e.g., Steadman et al., 2014), whereas the Chi-squared test was used for proportions, such as graduation rate (e.g., Tomasko et al., 2016). Although no explicit controlling variables were used, five studies considered different control groups to compare to the treatment group. Oppenheimer et al. (2020) considered two groups as controls to compare to the treatment; one was students who were accepted into the program but did not attend, and the second was the group of students who applied but were not selected. Wischusen et al. (2010) considered students who were in the subsequent course in the fall, as well as those who remained on the program’s waiting list. Jura and Gerhardt (2022) considered three groups: the first group included all students taking the subsequent courses in the fall and spring terms, the second consisted of students who were borderline cases for SBP based on the readiness exam, and the third included students who scored high in the readiness exam and were placed in a higher math course. Tomasko et al. (2016) compared the treatment of all university STEM-major students and also compared it to that of all underrepresented STEM-major students. Finally, Gleason et al. (2010) compared the treatment group with students with similar math placement scores.
Table 5 shows that experimental studies provided evidence of short-term outcomes but not retention or graduation rates. The observational studies with controlling variables provide evidence for all three outcomes equally, whereas there is a slight tendency towards retention or graduation rates in the observational studies that did not control for confounding variables.
Table 5.
Study design, analytical approach disaggregated by outcomes.
3.3.3. Study Participants and Cohorts of Students
The aggregated number of subjects included in the studies also varied considerably. The average size of the treatment group was 123, compared to 1204 for the control group. Of the studies considered, 13 had more than 100 participants in the treatment group. For those studies that reported the number of subjects in the control group, 20 studies had more than 100 participants. Seven of those had more than 1000 subjects in the aggregated control groups.
Regarding the cohorts, most studies reported on a single cohort (n = 10). Twelve studies had two or three cohorts. Notably, one study considered 6 cohorts of students (Evans, 2014) and three studies considered 10 or more cohorts (Murphy et al., 2010; Oppenheimer et al., 2020; Walter & Wade, 2024).
As expected, the studies that used matching techniques (Kornreich-Leshem et al., 2015; Jackson et al., 2024; Wischusen & Wischusen, 2007) included a rather equal proportion of participants and non-participants. The same is true for the experimental study conducted by Chingos et al. (2017).
4. Discussion
This systematic scoping review aimed to collect and describe the methodological aspects of quantitative studies assessing the academic outcomes of SBPs for STEM majors. This review examined 37 studies that assessed the academic outcomes of SBPs intended to support first-year incoming students of STEM majors. The programs were only for students right after their high school education and ended before the fall semester started. As part of the eligibility criteria, the studies had a control group for the treatment condition. Our findings indicate a lack of studies that use an experimental or non-experimental approach and control for participants’ background variables. Only two studies followed an experimental design. Of the remaining studies, only three considered matching techniques to balance disparities in background variables. We also found that the academic evaluation relies on graduation or retention rates, GPA and course performance, as previous research also pointed out. The course performance included course passing, course grade, final examination pass or grade of all the courses in the subsequent Fall semester or for a particular course that the SBPs provided bridging to, such as Calculus I or Algebra.
This review has some caveats. First, we focused only on the academic effects of the SBPs, which means this review considers only quantitative outcomes. Other outcomes, such as STEM identity, motivation, and self-efficacy are missing and could provide new insights into how SBPs impact other aspects of students’ trajectories. Second, this review does not assess whether the included interventions positively or negatively affect students’ academic outcomes, as we focused on describing the methods used to assess those programs. Third, although we attempted to look for gray literature, we mainly included studies published in journals, conferences, and book chapters and only one doctoral thesis. Nevertheless, there is a possibility of publication bias. Also, the programs included in this paper have relatively short durations and do not include programs where the SBPs are part of an extensive intervention. Finally, although the scope of this paper is not to provide a validated categorization of methodologies, we used common terminology of classification of different study designs in a broader perspective, following biomedical categories: descriptive or analytical (observational or experimental) (Ranganathan & Aggarwal, 2019). Other classifications could be used; for example, Hsu (2005) included in their review 30 different research methods/designs and 34 data analysis procedures.
Implications and Next Steps
Consistently with our review objective, we found that the current body of evidence is predominantly descriptive or observational, with limited control of variables and only two experimental designs. As research implications, these results provide limited evidence supporting a causal interpretation of SBPs’ impacts on academic performance (Loeb et al., 2017; Odeleye & Santiago, 2019; Baron, 2004; Thompson, 2006). This imbalance toward non-experimental designs aligns with previous attempts to systematize the body of evidence (Bradford et al., 2021). Although the aim of scoping reviews is to map the current body of evidence and does not evaluate the quality of the studies or effect of the interventions (such as the meta-review of Bradford et al., 2021), we note that the five studies with the highest methodological rigor, the two experimental designs and three observational designs with matching techniques to balance the participants’ background variables, are quite diverse in terms of implementation and effectiveness. For instance, two programs focused on Engineering design; one reported positive effects on retention and academic performance in courses, especially among women (Jackson et al., 2024), while the other found no impact on GPA (Kornreich-Leshem et al., 2015). Similarly, among two experimental studies on online SBPs, one reported that SBP did not improve math skills (Chingos et al., 2017), whereas the other found positive effects on chemistry performance and persistence (Dockter et al., 2017). The meta-analysis conducted by Bradford et al. (2021) found that program participation had a medium-sized effect on first-year overall grade point average and first-year university retention. This review complements Bradford et al. (2021)’s work by including more studies (37 vs. 16), synthesizing and categorizing approaches, allowing us to map which SBPs have been studied in which ways and how their varied implementations may influence outcomes. Finally, this lack of evidence could lead to erroneous conclusions due to inadequate comparisons (Slavin, 2020; Odeleye & Santiago, 2019; Baron, 2004).
More than twenty selected studies did not control for any variables in their analysis. This research gap highlights the need for more research to support evidence-based decision-making, providing valuable information for HEIs and policymakers. This kind of research should not only consider more rigorous methodology but also explore different outcomes other than graduation or retention rates, GPA and course performance, include more longitudinal measures, and evaluate how different aspects of the implementation impact on the students’ academic achievement, such as duration, online vs. in-person materials, presence of social activities, or voluntariness of the program.
Also, due to the study design, there is a clear imbalance in the subjects considered in the treatment and control groups. On average, there are 10 times as many subjects in the control group as in the treatment group. In this aspect, researchers are encouraged to find subjects to fairly compare the treatment when evaluating these programs. Some studies considered students who applied to the program but were not accepted, thereby reducing selection bias surrounding these programs. Other studies used different techniques to match a student who did not participate with a participant who is similar in terms of background variables.
Finally, the clear dominance of U.S studies reflects the distinctive role of Developmental Education (DE) in the American higher education system (Arendale, 2011; McGee et al., 2021) and the use of placement/selection practices that may not generalize to other educational systems (Conley, 2008; Tempelaar et al., 2011; Büchele et al., 2024). Future research should address how differences in educational institutions and culture affect the delivery of different SBPs and their effects on students’ academic outcomes, using more rigorous methods of analysis, considering local conditions, and changes in the social environment that could make prior evidence irrelevant (Berliner, 2002). Thus, different approaches to research design and analytical choices are needed to provide evidence.
For practice implications, this review revealed a wide variety of SBP implementations, as programs across institutions differ in duration, target population, ultimate goals, and program structure. Thus, HEIs supporting this type of intervention should be aware that the uniqueness of each program makes it impossible to conduct a one-size-fits-all program evaluation. Therefore, institutions that wish to evaluate their programs should consider how similar programs have been proven effective in achieving their goals and aspirations. This review provides an initial list of programs that have been academically evaluated, along with their corresponding methodological approaches. For this review, the only two studies that used an experimental design were fully online (Dockter et al., 2017; Chingos et al., 2017). Thus, this review highlights the limitations of the evidence to guide policy and practice. Second, HEIs that wish to evaluate their programs should be aware that, although the true experimental design is the “gold standard” for providing high-quality evidence, it is not always possible due to ethical considerations, especially when the program targets historically excluded groups. HEIs must consider that, to understand why SBPs impact students’ academic achievement, both causal and descriptive analyses are needed. Although experimental research usually has higher costs, these costs need to be funded by institutions (Gopalan et al., 2020). Finally, due to the inclusion criteria of this review, we did not consider interventions that took place beyond the summer preceding the start of class, or if they did, they did not isolate the effect of the SBP on students’ academic performance. To do so, more complex techniques are needed to attribute the real impact of the intervention to students’ academic performance and, therefore, evaluate if a program is effective in reaching its goals.
Finally, the evidence gathered in this review has limitations for guiding policy. Many SBPs rely on federal or governmental support. This contrasts with the goal of different initiatives that have supported and prioritized the development of evaluation and evidence-informed policy and practice, such as the Institute of Education Sciences (IES) in the USA, the Education Endowment Foundation (EEF) in England (Slavin, 2020) and the European Commission (EC) (Pellegrini & Vivanet, 2021), which can help HEI be held accountable to different actors (Macheridis & Paulsson, 2021). As Liu and Kringos (2025) state, creating clear and accessible pathways from secondary to higher education, such as many SBPs reported here, is an area where governments can make a significant impact.
Author Contributions
Conceptualization, D.C.D., A.A., P.M. and V.L.; Formal analysis, D.C.D., A.A. and P.M.; Supervision: V.L.; Writing—original draft, D.C.D., A.A. and P.M.; Writing—review & editing, D.C.D., A.A., P.M. and V.L. All authors have read and agreed to the published version of the manuscript.
Funding
This research received no external funding.
Institutional Review Board Statement
Not applicable.
Informed Consent Statement
Not applicable.
Data Availability Statement
The original contributions presented in this study are included in the article. Further inquiries can be directed to the corresponding author.
Acknowledgments
This research was carried out with funding provided by the Faculty of Engineering of McMaster University. The authors acknowledge the support of the FUSE office.
Conflicts of Interest
The authors declare no conflicts of interest.
Abbreviations
The following abbreviations are used in this manuscript:
| SBP | Summer Bridge Program |
| STEM | Science, Technology, Engineering and Math |
| HEI | Higher Education Institution |
| SAT | Scholastic Aptitude Test |
| ACT | American College Testing |
| GPA | Grade Point Average |
| SES | Socio-Economic Status |
| PSM | Propensity Score Matching |
| RCT | Randomized Control Trial |
References
- Adelson, J. L. (2013). Educational research with real-world data: Reducing selection bias with propensity score analysis. Practical Assessment, Research, and Evaluation, 18(1), 15. [Google Scholar] [CrossRef]
- Arendale, D. R. (2011). Then and now: The early years of developmental education. Research and Teaching in Developmental Education, 27(2), 58–76. [Google Scholar]
- Ashley, M., Cooper, K. M., Cala, J. M., & Brownell, S. E. (2017). Building better bridges into STEM: A synthesis of 25 years of literature on STEM summer bridge programs. CBE—Life Sciences Education, 16(4), es3. [Google Scholar] [CrossRef]
- Barnett, E. A., Bork, R. H., Mayer, A. K., Pretlow, J., Wathington, H. D., & Weiss, M. J. (2012). Bridging the gap: An impact study of eight developmental summer bridge programs in Texas (pp. 1–90). National Center for Postsecondary Research. [Google Scholar]
- Baron, J. (2004). Identifying and implementing education practices supported by rigorous evidence: A user friendly guide. Journal for Vocational Special Needs Education, 26, 40–54. [Google Scholar]
- Barth, J., Dunlap, S., Bolland, A., McCallum, D., & Acoff, V. (2021). Variability in STEM summer bridge programs: Associations with belonging and STEM self-efficacy. Frontiers in Education, 6, 667589. [Google Scholar] [CrossRef]
- Berliner, D. C. (2002). Comment: Educational research: The hardest science of all. Educational Researcher, 31(8), 18–20. [Google Scholar] [CrossRef]
- Bettinger, E. P., & Long, B. T. (2005). Addressing the needs of under-prepared students in higher education: Does college remediation work? (NBER Working Paper No. 11325). National Bureau of Economic Research. [Google Scholar]
- Blackburn, H. (2017). The status of women in STEM in higher education: A review of the literature 2007–2017. Science & Technology Libraries, 36(3), 235–273. [Google Scholar] [CrossRef]
- Boatman, A., & Long, B. T. (2018). Does remediation work for all students? How the effects of postsecondary remedial and developmental courses vary by level of academic preparation. Educational Evaluation and Policy Analysis, 40(1), 29–58. [Google Scholar] [CrossRef]
- Botella, C., Rueda, S., López-Iñesta, E., & Marzal, P. (2019). Gender Diversity in STEM Disciplines: A multiple factor problem. Entropy, 21(1), 30. [Google Scholar] [CrossRef]
- Boyce, A. S. (2017). Lessons learned using a values-engaged approach to attend to culture, diversity, and equity in a STEM program evaluation. Evaluation and Program Planning, 64, 33–43. [Google Scholar] [CrossRef]
- Bozzi, M., Balossi, B., Di Sieno, L., Ganzer, L., Gondoni, P., Genco, I., Minnai, C., Pini, A., Rezoagli, F., Zanoletti, M., & Zani, M. (2019, November 11–13). Securing freshmen’s learning through a physics refresher course: A breakthrough experience at Politecnico Di Milano. 12th Annual International Conference of Education, Research and Innovation (WOS:000530109202048) (pp. 2237–2243), Seville, Spain. [Google Scholar] [CrossRef]
- Bradford, B. C., Beier, M. E., & Oswald, F. L. (2021). A meta-analysis of university STEM summer bridge program effectiveness. CBE—Life Sciences Education, 20(2), ar21. [Google Scholar] [CrossRef] [PubMed]
- Brandon, P. R., & Singh, J. M. (2009). The strength of the methodological warrants for the findings of research on program evaluation use. American Journal of Evaluation, 30(2), 123–157. [Google Scholar] [CrossRef]
- Burt, B. A., Stone, B. D., Motshubi, R., & Baber, L. D. (2023). STEM validation among underrepresented students: Leveraging insights from a STEM diversity program to broaden participation. Journal of Diversity in Higher Education, 16(1), 53–65. [Google Scholar] [CrossRef]
- Büchele, S., Berndt, S., & Felix, A. (2024). Voluntary math remediation for STEM and economics disciplines—Who is attending at all? Evidence from Germany. European Journal of Higher Education, 14(1), 60–79. [Google Scholar] [CrossRef]
- Calcagno, J. C., & Long, B. T. (2009). Evaluating the impact of remedial education in Florida community colleges: A quasi-experimental regression discontinuity design. NCPR brief (pp. 1–5). National Center for Postsecondary Research. [Google Scholar]
- Cançado, L., Reisel, J. R., & Walker, C. M. (2018). Impacts of a summer bridge program in engineering on student retention and graduation. Journal of STEM Education: Innovations and Research, 19(2), 26–31. [Google Scholar]
- Chamberlin, K., Yasué, M., & Chiang, I.-C. A. (2023). The impact of grades on student motivation. Active Learning in Higher Education, 24(2), 109–124. [Google Scholar] [CrossRef]
- Chariker, J., Ralston, P., Hieb, J., & Wilkins, C. (2013, June 23–26). An analysis of two interventions designed to improve student performance in engineering calculus. 2013 ASEE Annual Conference (WOS:000367454806005) (pp. 23.148.1–23.148.12), Atlanta, GA, USA. [Google Scholar] [CrossRef]
- Chingos, M. M., Griffiths, R. J., & Mulhern, C. (2017). Can low-cost online summer math programs improve student preparation for college-level math? Evidence from randomized experiments at three universities. Journal of Research on Educational Effectiveness, 10(4), 794–816. [Google Scholar] [CrossRef]
- Chouinard, J. A., & Cousins, J. B. (2009). A review and synthesis of current research on cross-cultural evaluation. American Journal of Evaluation, 30(4), 457–494. [Google Scholar] [CrossRef]
- Cohen, L., Manion, L., & Morrison, K. (2008). Research methods in education (6th ed). Routledge. [Google Scholar]
- Conley, D. T. (2008). Rethinking college readiness. New Directions for Higher Education, 2008(144), 3–13. [Google Scholar] [CrossRef]
- Creswell, J. W., & Creswell, J. D. (2023). Research design: Qualitative, quantitative, and mixed methods approaches (6th ed.). SAGE. [Google Scholar]
- Demszky, D., Wang, R., Geraghty, S., & Yu, C. (2024, March 18–22). Does feedback on talk time increase student engagement? Evidence from a randomized controlled trial on a math tutoring platform. 14th Learning Analytics and Knowledge Conference (pp. 632–644), Kyoto, Japan. [Google Scholar] [CrossRef]
- Dockter, D., Uvarov, C., Guzman-Alvarez, A., & Molinaro, M. (2017). Improving preparation and persistence in undergraduate STEM: Why an online summer preparatory chemistry course makes sense. In Online approaches to chemical education (WOS:000418983800002) (Vol. 1261, pp. 7–33). American Chemical Society. [Google Scholar] [CrossRef]
- Doerr, H. M., Ärlebäck, J. B., & Costello Staniec, A. (2014). Design and effectiveness of modeling-based mathematics in a summer bridge program. Journal of Engineering Education, 103(1), 92–114. [Google Scholar] [CrossRef]
- Dones, J., Martin, F., Lu, J., & Mir, F. (2022, October 8–11). Design and impact of a near peer-led computer science summer bridge program. 2022 IEEE Frontiers in Education Conference (FIE) (pp. 1–9), Uppsala, Sweden. [Google Scholar] [CrossRef]
- Eitemüller, C., & Habig, S. (2020). Enhancing the transition?—Effects of a tertiary bridging course in chemistry. Chemistry Education Research and Practice, 21(2), 561–569. [Google Scholar] [CrossRef]
- Enriquez, A. (2011, June 26–29). Strengthening the STEM pipeline through an intensive review program for math placement testing. 2011 ASEE Annual Conference & Exposition (WOS:000378522700009) (pp. 22.1328.1–22.1328.18), Vancouver, BC, Canada. [Google Scholar] [CrossRef]
- Erickson-Ludwig, A., & Clyne, A. (2014, June 15–18). Summer diversity program enhances female and underrepresented minority student academic performance and retention in the Drexel University College of Engineering. 2014 ASEE Annual Conference (WOS:000383780002027) (pp. 24.1140.1–24.1140.11), Indianapolis, IN, USA. [Google Scholar] [CrossRef]
- Evans, B. D. (2014). Factors that affect academic performance and retention status: A study of a summer bridge program [Ph.D. thesis, Auburn University]. Available online: https://www.proquest.com/dissertations-theses/factors-that-affect-academic-performance/docview/2778651375/se-2 (accessed on 19 August 2024).
- Fan, X., & Nowell, D. L. (2011). Using propensity score matching in educational research. Gifted Child Quarterly, 55(1), 74–79. [Google Scholar] [CrossRef]
- Fletcher, S. L., Newell, D. C., Newton, L. D., & Anderson-Rowland, M. R. (2001, June 24–27). The WISE summer bridge program: Assessing student attrition, retention, and program effectiveness. 2001 ASEE Annual Conference (pp. 6.1053.1–6.1053.7), Albuquerque, NM, USA. [Google Scholar] [CrossRef]
- GEM Report UNESCO. (2024). Global education monitoring report 2024, gender report: Technology on her terms. GEM Report UNESCO. [Google Scholar] [CrossRef]
- Gibson, S., Brinkley, K., Griggs, L., James, B., Smith, M., Schwitzerlett, M., Waller, L., & Hargraves, R. (2021). Implementing a hybrid summer transition program. Frontiers in Education, 6, 674337. [Google Scholar] [CrossRef]
- Gilbert, M. B. (1982, November 1). An enrichment program for migrant students: MENTE/UOP. Council for Exceptional Children Conference on the Bilingual Exceptional Child (pp. 1–59), Phoenix, AZ, USA. [Google Scholar]
- Gleason, J., Boykin, K., Johnson, P., Bowen, L., Whitaker, K. W., Micu, C., Raju, D., & Slappey, C. (2010). Integrated engineering math-based summer bridge program for student retention. Advances in Engineering Education, 2(2), n2. [Google Scholar]
- Gleghorn, V., & Stwalley, C. (2011, June 26–29). Impact of transition programs on the retention of underrepresented students. 2011 ASEE Annual Conference & Exposition (WOS:000378523002042) (pp. 22.1267.1–22.1267.8), Vancouver, BC, Canada. [Google Scholar] [CrossRef]
- Gopalan, M., Rosinger, K., & Ahn, J. B. (2020). Use of quasi-experimental research designs in education research: Growth, promise, and challenges. Review of Research in Education, 44(1), 218–243. [Google Scholar] [CrossRef]
- Graham, S. E., & Kurlaender, M. (2011). Using propensity scores in educational research: General principles and practical applications. The Journal of Educational Research, 104(5), 340–353. [Google Scholar] [CrossRef]
- Hagler, M. A., Christensen, K. M., & Rhodes, J. E. (2024). A longitudinal investigation of first-generation college students’ mentoring relationships during their transition to higher education. Journal of College Student Retention: Research, Theory & Practice, 25(4), 791–819. [Google Scholar] [CrossRef]
- Hanlon, E. H., & Schneider, Y. (1999, April 19–23). Improving math proficiency through self efficacy training. 1999 Annual Meeting of the American Educational Research Association (pp. 1–12), Montreal, QB, Canada. [Google Scholar]
- Harackiewicz, J. M., & Priniski, S. J. (2018). Improving student outcomes in higher education: The science of targeted intervention. Annual Review of Psychology, 69(1), 409–435. [Google Scholar] [CrossRef]
- Harrington, M. A., Lloyd, A., Smolinski, T., & Shahin, M. (2016). Closing the gap: First year success in college mathematics at an HBCU. Journal of the Scholarship of Teaching and Learning, 16(5), 92–106. [Google Scholar] [CrossRef]
- Henry, D. L., Baltes, B., & Nistor, N. (2014). Examining the relationship between math scores and English language proficiency. Journal of Educational Research and Practice, 4(1), 11–29. [Google Scholar]
- Herrmann, S. D., Adelman, R. M., Bodford, J. E., Graudejus, O., Okun, M. A., & Kwan, V. S. Y. (2016). The effects of a female role model on academic performance and persistence of women in STEM courses. Basic and Applied Social Psychology, 38(5), 258–268. [Google Scholar] [CrossRef]
- Hieb, J. L., Lyle, K. B., Ralston, P. A. S., & Chariker, J. (2015). Predicting performance in a first engineering calculus course: Implications for interventions. International Journal of Mathematical Education in Science and Technology, 46(1), 40–55. [Google Scholar] [CrossRef]
- Hood, S., Hopson, R. K., & Frierson, H. T. (Eds.). (2015). Continuing the journey to reposition culture and cultural context in evaluation theory and practice. Information Age Publishing, Inc. [Google Scholar]
- Hornsby, D. J., & Osman, R. (2014). Massification in higher education: Large classes and student learning. Higher Education, 67(6), 711–719. [Google Scholar] [CrossRef]
- Hsu, T. (2005). Research methods and data analysis procedures used by educational researchers. International Journal of Research & Method in Education, 28(2), 109–133. [Google Scholar] [CrossRef]
- Ikuma, L. H., Steele, A., Dann, S., Adio, O., & Waggenspack, W. N. (2019). Large-scale student programs increase persistence in STEM fields in a public university setting. Journal of Engineering Education, 108(1), 57–81. [Google Scholar] [CrossRef]
- Jackson, C. R., Whittington, D., & Bradley, T. (2024). Pre-college summer program in entrepreneurial and design thinking influences STEM success for African American students. Journal of STEM Outreach, 7(2), n2. [Google Scholar] [CrossRef]
- James, K. A., & James, C. E. (2025). Routes to STEM: Toward making science education more accessible and inclusive. Race Ethnicity and Education, 1–22. [Google Scholar] [CrossRef]
- Jefferson, G., Steadman, S., Thomas, T., & Hsiao, K. (2013, June 23–26). Novel program for engineering student retention. 2013 ASEE Annual Conference (WOS:000367454804003) (pp. 23.932.1–23.932.10), Atlanta, GA, USA. [Google Scholar] [CrossRef]
- Johnson, J. M. (2016). Managing transitions, building bridges: An evaluation of a summer bridge program for African American scientists and engineers. Journal for Multicultural Education, 10(2), 206–216. [Google Scholar] [CrossRef]
- Johnson, M., Sprowles, A., Overeem, K., & Rich, A. (2013). A place-based learning community: Klamath connection at Humboldt State University. Learning Communities: Research & Practice, 5(2), 1–19. [Google Scholar]
- Johnston, C., Tang, J., Arvand, A., & Lee, P. (2021). Attracting and retaining latina women in an undergraduate biology program: Benefits of NSF S-STEM support. Journal of STEM Education: Innovations and Research, 22(4), 39–46. [Google Scholar]
- Jordan, W. J. (2010). Defining equity: Multiple perspectives to analyzing the performance of diverse learners. Review of Research in Education, 34(1), 142–178. [Google Scholar] [CrossRef]
- Jura, M., & Gerhardt, I. (2022). Examining the effectiveness of an online summer bridge course to prepare students for calculus. PRIMUS: Problems, Resources, and Issues in Mathematics Undergraduate Studies, 32(7), 755–763. [Google Scholar] [CrossRef]
- Kassaee, A. M., & Rowell, G. H. (2016). Motivationally-informed interventions for at-risk STEM students. Journal of STEM Education: Innovations and Research, 17(3), 77–84. [Google Scholar]
- Kearns, L. R. (2012). Student assessment in online learning: Challenges and effective practices. Journal of Online Learning and Teaching, 8(3), 198–208. [Google Scholar]
- Kilian, N. G. (2010). Self-efficacy and remediation of higher education mathematics students. Dissertation Abstracts International Section A: Humanities and Social Sciences, 70(12-A), 4615. [Google Scholar]
- Kitchen, J. A., Sadler, P., & Sonnert, G. (2018). The impact of summer bridge programs on college students’ STEM career aspirations. Journal of College Student Development, 59(6), 698–715. [Google Scholar] [CrossRef]
- Knight, D., Sullivan, J., Kotys-Schwartz, D., Myers, B., Louie, B., Luftig, J., Zarske, M., & Hornback, J. (2013, June 23–26). The impact of inclusive excellence programs on the development of engineering identity among first-year underrepresented students. 2013 ASEE Annual Conference (WOS:000375256301070) (pp. 23.1207.1–23.1207.17), Atlanta, GA, USA. [Google Scholar] [CrossRef]
- Kornreich-Leshem, H., Brewe, E., Hazari, Z., Milani, M., Potvin, G., & Kramer, L. (2015). Evaluation of a summer bridge program using multivariate matching (WOS:000375147300041) (pp. 175–178). American Association of Physics Teachers. [Google Scholar] [CrossRef]
- Kroshus, E., Hawrilenko, M., & Browning, A. (2021). Stress, self-compassion, and well-being during the transition to college. Social Science & Medicine, 269, 113514. [Google Scholar] [CrossRef]
- Lecocke, M., Shaw, J., Martines, I., Wolff, N., Cano, P., & Tobares, V. (2019). Jump start: Lessons learned from a mathematics bridge program for STEM undergraduates. Journal of STEM Education: Innovations and Research, 19(5), 40–45. [Google Scholar]
- Lisberg, A., & Woods, B. (2018). Mentorship, mindset and learning strategies: An integrative approach to increasing underrepresented minority student retention in a STEM undergraduate program. Journal of STEM Education: Innovations and Research, 19(3), 14–19. [Google Scholar]
- Liu, Z., & Kringos, N. (2025). What prevents STEM universities from widening participation? A systematic literature review on global experiences. International Journal of STEM Education, 12(1), 63. [Google Scholar] [CrossRef]
- Loeb, S., Dynarski, S., McFarland, D., Morris, P., Reardon, S., & Reber, S. (2017). Descriptive analysis in education: A guide for researchers (NCEE 2017-4023). National Center for Education Evaluation and Regional Assistance. [Google Scholar]
- Macheridis, N., & Paulsson, A. (2021). Tracing accountability in higher education. Research in Education, 110(1), 78–97. [Google Scholar] [CrossRef]
- Maringe, F., & Sing, N. (2014). Teaching large classes in an increasingly internationalising higher education environment: Pedagogical, quality and equity issues. Higher Education, 67(6), 761–782. [Google Scholar] [CrossRef]
- Masjutina, S., Stearns, E., & Bottia, M. C. (2025). An analysis of students who represent missed opportunity for diversifying STEM fields. Science Education, 109(5), 1287–1312. [Google Scholar] [CrossRef]
- McGee, B. S., Williams, J. L., Armstrong, S. L., & Holschuh, J. P. (2021). Gateways, not gatekeepers: Reclaiming the narrative for developmental education. Journal of Developmental Education, 44(2), 2–10. [Google Scholar]
- Mfengu, A., & Raju, J. (2024). Challenges with measures used for assessing research impact in higher education institutions. South African Journal of Science, 120(7/8), 1–6. [Google Scholar] [CrossRef]
- Morris, R., Perry, T., & Wardle, L. (2021). Formative assessment and feedback for learning in higher education: A systematic review. Review of Education, 9(3), e3292. [Google Scholar] [CrossRef]
- Murphy, T. E., Gaughan, M., Hume, R., & Moore, S. G., Jr. (2010). College graduation rates for minority students in a selective technical university: Will participation in a summer bridge program contribute to success? Educational Evaluation and Policy Analysis, 32(1), 70–83. [Google Scholar] [CrossRef] [PubMed]
- Nachbauer, M., & Kyriakides, L. (2020). A review and evaluation of approaches to measure equity in educational outcomes. School Effectiveness and School Improvement, 31(2), 306–331. [Google Scholar] [CrossRef]
- National Institute for Health and Care Excellence [NICE]. (2014). Developing NICE guidelines: The manual NICE process and methods. Available online: www.nice.org.uk/process/pmg20 (accessed on 2 December 2025).
- Noordzij, M., Dekker, F. W., Zoccali, C., & Jager, K. J. (2009). Study designs in clinical research. Nephron Clinical Practice, 113(3), c218–c221. [Google Scholar] [CrossRef]
- Odeleye, B.-G., & Santiago, J. (2019). A review of some diverse models of summer-bridge programs for first-generation and at-risk college students. Administrative Issues Journal Education Practice and Research, 9(1), 35–47. [Google Scholar] [CrossRef]
- OECD. (2018). How is the tertiary-educated population evolving? (Vol. 61). Education Indicators in Focus. [Google Scholar] [CrossRef]
- OECD. (2021). Why do more young women than men go on to tertiary education? (Vol. 79). Education Indicators in Focus. [Google Scholar] [CrossRef]
- Oppenheimer, S., Mills, J., Zakeri, A., Payte, T., Lidgi, A., & Zavala, M. (2020). An approach to improving student success in science, technology, engineering, and mathematics (STEM) career pathways. Ethnicity & Disease, 30(1), 33–40. [Google Scholar] [CrossRef]
- Owen, J. M. (2020). Program evaluation: Forms and approaches (3rd ed.). Routledge, Taylor & Francis Group. [Google Scholar]
- Pain, K. D. (2016). Voluntary remediation in Florida: Will it blaze a new trail or stop student pathways? Community College Journal of Research and Practice, 40(11), 927–941. [Google Scholar] [CrossRef]
- Pellegrini, M., & Vivanet, G. (2021). Evidence-based policies in education: Initiatives and challenges in Europe. ECNU Review of Education, 4(1), 25–45. [Google Scholar] [CrossRef]
- Peters, D. L. (2023, March 24–25). Engineering strong bridges: Review of college bridge programs. 2023 ASEE North Central Section Conference, Morgantown, WV, USA. [Google Scholar] [CrossRef]
- Pong, W., Enriquez, A., Shahnasser, H., Chen, C., Ozer, N., Cheng, A., Jiang, H., & Mahmoodi, H. (2011, June 26–29). Enhancing the interest, participation, and retention of underrepresented students in engineering through a summer engineering institute. 2011 ASEE Annual Conference & Exposition (WOS:000378522702045) (pp. 22.624.1–22.624.16), Vancouver, BC, Canada. [Google Scholar]
- Pritchard, T. J., Perazzo, J. D., Holt, J. A., Fishback, B. P., McLaughlin, M., Bankston, K. D., & Glazer, G. (2016). Evaluation of a summer bridge: Critical component of the leadership 2.0 program. Journal of Nursing Education, 55(4), 196–202. [Google Scholar] [CrossRef]
- Ranganathan, P., & Aggarwal, R. (2018). Study designs: Part 1—An overview and classification. Perspectives in Clinical Research, 9(4), 184. [Google Scholar] [CrossRef]
- Ranganathan, P., & Aggarwal, R. (2019). Study designs: Part 3—Analytical observational studies. Perspectives in Clinical Research, 10(2), 91. [Google Scholar] [CrossRef] [PubMed]
- Reed, M. J. (2016). University massification and teaching non-traditional university students. In J. Arvanitakis, & D. J. Hornsby (Eds.), Universities, the citizen scholar and the future of higher education (pp. 137–154). Palgrave Macmillan UK. [Google Scholar] [CrossRef]
- Reisel, J., Jablonski, M., Kialashaki, A., & Hosseini, H. (2014, June 15–18). Analysis of the impact of participation in a summer bridge program on mathematics course performance by first-semester engineering students. 2014 ASEE Annual Conference (WOS:000383779701024) (pp. 24.183.1–24.183.14), Indianapolis, IN, USA. [Google Scholar] [CrossRef]
- Reisel, J., Jablonski, M., Rineck, L., Munson, E., & Hosseini, H. (2012, June 10–13). Analysis of math course placement improvement and sustainability achieved through summer bridge program. 2012 ASEE Annual Conference (WOS:000380250100007) (pp. 25.186.1–25.86.16), San Antonio, TX, USA. [Google Scholar] [CrossRef]
- Reisel, J., Rineck, L., Jablonski, M., Munson, E., & Hosseini, H. (2011, June 26–29). Evaluation of the Impacts of Math Course Placement Improvement Achieved through a Summer Bridge Program. 2011 ASEE Annual Conference & Exposition (WOS:000378520700021) (pp. 22.654.1–22.654.13), Vancouver, BC, Canada. [Google Scholar] [CrossRef]
- Reisel, J. R., Jablonski, M., Hosseini, H., & Munson, E. (2012). Assessment of factors impacting success for incoming college engineering students in a summer bridge program. International Journal of Mathematical Education in Science and Technology, 43(4), 421–433. [Google Scholar] [CrossRef]
- Rodríguez Rincón, Y., Munárriz, A., & Magreñán Ruiz, A. (2024). A new approach to continuous assessment: Moving from a stressful sum of grades to meaningful learning through self-reflection. The International Journal of Management Education, 22(3), 101072. [Google Scholar] [CrossRef]
- Rosenbaum, P. R., & Rubin, D. B. (1983). The central role of the propensity score in observational studies for causal effects. Biometrika, 70(1), 41–55. [Google Scholar] [CrossRef]
- Rosenthal, L., Levy, S. R., London, B., Lobel, M., & Bazile, C. (2013). In pursuit of the MD: The impact of role models, identity compatibility, and belonging among undergraduate women. Sex Roles, 68(7–8), 464–473. [Google Scholar] [CrossRef]
- Rovai, A. P. (2003). A practical framework for evaluating online distance education programs. The Internet and Higher Education, 6(2), 109–124. [Google Scholar] [CrossRef]
- Sablan, J. R. (2014). The challenge of summer bridge programs. American Behavioral Scientist, 58(8), 1035–1050. [Google Scholar] [CrossRef]
- Schmid, S., Youl, D. J., George, A. V., & Read, J. R. (2012). Effectiveness of a short, intense bridging course for scaffolding students commencing university-level study of chemistry. International Journal of Science Education, 34(8), 1211–1234. [Google Scholar] [CrossRef]
- Scott, A., & Martin, A. (2014). Perceived barriers to higher education in science, technology, engineering and mathematics. Journal of Women and Minorities in Science and Engineering, 20(3), 235–256. [Google Scholar] [CrossRef]
- Sheffield, A., Morgan, H. G., & Blackmore, C. (2018). Lessons learned from the STEM entrepreneurship academy. Journal of Higher Education Outreach and Engagement, 22(3), 185–200. [Google Scholar]
- Slavin, R. E. (2002). Evidence-based education policies: Transforming educational practice and research. Educational Researcher, 31(7), 15–21. [Google Scholar] [CrossRef]
- Slavin, R. E. (2020). How evidence-based reform will transform research and practice in education. Educational Psychologist, 55(1), 21–31. [Google Scholar] [CrossRef]
- Steadman, S., Jefferson, G., Thomas, T., & Hsiao, K. (2014, June 15–18). Impacting first year engineering retention. 2014 ASEE Annual Conference (WOS:000383779806064) (pp. 24.702.1–24.702.7), Indianapolis, IN, USA. [Google Scholar] [CrossRef]
- Steiner, P. M., Cook, T. D., & Shadish, W. R. (2011). On the importance of reliable covariate measurement in selection bias adjustments using propensity scores. Journal of Educational and Behavioral Statistics, 36(2), 213–236. [Google Scholar] [CrossRef]
- Stout, W. L., Jr. (2013). School level factors associated with Pennsylvania high schools that exceed PVAAS growth projections in reading (pp. 1–129). ProQuest LLC. [Google Scholar]
- Strayhorn, T. L. (2011). Bridging the pipeline: Increasing underrepresented students’ preparation for college through a summer bridge program. American Behavioral Scientist, 55(2), 142–159. [Google Scholar] [CrossRef]
- Tempelaar, D., Rienties, B., Kaper, W., Giesbers, B., van Gastel, L., van de Vrie, E., van der Kooij, H., & Cuypers, H. (2011). Effectiveness of a voluntary postsecondary remediation program in mathematics. Pedagogische Studien, 88(4), 231–248. [Google Scholar]
- Thompson, B. (2006). Foundations of behavioral statistics: An insight-based approach. Foundations of Behavioral Statistics: An Insight-Based Approach, xii, 457. [Google Scholar]
- Tomasko, D. L., Ridgway, J. S., Waller, R. J., & Olesik, S. V. (2016). Research and teaching: Association of summer bridge program outcomes with STEM retention of targeted demographic groups. Journal of College Science Teaching, 45(4), 90–99. [Google Scholar] [CrossRef]
- Trautwein, C., & Bosse, E. (2017). The first year in higher education—Critical requirements from the student perspective. Higher Education, 73(3), 371–387. [Google Scholar] [CrossRef]
- Tricco, A. C., Lillie, E., Zarin, W., O’Brien, K. K., Colquhoun, H., Levac, D., Moher, D., Peters, M. D. J., Horsley, T., Weeks, L., Hempel, S., Akl, E. A., Chang, C., McGowan, J., Stewart, L., Hartling, L., Aldcroft, A., Wilson, M. G., Garritty, C., … Straus, S. E. (2018). PRISMA extension for scoping reviews (PRISMA-ScR): Checklist and explanation. Annals of Internal Medicine, 169(7), 467–473. [Google Scholar] [CrossRef]
- UNESCO. (2017). Cracking the code girls’ and women’s education in science, technology, engineering and mathematics (STEM). UNESCO. [Google Scholar] [CrossRef]
- U.S. Department of Education. (2023). Non-regulatory guidance: Using evidence to strengthen education investments. Available online: https://www.ed.gov/sites/ed/files/fund/grant/about/discretionary/2023-non-regulatory-guidance-evidence.pdf (accessed on 2 December 2025).
- U.S. Department of Education, Institute of Education Sciences, What Works Clearinghouse. (2016). Supporting postsecondary success intervention report: Summer bridge programs. What Works Clearinghouse. Available online: https://ies.ed.gov/ncee/wwc/Docs/InterventionReports/wwc_summerbridge_071916.pdf (accessed on 2 December 2025).
- Venezia, A., & Jaeger, L. (2013). Transitions from high school to college. The Future of Children, 23(1), 117–136. [Google Scholar] [CrossRef]
- Verdone, M., Joshi, M., Bodenstine, T., Green, J., Lynch, S., Gettig, J., & Fjortoft, N. (2020). An online, self-directed pharmacy bridging course for incoming first-year students. American Journal of Pharmaceutical Education, 84(7), 892–896. [Google Scholar] [CrossRef]
- Walter, H., & Wade, E. (2024). STEM persistence among women, non-binary, and students of color: A longitudinal study of the impact of a residential science-oriented summer bridge program. Journal of STEM Education: Innovations and Research, 25(2), 15–20. [Google Scholar] [CrossRef]
- Wathington, H. D., Barnett, E. A., Weissman, E., Teres, J., Pretlow, J., & Nakanishi, A. (2011). Getting ready for college: An implementation and early impacts study of eight Texas developmental summer bridge programs. Executive summary (pp. 1–16). National Center for Postsecondary Research. [Google Scholar]
- Weatherton, Y., Kruzic, A., Isbell, B., Peterson, L., Tiernan, J., & Pham, V. (2011, June 26–29). Mathematics performance and first year retention of students in engineering learning communities. 2011 ASEE Annual Conference & Exposition (WOS:000378523007021) (pp. 22.1047.1–22.1047.16), Vancouver, BC, Canada. [Google Scholar] [CrossRef]
- Whalin, R., & Pang, Q. (2014, June 15–18). Emerging impact on graduation rates/times from a summer engineering enrichment program. 2014 ASEE Annual Conference (WOS:000383779705045) (pp. 24.475.1–24.475.11), Indianapolis, IN, USA. [Google Scholar] [CrossRef]
- Wheatland, J. (2002, June 16–19). Factors that affect grade point average and retention status of first time science, engineering, and mathematics students at Morgan State University, an historically black university. 2002 Annual Conference Proceedings (pp. 7.554.1–7.554.23), Montreal, QB, Canada. [Google Scholar] [CrossRef]
- Wischusen, S. M., & Wischusen, E. W. (2007). Biology Intensive Orientation for Students (BIOS): A biology “boot camp”. CBE—Life Sciences Education, 6(2), 172–178. [Google Scholar] [CrossRef]
- Wischusen, S. M., Wischusen, E. W., & Pomarico, S. M. (2010). Impact of a short pre-freshman program on retention. Journal of College Student Retention: Research, Theory and Practice, 12(4), 429–441. [Google Scholar] [CrossRef]
- Zorn, E., Jeschke, S., Kato, A., & Pfeiffer, O. (2011). Pre-freshmen students gearing up with early bird. In Automation, communication and cybernetics in science and engineering 2009/2010 (WOS:000285168000034) (p. 379). Springer. [Google Scholar] [CrossRef]


Disclaimer/Publisher’s Note: The statements, opinions and data contained in all publications are solely those of the individual author(s) and contributor(s) and not of MDPI and/or the editor(s). MDPI and/or the editor(s) disclaim responsibility for any injury to people or property resulting from any ideas, methods, instructions or products referred to in the content. |
© 2026 by the authors. Licensee MDPI, Basel, Switzerland. This article is an open access article distributed under the terms and conditions of the Creative Commons Attribution (CC BY) license.