Abstract
This study demonstrates how Structural Topic Modeling (STM) can be used to analyze qualitative student comments in conjunction with quantitative student evaluation of teaching (SET) scores, providing a scalable framework for interpreting student evaluations of teaching. Drawing on 286,203 open-ended comments collected over fourteen years at a large U.S. research university, we identify eleven latent topics that characterize how students describe instructional experiences. Unlike traditional topic modeling methods, STM allows us to examine how topic prevalence varies with course and instructor attributes, including instructor gender, course discipline, enrollment size, and numeric SET scores. To illustrate the utility of the model, we show that topic prevalence aligns with SET ratings in expected ways and that students associate specific teaching attributes with instructor gender, though the effects are relatively small. Importantly, the direction and strength of topic–SET correlations are consistent across male and female instructors, suggesting shared student perceptions of effective teaching practices. Our findings underscore the potential of STM to contextualize qualitative feedback, support fairer teaching evaluations, inform institutional decision-making, and examine the relationship between qualitative student comments and numeric SET ratings.
1. Introduction
Student evaluations of teaching (SETs) have long played a central role in higher education, influencing decisions related to faculty promotion, tenure, and contract renewal. They also inform course design, pedagogical development, and broader institutional assessment. Since their widespread adoption in the mid-twentieth century (Miles & House, 2015), SETs have generated ongoing debate over their reliability, validity, and potential biases. Quantitative measures, especially numeric instructor ratings, remain the primary focus of many institutional reviews, yet these have been critiqued for being overly reductive and for failing to capture the complexity of teaching and learning (Martin, 2016; Theall & Franklin, 2001).
To gain a more nuanced understanding of teaching effectiveness, faculty and administrators ideally draw on a diverse portfolio of evidence, including quantitative ratings, qualitative comments, and peer observations. While peer observation offers valuable insights, it is often resource-intensive and difficult to implement at scale. In contrast, qualitative comments are already widely available. To make better use of this data, there is a need for a stronger research base examining the types of comments students typically leave: Do they focus on meaningful aspects of teaching, or on irrelevant details such as an instructor’s appearance? Equally important is understanding how qualitative comments align with quantitative SET scores. Do they vary in consistent and interpretable ways, potentially validating the quantitative scores, or do they diverge, and if so, what might that indicate?
While student-written comments can provide unique insights into instructional quality, classroom engagement, and student experience, these open-ended responses are rarely analyzed systematically. Manually reviewing thousands of comments is both labor-intensive and inconsistent, making it unlikely that institutions have a clear understanding of the types of comments students most frequently write, or how to interpret them in a broader context.
Topic modeling approaches such as Latent Dirichlet Allocation (LDA) offer a scalable method for analyzing large volumes of text and identifying the themes students most frequently mention. However, LDA is limited in its inability to incorporate document-level metadata. Structural Topic Modeling (STM) addresses this gap by allowing researchers to include covariates, such as instructor gender, course size, or academic division, directly in the modeling process (M. E. Roberts et al., 2014). STM not only identifies latent themes in student comments but also reveals how the prevalence of those themes varies systematically with observable course and instructor characteristics. This context-aware analysis provides a powerful framework for interpreting qualitative feedback in a way that is both rigorous and practically useful.
This paper contributes to the educational research in several ways: (1) we identify the most frequently occurring topics in a very large dataset of student comments, offering a benchmark that other institutions can use to contextualize their own evaluations; (2) we demonstrate that the valence of topics is positively correlated with SET scores, suggesting internal consistency between comment content and ratings; and (3) we explore how comment patterns differ—or do not differ—by covariates such as gender, providing a framework for institutions in the interpretation of qualitative feedback.
1.1. The Evolution of Student Evaluations of Teaching
Over the past two decades, a growing body of work has examined the potential biases embedded in SET scores, including gender biases. In the 2000s, much of this research relied on observational analyses to measure differences in scores between male and female instructors and other demographic differences (Fan et al., 2019; Martin, 2016; Miles & House, 2015; Theall & Franklin, 2001; Zipser et al., 2021). Researchers have also used quasi-experimental or experimental designs to attempt to measure bias (Binderkrantz et al., 2022; Boring, 2017; MacNell et al., 2015; Mengel et al., 2019; Mitchell & Martin, 2018; Zipser et al., 2021). The results vary greatly. Some papers found no gender differences and others found gender differences in specific disciplines, with course sizes, or with other covariates of courses such as required online teaching settings.
1.2. The Rise of Qualitative Comment Analysis
Recognizing the limitations of numeric ratings, recent research has turned to the qualitative comments included in SETs as a rich source of insight. These open-ended responses provide students with a space to articulate what they value about instruction in their own words, often offering nuance or context that is missing from Likert-scale items (Sun & Yan, 2023). Historically, such comments have been analyzed using manual coding schemes, either through open coding (Adams et al., 2022) or content analysis (Mitchell & Martin, 2018), but these approaches are time-intensive and difficult to scale.
More recent work has embraced computational methods for analyzing textual data, including natural language processing (NLP) and machine learning techniques. For instance, Gelber et al. (2022) and Okoye et al. (2021) applied keyword analysis and text mining approaches to large-scale comment datasets to identify gendered patterns. These studies highlight the potential of automated approaches but are often limited to word frequencies or sentiment analysis, which do not account for latent semantic structure.
1.3. Gender and Language in Student Comments
Prior studies that analyze the linguistic content of student comments consistently show that evaluations reflect, and possibly reinforce, broader social stereotypes. Gelber et al. (2022) found that female instructors were more often described as “helpful” or “kind,” whereas male instructors were described as “passionate” and “engaged.” Adams et al. (2022) reported that while demonstrating authority or subject expertise benefits male instructors, it may be detrimental for women, who are held to higher standards of emotional labor, clarity, and availability. Similarly, Mitchell and Martin (2018) found that gendered expectations were reflected in comment language, with women being more frequently labeled as “teachers” and men as “professors.”
Within education research, the application of STM remains relatively novel. Taylor et al. (2021) applied STM to analyze how student evaluations varied by gender, finding that comments for female instructors were more likely to focus on perceived care and accessibility, while those for male instructors emphasized content mastery and enthusiasm. While they found differences in 15 of the 20 topics identified by the STM analysis, substantively these differences were small (Taylor et al., 2021). Additionally, their study did not examine how topic prevalence related to numeric SET ratings, a key focus of our current analysis.
These findings underscore the importance of analyzing comment content not just in isolation, but alongside contextual variables such as gender, course type, and discipline. STM enables precisely this type of nuanced exploration.
1.4. Topic Modeling in Educational Research
Topic modeling offers a powerful solution for analyzing large volumes of textual data. One of the earliest and most widely used models, Latent Dirichlet Allocation (LDA), has been applied to student evaluations to identify recurring themes (Sun & Yan, 2023). In their study of nearly 80,000 comments, Sun and Yan (2023) found that LDA captured both expected themes, such as instructor clarity and engagement, and others that fall outside traditional SET metrics, such as course organization and enthusiasm. However, LDA has a key limitation: it cannot incorporate covariates or examine how topic prevalence varies across subgroups or contexts.
To address such limitations with LDA, M. E. Roberts et al. (2014) introduced Structural Topic Modeling (STM), a probabilistic model that enables the direct incorporation of document-level metadata (e.g., instructor gender, course type, or class size) into the topic estimation process. STM enables researchers to explore not only what students are saying, but also how these patterns differ based on observable characteristics. This innovation has broadened the scope of text analysis in the social sciences, with applications in political science, survey research, and education (M. E. Roberts et al., 2019).
Despite the growing use of STM, few studies in higher education have fully leveraged its potential to link qualitative student comments with quantitative SET scores. Our study fills this gap by applying STM to nearly 300,000 open-ended student comments and incorporating a broad set of covariates. We present thematic summaries for each topic derived from both human coders and a large language model (LLM) and examine how topic prevalence varies across instructional contexts.
1.5. Research Questions
The purpose of this study is to demonstrate how STM can be used to analyze qualitative student comments in conjunction with quantitative SET scores, providing a scalable framework for interpreting student evaluations of teaching.
We build on the work of Taylor et al. (2021), who used STM to identify gendered patterns in student comments after controlling for a range of factors, including course and instructor-level covariates. We adopt a similar methodological approach but extend it by incorporating numeric SET scores into the STM framework. This enables us to identify latent topics in student comments, examine how their prevalence varies across course and instructor characteristics, and, notably, evaluate how topic prevalence relates to numeric SET scores. This integration offers a more nuanced and contextualized understanding of how students evaluate teaching.
While our broader goal is to illustrate how applying STM to both qualitative comments and quantitative SET scores can inform institutional understanding of student evaluations, we use gender as a focal example to demonstrate the analytical utility of the approach. By integrating multiple dimensions of evaluation, this framework allows institutions to identify patterns that might otherwise go unnoticed and to examine concerns, such as gender differences, with greater nuance and empirical grounding.
To guide this case-study application of STM, we explore the following research questions:
- What latent topics emerge from student comments, and how do they vary across course and instructor contexts?
- How do these topics relate to quantitative SET scores, and what does this reveal about students’ perceptions of effective teaching?
- Do students emphasize different themes when evaluating male and female instructors, after accounting for course and instructor characteristics?
- Are the relationships between comment content and SET scores consistent across instructor gender?
2. Materials and Methods
2.1. Sample
We use student evaluation data from the Faculty of Arts and Sciences (FAS) and the School of Engineering and Applied Sciences (SEAS) at a large U.S. research university, written between Fall 2011 and Fall 2024, in response to the following question: “Please comment on this person’s teaching.”1
In addition to comments, students were also asked to submit SET scores on a scale between 1 and 5 as a response to the question “Evaluate your Instructor overall.”2 We treat the SET score as a numeric variable throughout the analysis. Analysis of this data was approved by the University’s institutional review board under IRB15-3886.
Our original dataset consisted of 287,300 individual student evaluation comments, covering 24,117 unique lecture and seminar course offerings across fourteen years.3 Each observation in the dataset includes metadata (i.e., covariates) about the course (such as the year and term the course was offered, the proportion of students taking it as an elective, enrollment numbers, and academic division) and the instructor (including gender, age as a proxy for career stage, and rank).4 Comments that contained only stop words, numbers, or punctuation were excluded from the dataset.5 This resulted in the final dataset of 286,203 observations, which we used to fit the STM.
2.2. Measures
Based on previous studies (Binderkrantz et al., 2022; Boring, 2017; MacNell et al., 2015; Mengel et al., 2019; Mitchell & Martin, 2018; Zipser et al., 2021), we note that the following covariates may affect SET quantitative scores and obfuscate other effects, such as potential gender differences. Using the same reasoning, we use these as control variables in the STM model and include them as covariate variables:
- Academic division of the course: Arts and Humanities (Humanities), Social Science, Science, Engineering and Applied Science (SEAS), First-Year Writing (FYW), First-Year Seminars (FRSM), and General Education (Gen Ed).
- Instructor rank: Professor, Associate Professor, Assistant Professor, Senior Non-Ladder Faculty (SrNonLadder), Non-Faculty of Arts and Sciences or SEAS (NonFAS), Visitor (Visiting faculty member), and Other (including lecturers, etc.).
- Instructor gender (self-reported).
- Instructor age (as a proxy for career stage).
- Instructor age squared.
- Natural Logarithm of enrollment.
- Fraction of students taking the course as an elective (as a proxy for whether the course is a requirement).
- Year and term that the course was taught.
Given that we are providing a framework for faculty and administrators to understand comments for a particular course, we only include covariates that are observable to the person reviewing the SET scores and comments. We do not include student characteristics, as they are not observable since the comments are anonymous (Zipser & Mincieli, 2024).
Lastly, because we are interested in determining whether there is a relationship among qualitative comments and quantitative SET scores, we include the following covariates in the STM:
- numeric SET score
- interaction between the numeric SET score and instructor gender.
2.3. Method
As previously mentioned, potential effects, such as gender differences in student comments, are estimated using the Structural Topic Model (STM), an extension of the Latent Dirichlet Allocation (LDA) model (M. E. Roberts et al., 2019).
The STM in our case involves a generative process of student evaluations that considers topic prevalence, informed by document-level metadata, the vector of covariates Xd associated with document (i.e., comment) d, as described above. For a given written comment d, the vector , which represents topic prevalence values, is modeled as being drawn from a logistic-normal distribution:
where and are matrices of parameters to be estimated. The entries of the vector sum to 1, reflecting the proportion of the document d associated with each thematic category.
The generating process continues with the topic assignment for each word in comment d. The n-th word is assigned a topic based on a multinomial distribution derived from :
Finally, the word generation process takes place. Given the topic assignment ,
where is a vector of word probabilities for topic k, estimated from the data.
2.3.1. Optimal Number of Topics
When using Structural Topic Modeling (STM) to uncover themes in open-ended student comments, an important modeling decision is to select the number of topics to include:
- If too few topics are specified, distinct themes may be merged into a single topic, resulting in broad or ambiguous classifications.
- If too many topics are specified, coherent ideas may become fragmented across multiple topics, introducing redundancy.
Because STM requires the number of topics to be specified prior to each model run, we evaluated a range of topic counts to identify the value of a hyperparameter, defined as the number of topics, that produced the most coherent and interpretable topic structure.
One of the goals of our analysis was to examine how topic prevalence varies with document-level covariates, such as SET scores. For this reason, we prioritized interpretability over predictive performance when selecting the number of topics.6
We relied on two interpretability metrics commonly used in topic modeling: semantic coherence, which assesses how often a topic’s most probable words co-occur (Mimno et al., 2011), and exclusivity, which reflects how a topic’s top words differentiate it from other topics (M. E. Roberts et al., 2014). These measures help determine whether topics form clear and non-overlapping themes, which is critical for meaningful covariate analysis.
To determine the optimal number of topics, we sought to maximize both semantic coherence and exclusivity as measures of interpretability (Mimno et al., 2011; M. E. Roberts et al., 2014).
Although previous studies have successfully used semantic coherence and exclusivity to refine the pool of candidate models for further evaluation (M. Roberts et al., 2016), we built on this approach by adopting a more systematic strategy: using multiple runs of the algorithm, we constructed a weighted combination of semantic coherence and exclusivity to select the best model, with weights designed to account for the fact that the two metrics are measured on different scales. To ensure comparability and balanced contributions from each metric, we first standardized them using z-scores and then averaged the resulting values to produce a single interpretability score for each model run:
Weighted score = 0.5 × z-score (coherence) + 0.5 × z-score (exclusivity).
We found that the model with 11 topics achieved the highest weighted score overall. Further details about the methodology for determining the optimal number of topics are provided in Appendix A.
2.3.2. Topic Labeling
To assign a description to each latent topic, we used summaries from three human readers and one generated by GPT-4o (OpenAI, 2024). Specifically, the human readers independently studied, for each topic, the one hundred de-identified comments with the highest prevalence for the given topic. This process was repeated for each of the eleven topics.7 The full list of topic descriptions obtained by the three independent human readers is presented in the first three columns (excluding the topic counter) of Table A1 in Appendix B.
To generate the GPT-4o summary, we submitted the same one hundred de-identified comments for each topic to a secure GPT-4o program provided by our university of study.8 For each topic, we presented GPT-4o with the top 100 evaluation comments with their corresponding prevalences and asked, in one sentence, to describe the most prominent latent theme of the 100 comments. The same prompt is given to both the human coders and GPT-4o. The exact prompt that was used to generate descriptions can be found in Appendix C. The column labeled “GPT-4o” in Appendix B. Table A1 in Appendix B presents the topic descriptions created by GPT-4o.
The last column of Table A1 presents the final latent topic labels constructed by the authors based on the four summaries for each topic. As an example, the four descriptions of the most prevalent topic, which ultimately was labeled by the authors as Engaging lectures; humorous lecturer, are listed verbatim below (see the first row of the table):
- “Enthusiastic, engaging, funny, and fantastic lecturer; fun and enjoyable course.” (Human)
- “Their lectures are very engaging, and they have a great sense of humor.” (Human)
- “Lectures are engaging.” (Human)
- “Students deeply appreciate instructors who deliver highly engaging, humorous, and enthusiastic lectures that make the material enjoyable and keep them actively interested in class.” (GPT-4o)
The topic labels are:
- Engaging lectures; humorous lecturer.
- Boring and disorganized lectures.
- Explains complex concepts effectively.
- Poor teaching and course design; disorganized instructor.
- Caring and enthusiastic instructor.
- Lectures are interesting and relevant.
- Praised as best professor.
- Facilitates effective discussion; encourages critical thinking; creates welcoming environment.
- Provides constructive, timely feedback.
- Passionate about subject; committed teacher.
- Approachability and accessibility of instructor.
As can be seen from Table A1 in Appendix B, there is strong consistency among the human and computer-generated summaries for all topics. This corresponds with Fuller et al. (2024), who found a high level of agreement between GPT and human instructors in analyzing SET. This alignment reassured us that the summaries and the final topic labels constructed from them provided an unbiased reflection of the underlying student comments. However, the LLM summaries are somewhat more expansive. Recall that comments are made up of multiple latent topics. This led us to wonder if human coders were better at honing in on the latent topic and/or more adept at summarizing it concisely.
The comment summaries are comprehensible and describe teaching styles and effectiveness in either favorable or unfavorable terms, except for Approachability and accessibility of instructor, a topic that two human coders (see Readers 2 and 3, Table A1) identified as bivalent in nature (the comments could cite the instructor as accessible or not accessible). However, the other reader, as well as GPT-4o, coded this topic as having only a positive valence (see Table A1); for these reasons, we assigned it a neutral valence in our label.
We also note that, while teaching characteristics do appear in the summaries, there are no latent topics concerning, for example, instructor appearance or other characteristics that might not be considered relevant to teaching effectiveness.
2.4. Estimating Effects of Covariates on Topic Prevalence
Using these topics, we analyze the correlations between the topic prevalence and covariates included in the model: instructor gender, academic division, instructor rank, year, age, whether the class was taken as an elective, class size, and numeric SET instructor score. To estimate these relationships, we draw repeated samples of topic prevalence from the posterior distribution for each comment, then regress those sampled values on the covariates to assess marginal effects and interaction terms.9
Specifically, to assess how topic prevalence varies with course and instructor attributes, we repeatedly draw samples of topic prevalence values from the posterior distribution for each document d as follows:
where and are the estimated coefficients of the STM. For each topic k, we then regress the sampled topic prevalence values on the document-level covariates Xd using the following model:
where represents the baseline prevalence of topic k, and is a vector of coefficients , , etc., that measures the effect of each covariate on topic prevalence. For example, captures the impact of having a female instructor (relative to the baseline category of male) on the prevalence of topic k, while represents the interaction effect between being a female instructor and the SET score on the prevalence of the topic.
To account for potential correlations in evaluations stemming from comments associated with the same faculty-course, we incorporated faculty-course clusters into the regression model.10
To assess the impact of various course and instructor attributes on topic prevalence, we estimate marginal effects from regressions that include covariates such as SET score, instructor gender, and their interaction, while controlling for other course and instructor characteristics. For each covariate-topic relationship, we evaluate whether the effect meets two criteria:
- Statistical significance: The effect is significantly different from zero at the 5% level (p < 0.05).
- Practical significance: The effect corresponds to a change in topic prevalence of at least 0.1 standard deviations (SD).
Defining effect size, or practical significance, in terms of standard deviations provides a consistent metric for interpreting the substantive importance of findings, especially given the variability in topic prevalence across themes (Mimno et al., 2011). This approach allows for direct comparison across topics and guards against over-interpreting statistically significant but trivial effects, particularly in large datasets. While there is no universally accepted benchmark for effect size in the literature, education research suggests that thresholds for a small effect typically range from 0.05 to 0.2 (Hill et al., 2008; Kraft, 2020); we use 0.1 as a reasonable cutoff within this range. We set this cutoff in advance to avoid being influenced by the results post hoc. These criteria are applied consistently to distinguish effects that are both statistically detectable and substantively meaningful.
All analyses were performed using Python version 3.6 and R version 3.5.2.
3. Results
In this section, we examine the average prevalence of each latent topic and analyze how each one correlates, positively or negatively, with quantitative SET scores. We then illustrate how topic prevalence varies across course characteristics, using academic division as an example. Finally, we investigate whether topic prevalence differs between male and female instructors and assess how these differences relate to SET scores by analyzing the interaction between instructor gender and SET ratings as predictors of topic prevalence.
3.1. Topic Prevalence
Figure 1 presents the topics ranked by their mean prevalence, as estimated by the STM. The most prevalent topic is the favorable topic, Engaging lectures; humorous lecturer, with a mean prevalence of 0.12. This is followed by the negative topic Boring and disorganized lectures (mean prevalence = 0.10), the favorable topic Explains complex concepts effectively (0.10), and another negative topic Poor teaching and course design; disorganized instructor (0.10). For full details, see Figure 1.
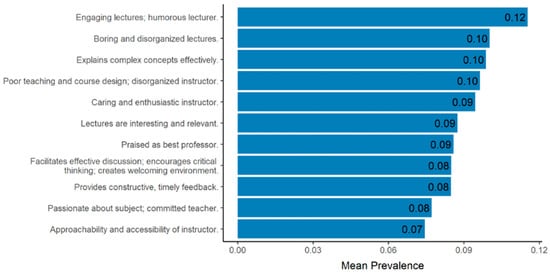
Figure 1.
Topics based on instructor evaluation comments by mean prevalence.
3.2. Correlation with SET Scores
We analyze whether the prevalence of each topic is positively or negatively correlated with quantitative SET scores, while holding other variables fixed. In most cases, the sentiment, or valence, of the topic aligns with the direction of its correlation with SET scores. For example, comments with a high prevalence of the topic Praised as best professor show both statistically and practically significant positive correlations with higher SET ratings (see Figure 2). Conversely, topics such as Boring and disorganized lectures are negatively correlated with SET scores.
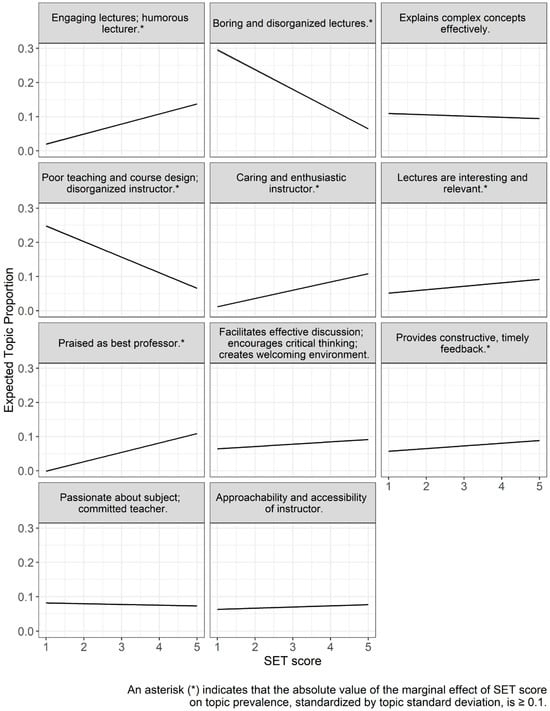
Figure 2.
Expected topic prevalence by SET score, with other covariates set at their mean values. Shaded regions around each line represent the 95% confidence intervals for the expected topic prevalence.
Topics Positively Correlated with SET (≥0.1 SD effect size):
- Engaging lectures; humorous lecturer
- Caring and enthusiastic instructor
- Lectures are interesting and relevant
- Praised as best professor
- Provides constructive, timely feedback
Topics Negatively Correlated with SET (≥0.1 SD effect size):
- Boring and disorganized lectures
- Poor teaching and course design; disorganized instructor
Topics with Small Effects (<0.1 SD effect size): These topics are statistically significant but do not meet our threshold for practical impact:
- Explains complex concepts effectively
- Facilitates effective discussion; encourages critical thinking; creates welcoming environment
- Passionate about subject; committed teacher
- Approachability and accessibility of instructor
(See Table A2 in Appendix D for full regression tables.)
While these relationships are correlational (conditional on other covariates as described above) and do not necessarily imply causation, they do indicate which instructional themes are most strongly associated with higher or lower SET ratings. Notably, Engaging lectures; humorous lecturer shows the largest positive association with SET scores, while Poor teaching and course design; disorganized instructor shows the largest negative association.
3.3. Academic Division and Course Type
Topic prevalence varies across academic divisions, as shown in Figure 3.
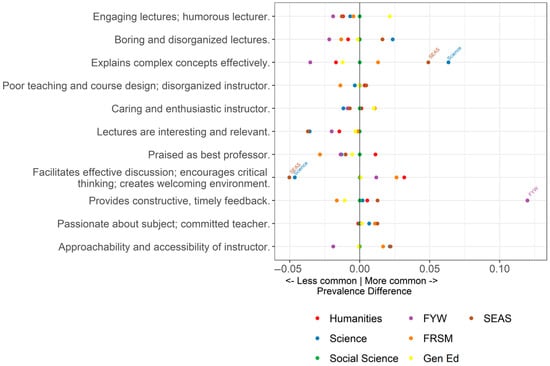
Figure 3.
Expected prevalence difference by academic division, relative to social science.
As expected, certain topics appear more frequently in some divisions than others. For example, the topic Facilitates effective discussion; encourages critical thinking; creates welcoming environment has a lower expected prevalence in the Science Division and the School of Engineering and Applied Sciences (SEAS), where lecture-based courses are more common. In contrast, this topic appears more frequently in the Humanities, where small seminar-style courses are more prevalent.
Conversely, the topic Explains complex concepts effectively is more prevalent in the Science Division and SEAS than in the Humanities, reflecting the technically complex nature of courses in those fields.
These findings underscore the importance of controlling for covariates like academic division when analyzing differences in topic prevalence by instructor gender, which we do in the next section. Because instructors are not uniformly distributed across divisions—there is, for example, a higher proportion of women in the Humanities compared to the Sciences or SEAS—failure to account for these structural differences could lead to misleading conclusions about gender-related patterns in student comments.
In the following section, we examine topic prevalence by gender, taking these contextual variables into account.
3.4. Variation by Instructor Gender
We now examine whether topic prevalence differs between female- and male-identifying instructors. To estimate the marginal effect of gender on the prevalence of each topic (k = 1, 2, …, 11), we test whether the difference in topic proportions between female and male instructors is statistically significant. The results are presented in Figure 4.11
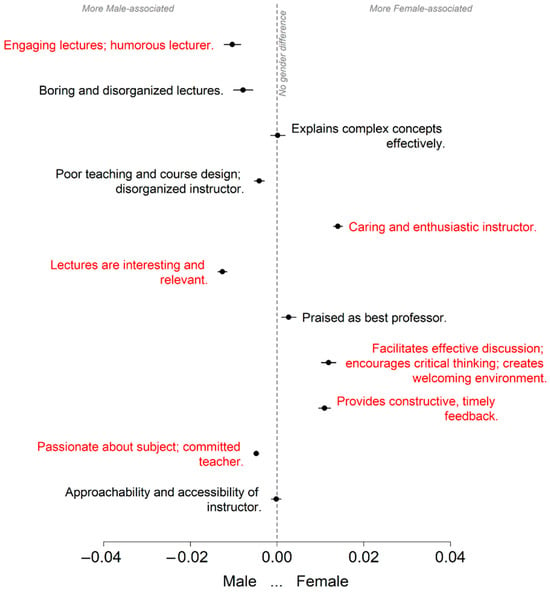
Figure 4.
Expected differences (F-M) in topic prevalence for female and male instructors by topic, accounting for covariates and the interaction with SET scores. Results are shown with the SET score set at the mean. Topics with both statistically and practically significant gender differences are labeled in red.
Each interval represents the estimated difference in topic prevalence (Female minus Male), with 95% confidence intervals plotted along the x-axis. The vertical dashed line indicates no difference. Topics that are more prevalent in comments about female instructors appear to the right of the line; those more prevalent for male instructors appear to the left. To isolate the effect of gender, the SET score is held at its mean value.
In Figure 4, topics that meet both statistical and practical significance thresholds are labeled in red. These represent the most meaningful gender-related differences in how students describe instructors in their written evaluations. In Table A3 in Appendix D, we present the marginal effects of gender, as displayed in Figure 4, denoted as the difference (F–M) in topic prevalence.
The following topics are statistically and practically significantly more prevalent in evaluations of female instructors, listed in order of decreasing absolute difference (Female minus Male, or F–M). For each topic, we report the absolute difference in prevalence both in percentage points and as a fraction of a standard deviation:
- Caring and enthusiastic instructor (1.4 percentage points, 0.25 SD)
- Facilitates effective discussion; encourages critical thinking; creates welcoming environment (1.2 percentage points, 0.16 SD)
- Provides constructive, timely feedback (1.1 percentage points, 0.16 SD)
Similarly, the following topics are statistically and practically significantly more prevalent for male instructors:
- Lectures are interesting and relevant (1.3 percentage points, 0.28 SD)
- Engaging lectures; humorous lecturer (1.0 percentage point, 0.15 SD)
- Passionate about subject; committed teacher (0.5 percentage points, 0.19 SD)
While these differences are statistically significant, it is worth noting that the practical significance or effect sizes are relatively small.
Interestingly, all topics that are statistically significantly more associated with female instructors (i.e., those with a positive F–M difference, or appearing to the right of the dashed line in Figure 4), have increased in prevalence over time. As we saw in an earlier section, these same topics are also positively correlated with SET scores. This finding supports our earlier analysis (Zipser et al., 2021), which showed that SET scores for female instructors have risen more quickly than those for male instructors in recent years. It also aligns with the increasing representation of women on the faculty.
We now examine whether the direction of the correlation (conditional on other covariates) between topic prevalence and SET scores is consistent for male and female instructors.
In Figure 5, across all topics, we find that the valence of the correlation between topic prevalence and SET scores is the same for both male and female instructors. In other words, for any given topic, higher SET scores are associated with either higher or lower topic prevalence for both genders, never in opposite directions.
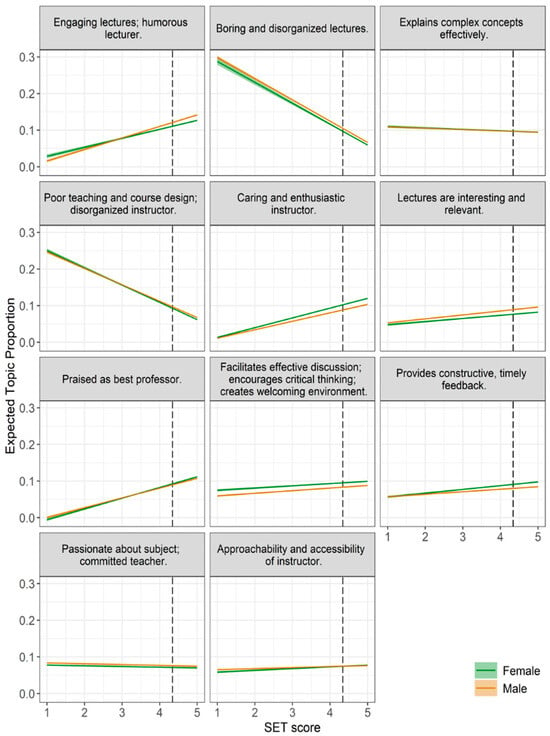
Figure 5.
Expected topic prevalence versus SET score for females (green lines) and males (orange lines). Other covariates are set at their mean values. Shaded regions around each line represent the 95% confidence intervals for the expected topic prevalence. The dashed line represents the mean SET score.
This consistency suggests that students tend to associate the same teaching characteristics with instructional quality, regardless of the instructor’s gender. Similarly, the traits that students view less favorably appear to be evaluated in the same way for both men and women. These findings reinforce the idea that certain instructional behaviors are broadly interpreted as either effective or ineffective, independent of gender. (To see the correlations between our covariates and topic prevalence, please see Figure A3, Figure A4, Figure A5, Figure A6 and Figure A7 in Appendix E).
4. Discussion
Using 286,203 student evaluation comments written over a fourteen-year period (Fall 2011 to Fall 2024) in response to the prompt “Please comment on this person’s teaching,” this study illustrates the value of Structural Topic Modeling (STM) for large-scale, systematic analysis of qualitative SET data in conjunction with quantitative evaluation scores. STM allows researchers to incorporate covariates, providing a more nuanced interpretation of comment content in context. Our analysis shows that latent comment topics correlate with quantitative SET scores and vary meaningfully across instructor and course attributes. These insights are particularly valuable for academic administrators seeking fairer and more comprehensive methods to evaluate teaching effectiveness.
This paper contributes to a growing body of research aimed at understanding the types of comments that most frequently appear in student evaluations. Such insights are especially valuable for institutions seeking to make better use of qualitative feedback. Even colleges and universities without the capacity to conduct large-scale analyses can use this research as a reference framework. For example, faculty and administrators can explore the kinds of comments typically associated with courses in different disciplines or taught by instructors of varying ranks. These comparisons can reveal whether a given course meaningfully diverges from broader patterns and can inform reflective practices to enhance teaching.
We also demonstrate that large language models (LLMs), such as ChatGPT (OpenAI, GPT-4o), can effectively complement human coders in summarizing topic content. As shown in Appendix B Table A1, GPT-4o generated topic descriptions closely aligned with those from human readers, suggesting that LLMs can reliably support certain interpretive tasks. This approach offers a scalable supplement or alternative to manual coding, making it especially valuable for institutions seeking efficient ways to analyze qualitative feedback across large datasets. While ethical and legal concerns, especially related to FERPA and student privacy, must be carefully considered, our use of a secure, university-sanctioned LLM platform illustrates one responsible path forward for integrating LLMs in educational research.
Combining LLM-generated summaries of student comments for individual courses with the benchmarks provided by STM models equips faculty and administrators with powerful tools for interpreting and contextualizing student feedback.
4.1. Topics Reflect Meaningful Aspects of Teaching
Importantly, all eleven identified topics reflect substantive attributes of teaching; none are ad hominem or irrelevant. Topics include pedagogical practices such as facilitating thoughtful discussions and providing timely feedback. This reinforces the idea that student comments offer valuable qualitative insights into instructional practices.
Each of the eleven topics identified in our STM analysis exhibits thematic parallels with well-established domains of effective and ineffective instruction. For example, topics such as Explains complex concepts effectively and Lectures are interesting and relevant reflect instructional clarity and perceived relevance of lecture content, which are two dimensions consistently linked to positive learning outcomes (Feldman, 2007). Provides constructive, timely feedback and Approachability and accessibility of instructor correspond to the widely recognized importance of feedback quality and instructor responsiveness in effective teaching (Brookfield, 2015; Hattie & Timperley, 2007). Topics such as Caring and enthusiastic instructor, Passionate about subject; committed teacher, and Engaging lectures; humorous lecturer reflect scholarship emphasizing the role of instructor enthusiasm, expressive delivery, and affective presence in fostering student motivation and engagement (Bain, 2004; Brookfield, 2015). Facilitates effective discussion; encourages critical thinking; creates welcoming environment aligns with pedagogical priorities related to inclusive teaching practices and cognitive stimulation (Brookfield, 2015). Conversely, Boring and disorganized lectures and Poor teaching and course design; disorganized instructor reflect well-documented indicators of ineffective instruction, particularly with regard to delivery, organization, and course structure (Feldman, 2007; Marsh, 1984). Finally, the topic Praised as best professor is consistent with research suggesting that global praise often reflects cumulative excellence across multiple teaching domains (Feldman, 2007). This alignment reinforces the validity of the topics surfaced by STM and supports their interpretability within the context of existing pedagogical research.
Beyond identifying the topics themselves, STM also enables meaningful institutional and instructional comparisons based on topic prevalence. By showing the average prevalence of each topic, STM enables instructors to understand how their student comments compare to institutional patterns. These comparisons become especially meaningful when instructors benchmark themselves against similar courses, such as humanities seminars taken as electives, rather than the full population of courses. STM’s ability to control for course characteristics (e.g., discipline, format, enrollment) allows for these fairer and more relevant comparisons.
4.2. SET and Topic Prevalence: Alignment and Interpretation
Instructors and administrators may also be interested in how quantitative SET scores relate to the content of qualitative comments. Our results show that topic prevalence is systematically and meaningfully associated with SET scores. For topics where the association is both statistically significant and large enough to be practically meaningful (i.e., ≥0.1 SD), the valence of the correlation matches the tone of the topic. For example, topics like Engaging lectures; humorous lecturer and Caring and enthusiastic instructor are positively associated with higher SET ratings, while negatively valanced topics, such as Boring and disorganized lectures, are linked to lower scores. Since quantitative SET scores positively correlate with the valence of the latent topics, this offers some evidence that SET scores reflect meaningful aspects of the student experience and align with students’ perceptions of effective teaching.
These relationships also vary predictably by division. For instance, comments about availability, caring, and fostering discussion are more common in the humanities, where smaller, seminar-style courses dominate, while topics like explaining complex material are more common in the sciences and engineering.
4.3. Gender Differences in Comment Content
Faculty and administrators have long expressed concern about potential gender bias in SET, both in scores and in comment content. While previous research at our institution found no evidence of gender differences in quantitative SET scores, this analysis reveals that comment content does vary by instructor gender.
Of the eleven topics, the following were significantly more prevalent in comments about female instructors:
- Caring and enthusiastic instructor
- Facilitates effective discussion; encourages critical thinking; creates welcoming environment
- Provides constructive, timely feedback
Conversely, comments about male instructors were more likely to focus on:
- Engaging lectures; humorous lecturer
- Lectures are interesting and relevant
- Passionate about subject; committed teacher
While these differences are relatively small in magnitude, they align with previous findings from Gelber et al. (2022), who reported that students more often describe female instructors as “helpful,” “friendly,” and attentive to feedback, whereas male instructors are more often associated with “enthusiasm,” “engagement,” and “humor.” Taylor et al. (2021) also found female instructors were more likely to be praised for availability and fostering discussion than their male colleagues. Similarly, in our study, female instructors are more frequently praised for being “caring,” for fostering a “welcoming environment,” and for providing “timely feedback.” In contrast, male instructors are more often described as “humorous,” “passionate,” and “committed,” and are credited with delivering “interesting” and “engaging” lectures.
Our analysis does not identify the underlying causes of these gender differences. They may reflect student bias, such as differing expectations rooted in gender norms; genuine differences in teaching behaviors; or both. Regardless of cause, the existence of these differences underscores the need for evaluators to interpret comments within context.
Even though the effects of the gender differences are small, given their alignment with past studies of student comments, administrators should be cautious not to penalize instructors based on stereotypical expectations. For example, students may be more likely to associate traits like humor and engagement with male instructors, leading to those descriptors appearing more frequently in comments about men. Conversely, qualities such as care, enthusiasm, and the ability to provide constructive, timely feedback may be more commonly attributed to women, potentially reflecting gendered norms in how students perceive and describe instructor traits.
The topics that are statistically and practically associated with male or female instructors in our analysis are also positively correlated with SET scores, suggesting that students value multiple styles of effective teaching. However, because different traits are more frequently attributed to male versus female instructors, instructors may be held to different implicit standards, even when they receive similar ratings. That is, the fact that SET scores are similar does not mean that the path to achieving those scores is equally accessible. For example, a female instructor may need to invest substantial effort in providing constructive, timely feedback to meet student expectations, while a male instructor may receive similar SET scores for being humorous–or vice versa. Although both styles are rewarded, the effort required to meet these gendered expectations may not be equivalent. These findings underscore the importance of interpreting both comments and scores in context, with an awareness of how student perceptions may be shaped by stereotype-driven expectations.
4.4. Topic–SET Correlations Are Consistent Across Genders
Despite these gendered differences in topic prevalence, we find that the relationship between topic prevalence and SET scores is consistent across genders. For all eleven topics, the direction of the correlation (positive or negative) is the same for both female and male instructors. In seven of the topics, higher prevalence is associated with higher SET scores, regardless of the instructor’s gender.
This suggests that students evaluate certain teaching characteristics as effective, such as enthusiasm, clarity, or care, no matter who demonstrates them. Conversely, characteristics associated with lower SET scores (e.g., disorganization or ineffective lectures) are viewed negatively regardless of instructor gender. While the types of feedback instructors receive may differ by gender, the impact of those comments on SET scores is consistent.
4.5. Limitations and Future Directions
One limitation of this study is that the data come from a single U.S. research university. Findings may not generalize to institutions with different cultures, structures, or student bodies. Additionally, SETs at our institution are a long-standing and institutionally integrated practice, and students take them seriously. Institutions with lower response rates or less established SET systems may see different patterns.
Another limitation is that smaller colleges and universities may lack the capacity to conduct this type of analysis independently. In such cases, they can use this and similar studies as benchmarks for interpreting their own student comments. It may also be possible to implement this kind of analysis across peer institutions through a consortium model. Such a collaborative approach could provide customized insights that are more relevant to institutions with similar structures, missions, or student populations, offering the benefits of contextualized analysis without requiring each institution to develop the capacity in-house.
Despite these limitations, this study offers a significant advance in how we analyze and interpret both qualitative and quantitative student evaluations. By leveraging STM with a robust set of covariates, we provide an interpretable framework for understanding the content and context of student feedback.
In earlier work (Zipser et al., 2021), we found that SET scores for female instructors have risen more quickly over time at our institution. That trend coincides with the increasing proportion of female faculty. In this study, we similarly find that some of the topics more frequently associated with women have also increased in prevalence over time. This suggests that greater representation of women in the faculty could contribute to shifts in both student perceptions and institutional outcomes. Or the causality could run in the reverse direction; students may now seek these attributes from faculty leading to more demand for women on the faculty. Future research could explore whether this trend continues and whether the nature of gendered differences evolves as women make up a growing share of faculty in STEM fields.
Another avenue for future research could involve exploring course characteristics that are particularly relevant to other institutions or academic programs. For example, faculty and administrators may be interested in how student comments relate to the complexity of the course material or the academic level of the course (e.g., first-year seminars versus advanced senior-level courses). The STM framework is adaptable and can be customized by institutions to incorporate covariates aligned with their unique goals and institutional context.
5. Conclusions
While machine learning methods like STM require large datasets and are not suitable for evaluating individual courses in isolation, they offer a powerful framework for interpreting course feedback at scale and in context. Beyond identifying thematic trends in qualitative comments, STM enables researchers to examine how the prevalence of specific topics varies with numeric SET scores, while adjusting for contextual factors such as course size, instructor gender, and academic division. This linkage between qualitative comments and quantitative ratings yields a more nuanced, data-driven understanding of how students assess teaching. By capturing both what students say and how it aligns with their numerical ratings, STM allows institutions to detect patterns, benchmark performance, and explore issues such as equity and instructional effectiveness with far greater rigor than manual review alone.
As institutions continue to seek fairer and more meaningful approaches to evaluating teaching, our STM framework offers a powerful new tool for linking qualitative student feedback to quantitative ratings, bridging the gap between narrative and numbers in a way that is both scalable and context-aware.
Author Contributions
Conceptualization, N.Z. and K.W.Y.; methodology, N.Z. and D.K.; software, D.K.; validation, N.Z. and K.W.Y.; formal analysis, D.K.; data curation, D.K. and L.A.M.; writing—original draft preparation, L.A.M. and D.K.; writing—review and editing, N.Z.; project administration, L.A.M. All authors have read and agreed to the published version of the manuscript.
Funding
This research received no external funding.
Institutional Review Board Statement
The study was conducted in accordance with the Declaration of Helsinki, and approved by the Institutional Review Board of Harvard University (protocol code IRB15-3886, approved on 6 January 2016).
Informed Consent Statement
Informed consent was waived for this study because the data are collected in the course of normal university business, and not specifically for this study.
Data Availability Statement
Data for this study is available upon request due to restrictions. For confidentiality reasons, the data cannot be stored publicly and must only be accessed by institution-issued tools/technology. Should outside researchers wish to replicate the analysis, the authors will provide the researchers with access to the deidentified data and code at an institution-approved data enclave on campus.
Conflicts of Interest
The authors declare no conflicts of interest.
Appendix A. Model Selection and Evaluation Metrics for STM
Figure A1 summarizes the trade-off between semantic coherence and exclusivity for STM estimated with seven through fifteen topics using SET comments. Notably, the figure demonstrates that exclusivity is considerably lower at seven topics than at higher topic numbers, indicating that distinct ideas are more likely to be merged when too few topics are specified. Conversely, as the number of topics increases, we observe a decline in semantic coherence, suggesting that with more than fifteen topics, themes become increasingly fragmented and less interpretable. Therefore, we restricted our analysis to the range of seven to fifteen topics, balancing both exclusivity and semantic coherence to ensure meaningful and interpretable topic structures.12
Figure A2 displays the weighted average of z-scored semantic coherence and exclusivity for the best STM run at each topic count from 7 to 15. Our analysis with z-scores shows that the model with 11 topics achieved the highest weighted score overall. Importantly, the highest-scoring model is located well within our selected 7–15 topic range, rather than at either boundary, which further substantiates the appropriateness of this interval.
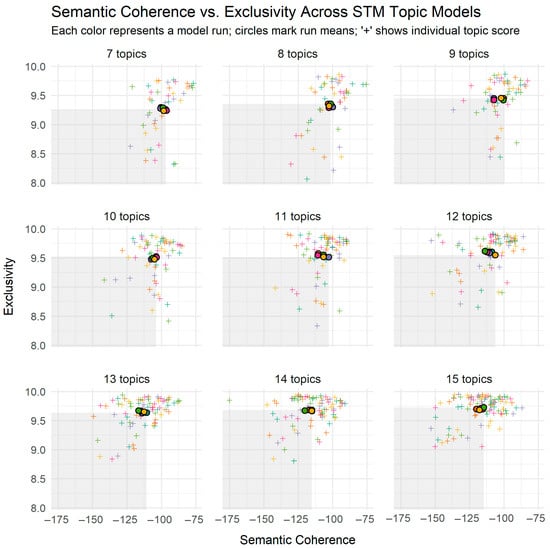
Figure A1.
Semantic coherence and exclusivity scores for STMs with 7 through 15 topics. Each panel shows results for a specific number of topics.
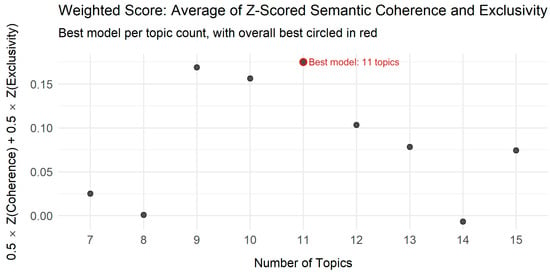
Figure A2.
Weighted average of z-scaled semantic coherence and exclusivity for STM models with 7 to 15 topics. Each point represents the best model run at a given number of topics, shown as a gray-filled circle. A dashed line indicates performance trends across topic numbers. The overall best model (11 topics) is highlighted with a red outline and labeled.
Appendix B. Topic Labeling of Student Written Evaluation Comments by Human Readers and GPT-4o

Table A1.
Topics from student written evaluation comments.
Table A1.
Topics from student written evaluation comments.
| Topic | Reader 1 | Reader 2 | Reader 3 | GPT-4o | Label |
|---|---|---|---|---|---|
| 1 | Enthusiastic, engaging, funny, and fantastic lecturer; fun and enjoyable course. | Their lectures are very engaging, and they have a great sense of humor. | Lectures are engaging. | Students deeply appreciate instructors who deliver highly engaging, humorous, and enthusiastic lectures that make the material enjoyable and keep them actively interested in class. | Engaging lectures; humorous lecturer. |
| 2 | Lectures are dry, boring, monotonous, disorganized, and difficult to follow. | They were boring, and lectures were disorganized and hard to follow. | Lectures are boring, difficult to follow, or disorganized. | Students frequently found lectures difficult to follow due to issues such as disorganization, unclear slides or notes, rapid or inconsistent pacing, and lack of engaging delivery. | Boring and disorganized lectures. |
| 3 | Great teacher who is a thorough, thoughtful, clear, organized, and effective lecturer. | They are very good at explaining complex concepts in ways students can understand. | Instructor breaks down complex concepts effectively. | Students consistently praise instructors for delivering clear, effective, and well-organized explanations of complex concepts, especially during lectures and review sessions. | Explains complex concepts effectively. |
| 4 | Course is not recommended; course head is disorganized and uninvolved, and the course falls short of expectations. | They are incredibly disorganized, no syllabus, and exam format changed with little notice. | Quality of instruction and/or course design is poor. | Students express dissatisfaction with poor teaching practices, disorganization, lack of engagement, unclear communication, and instructors who are perceived as dismissive, unapproachable, or disrespectful. | Poor teaching and course design; disorganized instructor. |
| 5 | Really wonderful professor who is friendly, kind, knowledgeable, and an incredible instructor. | They are kind, caring and enthusiastic about their subject matter. | Instructor is enthusiastic and caring. | Students overwhelmingly praise instructors who are deeply passionate about their subject, genuinely care for and support their students, and create an engaging, approachable, and inspiring learning environment. | Caring and enthusiastic instructor. |
| 6 | Lectures were interesting and informative. | Their lectures were interesting and relevant. | Lectures connect course concepts to topics of student interest. | Students praise instructors who are engaging and dynamic lecturers, capable of presenting complex or relevant topics in a clear, insightful, and interesting manner—often incorporating personal experiences, current events, or real-world applications to enhance understanding. | Lectures are interesting and relevant. |
| 7 | Outstanding professor, who is one of the best at [Institution], and is compassionate, dedicated, and exceptional at their job. | They are the best professor students have ever had at [Institution]. | Instructor is the best professor at [Institution]. | Students enthusiastically praise the instructor as one of the best or most memorable they have had, highlighting exceptional teaching ability, deep subject knowledge, kindness, dedication, and a lasting positive impact on their academic experience. | Praised as best professor. |
| 8 | Effective and welcoming classroom environment; excellent teacher, moderator, and facilitator who is warm and passionate. | They are great at facilitating meaningful discussion where everyone feels comfortable sharing ideas. | Instructor effectively facilitates group discussion and encourages critical thinking. | Instructors foster thoughtful, inclusive, and engaging classroom discussions by creating safe spaces for dialogue, effectively guiding conversations, and encouraging critical thinking and student participation. | Facilitates effective discussion; encourages critical thinking; creates welcoming environment. |
| 9 | Wonderful teacher who was helpful, supportive, accessible, and provided great feedback. | They were a great instructor and gave constructive feedback. | Instructor gave helpful and timely feedback throughout the course. | Students consistently praise the instructor for providing detailed, timely, and constructive feedback on writing assignments, being highly accessible and supportive throughout the writing and revision process. | Provides constructive, timely feedback. |
| 10 | Faculty member is passionate, enthusiastic, knowledgeable, and clearly put a lot of work into the course. | They are passionate about their subject matter and puts great effort into teaching it. | Instructor is committed to teaching and passionate about the course material. | Students frequently comment on instructors who demonstrate passion and deep knowledge of the subject matter, often balancing a strong personality or unique teaching style with genuine care for student learning and engagement. | Passionate about subject; committed teacher. |
| 11 | Knowledgeable, helpful, approachable, and engaging lecturer who is very patient with questions. | Their method of answering student’s questions made the majority feel they were willing to answer any question to make sure they understand the material, but for a subset their response style made students feel stupid for asking. | Instructor is either accessible and approachable or inaccessible and/or unapproachable for student questions. | Instructors who foster a supportive learning environment by being approachable, patient, and responsive to students’ questions—particularly through effective use of office hours and individualized guidance. | Approachability and accessibility of instructor. |
Appendix C. Protocol Used to Generate Summaries by GPT-4o
In addition to human readers, we used the Generative Pretrained Transformer (GPT) to generate a summary for each of the eleven latent STM topics. Specifically, we used the GPT-4o version provided by our university of study.
For each topic, we started a new chat session and used the following prompt within the given session:
“Please read the attached Word document and follow the instructions provided within it. The top comments mentioned in the Word document are also attached.”
The attached Word document contained detailed instructions:
“We are analyzing Q comments related to instructors’ teaching using a Structural Topic Model (STM). The dataset comprises individual, open-ended student responses about teaching. We assume that each comment can represent a mixture of up to 11 distinct latent topics simultaneously. Since these topics are not directly observable, STM estimates their prevalence—that is, the extent to which each topic is present in a given comment. A higher prevalence indicates a stronger association between a comment and a specific topic.
For example, Topic 4 is strongly associated with the four comments shown below. The 100 comments with the highest association with this topic are listed in the “topComments_Topic4.xlsx” file. We identify the top 100 comments by ranking all comments according to the topic’s prevalence, from highest to lowest, in the comments as follows:
| Prevalence | Instructor’s Teaching: Top 100 Comments for Topic 4 |
| 0.47 | Professor LastName is the most amazing teacher. He is incredibly kind, caring, and truly cares about the success of students. |
| 0.46 | Professor LastName is a very friendly and kind teacher—he is obviously extremely knowledgeable about his field and eager to share his knowledge with students. |
| 0.46 | Professor LastName is fantastic. She demonstrates a genuine love for the subject matter and exudes a brilliance that is both friendly and extremely articulate. |
| . . . | |
| 0.38 | Professor LastName is an excellent and caring teacher. He has a lot of passion for what he does, is very knowledgeable about his field, and extends that passion to all his students. He is also accessible and accommodating of what students are going through- just a lovely person overall. |
Topic prevalence indicates the proportion of a given comment that is associated with a specific topic. For example, a prevalence of 0.47 for Topic 4 means that 47% of the content in the first comment—“Professor LastName is the most amazing teacher. He is incredibly kind, caring, and truly cares about the success of students.”—is attributed to Topic 4.
Your task is to generate a one-sentence summary that best captures each latent topic, based on its corresponding “top comments”. The goal is not to capture every idea mentioned in the comments, as each comment may also reflect contributions from other topics. In this example, Topic 4 is relatively dominant, accounting for 38% to 47% of each comment. Therefore, you should focus on identifying the ideas or themes that are common across these comments and best represent Topic 4.
It is possible—and quite common—for topics to share the similar or overlapping themes. In this context, for example, most topics are expected to focus on “teaching.”
Please provide a one-sentence description for each of the 11 latent topics based on the corresponding set of 100 “top comments.”
The “top comments” corresponding to Topic 1 through Topic 11 are presented in the files named “topComments_Topic1.xlsx,” “topComments_Topic2.xlsx,”… “topComments_Topic11.xlsx,” respectively.”
Appendix D. Statistical and Practical Significance of Topic Prevalence: Marginal SET and Gender Effects

Table A2.
Marginal effects of SET scores on topic prevalence using regressions of topic proportions on SET, instructor gender, SET interaction with gender evaluated at the mean, and other covariates. The significance of the marginal effect is reported.
Table A2.
Marginal effects of SET scores on topic prevalence using regressions of topic proportions on SET, instructor gender, SET interaction with gender evaluated at the mean, and other covariates. The significance of the marginal effect is reported.
| Topic | Topic Description | Statistical Significance | Practical Significance | |||||
|---|---|---|---|---|---|---|---|---|
| Marginal Effect of SET | Stand. Error | t Value | Pr(>|t|) | Mean Prevalence | St. Dev. of Prevalence | Est. Diff./St. Dev. (Econ. Sign.) | ||
| 1 | Engaging lectures; humorous lecturer. * | 0.029 | 0.000 | 61.377 | 0.000 | 0.115 | 0.069 | 0.424 |
| 2 | Boring and disorganized lectures. * | −0.058 | 0.001 | −100.724 | 0.000 | 0.100 | 0.098 | −0.591 |
| 3 | Explains complex concepts effectively. | −0.004 | 0.000 | −10.380 | 0.000 | 0.099 | 0.068 | −0.055 |
| 4 | Poor teaching and course design; disorganized instructor. * | −0.046 | 0.000 | −120.094 | 0.000 | 0.096 | 0.072 | −0.634 |
| 5 | Caring and enthusiastic instructor. * | 0.024 | 0.000 | 103.338 | 0.000 | 0.094 | 0.056 | 0.432 |
| 6 | Lectures are interesting and relevant. * | 0.010 | 0.000 | 52.305 | 0.000 | 0.087 | 0.045 | 0.224 |
| 7 | Praised as best professor. * | 0.027 | 0.000 | 69.460 | 0.000 | 0.086 | 0.075 | 0.369 |
| 8 | Facilitates effective discussion; encourages critical thinking; creates welcoming environment. | 0.007 | 0.000 | 27.055 | 0.000 | 0.085 | 0.075 | 0.091 |
| 9 | Provides constructive, timely feedback. * | 0.008 | 0.000 | 29.202 | 0.000 | 0.085 | 0.067 | 0.118 |
| 10 | Passionate about subject; committed teacher. | −0.002 | 0.000 | −14.931 | 0.000 | 0.077 | 0.025 | −0.087 |
| 11 | Approachability and accessibility of instructor. | 0.003 | 0.000 | 16.513 | 0.000 | 0.074 | 0.042 | 0.082 |
An asterisk (*) indicates that the absolute value of the marginal effect of SET score on topic prevalence, standardized by topic standard deviation, is ≥0.1.

Table A3.
Expected differences (F-M) in topic prevalence for female and male instructors using regressions of topic proportions on instructor gender, gender interaction with SET scores evaluated at the mean, and other covariates. The significance of the marginal effect is reported. Topics with both statistically significant (at the 5% level) and economically significant (at least 0.1 standard deviations) gender differences are shown in red.
| Topic | Topic Description | Statistical Significance | Practical Significance | |||||
|---|---|---|---|---|---|---|---|---|
| Est. Diff. (F-M) | Stand. Error | t Value | Pr(>|t|) | Mean Prevalence | St. Dev. of Prevalence | Est. Diff./St. Dev. (Econ. Sign.) | ||
| 1 | Engaging lectures; humorous lecturer. | −0.010 | 0.001 | −10.348 | 0.000 | 0.115 | 0.069 | −0.149 |
| 2 | Boring and disorganized lectures. | −0.008 | 0.001 | −6.894 | 0.000 | 0.100 | 0.098 | −0.080 |
| 3 | Explains complex concepts effectively. | 0.000 | 0.001 | 0.207 | 0.836 | 0.099 | 0.068 | 0.003 |
| 4 | Poor teaching and course design; disorganized instructor. | −0.004 | 0.001 | −6.946 | 0.000 | 0.096 | 0.072 | −0.057 |
| 5 | Caring and enthusiastic instructor. | 0.014 | 0.001 | 26.658 | 0.000 | 0.094 | 0.056 | 0.251 |
| 6 | Lectures are interesting and relevant. | −0.013 | 0.001 | −23.803 | 0.000 | 0.087 | 0.045 | −0.279 |
| 7 | Praised as best professor. | 0.003 | 0.001 | 3.175 | 0.001 | 0.086 | 0.075 | 0.036 |
| 8 | Facilitates effective discussion; encourages critical thinking; creates welcoming environment. | 0.012 | 0.001 | 13.897 | 0.000 | 0.085 | 0.075 | 0.158 |
| 9 | Provides constructive, timely feedback. | 0.011 | 0.001 | 15.647 | 0.000 | 0.085 | 0.067 | 0.164 |
| 10 | Passionate about subject; committed teacher. | −0.005 | 0.000 | −15.836 | 0.000 | 0.077 | 0.025 | −0.194 |
| 11 | Approachability and accessibility of instructor. | 0.000 | 0.001 | −0.303 | 0.762 | 0.074 | 0.042 | −0.004 |
Appendix E. Covariates with Prevalence
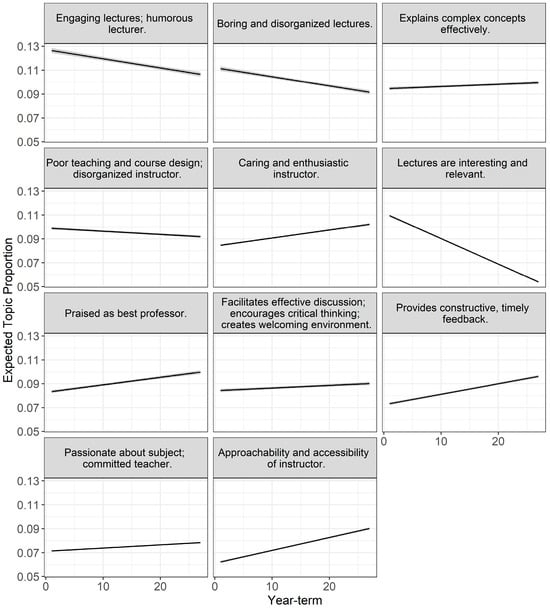
Figure A3.
Expected topic prevalence versus year-term, with other covariates set at their mean values. Shaded regions around each line represent the 95% confidence intervals for the expected topic prevalence.
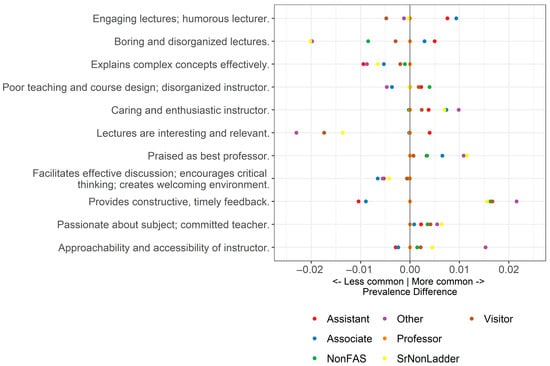
Figure A4.
Expected prevalence difference by instructor rank, relative to tenured professor.
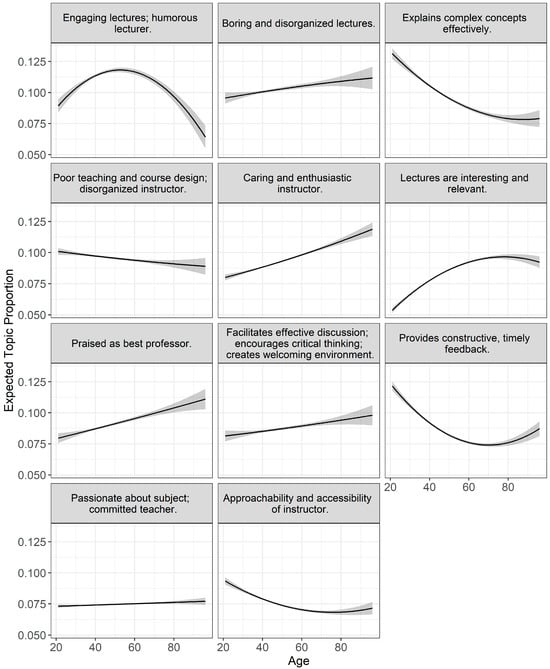
Figure A5.
Expected topic prevalence versus instructor age, with other covariates set at their mean values. Shaded regions around each line represent the 95% confidence intervals for the expected topic prevalence.
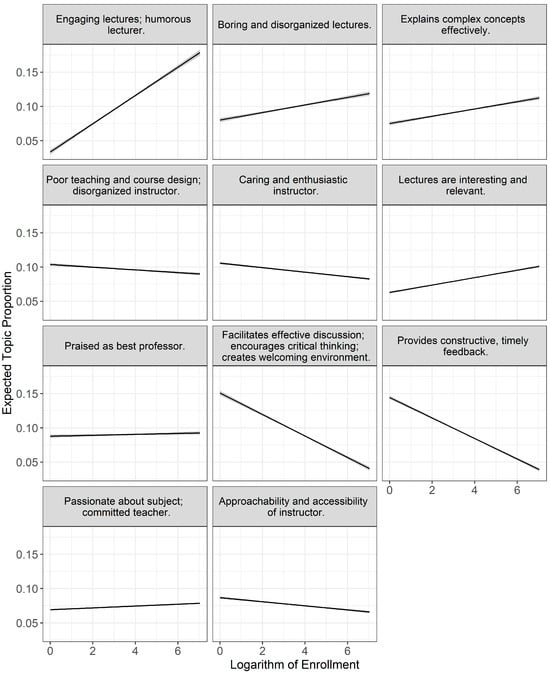
Figure A6.
Expected topic prevalence versus logarithm of enrollment, with other covariates set at their mean values. Shaded regions around each line represent the 95% confidence intervals for the expected topic prevalence.
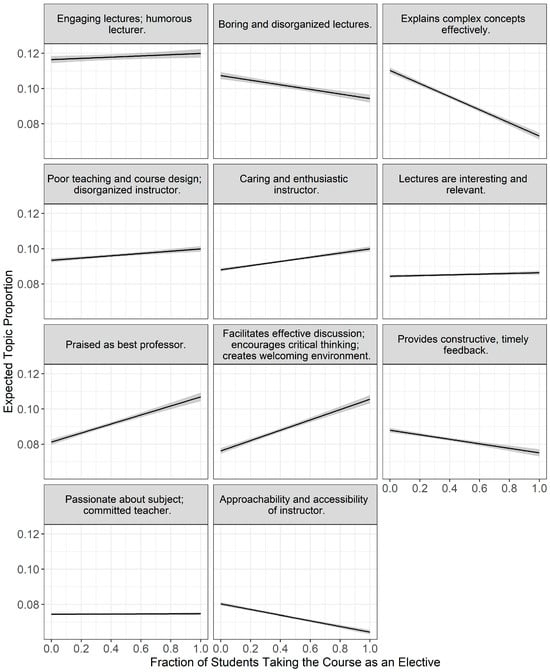
Figure A7.
Expected topic prevalence versus fraction of students taking the course as an elective, with other covariates set at their mean values. Shaded regions around each line represent the 95% confidence intervals for the expected topic prevalence.
Notes
| 1 | Each year, fewer than five comments, on average, are removed at the request of the instructor and with institutional approval; these are not included in the analysis. There were no evaluations for Spring 2020 due to COVID-19. |
| 2 | Response categories include 5 “Excellent,” 4 “Very Good,” 3 “Good,” 2 “Fair,” and 1 “Unsatisfactory.” |
| 3 | Reading/Research/Thesis Writing courses; courses with enrollments aggregated by the Registrar’s Office (i.e., lectures taught in section and tutorials); and courses taught by Teaching Fellows or Teaching Assistants were not included in the original dataset. Additionally, not all students choose to submit qualitative comments. |
| 4 | Observations with one or more of the considered covariates missing were not included in the original dataset. |
| 5 | Prior to fitting the STM, we replaced the instructors’ last names in the comments with “LastName” and their first names with "FirstName". We then followed the standard procedure of preparing the comments by dropping punctuation, numbers, and stop words (e.g., “the,” “is,” “at”). Comments that contained only stop words, numbers, or punctuation became empty and were excluded from the dataset. Finally, we applied stemming to reduce words to their root form. |
| 6 | Another commonly used metric for evaluating topic models is held-out likelihood, which measures the extent to which a model can be generalized to out-of-sample data by assessing its ability to predict withheld portions of the text. Models with higher held-out likelihood are considered to have stronger predictive performance. This metric is particularly useful when topic models are applied in predictive tasks or classification contexts (Wallach et al., 2009). However, held-out likelihood does not assess whether topics are thematically coherent or meaningfully distinct—features that are essential when topic modeling is used for interpretive purposes (Chang et al., 2009; Mimno et al., 2011; M. E. Roberts et al., 2014; Wallach et al., 2009). |
| 7 | All three human readers were blind to the questions studied in this paper. |
| 8 | Per the University, “The AI Sandbox provides a secure environment in which to explore Generative AI, mitigating many security and privacy risks and ensuring the data entered will not be used to train any vendor large language models (LLMs).” |
| 9 | Topic prevalence values were sampled using the ‘thetaPosterior’ function, and marginal effects were estimated using a modified version of ‘estimateEffect’, both from the ‘stm’ R package (used with R version 3.5.2 was used; https://cran.r-project.org/web/packages/stm/stm.pdf, accessed on 5 August 2025). The ‘estimateEffect’ function was modified to incorporate clustering by faculty-course. |
| 10 | The clustered covariance matrix was estimated via the ‘vcovCL’ function from the ‘sandwich’ package (used with R version 3.5.2), where we used the “HC1” estimation type. |
| 11 | This analysis is conducted using the modified ‘estimateEffect’ function from the ‘stm’ package (used with R version 3.5.2), as previously described. |
| 12 | To obtain the results presented in Figure A1, we specified 30 STM runs per topic count, 6 of which converged successfully in each case and were included in the analysis. |
References
- Adams, S., Bekker, S., Fan, Y., Gordon, T., Shepherd, L. J., Slavich, E., & Waters, D. (2022). Gender bias in student evaluations of teaching: ‘Punish[ing] those who fail to do their gender right’. Higher Education, 83, 787–807. [Google Scholar] [CrossRef]
- Bain, K. (2004). What the best college teachers do. Harvard University Press. [Google Scholar]
- Binderkrantz, A. S., Bisgaard, M., & Lassesen, B. (2022). Contradicting findings of gender bias in teaching evaluations: Evidence from two experiments in Denmark. Assessment & Evaluation in Higher Education, 47, 1345–1357. [Google Scholar] [CrossRef]
- Boring, A. (2017). Gender biases in student evaluations of teaching. Journal of Public Economics, 145, 27–41. [Google Scholar] [CrossRef]
- Brookfield, S. D. (2015). The skillful teacher: On technique, trust, and responsiveness in the classroom (3rd ed.). Jossey-Bass. [Google Scholar]
- Chang, J., Boyd-Graber, J., Gerrish, S., Wang, C., & Blei, D. M. (2009, December 7–10). Reading tea leaves: How humans interpret topic models. NIPS’09: Proceedings of the 23rd International Conference on Neural Information Processing Systems, Vancouver, BC, Canada. [Google Scholar]
- Fan, Y., Shepherd, L. J., Slavich, E., Waters, D., Stone, M., Abel, R., & Johnston, E. L. (2019). Gender and cultural bias in student evaluations: Why representation matters. PLoS ONE, 14(2), e0209749. [Google Scholar] [CrossRef] [PubMed]
- Feldman, K. A. (2007). Identifying exemplary teachers and teaching: Evidence from student ratings. In R. P. Perry, & J. C. Smart (Eds.), The scholarship of teaching and learning in higher education: An evidence-based perspective (pp. 93–143). Springer. [Google Scholar]
- Fuller, K. A., Morbitzer, K. A., Zeeman, J. M., Persky, A. M., Savage, A. C., & McLaughlin, J. E. (2024). Exploring the use of ChatGPT to analyze student course evaluation comments. BMC Medical Education, 24(1), 423. [Google Scholar] [CrossRef] [PubMed]
- Gelber, K., Brennan, K., Duriesmith, D., & Fenton, E. (2022). Gendered mundanities: Gender bias in student evaluations of teaching in political science. Australian Journal of Political Science, 57(2), 199–220. [Google Scholar] [CrossRef]
- Hattie, J., & Timperley, H. (2007). The power of feedback. Review of Educational Research, 77, 81–112. [Google Scholar] [CrossRef]
- Hill, C. J., Bloom, H. S., Black, A. R., & Lipsey, M. W. (2008). Empirical benchmarks for interpreting effect sizes in research. Child Development Perspectives, 2(3), 172–177. [Google Scholar] [CrossRef]
- Kraft, M. A. (2020). Interpreting effect sizes of education interventions. Educational Researcher, 49(4), 241–253. [Google Scholar] [CrossRef]
- MacNell, L., Driscoll, A., & Hunt, A. N. (2015). What’s in a name: Exposing gender bias in student ratings of teaching. Innovative Higher Education, 40, 291–303. [Google Scholar] [CrossRef]
- Marsh, H. W. (1984). Students’ evaluations of university teaching: Dimensionality, reliability, validity, potential biases, and utility. Journal of Educational Psychology, 76(5), 707–754. [Google Scholar] [CrossRef]
- Martin, L. L. (2016). Gender, teaching evaluations, and professional success in political science. PS: Political Science and Politics, 49(2), 313–319. [Google Scholar] [CrossRef]
- Mengel, F., Sauermann, J., & Zölitz, U. (2019). Gender Bias in Teaching Evaluations. Journal of the European Economic Association, 17(2), 535–566. [Google Scholar] [CrossRef]
- Miles, P. C., & House, D. (2015). The tail wagging the dog: An overdue examination of student teaching evaluations. International Journal of Higher Education, 4(2), 116–126. [Google Scholar] [CrossRef]
- Mimno, D., Wallach, H., Talley, E., Leenders, M., & McCallum, A. (2011, July 27–31). Optimizing semantic coherence in topic models. 2011 Conference on Empirical Methods in Natural Language Processing, Edinburgh, UK. [Google Scholar]
- Mitchell, K. M. W., & Martin, J. (2018). Gender bias in student evaluations. PS: Political Science and Politics, 51(3), 648–652. [Google Scholar] [CrossRef]
- Okoye, K., Arrona-Palacios, A., Camacho-Zuñiga, C., Achem, J. A. G., Escamilla, J., & Hosseini, S. (2021). Towards teaching analytics: A contextual model for analysis of students’ evaluation of teaching through text mining and machine learning classification. Education and Information Technologies, 27, 3891–3933. [Google Scholar] [CrossRef] [PubMed]
- OpenAI. (2024). GPT-4o. Available online: https://sandbox.ai.huit.harvard.edu/c/new (accessed on 1 May 2025).
- Roberts, M., Stewart, B., & Tingley, D. (2016). Navigating the local modes of big data: The case of topic models. In Computational social science: Discovery and prediction. Cambridge University Press. [Google Scholar]
- Roberts, M. E., Steward, B. M., & Tingley, D. (2019). stm: An R packagae for structural topic models. Journal of Statistical Software, 91(2), 1–40. [Google Scholar] [CrossRef]
- Roberts, M. E., Stewart, B. M., Tingley, D., Lucas, C., Leder-Luis, J., Gadarian, S. K., Albertson, B., & Rand, D. G. (2014). Structural topic models for open-ended survey responses. American Journal of Political Science, 58(4), 1064–1082. [Google Scholar] [CrossRef]
- Sun, J., & Yan, L. (2023). Using topic modeling to understand comments in student evaluations of teaching. Discover Education, 2, 25. [Google Scholar] [CrossRef]
- Taylor, M. A., Su, Y., Barry, K., & Mustillo, S. (2021). Using structural topic modelling to estimate gender bias in student evaluations of teaching. In E. Zaitseva, B. Tucker, & E. Santhanam (Eds.), Analysing student feedback in higher education (1st ed.). Routledge. [Google Scholar]
- Theall, M., & Franklin, J. (2001). Looking for bias in all the wrong places: A search for truth or a witch hunt in student ratings of instruction? New Directions for Institutional Research, 27(5), 45–56. [Google Scholar] [CrossRef]
- Wallach, H. M., Murray, I., Salakhutdinov, R., & Mimno, D. (2009, June 14–18). Evaluation methods for topic models. ICLM ’09: Proceedings of the 26th Annual International Conference on Machine Learning, Montreal, QC, Canada. [Google Scholar]
- Zipser, N., & Mincieli, L. (2024). A framework for using SET when evaluating faculty. Studies in Higher Education, 50(1), 168–182. [Google Scholar] [CrossRef]
- Zipser, N., Mincieli, L., & Kurochkin, D. (2021). Are there gender differences in quantitative student evaluations of instructors? Research in Higher Education, 62(7), 976–997. [Google Scholar] [CrossRef]
Disclaimer/Publisher’s Note: The statements, opinions and data contained in all publications are solely those of the individual author(s) and contributor(s) and not of MDPI and/or the editor(s). MDPI and/or the editor(s) disclaim responsibility for any injury to people or property resulting from any ideas, methods, instructions or products referred to in the content. |
© 2025 by the authors. Licensee MDPI, Basel, Switzerland. This article is an open access article distributed under the terms and conditions of the Creative Commons Attribution (CC BY) license (https://creativecommons.org/licenses/by/4.0/).