2. The Case: Using SARD to Assess Value
This initiative took place at a large midwestern university with seven campuses: a flagship, an urban research campus, and five comprehensive regional campuses. To improve student retention and completion rates, senior university administrators had already begun to focus all campuses on introductory classes that were gate-keepers to degree progress where high DFW rates prevented students from smoothly moving forward in their studies. This rate is commonly referred to as the “DFW” rate, as it represents the proportion of students who receive a grade below C-, or who withdrew from the class after the add/drop period. Campuses were directed to “fix” this problem by studying the causes of these high rates and then taking steps to lower them. How campuses solved this issue was left to each campus where it in turn was delegated to each school and then each department. Solutions might be adding peer mentors or supplemental instruction to courses, improving tutoring options and availability, changing how the course was taught (pedagogy), changing course content or the sequence of content presentation, or changing how courses slotted into the overall curriculum. No one solution would fit all.
The disruption of the pandemic introduced a new urgency to this effort. During the academic year where classes were mainly taught online, campuses saw significant increases in course failure rates due to pandemic stress. By Fall 2021, classes were again being held in person on all campuses. Prior to the start of the fall semester, university leaders were presented with the opportunity to join a two-year (Fall 2021–Spring 2023) NSF-funded pilot of a student software platform that supported peer-to-peer collaborative studying. In its initial implementation at a different pilot university, the software produced significant improvements in course pass rates and hence student retention. The software platform claimed to address a persistent issue faced by many campuses: students who are performing poorly do not seek assistance. Indeed, a study by Tyton Partners of students who had stopped out of their studies found that only a third of students surveyed knew about the tutoring resources available on their campus and fewer than a quarter used those resources (
Mowreader, 2024). The software tool offered students a low-stress, low-stakes way of seeking help. Given the new situation with higher DFW rates on campuses, university leaders decided to join the pilot. All students at five regional campuses and students in a selected class at the urban research campus would be able to use the new tool in their classes.
The software was based on the premise that students helping each other would reduce the stress and shame students may feel about seeking help. Instructors could see what topics were generating confusion, but not which students were confused. Tutors, supplemental instruction (SI) staff, and peer mentors in classes included in the platform had the ability to interact directly with students to answer questions and provide additional resources. Students were able to see each of their classes and could interact with fellow class members and tutoring staff. They could not communicate directly with instructors. The platform allowed them to ask/answer questions; to share notes, flashcards, and web resources; to set up video study groups; and to organize their class assignments and set up reminders. As an extra motivating factor for platform use, students earned points for engaging with the software that they could use for gift cards to omnipresent companies like Starbucks, Amazon, Chipotle, and others.
In the first academic year of the pilot (Fall 2021–Spring 2022), the campus efforts focused on encouraging students to enroll in and use the platform. The software was available in all classes at the five regional campuses, and in a beginning anatomy course at the larger urban campus. While student information was pre-loaded in the platform, students had to log in to begin using the software. Because all regional campuses were combined in one platform, the vendor provided weekly raw data feeds to the university. Using these data, university central staff were able to provide each campus with weekly updates about how well the software was being adopted on their campus. These updates also included additional data from the university’s early alert system, identification of the top performing courses and instructors, student leaderboards, and suggestions to increase student adoption and usage.
In the spring semester, the central communications office for the university ran a social media campaign on these campuses to try to further boost student adoption and usage of the tool. The vendor also introduced “Student Ambassadors” who worked on each campus to help boost student usage through social media posts and class presentations and ran periodic contests to boost student engagement. Over two semesters in the first year, over 4000 students used the software, but they represented only about a quarter of the student population. After one year of usage, campuses knew which courses and instructors were having success at getting students to use the software, but they were not seeing any significant differences in student performance based on persistence and DFW data collected regularly by the university.
There was one notable success. A large number of students in the beginning anatomy class at the urban campus had used the tool regularly in Fall 2021. Analysis at the end of that first semester showed a significant drop in the proportion of students receiving a grade of D or F—from 24% in Fall 2018 to 11% in Fall 2021. In Fall 2018, 17% of students earned a C, compared with 34% in Fall 2021. The campus saw similar improvements when disaggregating the impact by race/ethnicity.
This urban campus course was able to motivate large numbers of students to use the tool through simple actions by the instructor teaching the course. Based on these promising results, a focused university initiative was planned for Fall 2022 with introductory classes from the regional campuses. Data from this experiment would help campuses with upcoming decisions about whether to renew the contract by providing insight into whether the software was having the desired result—decreasing the DFW rates. The Fall 2022 experiment was designed to replicate the processes used in the successful anatomy course to see if it could scale. All campuses piloted the tool in their beginning anatomy course (the course with success at the larger urban campus) but campus academic administrators also recruited other courses (math, foreign languages, business, chemistry) in the pilot that had DFW rates higher than desired. In total, thirty instructors were recruited across four of the five regional campuses for a focused pilot study.
Instructors were given concrete instructions to promote use of the tool in their classes. They were asked to introduce the tool to their students by the following actions: (1) putting language in their syllabus; (2) posting information and support links for the tool in the learning management system (LMS) for their course; (3) telling students on the first day of class to enroll in the tool; and (4) regularly reminding students throughout the semester that they should be using the tool to study and ask questions of their classmates. If the class had an assigned supplemental instructor or peer mentor, instructors were directed to have those students encourage tool use throughout the semester. The urban research campus professor also led several open sessions with instructors to explain what he had done and respond to questions. His basic message was to continually encourage students to engage with the platform to get them better engaging with fellow classmates who could help them succeed. For their participation in the experiment, instructors received a small stipend if they completed all the experiment requirements.
For our SARD observational analysis, we sought to triangulate qualitative and quantitative analyses to gauge the software’s effectiveness. We planned out a careful statistical analysis of tool use and GPA for the end of the semester. We pulled together our qualitative analysis by collecting the following artifacts from instructors: their syllabus, any emails they sent students encouraging use of the software, a mid-semester checklist that covered the protocol they were to follow, and at semester’s end, their written responses to a series of reflection questions about student performance, student engagement, how successful they felt they were in encouraging student participation, and any advice they might offer other faculty about using the tool in their classes. SARD encourages practitioners to engage multiple voices in analyses, so we also collected feedback from students who participated in these classes in the following semester, asking them why they did or did not use the tool, how their instructor encouraged them to use it, and more generally how they preferred to study for their courses. Several instructors made a point of collecting feedback from their students on their own during the fall semester and they also shared that feedback with the research team. This feedback, while more anecdotal, did tend to confirm the results seen in our more systematic student survey.
3. Results
This section presents outcomes from the pilot program across multiple types of evidence. First, we examine changes in pass rates and grade point averages among matched courses taught in Fall 2021 and Fall 2022. Second, we explore grade outcomes through a mixed-effects model considering student software usage levels. We then turn to course-level analyses to provide additional historical context for a specific pilot course. Next, we assess implementation fidelity among instructors and test the association between instructor fidelity, student usage, and course grades within Fall 2022. Finally, we present findings from student surveys and instructor reflections to provide a qualitative perspective on engagement, study behaviors, and perceived course impacts.
While thirty instructors participated in the experiment overall, this portion of the assessment focused specifically on 22 courses taught by the same instructor in both Fall 2021 and Fall 2022, creating a matched sample to support a more robust impact assessment. These 22 matched courses collectively included 2251 student-level observations across the two semesters (Fall 2021 pre-intervention and Fall 2022 intervention). Students were not individually selected; rather, the sample consisted of all students enrolled in the matched courses. The remaining instructors were excluded from this particular analysis because they did not teach the same course in Fall 2021, preventing a direct year-to-year comparison.
Table 1 lists the participating courses arrayed according to student usage from low to high. The courses are designated using the institution’s internal course numbering system, including the disciplinary aegis and course number.
Table 2, sorted in the same order, compares the pass rate and grade-point averages (on a scale of 0.00 to 4.00) for the Fall 2021 and Fall 2022 in classes taught by the same instructors albeit with the intervention ongoing in Fall 2022. We used a Chi-square test to evaluate whether the increase in course pass rates from Fall 2021 to Fall 2022 was statistically significant, as this test is appropriate for analyzing categorical outcomes (passing vs. failing grades). The overall pass rate for these courses increased from 61% for the Fall 2021 sections to 70% for the Fall 2022 pilot sections, which was a statistically significant difference (X2(1) = 6.41,
p < 0.05). The mean GPA increased from 1.85 to 2.19. However, grades generally increased for all such courses over this time period, so further analysis was needed to see what role the software played in the increase.
The impact of software use on grade performance was next analyzed using a linear mixed-effects model, which allowed us to assess the changes in grades across the two semesters while accounting for students nested within instructor–course pairs. This nesting structure was important because it addressed the non-independence of student data within the same course and instructor context. In this model, course grade was the dependent variable, year and software use category were treated as fixed effects, and instructor–course combinations were included as a random effect.
Our primary interest in the model was the interaction effect between the year and software use category. This interaction was specifically included to test whether the extent of grade improvement from Fall 2021 to Fall 2022 differed significantly based on the level of software use (low, medium, or high), given that software use was introduced only in the second year (Fall 2022). The results showed that both the year (F(1, 2245) = 26.323,
p < 0.001) and the use category (F(2, 2245) = 6.748,
p = 0.001) had significant main effects.
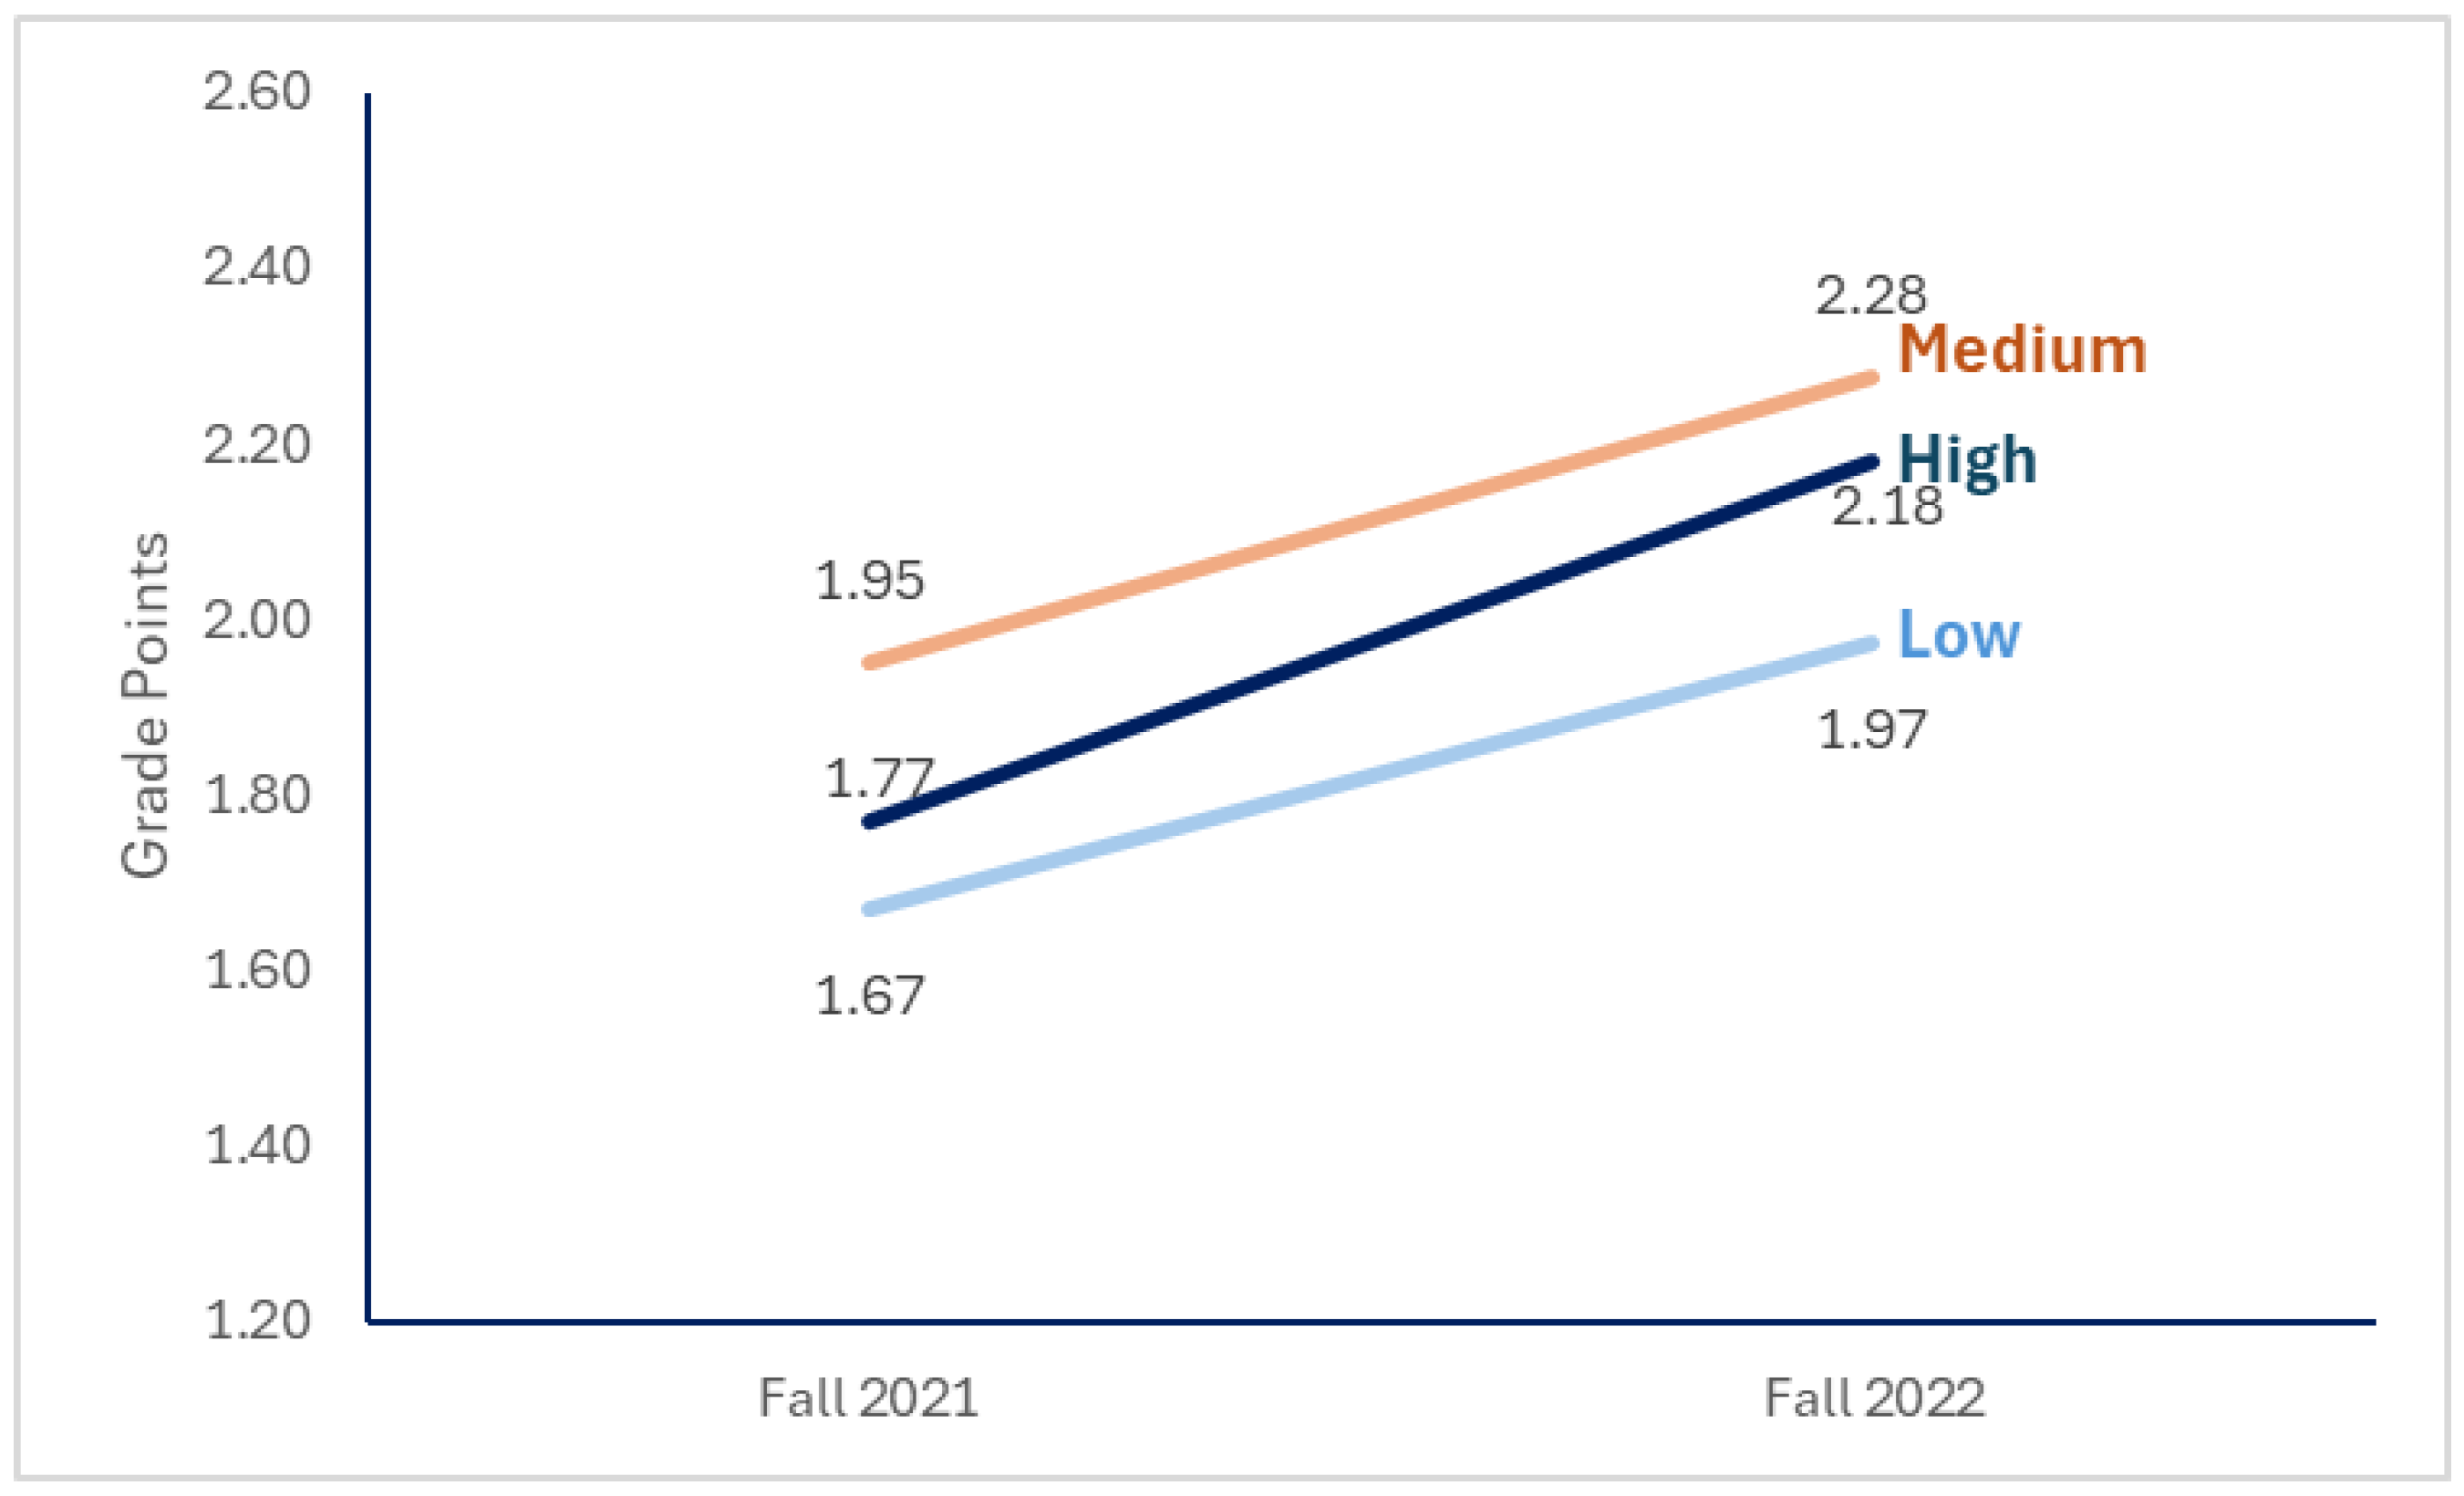
Figure 1 illustrates this interaction as the change in grade performance between the two years and by use category. The chart shows that the use categories distinguish classes in an interesting and unexpected way. Classes in the medium-use category tended to have the highest grades in both semesters, with courses in the high-use category next and low-use category at the bottom. Grades improved from Fall 2021 to Fall 2022, and they did so almost equally across the categories. The graph shows a slightly sharper growth angle for the high use group. However, the interaction between year and use category was not significant (F(2, 2245) = 0.231,
p = 0.794). Because this interaction was not significant, caution is required in attributing differential improvements directly to software use. Other factors, such as disciplinary differences or instructional practices, may have influenced these outcomes and should be considered.
Although the evidence for any impact is minimal by this analysis, the analysis does reveal that other factors need to be considered. For example, four of the six low-use classes are mathematics classes, and the high-use group includes mostly science and mathematics. In contrast, the medium-use group includes several language and business classes. Grade differences between these disciplines are well known and belie different approaches to teaching and learning. Although counterintuitive, the consistent outperformance of medium-use classes over high-use classes might thus reflect underlying disciplinary differences rather than actual software usage effectiveness. Additionally,
Table 1 and
Table 2 reveal that the distribution of classes by use category was skewed across the four campuses, with campuses 1 and 3 tending toward lower use and campuses 2 and 4 toward higher use.
To explore further within specific contexts, we examined the anatomy courses in the experiment (ANAT-A 215/PHSL-P261). Bringing in more historical data, we were able to compare overall course pass rates from 2015–2021 to our Fall 2022 outcomes. For these specific courses, we saw a major improvement in pass and DFW rates for two campuses, almost no change on one campus, and poorer results on the last campus.
Table 3 shows the results of this analysis.
Further analyses were then conducted to understand the relationship between software use and student outcomes. Instructors were rated on implementation fidelity as recommended by
Swain et al. (
2013, p. 5), who noted that “Assessment practitioners must clearly articulate that outcome measures assess the program that was actually implemented, which may or may not be the program that was planned”. Two raters independently scored syllabi, mid-semester checklists, and two reflection questions to obtain a fidelity score for each instructor. The checklist included actions such as posting links in the LMS, giving in-class reminders, encouraging use before exams, and involving peer mentors or supplemental instructors. For the anatomy courses, instructors at the campus with no real change rated the highest in implementation fidelity, while instructors at the campuses that experienced considerable change rated medium or ranged from low to high.
To further test whether fidelity and student usage levels were associated with course outcomes, we conducted a two-way analysis of variance focused on the Fall 2022 data. Given the earlier findings that overall grades improved across semesters, the model was limited to Fall 2022 and included 22 matched courses to isolate the effects of instructor fidelity and student usage levels on final course grades. The model tested the main and interaction effects of instructor fidelity and student usage category on final course grades.
Instructor fidelity to the intervention was significantly associated with student grades (F(2, 1076) = 6.06, p = 0.002), with higher fidelity linked to higher average course grades. Student-level usage categories (low, medium, high) were not significant predictors of grade outcomes (F(2, 1076) = 1.31, p = 0.269), although a significant interaction between fidelity and usage was detected (F(2, 1076) = 8.23, p < 0.001). This interaction suggests that the influence of student usage on outcomes may differ depending on the level of instructor fidelity.
One additional aspect of the impact of the software was examined to determine its benefits for students. Did students exposed to using the software in the Fall 2022 experiment continue their use in the following Spring semester? These students were compared to students who used the software in Fall 2022 but were not part of the experiment. Although students in the pilot program were slightly more likely to continue using the platform (24% compared to 21% of non-pilot students), the difference was not statistically significant.
In using SARD, we did not simply focus on quantitative data analysis; we also incorporated a qualitative component that drew on insights from the 31 faculty members teaching the courses in the pilot. What changes were they seeing? A more complex picture emerges about the impact of the collaborative studying software from doing this. When instructors were asked if they saw changes in student engagement in their courses compared to previous semesters either positive or negative, among those who responded to this question (90% of sample), 47% percent reported a positive change, 18% saw a negative change, and 36% saw no change. Instructors who reported positive changes noted that students were more active in asking questions in class, formed study groups on their own, used peer tutors or SIs, attended optional labs, were more likely to attend lectures, and came to them more frequently with questions. As one instructor noted, “Students were more engaged and paid more attention when other students explained [to] them the questions and solutions in the classes in their own words”. Another instructor found that students were more willing to provide feedback about the effectiveness of assignments in helping them to learn the material compared to the amount of time it took them to complete the assignment. Instructors teaching online saw that students reported developing a sense of community in the course because of the tool which they used for online study groups and to chat with their fellow classmates. Another instructor ventured that “the software may have helped with in-class engagement by providing a space for students to engage in an online environment; they seemed to have built a community of support in the tool. This may have translated to increased comfort engaging in the classroom”.
Instructors who saw negative changes in student performance often blamed it on the COVID pandemic and its after-effects. One instructor noted that disengagement spanned several classes on her campus and appeared to be more of an issue with new first-year students than returning students. The instructors who saw no changes did not provide much additional reflection on why they thought that was the case. A few noted that students began the semester more engaged, but levels then dropped off after a few weeks of the course or the first exam.
Instructors were also asked if they saw changes in students’ performance in their courses compared to previous semesters, again, either positive or negative. Of those who responded (94%), 59% reported a positive change, 14% saw a negative change, and 28% saw no change. Of those who saw a positive change, some saw the tool as directly beneficial to their students while others felt the changes could not be attributed directly to the software. Instructors provided examples of why they reported positive changes. These include final lab averages of 79% compared to the Fall 2021 final lab average of 73%; classes where every student passed the course (no DFW grades); an average aggregate exam score of 81% where the average for the three previous semesters was 71%; percentage of students earning a B or above increased from 69% (Spring 2022) to 80% (Fall 2022); and students earning an A or B rising to 63% from previous semester levels of 32–40%. One instructor reported that of six students who were performing poorly on exams, five of them were able to pull their grades up to a passing level by beginning to use the tool to study for their fifth exam and the final exam of the course.
However, instructors also reported instances where the student performance was not as high. In some cases, instructors witnessed both the highest grades they had ever had and the largest number of students disappearing or withdrawing. Some instructors attributed higher course grades to well-prepared students, to students who were improperly placed below their true ability, or to modifications that had been made to course content and/or pedagogy (reduction in number of chapters covered, increase in active learning, use of mastery teaching model). At least one instructor noted the importance of their student supplemental instructor in encouraging students to take advantage of the tool. This student really believed in the benefits of the program and therefore did an excellent job convincing her mentees to use it.
Finally, we sought to hear from the students themselves about the value of using the software. The student feedback comments provided to us by instructors gave us initial insight into the student experience. There were clearly courses where usage of the platform never took root, so the students who did try to use it expressed frustration. Students also struggled with how to use the platform and wanted instructors to show them what to do. However, instructors could not access a student view of the platform, which left many of them frustrated. Students who did not use the tool often reported they did not need it, that they had other apps they used for studying, that instructors provided more than enough resources for them, or that they were already overwhelmed by all the technology they had to master. The most interesting feedback came from campus 4 where students had high levels of engagement with the tool and instructors actively sought written feedback from students about what they were doing with it. Students were sharing their notes and flashcards and photos from their labs, as well as web resources like videos and websites that offered 3-D practice. One student noted that creating flashcards led her to rewrite her notes and more thoroughly review material. Other students found that using the chat or study group in the tool helped them understand they were not the only people in the class struggling with certain topics. As they read their peers’ notes on the app, they could see things they had missed. One student commented that “[the app] helped me collaborate with not just students in this class but students in other classes. I felt comfortable asking questions there because it felt like everyone was there to help”. Several students mentioned that the app offered multiple study modes, and this had helped to expand their study habits as they explored new options. They were learning how to learn from their classmates.
In the following spring semester, we used instructor-provided student comments to craft surveys that were sent to all 1167 students enrolled in the pilot courses in the fall to further explore their attitudes about the tool as well as how they approached studying overall. Information about how their instructor informed them about the tool was also collected to use as part of checking instructor fidelity. One hundred and sixty-seven students agreed to answer the survey for a response rate of 14.3%.
Of the 167 students who responded:
125 (75%) students tried the platform; 42 (25%) students did not;
65 (52%) of those students who tried the platform continued to use the platform; 59 (48%) students did not;
46 (73%) of those students who continued to use the platform tried to use it for other classes that same semester; 17 (27%) students did not;
36 of continuers (57%) used it in classes the following semester; 27 (43%) did not.
Student responses about why they did or did not use the software reiterated the reasons we had already heard from the more anecdotal data provided by several instructors. One additional response from students who tried the tool but stopped using it was that they preferred to get help from the instructor or the class teaching assistant/peer mentor/SI mentor. The theme of connection came through in a number of responses from students who did use the tool. They continued using the tool because they could connect with classmates (37%), see how others study (43%), sharing helped their learning (32%), and that helping others helped them (22%).
Students were asked how their instructor communicated to them about using the collaborative studying software. Two-thirds (67%) of students reported that information about the platform was on their syllabus with an additional 61% responding that they received instructions on how to access it during the first day of class. However, fewer than one-half (48%) of students saw an information page about how to use the tool in the learning management system and still fewer (41%) reported that their instructors asked about their general use of the tool. Finally, students were asked about getting regular, in-class reminders (40% affirmative) or first week email reminders (33% affirmative) or before exam reminders (31% affirmative). Based on the student reports, we can see that fidelity for this initiative was less than optimal. The instructors were more likely in their checklists or final reflections to report that they followed through on all these items. A review of instructor-provided data indicated eight (38%) instructors scored high on fidelity, eleven (52%) scored medium, and two (9%) scored low.
Finally, we sought to establish a baseline for how students study to assess how collaborative studying software might fit into their already established routines. The students were surveyed about the strategies they used to study for class and the resources they used when they needed help with a class (scale of 1, never to 5, always). Responses to these questions are summarized in
Table 4 and
Table 5, respectively. Notably, few students reported preferring to study with a regular partner (18%) or with a study group (9%); most preferred to study by themselves (73%).
Within the survey, students also responded to items on a Growth/Fixed Mindset scale. The number of features of the software tool used by students was then correlated with their scale scores. While only two students were categorized as having a fixed mindset with some growth elements, those students used an average of 1.0 feature. The largest number of students (42) were categorized as having a growth mindset with some fixed elements. These students averaged using 2.5 features. Finally, the 16 students who were categorized as having a strong growth mindset averaged using 2.69 features. Although results are in the expected direction, the differences are not statistically significant. It is interesting and encouraging to note that no students have a strong fixed mindset.
4. Discussion: Lessons Learned
This pilot was run in the final months of the Charting the Future grant. The student survey occurred after the grant had ended. What is clear from the analysis presented here is that we did not have compelling evidence from either the two-year grant pilot or our more focused assessment pilot that the software tool was significantly impacting student course performance in a positive direction. The focused assessment pilot offered some evidence that under the right conditions, the software could help students improve course performance and reduce DFW rates; those conditions included strong instructor fidelity in promoting the tool through the syllabus, LMS, and in-class reminders. We were left with evidence that some students using the software may have passed courses they might otherwise have failed, but whether passing one course ultimately led to a degree would require following students for many years. A two-year pilot really could not “prove” that the collaborative studying software produced graduated students. More could have been achieved with these data, but university leadership was already moving on to new priorities. Unfortunately, this is common at large, multi-campus universities, where leadership turnover is relatively frequent. This represents a lost opportunity to better understand how educational technology impacts student success. Once the grant support ended for this tool, regional campus administrators decided not to renew the software contract. Too often, decisions about renewing such initiatives are made by looking at future costs and not the benefits seen from the intervention.
This does not mean that this pilot was a wasted effort. Several important findings emerged that are impacting the university’s approach to other such learning tools and practices. While the regional campuses did not see the same reductions in DFW rates as seen at the urban campus, there was anecdotal evidence from instructor and student responses that the collaborative studying platform had been effective for some students. Students reported learning new study skills from each other. They also noted that engaging with each other on the platform made it easier to engage with each other in the classroom. Instructors also reported students (particularly those in online classes) were developing a sense of community in the platform and those teaching in person felt students brought that engagement with them into the classroom. Moreover, the experience provided instructors an opportunity to explore how their students connect with each other in relation to course materials. While investing time and energy to use a specific new technology, instructors were learning, many times from students, that there are other more accessible platforms for achieving the same results.
The student survey made clear that a significant majority (78%) of students who responded prefer solo study, and they rely more on classmates (48%) and the internet (49%) for class help, rather than tutoring (16%), peer mentors (15%), or instructor office hours (14%). This knowledge of student study practices continues to shape the development of appropriate learning resources (such as
https://learning.iu.edu, accessed 19 March 2025) to assist students.
More broadly, the rigorous pilot and its assessment are a model for how to assess future investments in software applications that promise to impact student performance and retention. Once a decision is made to invest in a particular educational technology, work should begin simultaneously on both implementing the technology and designing the assessment. The following points should then be considered:
Reach consensus as to why this investment has been made. This will help to determine what needs to be assessed. Involve members of all the relevant constituents (instructors, staff, students) from the beginning in planning the assessment so that you can benefit from their knowledge as you develop your timeline, goals, and metrics (triangulating users).
Develop a realistic timeline for the assessment. Factor in rollout of the technology and required training in its use, vendor’s support services, and additional burdens that may be placed on campus staff, administrators, and users of the technology. This will allow you to develop reasonable short- and long-term goals for assessment.
Be creative in defining metrics and methods for the assessment. While learning outcomes are important (pass rates, persistence, GPA), other factors may be just as important in thinking about why this technology was chosen for implementation. Changes in student motivation and confidence, sense of belonging, engagement in courses, and improvements in instructor teaching performance may all be worthwhile factors to consider in the assessment. They should be factored into the data-gathering strategy from the beginning and may require a broader repertoire of methods to gather the data.
As HEIs continue to incorporate technology solutions to improve student success, there are several additional considerations that should be factored into those decisions. HEIs need to ensure from the beginning that they will have access to the complete data collected by the tool being assessed so that they can control their value and effectiveness assessments. Vendors do not always prioritize the data that HEIs seek. Just as HEIs may seek to avoid negative outcomes (
Oliver, 2000), vendors may shape their own quality assurance processes such that they reflect positively on the intervention being marketed, while leaving out potentially negative outcomes. The SARD approach enables HEIs to bring a variety of campus experts to the table from the beginning of the process to ensure that the data needed for outcomes assessment have been carefully defined and that these data can be collected.
Lai and Bower (
2020) note that while educational technology assessments often focus on learning outcomes, some also explore how technology affects other key areas such as affective elements, behavioral change, social presence, and pedagogical practices. Campus experts can help define which of these areas the assessment should target. Finally, vendors do not always plan to share their data with the institutions using the tool so institutional staff may be needed to help overcome this deficit. In the pilot reported here, the institution had to assign staff to build the infrastructure and process raw data received weekly from the vendor. These data were used both to direct campus implementation activities and to inform the analysis that assessed value.
Technological solutions for student success issues are subject to the same challenges as in-person academic support services at HEIs such as tutoring or learning centers, summer bridge programs, first-year success seminars, learning communities, and supplemental instruction. They must address two key issues: (1) student perception that use of these services marks them as “at risk”, and (2) use of these services is often voluntary (
Bowman et al., 2023). There have been a large number of studies, for example, on whether supplemental instruction leads to success—higher grades and lower DFW rates—in courses where it is offered; many of these studies have found positive outcomes (
Arendale, 1994;
Oja, 2012;
Stone & Jacobs, 2008). However, what these studies never seem to address directly is the fact that the students who most need support often do not seek it out. In fact, as discussed earlier in this article, they may not even be aware that such support is available to them on campus. This raises the issue of who controls the intervention being adopted—instructors or students? In the pilot discussed here, students were all entered into the software platform, but they had to log in to activate and use it. Platform use was thus voluntary. As we saw in the full two-year pilot, the campuses never saw more than about 25% of their students actually using the software. And even for those who did log in, if other students in their classes were not using it, they could not benefit from the collaborative aspect of the tool (although they could still use the tool for their own solitary studying). While the vendor tried to motivate students through an extrinsic reward system, only a handful of students ever earned rewards. The intervention described here explored whether and how instructors could motivate students to use collaborative study but because instructors could not directly see what students were doing in the platform, they could not exercise direct control by requiring students to use it as part of the course.
Bedenlier et al. (
2020) recommend that when using educational technology, students need to understand why they are being asked to use it, be taught how to use it, and be encouraged to engage with peers and teachers. While the vendor provided many resources to teach students how to use their platform, students wanted instructors to be able to demonstrate what to do or to answer questions when they encountered difficulties. Both students and instructors ended up frustrated about the disconnect which affected student adoption of the technology and instructors’ willingness to encourage student use. Allowing instructors direct access to the studying platform, however, would have negated the idea that asking fellow classmates was less stressful than asking the instructors for help.
The student survey data indicated that a strong plurality of students preferred to study by themselves. These data support the claim of
Stephens et al. (
2012) that there is a strong unspoken culture of independence in American higher education. They develop a compelling argument that in the US, the academic performance of first-generation students is undermined because they face a cultural mismatch; these students often have an interdependent focus and would be better served by pedagogies that promote collaborative and participatory learning.
King and Brigham (
2023) note that indigenous students in Canada also can face such cultural mismatches, but initiatives that encourage belonging can lead to academic completion and success. The collaborative studying software would seem to be well suited for such students, but continuing generation students have a more independent culture of higher education which means they would not be engaging with the tool. Because courses are always a mix of first generation and continuing generation students, this can pose problems. Indeed, some instructors in our DFW pilot tried to get strong students in their classes to engage with the platform, but often these students had already made other arrangements to meet their studying needs.
Finally, it is critically important that consideration of the impact of any proposed new technology on students is incorporated in the decision-making process.
Valverde-Berrocoso et al. (
2022) found in their systematic review of educational technology and student performance that international studies repeatedly show that frequent use of technology in the classroom does not correlate positively with academic performance. They explain this as potentially due to a focus on quantity and not quality of use in survey instruments, failure to directly assess the new skills produced (such as digital competence or self-directed learning), and not employing methodologies that can address the complexity of this phenomenon.
Cohn (
2021) points to the disconnect between who decides to purchase digital tools and who must use them, noting that decision-making silos often are to blame for disappointing results seen after the adoption of a new technology. While more collaborative staff–instructor interactions can address this, one group still left out is students and what they need. While pedagogically informed use of technology can support student engagement (
Schindler et al., 2017),
Zhu (
2023, p. 13) warns that technology “can also lead to distraction and disengagement if not aligned with students’ educational needs and interests”. In this pilot, for example, some students found the new tool overwhelming, and it added to the stress they faced in their studies. However, for others, the platform greatly assisted them in adopting new and improved study techniques. They had access to the platform for the two years of the pilot and then it simply disappeared, with no warning.
This case involved a well-supported effort to implement and assess the impact of a specific educational software tool. At a large, multi-campus university, and even at a single campus institution, there are myriad efforts to improve student success ongoing at various organizational levels: teachers improving their individual classes, programs examining their curriculum and its impact on students, and services trying to provide effective student and instructor supports. Efforts to assess a particular technology must deal with the many other ongoing initiatives as they compete for the attention of staff. Initiatives that actually succeed may never be scaled up because their success is lost amongst all the noise of competing efforts. One of the key points of Strategic Academic Research and Development is to focus the attention of organizational members on priority areas for exploration and improvement so that worthwhile efforts can be identified and magnified. That is particularly difficult at a large, multi-campus organization; although they have a wealth of human resources, it is difficult to harness those resources for any one initiative. Conversely, smaller HEIs likely have better prospects for harnessing staff attention to fewer and more well-designed improvement initiatives but may not have the wealth of resources for supporting such implementation with assessment efforts. HEIs often engage external consultants for developmental efforts. Unfortunately, as noted by
Pond (
2017), efforts to improve the quality and impact of an organization’s core processes, such as teaching and learning in higher education, “should probably be core competencies developed by the organization itself rather than something that comes from unaccountable external consultants”.


