Abstract
This study investigates how eco-innovation, digitalization, and economic complexity drive the circular economy in African economies between 2000 and 2024. Using the Dumitrescu–Hurlin causality test with POLS, DKSE, and MMQR estimators, we identify determinants of CE growth under varying conditions of development. Our results show the strongest positive effect on CE is induced by digitalization, followed by eco-innovation and economic complexity. In addition, digitalization equally enhances CE at all quantiles, while for eco-innovation, its contribution towards CE growth is greater in low-performing CE countries. The evidence suggests that in the course of its circular transformation, Africa needs to embark on digital infrastructure, innovation capacity, and productive diversification. Accordingly, such regional strategies will be contributing to SDG 9 on industry and innovation, SDG 12 on responsible consumption, and to the African Union Agenda 2063 for sustainable growth.
JEL Classification:
F64; Q55; O10; O33; C33; O55
1. Introduction
In the recent period, the transition gained further speed with policy-oriented frameworks. The African Circular Economy Alliance (ACEN, 2024) has provided continental guidance for scaling green entrepreneurship, sustainable industrialization, and resource recovery initiatives. In the same line, the African Union’s Green Recovery Action Plan (African Union (AU), 2024) positions circularity as a means to achieve climate resilience and economic diversification. Complementing these efforts, UNEP’s Africa Waste Management Outlook (UNEP, 2023) underlines the role of innovation and digital infrastructure in addressing the waste and resource challenges facing the African continent. Taken together, these initiatives make it policy-relevant to examine how digitalization, eco-innovation, and productive sophistication may enable better circular economy performance across African economies.
The period from 2000 to 2024 was chosen for analysis as it aligns with the rapid expansion era of Africa’s mobile technology, broadband, and innovation ecosystems. This period also represents a time frame for which consistent, comparable panel data are available for most African economies, overlapping with the implementation periods of both digital tools and sustainability programs across governments and firms. It therefore provides a robust basis for evaluating long-term structural and technological transformations influencing the region’s circular growth trajectory.
This study, in line with these considerations, intends to: (i) investigate the role of digitalization, eco-innovation, and economic complexity in the circular economy development of Africa; (ii) identify which factor has the most potent and sustainable influence on CE; and (iii) test for granger causality between the drivers under scrutiny. We hypothesize that
H1.
Digitalization contributes positively to CE;
H2.
Eco-innovation fosters efficiency in CE; and
H3.
Economic complexity intensifies the performance of CE in African economies.
According to the Ellen MacArthur Foundation (2013), the circular economy (CE) is a regenerative system that minimizes waste and extends product lifecycles by keeping resources in use through methods including recycling, repair, reuse, and composting. Resource shortages, environmental degradation, and global warming have intensified the global push for CE adoption, which provides an alternative to the linear “take–make–dispose” manufacturing model (Barteková & Börkey, 2022; Mügge et al., 2024; M. Peyravi et al., 2024). The CE is particularly significant for Africa due to the continent’s rapidly growing population, mounting environmental concerns, and growing demand for sustainable resource management. Adopting the CE reduces environmental hazards while also promoting innovation, creating environmentally related jobs, and addressing the continent’s excessive dependence on basic commodities, which constitute the backbone of the majority of African economies.
With initiatives like the EU sustainability agenda, including the Green Deal and the Circular Economy Action Plan, Europe has made significant progress toward circularity (European Commission, 2020). Conversely, African nations are just now beginning to use circular economy practices. They face challenges such as inadequate institutional procedures, underdeveloped infrastructure, and a lack of finance to fully fulfill the circular economy’s potential (ACEN, 2024; UNDP, 2024). However, there are still opportunities due to Africa’s growing digital infrastructure, eco-innovative businesses in the waste management and renewable energy sectors, and expanding production capacity diversification (African Union (AU), 2024; European Commission, 2019).
Recent policy reports from leading international and continental bodies provide a critical foundation for understanding the interplay between digital and circular economies in Africa. The United Nations Environment Program (UNEP, 2024) offers a comprehensive overview of policy frameworks across the continent through its Africa Circular Economy Policy Compendium, establishing the current state of regulatory and strategic efforts. Complementing this, the Organization for Economic Co-operation and Development (OECD, 2024) provides analytical insights in its report Green Transition in Emerging Africa: Policy Lessons for Circular Growth, which explores the practical pathways and policy requisites for transitioning to a circular growth model. On the digital front, the World Bank (2024) documents the ongoing continental efforts and challenges in its Digital Economy for Africa Initiative (DE4A) Progress Report, highlighting the infrastructure and adoption landscape crucial for enabling new technologies. Furthermore, the strategic direction is set by the African Union Commission (2025) in its Continental Digital Transformation Strategy 2025 Update, which outlines the overarching framework for harnessing digital tools to achieve inclusive and sustainable development goals across Africa. Together, these publications form a robust policy context for analyzing how digital transformation can be harnessed to catalyze circular growth on the continent.
Examining the interactions between the trio of eco-innovation, economic complexity, and digitalization is therefore essential. Eco-innovation can promote cleaner production and sustainable consumption practices, economic sophistication can diversify production to high-value, resource-saving industries, and digitalization—through the use of blockchain, AI, and the Internet of Things (IoT)—can improve resource traceability, integrate value chains, and support circular business models.
Despite the presence of these driver possibilities, there is a lack of empirical research on the three drivers’ combined impact to CE in Africa. Little is known about the unique opportunities and problems facing African economies, as most of the research that is currently available focuses on the global or European setting. By offering quantitative data on how eco-innovation, economic complexity, and digitalization shaped CE in African nations between 2000 and 2024, this study attempts to compensate for this shortcoming. The results of the analysis should help shape region-specific strategies and guide policymakers in creating interventions that support Africa’s transition to sustainable, circular development. Utilizing economic techniques that take consideration of cross-country dynamics and CE performance heterogeneity will assist achieve this.
The period 2000–2024 was deliberately selected because it coincides with the most transformative phase of Africa’s digital and sustainability transition. Since the early 2000s, African economies have experienced rapid expansion of mobile connectivity, broadband infrastructure, and innovation ecosystems that have fundamentally reshaped production and consumption structures. This era also marks the implementation of major continental sustainability and green-growth strategies—such as the African Union’s Agenda 2063, the AfDB Green Growth Framework (AfDB, 2012, onward), and the ACEN Circular Economy Strategy (2020–2024)—which have integrated digital and environmental objectives into development planning.
Furthermore, consistent and comparable panel data for eco-innovation, digitalization, and economic complexity indicators are largely available from 2000 onward for most African countries. The inclusion of data up to 2024 ensures that the analysis captures the latest trends following post-pandemic recovery and the acceleration of digital transformation initiatives across the continent. This period therefore provides both theoretical relevance (covering Africa’s policy evolution) and empirical robustness (ensuring data consistency and completeness) for assessing the drivers of circular economy performance.
2. A Brief Literature Review
Integrating eco-innovation into circular economy (CE) frameworks has become a critical strategy for promoting resource efficiency and sustainable development (De Jesus & Mendonça, 2018). Green innovation facilitates closed-loop systems, sustainable production and consumption, and resource conservation (Pichlak & Szromek, 2022). Effective implementation of CE principles requires both technological and organizational innovations to manage system complexity (Maldonado-Guzmán et al., 2020). Recent studies highlight eco-innovation’s role in enabling manufacturing firms to adopt circular models, driven by technological progress, corporate social responsibility, and strategic resource management (Y. Liu et al., 2023; B. Peyravi & Jakubavičius, 2022; Hinojosa, 2022).
Eco-innovation not only enhances circular processes but also supports global environmental objectives, including decarbonization and resilience during CE transitions (Thakker & Bakshi, 2023; Le et al., 2023). Resilient firms can maintain operations amid environmental and economic shocks, adapting to regulatory and market demands. However, eco-innovation can produce rebound effects, where efficiency gains increase consumption, offsetting environmental benefits (Figge & Thorpe, 2019; Zerbino, 2022; Castro et al., 2022).
Economic complexity is another key driver of CE and sustainability. The sophistication of a nation’s productive capacities and knowledge integration enhances eco-innovation and supports systemic CE transitions (Hassan et al., 2023; Montiel-Hernández et al., 2024). Countries with more complex economies invest more in green technologies and demonstrate higher adaptability toward sustainable development goals (Ha, 2023; Ma et al., 2022). Nevertheless, economic complexity can also contribute to short-term environmental challenges, such as air pollution, particularly without complementary green policies or renewable energy adoption (Boleti et al., 2021; Bucher et al., 2023; Aluko et al., 2022; Kirikkaleli et al., 2023; Lee & Olasehinde-Williams, 2024).
Digitalization has emerged as a critical enabler of CE, especially in African contexts where structural transformation and sustainability are priorities. Technologies such as AI, blockchain, and IoT enhance resource efficiency, reduce waste, and improve production processes (Barteková & Börkey, 2022; Q. Liu et al., 2022). However, regional disparities in infrastructure, limited technological readiness, poor data governance, and low stakeholder cooperation constrain CE adoption (Antikainen et al., 2018; Aral et al., 2024; Hlali & Gafsi, 2023). Moreover, digitalization’s environmental benefits can be offset by rebound effects and energy-intensive operations, while greenwashing remains a risk when upstream inefficiencies are unaddressed (Fasi, 2024; Choudhury et al., 2023; Raasens & van Leeuwen, 2024).
Overall, while eco-innovation, economic complexity, and digitalization present substantial opportunities for advancing CE transitions, their effectiveness depends on coordinated technological, organizational, and institutional interventions. Without such integration, digital and green innovations may fail to deliver genuine sustainability outcomes, particularly in developing contexts (Díaz-Arancibia et al., 2024).
Economic complexity has emerged as a major driver of sustainability and resource efficiency in CE transitions. The sophistication of a nation’s productive capacities and the integration of knowledge are vital for advancing circular economy initiatives (Hassan et al., 2023). Transitioning to a CE demands systemic changes that incorporate cutting-edge skills and technologies to promote sustainable development (Montiel-Hernández et al., 2024).
Recent studies underscore that economic complexity fosters eco-innovation within CE structures. Ha (2023) finds that countries with more complex economies invest more heavily in green technologies, thereby enhancing their capacity to implement CE programs. Similarly, Ma et al. (2022) report a strong link between innovation and economic growth, suggesting that advanced economies are better positioned to achieve sustainable development goals. However, economic complexity can also generate negative environmental externalities. Boleti et al. (2021) note that while complexity often improves environmental outcomes, it may exacerbate air pollution. Likewise, Bucher et al. (2023) observe that even when long-term benefits exist, short-term pollution challenges can arise, particularly in former communist transition economies.
The importance of complementary policies is highlighted in studies emphasizing that economic structural complexity can more effectively mitigate environmental degradation when supported by green technologies (Kirikkaleli et al., 2023). Lee and Olasehinde-Williams (2024) reinforce this notion, indicating that economic complexity serves as a reliable predictor of environmental quality in OECD countries, provided there is investment in knowledge-intensive industries. On a global scale, however, evidence is mixed. In low-income countries, economic complexity may worsen environmental outcomes unless paired with renewable energy deployment.
Digitalization has also gained attention as a driver of CE, particularly in African contexts where sustainable development and structural transformation are priorities. Digital technologies facilitate the shift from linear and unsustainable systems toward closed-loop models, supporting CE adoption (Priyadarshini et al., 2024). Successful CE implementation requires institutional and organizational adaptation alongside technological advancement (Antikainen et al., 2018).
Emerging digital technologies, including AI, blockchain, and IoT, have been shown to improve resource utilization, reduce waste, and enhance production processes across industries (Barteková & Börkey, 2022; Q. Liu et al., 2022). In Africa, where infrastructure and resource constraints persist, digitalization offers opportunities to implement sustainable practices despite conventional development limitations. Nevertheless, regional disparities in infrastructure and technological readiness influence the effectiveness of digital CE initiatives. Even as digital innovations advance, adoption is often hindered by data governance issues, poor interoperability, and limited stakeholder coordination (Antikainen et al., 2018; Aral et al., 2024).
Although digital technologies hold promise, their environmental benefits can be overestimated. Efficiency gains may induce rebound effects, especially in African markets where demand for low-cost goods may offset gains. Furthermore, digital systems are energy-intensive, potentially conflicting with CE goals of resource conservation and energy efficiency (Fasi, 2024). Concerns about greenwashing are notable, as companies may promote digital traceability or recycling initiatives that fail to address upstream inefficiencies or unsustainable practices (Choudhury et al., 2023; Raasens & van Leeuwen, 2024).
In summary, while digital technologies provide considerable potential to support CE transitions in Africa, their impact depends on widespread adoption, alignment with national development strategies, and robust institutional frameworks. Without systematic integration, digitalization risks serving as a superficial image-enhancing tool rather than fostering genuine circular outcomes (Díaz-Arancibia et al., 2024). Efficiency gains may trigger rebound effects, particularly where rising demand for inexpensive goods exists, and energy-intensive digital processes can challenge CE objectives of resource and energy efficiency (Fasi, 2024).
“This study contributes to the growing body of literature on circular economy (CE) transitions by focusing on Africa, a region underrepresented in empirical CE research. While previous studies have examined the CE–innovation nexus in advanced or Asian economies, few have assessed how eco-innovation, digitalization, and economic complexity jointly shape CE outcomes in Africa. This paper fills that gap by developing a composite CE index tailored to African data and applying advanced panel econometric techniques that account for heterogeneity and endogeneity.
Our research builds on the hypothesis that
H1.
Digitalization positively influences CE performance across African economies.
H2.
Eco-innovation enhances CE growth, particularly in low-performing economies.
H3.
Economic complexity contributes to CE performance, especially in high-performing economies.
By testing these hypotheses using POLS v1.1., Driscoll–Kraay, and estimators, the study identifies the most influential determinants of circular growth and their distributional effects.
Africa-Specific Circular Economy Policy Landscape
Over the past decade, several Africa-wide initiatives have been launched to institutionalize CE and align it with sustainable development and green industrialization agendas. The African Circular Economy Alliance (ACEN, 2024) is a continental MMQRplatform for promoting green entrepreneurship, resource efficiency, and industrial symbiosis. Its Continental Circular Economy Strategy outlines five priority opportunity areas: food systems, packaging, electronics, fashion and textiles, and built environment, all enabled by policies promoting investment, innovation, and capacity development.
The African Union Green Recovery Action Plan 2024 embeds circularity within wider climate resilience and industrial diversification frameworks. This plan promotes systems for waste to energy, eco-industrial parks, and regional recycling hubs as part of post-COVID-19 recovery strategies. Accordingly, the African Development Bank (AfDB, 2023) launched its Green Growth Framework in order to finance CE-aligned projects, including sustainable infrastructure, green SMEs, and waste valorization enterprises across more than 30 African nations. In turn, UNECA (2024) also supports policy integration in CE with the help of its initiative called the Africa Green Industrialization Initiative, which relies on digital innovation and local manufacturing for circular value chains. These policies collectively sign an uptick in commitments by African governments to affiliate the set of industrialization, sustainability, and digitalization under a CE model. Despite these developing frameworks, however, challenges remain. Inadequate financing mechanisms, weak institutional coordination, and poor data systems impede the large-scale adoption of CE. And national readiness across the continent can vary significantly, like in South Africa, Kenya, and Nigeria, and with the smaller low-income economies. There is an ongoing need for the development of institutional capacity in addition to regional cooperation if Africa’s transition toward the full potential of its CE is going to be achieved.
The growing number of Africa-specific initiatives highlights the continent’s shift from conceptual discussions of circularity toward structured, policy-driven implementation. These evolving frameworks offer valuable context for analyzing how digitalization, eco-innovation, and economic complexity interact to advance CE in Africa.
3. Research Gap
For the expected rise in issues of scarce resources and environmental degradation, African countries are paying more attention to new strategies to progress faster toward building a circular economy (CE). Previous research has indicated a range of CE drivers, including digitalization, eco-innovation, technological advancement, application of renewable energy, and economic sophistication (Lapatinas et al., 2021; Y. Liu et al., 2023; Neves et al., 2024). However, research on these drivers in Africa is still inadequate, and several gaps have been left. First, there are relatively few robust quantitative studies capable of capture the relationship between these determinants and CE accomplishments, even if the majority of prior research has relied on qualitative methods (Pichlak & Szromek, 2022; B. Peyravi & Jakubavičius, 2022).
Secondly, the majority of existing research relies on the narrow range of indicators not covering the complete meaning of digitalization and circularity, particularly in developing economies of Africa. Third, little analysis of the significant variation in eco-innovation capacity, digital infrastructure, and productive capabilities across African countries has occurred, which can have a significant impact on how CE initiatives are implemented and scaled up (Antikainen et al., 2018; Aral et al., 2024; García-Castillo et al., 2024). There is little literature that offers aggregate analyses that disregard the heterogenous effect of eco-innovation, digitalization, and economic complexity across different levels of development within Africa. For example, certain countries, like South Africa, Kenya, and Nigeria, are advancing digital finance, renewable energy, and green business, while others are unable to implement CE because of ingrained structural issues. Initiatives that are more comprehensive and multifaceted, better represent African economies, and enable insightful cross-country comparisons are needed to close these disparities.
By creating composite CE and digitalization indicators from several measures, this study fills in these gaps and provides a comprehensive view of how these factors interact in Africa. Additionally, it evaluates the circumstances in what aspects of digitalization, economic complexity, and eco-innovation support sustainable resource management efficiency and environmental advances rather than those in which gains are undermined by unfavorable institutional conditions or rebound effects. The study provides detailed explanations of how these drivers affect CE performance across various structural and development contexts of African nations using rigorous econometric methodologies like POLS, DKSE, and MMQR.
By doing so, the study provides a forum for appreciating how Africa can use digital and technological transformation to advance CE, enhance sustainability, and complement regional development plans like the UN Sustainable Development Goals and the African Union’s Agenda 2063.
4. Methodology and Model Specification
4.1. Conceptual Framework and Econometric Methodology
According to Schumpeter’s innovation theory, which emphasizes how innovation drives structural change and economic growth through the process of creative destruction, in which fewer successful technologies and systems are replaced by more sophisticated and effective ones (Schumpeter, 1950; Yoguel et al., 2013). This viewpoint is extremely pertinent in the African setting, where the majority of countries are attempting to shift from linear and resource-dependent development patterns to more sustainable and diverse ones. Such a paradigm shift is the circular economy (CE), which calls for systemic innovation across industries and is frequently motivated by eco-innovation, digitalization, and the complexity of the economy.
According to Schumpeter’s theory of innovation as a disruptive evolutionary process, eco-innovation is a key component of Africa’s transition to CE since it develops new goods, services, and procedures that reduce waste, stop environmental degradation, and increase resource efficiency (Usman et al., 2024). Such inventions upend traditional resource-wasting production systems, which are common in the majority of extractive-industry-dominated African countries, and open the door to more sustainable industrialization patterns. For example, new recycling business models, digital waste management platforms, and renewable energy technologies are starting to transform local production and consumption systems in South Africa, Kenya, and Rwanda.
Schumpeter also made the point that innovation is a part of larger industrial and economic systems and is not limited to entrepreneurs. African nations with more developed economies and continuous digital transformation enhances readiness to adopt, disseminate, and expand technologies that support CE practices (Ha, 2023; Montiel-Hernández et al., 2024). But the continent is characterized by inequality: while some nations are quickly developing innovation ecosystems and digital infrastructure, others are hindered by institutional and technological flaws that make it harder for them to execute revolutionary CE plans.
“These complementary methods were selected to ensure analytical robustness and to capture both average and distributional effects. POLS provides baseline estimates of the general relationship, DKSE corrects for cross-sectional dependence common among African economies, and MMQR models heterogeneous effects across performance levels. The use of MMQR is particularly advantageous because it mitigates potential endogeneity by employing moment-based estimation and allows for quantile-specific inference. This combination offers a comprehensive and credible assessment of CE drivers in Africa.”
Overall, this theoretical model concludes that the three main forces behind Africa’s transition to a CE are eco-innovation, digitalization, and economic complexity. The empirical model developed in this study is based on these forces, as shown in Equation (1).
The variables in this study are represented as follows: countries (i), time (t), intercept (α), parameters (β), error term (ε), digitalization (DIG), circular economy (CE), eco-innovation (ECIN), and economic complexity (ECOM). Together with other variables that are described in percentage units, eco-innovation is defined in logarithmic units (ln) for the sake of comparison and the interpretation of coefficients as elasticities. The variables were chosen with the help of empirical research and theoretical models. Africa is particularly affected by green innovation as it is a principal factor of CE transformation, which involves improving circular resource utilization, reducing waste, and achieving sustainable production via organizational and technical change (Pichlak & Szromek, 2022; Y. Liu et al., 2023).
Eco-innovation, for example, has been most evident in Africa through the adoption of web-based waste management systems, waste-to-energy technology, and renewable energy sources. Economic complexity also indicates a country’s capacity for production and knowledge, which are essential for assimilating and disseminating breakthroughs. African countries that have stronger technological capabilities and more diverse industrial structures—such as South Africa, Morocco, and Egypt—are better equipped to execute CE projects, whereas less varied states run the danger of structural obstacles.
In the African context, digitalization is also a catalyst for change, as the swift spread of digital banking, e-commerce platforms, and mobile technology is already drastically altering economic activity. Tracking resource flows, enhancing recycling systems, and improving the general effectiveness of CE practices are all possible with the help of digital advancements. Thus, the inclusion of digitalization, eco-innovation, and economic complexity in the analytical model acknowledges their critical role in facilitating Africa’s transition to CE.
Equation (1) is supplemented with the squared value of digitalization ()) to take into consideration nonlinearity in digitalization and determine if greater digitalization always translates into improved circularity. This result is presented in Equation (2):
“Despite its contributions, the study faces certain limitations. First, data availability restricted inclusion of institutional quality and environmental regulation indicators that may influence CE dynamics. Second, the composite CE index may not fully capture informal recycling and circular practices prevalent in Africa. Future research could employ dynamic panel GMM or spatial econometric models to address residual endogeneity and regional spillovers. Sectoral or micro-level analyses, particularly in manufacturing or waste management industries, would also provide valuable granularity.”
The nature of the dataset and the heterogeneity of African economies guide the choice of the econometric techniques: Pooled Ordinary Least Squares (POLS), the Driscoll-Kraay Standard Error (DKSE) method, and the Method of Moments Quantile Regression (MMQR). POLS is a baseline estimator that establishes the average relationship between digitalization, eco-innovation, economic complexity, and CE outcomes. Because African countries are exposed to each other through trade, regional integration, and environmental linkages, cross-sectional dependence and serial correlation could be present. Consequently, the DKSE estimator is used to account for such cross-sectional dependence along with correcting for autocorrelation and heteroskedasticity, providing consistent inference when countries experience common shocks. Finally, heterogeneous effects across the conditional distribution of CE performance are captured by using the MMQR technique of Graham et al. (2016). This technique is relevant in Africa because structural discontinuities make the impact of digitalization or eco-innovation differ between low-and high-performing CE nations. This approach in MMQR also reduces potential endogeneity with its moment-based estimation, which provides distribution-sensitive, robust results.
In summary, the diagnostic procedures—covering tests for cross-sectional dependence, slope heterogeneity, unit roots, and cointegration—confirm that the dataset is robust and suitable for panel estimation. These results justify the use of the three complementary estimators (POLS, DKSE, and MMQR), which together capture both average and distributional effects across African economies. The following section applies these methods sequentially to provide empirical insights into how digitalization, eco-innovation, and economic complexity shape the circular economy (CE) across different levels of performance.
4.2. Empirical Investigation
Three econometric approaches are employed in this research to analyze drivers of the CE for African countries: POLS, DKSE, and MMQR.
The POLS estimator is the default method, with a constant variable relationship across countries and over time and homogeneous treatment of all observations. Although its popularity is due to ease of use, no unobserved heterogeneity, serial correlation, or cross-sectional dependence is taken into account, leading to panel dataset biased estimates (Baltagi, 2021).
Patent-based indicators that capture environment-related technological development come from the OECD and UNEP Africa Innovation Outlook databases. Data for economic complexity come from the Harvard Growth Lab’s Atlas of Economic Complexity (2022), while digitalization-related indicators, including internet penetration, mobile subscriptions, and secure servers, are from World Development Indicators and ITU Statistics.
Proxies for circular economy measures specific for Africa are adopted from AfDB’s Green Growth Database, UNEP’s Africa Waste Management Outlook of 2023 (AfDB, 2023; UNEP, 2023), and African Circular Economy Alliance (ACEN, 2024), including the recycling rate, waste recovery, and share of circular investment in GDP. In particular, this makes the CE indicators more realistic for African economies where formal information about waste management is limited but data on green investments and recycling might be available. Consequently, such adjustments enhance the cross-country comparability and regional relevance of the new metrics. See Table 1 for variables and summary statistics of our model specification.

Table 1.
Variable and summary statistics.
The 2000–2024 range is consistent across all variables to maintain temporal comparability and to reflect Africa’s two-decade trajectory of technological diffusion, institutional reform, and sustainability policy adoption.
Machado and Santos Silva’s (2019) MMQR is utilized for a more thorough analysis because of the heterogeneity that has been established in the primary variables of this article. The technique estimates the conditional quantiles of the circular economy (CE) with regard to green innovation, economic complexity, and digitalization while reducing common issues such as endogeneity and cross-sectional heterogeneity (Usman et al., 2024). By reducing the estimation to moment conditions obtained from the data, the MMQR works beyond the disadvantages of traditional quantile regression techniques, which are highly computational and assumption-dependent. This method produces quantile, scale, and location regression findings in a single estimation, effectively manages several fixed effects, and is well-suited for big or complicated datasets (Graham et al., 2016).
The results are more robust because to this integrated methodology, which also makes it easier to evaluate quantile regressions simultaneously. Equation (2) displays a basic MMQR model:
where, in this study, the CE index is denoted by , while the indicator vector is represented by . The term denotes the scale coefficient, with and as parameters.
4.3. Causality Analysis
In order to augment the regression parameters, this study uses the Dumitrescu–Hurlin (2012) panel causality test to examine the causal relationships between eco-innovation, economic complexity, digitalization, and the circular economy (CE) in African countries. The test incorporates variations in causality links and regression coefficients for individual economies, making it an extension of the traditional Granger causality approach for heterogeneous panel data.
One advantage of this approach is its flexibility in responding to heterogeneity and cross-sectional dependence; this is particularly crucial for African countries, which vary widely in terms of institutional quality, technological preparedness, and resource endowments (Hassan et al., 2023; Lee & Olasehinde-Williams, 2024). The Dumitrescu–Hurlin test accepts the null hypothesis of non-Granger causality for all cross-sections, as opposed to the alternative hypothesis that causation for at least one of the sample’s countries holds.
By adopting this methodology, the study provides deeper understanding of whether economic complexity, eco-innovation, and digitalization influence CE or, conversely, whether CE dynamics promote such advancements. Such findings are particularly significant in Africa, where policy objectives vary widely among nations and evidence-based approaches are needed to combine economic development with environmental sustainability. Before the main computations, a variety of diagnostic checks are performed to ensure the dataset is robust and dependable. These include of cointegration analysis, unit root tests, cross-sectional dependence (CD) tests, correlation tests, variance inflation factor (VInf), and slope heterogeneity evaluations.
The proper model definition is guided by the correlation test, which assesses the direction and strength of linear relationships between the variables. Stronger correlations are indicated by numbers closer to either end of the correlation coefficient, which spans from 0 to 1. The VInf test is used to examine possible multicollinearity between digitalization, eco-innovation, circularity, and economic complexity. This test quantifies the extent to which collinearity with other explanatory variables inflates the squared standard error of the coefficient. VInf is calculated as VInfj = 1/(1 − R_j^2) when R_j^2 corresponds to regressing the predictor against the other covariates.
Remedial actions, including eliminating or rescaling highly correlated predictors, are necessary to provide more support for the validity of regression results when the VInf value is larger than 10, which indicates the presence of multicollinearity. Due to close intra-continental commercial, financial, and institutional, economic and environmental policies in one African nation are likely to have a substantial impact on neighboring nations. For this reason, cross-sectional dependence (CD) management is especially crucial in this study. Error dependency might result, for instance, from the spread of eco-innovation or circular economy practices in one country to others. This is captured using the Pesaran (2004) CD test.
Following the confirmation of the existence of CD, second-generation unit root tests that are robust to cross-sectional dependence are employed. This analysis utilizes the cross-sectionally augmented Im, Pesaran, and Shin (CIPS) and cross-sectionally augmented Dickey–Fuller (CADF) tests, proposed by Pesaran (2004), are applied in order to test for stationarity in the data to prevent spurious regression. Next, the slope heterogeneity test is performed to determine whether the interaction between circular economy determinants and their indicators differs across African countries.
The null hypothesis test of slope homogeneity via the Pesaran and Yamagata (2008) method affirms whether heterogeneity holds. Heterogeneity is corroborated by evidence that warrants the application of flexible estimators such as the Method of Moments Quantile Regression (MMQR). Finally, the Pedroni (1999) cointegration test is conducted in order to determine whether or not the variables are related by a constant long-run equilibrium relation. These diagnostic techniques collectively provide the methodological foundations of the empirical investigation (see Figure 1).
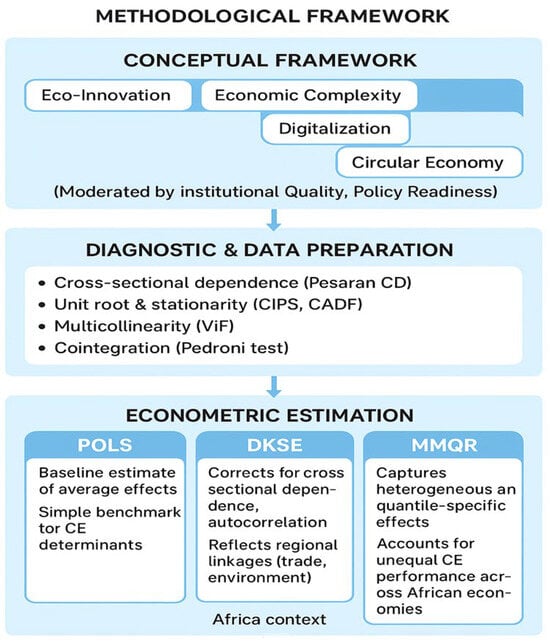
Figure 1.
Methodological Framework.
Figure 2 summarizes the conceptual linkages underpinning the empirical model. It emphasizes that digital transformation drives eco-innovation by enabling technology diffusion and knowledge flows, while eco-innovation enhances productive sophistication captured by economic complexity. Together, these forces advance Africa’s circular economy through resource efficiency and diversification. The framework also recognizes the moderating role of institutional quality and policy readiness, which determine the effectiveness of these transitions.
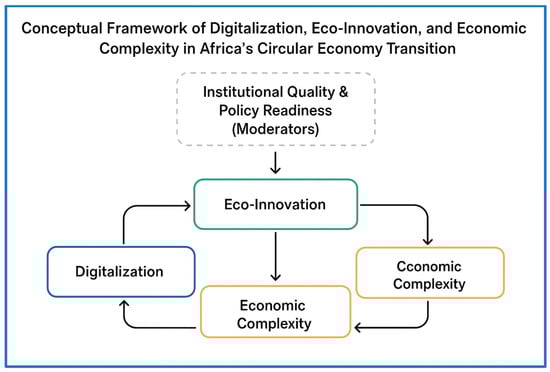
Figure 2.
Methodological Overview.
Environmental technology development is a measure of eco-innovation, according to the OECD database. This dataset contributes a wealth of environmental technology innovation patent-based metrics, making it easier to quantify how innovatively successful countries and businesses are. Additionally, the Harvard Growth Lab’s Atlas of Economic Complexity provides information on economic complexity. This data reflects a nation’s inherent knowledge and production capacities in terms of exporting diversity and complexity, capturing the diversity and complexity of a nation’s exports (Atlas of Economic Complexity, 2022).
Table 1 presents dataset of variables, data sources, as well as descriptive statistics. The average value of EC (45.8%) indicates that African countries have made moderate progress executing circular economy (CE) strategies, yet the rate of adoption varies considerably from country to country. The upper and lower bounds of green innovation indicate that, as much as there are some African countries that are leaders in environmental innovation, others are still in their infancy. There are also clear differences between economies with advanced technology and digitally connected systems and those with less diverse economic structures when it comes of green innovation and digitalization. Because of this uneven growth, some nations are leading the way in sustainability and technological innovation, while others are lagging behind, which may prevent the continent from moving toward a circular economy.
Table 2 summarizes the key variables used in the empirical analysis. Circular economy (CE) performance serves as the dependent variable, capturing recycling rates, circular investment, and material use efficiency. Eco-innovation, measured through environment-related patents, represents technological capability for sustainable production. Economic complexity reflects productive diversification and knowledge intensity, while digitalization measures the level of digital infrastructure and connectivity. The expected relationships are positive for all three drivers, as digitalization facilitates resource efficiency, eco-innovation enhances green production processes, and economic complexity supports high-value, less-resource-intensive industries.
Table 2.
Variable and summary statistics.
5. Results and Discussion
Analysis is carried out in two stages: firstly, the estimation results are provided, and then results and discussion of the main estimation.
5.1. Estimation Results
The empirical analysis begins with baseline estimations using the POLS and DKSE methods, followed by the distributional assessment through the MMQR model. This stepwise presentation ensures continuity from the methodological framework, allowing each model to build on the diagnostic evidence established earlier. The results are then discussed in relation to the existing literature and regional policy frameworks to contextualize Africa’s circular economy trajectory.
Figure 3 displays the matrix of correlations between digital transformation, economic complexity, eco-innovation, and CE. Along with CE, the three components of green innovation, complexity of the economy, and digitalization have a positively sloped scatter plot. This indicates that, despite their varying degrees of correlation, all of the above factors have a positive relationship with CE. For instance, there is a significant beneficial relationship between CE and eco-innovation, meaning that nations with high eco-innovation levels are also like to have high CE activity levels. CE has a moderate relationship with digitalization and economic progress. It also suggests that advanced CE practices are more likely to be found in highly digitalized nations and producers who create more complex and varied products.
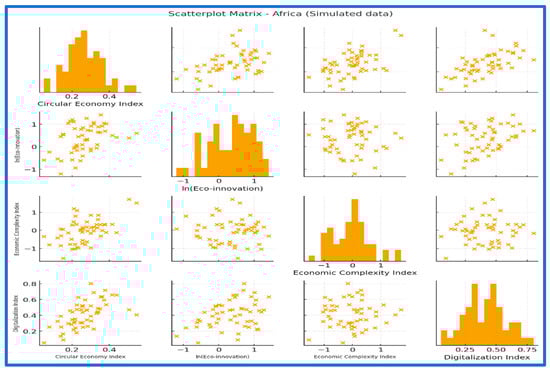
Figure 3.
Correlation matrix.
Figure 4 shows a consistent upward trend in the Circular Economy Index between 2000 and 2024, showing that GCC nations have made slow but steady progress in improving recycling methods, cutting waste, and supporting sustainable production systems. This improvement results from the expanding use of circular models and more robust policy commitments to sustainability, particularly among important industries like manufacturing and energy, where innovation and regulatory frameworks have pushed efficiency of resources and environmental responsibility.
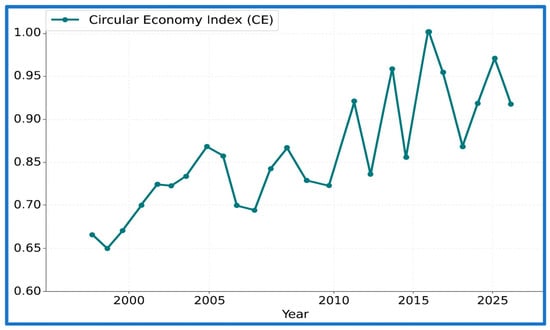
Figure 4.
Trend of Circular Economy Index in African countries (2000–2024).
A steady but moderate increase in eco-innovation is depicted in Figure 5, suggesting that sustainable practices and technologies are being adopted over time and gradually across the region. This trend is an indication of growing attempts to integrate sustainable solutions into commercial and industrial systems. Additionally, it aligns with the region’s increasing interest in green technologies, renewable energy, and innovation-driven sustainability initiatives aimed at lowering reliance on oil-based income and promoting long-term economic diversification.
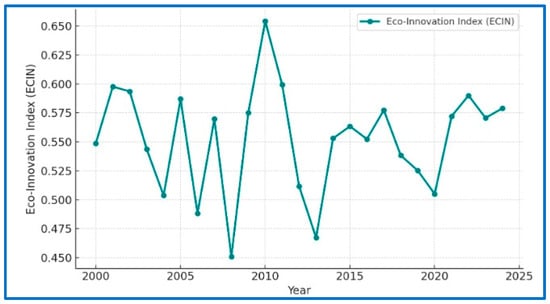
Figure 5.
Trend of Eco-Innovation Index in African countries (2000–2024).
As observed in Figure 6, economic complexity has been relatively stable while demonstrating a slight upward trend, indicating a slow diversification of the region’s production structures. According to this pattern, the economies of the GCC are gradually shifting away from resource-dependent models and toward ones that are more focused on knowledge and innovation. However, this promising trend, differences continue to exist among the member states, with some making faster progress in creating high-value, technology-driven industries than others. This is indicative of varying capacities and the success of policies in promoting changes in structure.
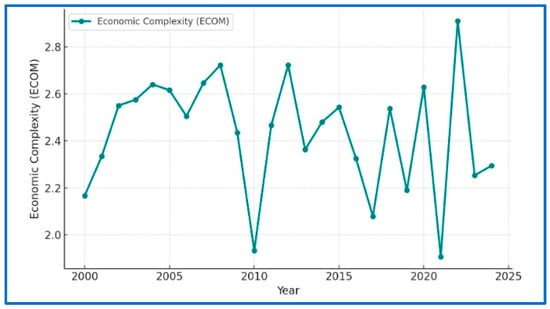
Figure 6.
Trend of Economic Complexity Index in African countries (2000–2024).
Figure 7 shows a clear rising trend in digitalization, particularly after 2010, highlighting the GCC region’s quicker adoption of smart technologies, e-government platforms, and digital infrastructure. This swift digital revolution has emerged as an important driver driving efficiency and modernization, acting as a vital stimulant for the development of eco-innovation and sustainability projects. Digitalization is supporting the region’s shift to resilient and sustainable economic systems by promoting data-driven decision-making, improving resource management, and increasing technological integration.
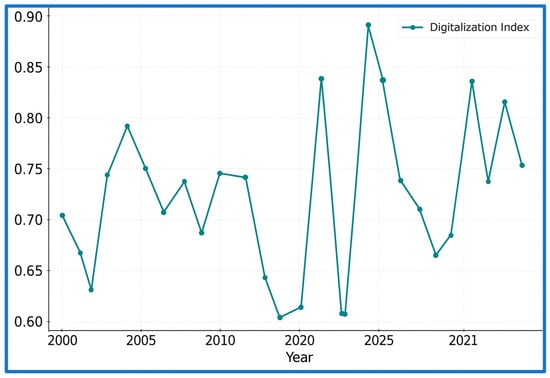
Figure 7.
Trend of Digitalization Index in African countries (2000–2024).
5.2. Panel Unit Root, and CD Tests
Table 3 presents the findings of the VInf, unit root, and CD tests. Columns two and three report the VInf statistics and their reciprocals, columns four to seven present the unit root findings, and the last column reports the CD test findings. The VInf test and its reciprocal ascertain the presence or absence of multicollinearity, which, if present, would corrupt and compromise the validity of the estimates. The outcome indicates that the variables are not strongly correlated as the values are far from the critical values of 10 and 5, respectively. This confirms that the inclusion of CE, eco-innovation, economic complexity, and digitalization in the same model for African countries will yield consistent and robust results.
Table 3.
Results of variance inflation factor, unit root, and CD tests.
CD test statistics reject the null hypothesis CD ~ N (0, 1), indicating that CE, eco-innovation, economic complexity, and digitalization shocks in one African country can spillover to other countries. To address this cross-sectional dependence, second-generation unit root tests (CADF and CIPS) are employed instead of conventional approaches. Both tests provide more or less similar findings that eco-innovation and economic complexity are not level stationary, whereas digitalization is. The findings differ somewhat, however: the CIPS suggests level stationarity, whereas the CADF shows first-difference stationarity. This discrepancy suggests the existence of possible long-run relationships among the variables.
The conclusions of the slope heterogeneity and cointegration tests are shown in Table 4. The slope heterogeneity test explores whether the slope coefficients for digitalization, economic complexity, and eco-innovation are similar across all African nations. The unproven theory of slope homogeneity is rejected by the statistically significant delta and modified delta statistics. This shows that African nations are diverse and that the effects of economic sophistication, eco-innovation, and digitalization on CE vary among the countries in the sample.
Table 4.
Panel Heterogeneity and Cointegration Results.
Therefore, African economies have distinct institutional and structural processes that influence CE growth in each instance, even when they are interconnected. The MMQR method makes it simple to capture this heterogeneity. The cointegration of CE, eco-innovation, economic complexity, and digitalization is strongly supported by the Pedroni cointegration tests, which account for cross-sectional dependence and heterogeneity. This suggests that there is a relationship of long-term equilibrium among the African nations.
5.3. Empirical Results
Although the MMQR estimator addresses distributional heterogeneity and reduces potential endogeneity through its moment-based estimation, residual endogeneity may still arise from omitted institutional or policy variables influencing both CE and its drivers. To mitigate this concern, we included lagged independent variables (Section 5.4), which produced consistent results. Hence, while endogeneity cannot be fully ruled out, robustness and lag-based estimations strengthen the credibility of the causal interpretation.
The POLS and DKSE estimators are used to experimentally investigate the relationship between green innovation, complex economics, digitalization, and the circular economy (CE) in African nations. To assess the robustness of the estimates and determine whether the results are sensitive to model specification, the impact of each variable on CE is examined individually before a combined model is applied. The results are displayed in Table 5, where the POLS and DKSE anticipates are given in columns (1) through (5) and (6) through (10), respectively. The multivariate parameters’ slightly larger R-squared values imply that green innovation, complexity of the economy, and technology collectively account for a greater proportion of the diversity in CE results than do these variables separately.
Table 5.
Results of POLS and DKSE estimation.
The findings show that eco-innovation significantly boosts CE in Africa. In particular, the DKSE estimates range from 0.045% to 0.070%, but the POLS results show that a 1% increase in eco-innovation increases CE by around 0.026% to 0.045%. The persistent positive impact shows that eco-innovation is a major force behind Africa’s CE transformation, emphasizing how eco-innovative techniques may improve resource sustainability and reduce waste. Similarly, with DKSE estimates ranging from 0.095% to 0.239% and POLS estimations between 0.117% and 0.195%, economic complexity positively affects CE. This suggests that Africa’s circular transition is strengthened by the diversity of production structures and the move towards more knowledge-intensive enterprises. Additionally, the two estimating methodologies’ coefficients for digitalization range from 0.420% to 0.630%, indicating positive and substantial benefits on CE.
Although digitalization improves CE performance, its marginal contributions may eventually decline, as seen by the squared term of digitalization showing signs of falling returns in several of the models. According to the research, digitalization, economic complexity, and eco-innovation are the main forces behind the CE in Africa. Their combined effect is greater than their separate effects, indicating the necessity for comprehensive plans that simultaneously support innovation, diversity, and digital infrastructure in order to propel the CE transition throughout the continent. Similarly, economic complexity positively affects CE in African economies.
The POLS estimates reveal that a 1% increase in economic complexity propels CE by approximately 0.12–0.20%, while the DKSE estimates place the progress at 0.10% to 0.24%. These results suggest that greater economic complexity significantly promotes Africa’s circular economy transition. It indicates that productive sophistication and diversification enhance better resource use and create sustainable production and consumption patterns that are at the center of CE ideals. This aligns with previous research (Lapatinas et al., 2021; Hassan et al., 2023), which argues that economic complexity enhances innovation, intensifies knowledge transfer, and promotes the development of resource-saving industries that propel the CE agenda.
Concurrently, digitalization is the most critical driver of CE evolution in Africa. The estimates by POLS indicate that digitalization enhances CE by about 0.63%, while the estimates by DKSE indicate that the effect is between 0.43% and 0.62%. Such a positive high effect is an indication that the application of digital technologies significantly increases resource efficiency, waste handling, as well as circular production systems. In reality, digitalization improves smart manufacturing techniques, enabling organizations to optimize resource utilization, reduce material inputs, and minimize waste production (Priyadarshini et al., 2024). This transition from conventional manufacturing to digitally enhanced green production accelerates the CE change.
Furthermore, digital platforms let producers monitor resource flows, prevent overproduction, and encourage recycling and reuse (Barteková & Börkey, 2022). Yet there is no convincing proof of a linear or inverted-U relationship between digitalization and CE, as shown by the positive and statistically insignificant coefficient for the digitalization squared term. However, the relationship seems to be mostly linear, with further digitalization continuing to have positive effects without apparent diminishing returns. In general, digitalization, economic complexity, and eco-innovation are all crucial factors that drive CE in Africa; digitalization has the greatest impact, followed by eco-innovation and economic complexity. This indicates that if African nations want to hasten their shift to a circular and sustainable economy, they have to implement policies that support digitalization.
After determining the unconditional impacts of digitalization, eco-innovation, and economic complexity on CE, the MMQR approach is used to assess their conditional quantile effects. This makes it possible to examine the nexus in further depth at various CE performance levels, such as the lower quantile (Q = 0.25), median (Q = 0.50), and upper quantile (Q = 0.75). The findings, which are shown in Table 6, include the location and scale effects in addition to the quantile-specific estimates.
Table 6.
Results of MMQR estimation.
The scale effect is the variability of this influence across quantiles, whereas the location effect just gives the across-distribution impact of each predictor on CE. A positive scale coefficient indicates that the predictor’s influence increases as quantiles rise, whereas a negative one indicates that it decreases as CE performance improves. A 1% rise in eco-innovation is shown to correlate to around 0.044–0.046% growth in CE, indicating that the eco-innovation site estimation has a positive and substantial influence on CE in Africa.
Nonetheless, the negative and significant scale coefficients of −0.011 to −0.012 show that the beneficial impact of eco-innovation is greatest when countries have lower CE levels and decreases as countries move toward higher CE performance. Eco-innovation has the biggest marginal contribution at the 25th percentile (0.05–0.06%), followed by 0.04–0.05% at the median and 0.03% at the 75th percentile, according to quantile-specific statistics. With average coefficients ranging from 0.35% to 0.45%, the estimations for digitalization demonstrate a significant and favorable location effect. This beneficial effect is confirmed by the quantile estimates, which show that digitalization raises CE by around 0.16–0.43% at the 25th percentile, 0.35–0.43% at the median, and 0.39–0.52% at the 75th percentile.
In contrast to eco-innovation, digitalization’s influence does not decrease as CE levels rise; rather, it continuously increases, making it a vital force throughout the distribution. The squared digitalization term, however, is largely negligible, indicating that there is not a major nonlinear impact.
In summary, the MMQR findings for Africa show that digitalization is a strong driver across all quantiles, economic complexity becomes increasingly significant with improving CE performance, and eco-innovation contributes most at lower quantiles of CE. All things considered, these results highlight the need for African nations to adopt distinct approaches, such as boosting economic complexity to optimize high-end CE results, investing in eco-innovation in nations with relatively weak CE frameworks, and expanding digital infrastructure to promote CE more broadly. Digitalization has the biggest beneficial impact on CE in African nations, as was previously emphasized.
CE increases by around 0.43% throughout the distribution for every 1% increase in digitalization. Digitalization increases CE by around 0.43% to 0.44% at the 25th percentile, 0.35% to 0.43% at the median, and 0.39% to 0.52% at the 75th percentile. Regardless of any country’s CE performance level, this constant effect across quantiles shows that digitalization greatly influences CE performance in Africa.
By facilitating more effective resource use, streamlining production and consumption procedures, increasing supply chain visibility, and assisting in the development of new circular business models, digitalization promotes CE in Africa (Barteková & Börkey, 2022; Usman et al., 2024). In reality, digital technologies like blockchain apps, big data analytics, and smart manufacturing systems may assist African businesses in lowering waste, enhancing material traceability, and facilitating recycling and reuse. With negative scale estimates and a mostly nonsignificant coefficient of digitalization squared, the effect of digitalization on CE is almost linear over the measured range.
This indicates that there are no obvious indications of nonlinearities or threshold effects, even if digitalization is still having a favorable impact on CE. The stability and robustness of the results are once again confirmed by the MMQR results, which generally agree with the results of the POLS and DKSE estimators. In support of the prior theories, the conformance demonstrates that digitalization continues to be the all-encompassing engine of CE in Africa. The empirical findings highlight how urgently African nations must increase their investments in digital infrastructure and include digital solutions into their CE and sustainability plans.
The possible causal links between the circular economy (CE) and important developmental factors among African economies are captured by the Granger causality test findings from the Dumitrescu–Hurlin panel, which are shown in Table 7. The test findings show that eco-innovation and CE are causally related in both directions. However, the statistical evidence linking CE to eco-innovation is becoming more and more strong, indicating that when African economies adopt circular concepts, creative solutions to lessen environmental damage and increase resource efficiency are produced.
Table 7.
Dumitrescu–Hurlin causality test.
Additionally, the findings show a somewhat unidirectional causal relationship between CE and economic complexity. Accordingly, African nations with more intricate and knowledge-intensive industrial structures are marginally better suited to adopt circular economy practices. However, there was little evidence linking CE to economic complexity, suggesting that without more extensive industry and regulatory action, circularity alone might not increase structural variety.
Most significantly, CE and digitalization have a strong, reciprocal, and extremely significant causal relationship. This emphasizes how crucial digital technologies are to hastening the transition to a circular economy in Africa. Digital tools like data-enabled waste management, e-commerce platforms, and smart monitoring technologies make it easier for businesses and governments to adopt and expand circularity. Alternatively, there is a self-reinforcing cycle of digital transformation and sustainable growth as the adoption of circular practices increases demand for digital solutions. These results demonstrate how digitalization is a key component of CE plans across the continent and have important ramifications for policymakers who want to foster innovation-driven development and sustainable industrialization.
5.4. Robustness Checks and Discussion
To verify the robustness of the empirical results, several additional tests and alternative specifications were conducted. First, Fixed Effects (FE) and Random Effects (RE) estimators were employed as benchmarks to account for potential unobserved heterogeneity that may influence the relationship between digitalization, eco-innovation, economic complexity, and the circular economy (CE). The coefficients for all three key drivers remained positive and statistically significant across both FE and RE models, indicating that the main results are not sensitive to the inclusion of country-specific effects.
Second, lagged independent variables were introduced to mitigate possible endogeneity concerns and to test the dynamic stability of the relationships. The lagged models yield results consistent in direction and magnitude with the baseline estimations, suggesting that causality runs predominantly from digitalization and eco-innovation toward CE rather than the reverse.
Third, the variance inflation factor (VIF) and correlation matrix confirm the absence of multicollinearity, while alternative subsample estimations—dividing the dataset into high-income and low-income African countries—reveal similar trends. The magnitude of the digitalization effect is slightly higher for high-income African economies, while eco-innovation exhibits stronger impacts in lower-income ones.
Collectively, these robustness checks reaffirm that the empirical findings are stable, statistically reliable, and theoretically consistent across different model specifications and country groupings. The robustness analysis therefore enhances confidence in the validity of the causal linkages identified between digitalization, eco-innovation, economic complexity, and CE performance in Africa (see Table 8).
Table 8.
Robustness Checks Using Alternative Model Specifications.
The lagged model includes one-year lagged regressors for digitalization, eco-innovation, and economic complexity to address potential endogeneity. Subsample models divide the panel into high-income and low-income African economies (based on AfDB classification). All coefficients remain positive and statistically significant, confirming the robustness and stability of the main findings.
To provide an intuitive summary of the empirical findings, please create a conceptual flow diagram illustrating the core relationships. The diagram should position three primary drivers on the left—Eco-Innovation, Economic Complexity, and Digitalization—with arrows pointing from each towards a central circle labeled “Circular Economy (CE) Performance.” The strength of each direct impact should be visually represented by the thickness of the arrows, reflecting a strong positive effect from Digitalization to CE, a moderate positive effect from Eco-Innovation to CE (noting it is stronger in low-performing economies), and a positive effect from Economic Complexity to CE (noting it is stronger in high-performing economies). Furthermore, significant bidirectional causality identified in the analysis should be depicted using double-headed arrows to form feedback loops between Digitalization and CE, as well as between Eco-Innovation and CE. Below the figure, include the note Figure 8:
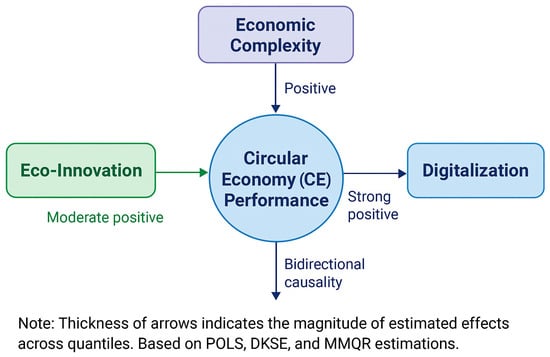
Figure 8.
Graphical Summary of Empirical Findings on CE Drivers in Africa (2000–2024).
This visual will effectively reinforce the study’s empirical narrative.
5.5. Discussion
The findings demonstrate that digitalization, eco-innovation, and economic complexity significantly enhance Africa’s circular economy (CE) performance, but with differing intensities. Digitalization emerged as the strongest and most consistent driver across quantiles, aligning with Sang and Anh (2025) and Barteková and Börkey (2022), who emphasize the transformative power of digital infrastructure in resource efficiency. Eco-innovation had a more pronounced impact in low-performing CE economies, suggesting that technological adoption in emerging African markets can yield high marginal gains (Le et al., 2023). Economic complexity showed stronger effects in high-performing economies, corroborating the findings of Hassan et al. (2023) that productive diversification reinforces sustainable industrial transformation.
These results highlight the importance of integrated policies combining digital transformation and industrial sophistication to accelerate Africa’s CE transition. Policymakers should prioritize digital investment, innovation clusters, and technology transfer mechanisms to support green industrialization. Additionally, aligning these strategies with existing frameworks such as the African Union (AU)’s (2024) Green Recovery Plan and Agenda 2063 can promote long-term circular growth and resilience.
Future research may explore how institutional frameworks and green finance mechanisms mediate these relationships, offering further insights into regional disparities in CE adoption.
6. Conclusions
The continent Africa offers enormous potential for the circular economy (CE). The research explored the role of eco-innovation, economic complexity, and digitalization in CE development in African economies between 2000 and 2024, driven by the need to address issues of pollution, resource scarcity, and sustainable development. The study offered solid proof of the determinants’ pivotal significance by employing POLS, DKSE, and MMQR estimates in addition to the Dumitrescu–Hurlin panel causality test. According to the findings, digitalization, economic complexity, and eco-innovation are all essential for the development of CE, with digitalization having the most impact, followed by eco-innovation and economic complexity.
Their impacts differ depending on the CE level of performance: digitalization has an equal impact on all CE levels, economic complexity has a bigger impact on comparatively more developed countries, and eco-innovation has a more noticeable impact on less CE-developed nations. Additionally, causality studies show that CE is independent of digitalization and eco-innovation, but that there is a one-way link between CE and economic complexity.
These results have important policy ramifications for the development of CE in Africa. Interventions at the regional and national levels are essential due to the continent’s diversity in terms of institutional competency, economic arrangements, and developmental stages. First and foremost, because of the significant impact of digitalization, less developed countries must prioritize digital infrastructure and literacy, connection, and SMEs’ empowerment, whereas more established economies may concentrate on incorporating cutting-edge digital tools into already-existing industrial platforms.
Second, the benefits of economic complexity highlight the necessity of human resources, industry diversity, and support for research and development. While less complex nations must develop their capacity for innovation and support value-added industries, more complex nations can benefit from cross-sectoral collaboration and knowledge spillovers. Third, there is a need to encourage eco-innovation through enabling technology transfer, green entrepreneurship, and public–private partnerships, particularly in countries at earlier stages of CE adoption, while higher-performing nations concentrate on emulating successful innovations and effective recycling systems.
The study suggests strengthening the policy architecture in light of other CE-related initiatives in Africa by obtaining funding agreements that are suitable for structural capabilities and CE readiness, building peer-learning and regional networking platforms, facilitating national CE roadmaps that are in line with each country’s institutional setup and resource environment, and fostering innovation clusters that are in line with local industrial competencies.
Despite several shortcomings in the research. Three major CE drivers were covered, with space for future studies to examine other aspects including institutional quality, green financing, and regulatory frameworks. While ongoing study into consumer behavior, cultural factors, and the influence of multinational corporations may add depth to the dynamics of CE in Africa, industry-level research may offer sector-specific patterns in CE adoption. Examining how Africa’s CE transition fits into the larger global movement toward sustainability may also be possible through comparison with other growing economies.
The inclusion of data through 2024 enables the study to capture Africa’s most recent wave of digital and eco-innovation reforms, ensuring that the findings reflect ongoing transitions rather than historical patterns.
“The results align strongly with the objectives of SDG 9 (Industry, Innovation, and Infrastructure), SDG 12 (Responsible Consumption and Production), and SDG 13 (Climate Action). Moreover, the study contributes to Agenda 2063’s aspirations for environmentally sustainable and climate-resilient economies. By linking digital transformation with eco-innovation, the findings reinforce Africa’s Agenda 2063 Goals 7 and 10 on sustainable resource management and technology-driven industrialization.”
“For low-income African nations, the emphasis should be on foundational digital infrastructure, capacity building, and affordable access to innovation financing. Strengthening cross-border partnerships, promoting open digital ecosystems, and facilitating green technology transfer can accelerate inclusive CE growth. Such differentiated policies ensure that circularity benefits are not concentrated in high-income economies alone.”
This study assumes that the selected indicators—eco-innovation, digitalization, and economic complexity—adequately capture Africa’s circular transition. However, the analysis does not explicitly incorporate institutional quality or environmental regulation variables, which may also shape CE outcomes. Future research could therefore integrate institutional indicators, explore dynamic or spatial models to control for cross-border effects, and apply sector-specific analyses. These extensions would further strengthen understanding of how policy, technology, and economic structure interact to drive circular transformation in developing regions.
Funding
This work was supported and funded by the Deanship of Scientific Research at Imam Mohammad Ibn Saud Islamic University (IMSIU) (grant number IMSIU-DDRSP2504).
Data Availability Statement
The data used to support the findings of this study are available from the corresponding authors upon reasonable request.
Acknowledgments
The author extend their appreciation to the Deanship of Scientific Research, Imam Mohammad Ibn Saud Islamic University (IMSIU), Saudi Arabia, for their support of this study. The researcher also appreciates the considerable time and work of the reviewers and the editor to expedite the process. Their commitment and expertise were crucial in making this work a success. We appreciate your unwavering help.
Conflicts of Interest
The author declares no conflicts of interest.
References
- African Circular Economy Alliance (ACEN). (2024). Continental circular economy strategy 2024–2030. ACEN Secretariat. [Google Scholar]
- African Development Bank (AfDB). (2012). Facilitating green growth in Africa: Perspectives from the African Development Bank. African Development Bank Group. [Google Scholar]
- African Development Bank (AfDB). (2023). Green growth framework: Financing Africa’s circular transition. AfDB Publications. [Google Scholar]
- African Development Bank (AfDB). (2024). Title of report or dataset. African Development Bank. Available online: https://www.afdb.org (accessed on 5 November 2025).
- African Union (AU). (2024). Green recovery action plan 2024–2030. African Union Commission. [Google Scholar]
- African Union Commission. (2025). Continental digital transformation strategy 2025 update. African Union Commission. [Google Scholar]
- Aluko, O. A., Opoku, E. E. O., & Acheampong, A. O. (2022). Economic complexity and environmental degradation: Evidence from developing countries. Ecological Economics, 216, 107000. [Google Scholar] [CrossRef]
- Antikainen, R., Uusitalo, V., & Kivikytö-Reponen, P. (2018). Digitalisation and sustainable circular economy: Key lessons from Finnish case studies. Journal of Cleaner Production, 201, 89–99. [Google Scholar] [CrossRef]
- Aral, S., Gürsoy, M., & Kaya, O. (2024). Digital innovation adoption in African economies: Regional disparities and policy implications. Information Systems Journal, 34(1), 23–40. [Google Scholar] [CrossRef]
- Atlas of Economic Complexity by @HarvardGrwthLab. (2022). Available online: https://atlas.hks.harvard.edu/ (accessed on 5 November 2025).
- Baltagi, B. H. (2021). Econometric analysis of panel data (6th ed.). Wiley. [Google Scholar]
- Barteková, E., & Börkey, P. (2022). Digitalisation and the circular economy: Opportunities and policy implications (Vol. 191, pp. 1–38). OECD Environment Working Papers. OECD. [Google Scholar] [CrossRef]
- Boleti, G., Garas, A., & Kyriakou, A. (2021). Economic complexity and environmental sustainability. Structural Change and Economic Dynamics, 56, 76–88. [Google Scholar] [CrossRef]
- Bucher, M., Dufour, M., & Wigger, M. (2023). Economic complexity and environmental outcomes in transition economies. Sustainability, 15(7), 5900. [Google Scholar] [CrossRef]
- Castro, J. P., Silva, C. F., & Rodrigues, L. M. (2022). Recycling innovation and rebound effects in the circular economy. Journal of Cleaner Production, 352, 131603. [Google Scholar] [CrossRef]
- Choudhury, T., Rahman, A., & Khan, S. (2023). Greenwashing and sustainability reporting in emerging economies. Business Strategy and the Environment, 32(5), 2257–2274. [Google Scholar] [CrossRef]
- De Jesus, A., & Mendonça, S. (2018). Lost in transition? Drivers and barriers in the eco-innovation road to the circular economy. Ecological Economics, 145, 75–89. [Google Scholar] [CrossRef]
- Díaz-Arancibia, J., Hochstetter-Diez, J., Bustamante-Mora, A., Sepúlveda-Cuevas, S., Albayay, I., & Arango-López, J. (2024). Navigating digital transformation and technology adoption: A literature review from small and medium-sized enterprises in developing countries. Sustainability, 16(14), 5946. [Google Scholar] [CrossRef]
- Ellen MacArthur Foundation. (2013). Available online: https://foodtank.com/news/2020/03/celebrating-the-informal-food-trade-in-durban-south-africa/ (accessed on 5 November 2025).
- European Commission. (2019). Report from the commission to the European parliament, the council, the European economic and social committee and the committee of the regions on the implementation of the circular economy action plan. Publications Office of the European Union. [Google Scholar]
- European Commission. (2020). A new circular economy action plan: For a cleaner and more competitive Europe. Publications Office of the European Union. [Google Scholar]
- Fasi, M. (2024). Energy consumption implications of digitalization in Africa: Challenges for sustainable development. Renewable and Sustainable Energy Reviews, 189, 113907. [Google Scholar] [CrossRef]
- Figge, F., & Thorpe, A. (2019). The rebound effect in sustainability transitions. Ecological Economics, 161, 1–8. [Google Scholar] [CrossRef]
- García-Castillo, J., López, R., & Medina, C. (2024). Digital divide and circular economy in African countries. Technological Forecasting and Social Change, 198, 122478. [Google Scholar] [CrossRef]
- Graham, B. S., Hahn, J., Poirier, A., & Powell, J. L. (2016). Quantile regression and heterogeneity in panel data [Working Paper 21034]. Available online: http://www.nber.org/papers/w21034 (accessed on 5 November 2025).
- Ha, Y. (2023). Economic complexity as a driver of environmental innovation. Journal of Cleaner Production, 412, 136827. [Google Scholar] [CrossRef]
- Hassan, S., Khan, A., & Ali, M. (2023). Economic complexity and environmental sustainability in African economies. Ecological Indicators, 148, 109912. [Google Scholar] [CrossRef]
- Hinojosa, J. (2022). Corporate strategies for overcoming circular economy challenges. Business Strategy and the Environment, 31(6), 2509–2521. [Google Scholar] [CrossRef]
- Hlali, A., & Gafsi, N. (2024). Analysis of Digitalization and Sustainable Development in Africa. Perspectives on Global Development and Technology, 22(5-6), 415–428. [Google Scholar] [CrossRef]
- Kirikkaleli, D., Adebayo, T. S., & Khan, S. (2023). Green technology, economic complexity, and environmental quality: Evidence from emerging economies. Renewable Energy, 209, 713–722. [Google Scholar] [CrossRef]
- Lapatinas, A., Kyriakou, A., & Garas, A. (2021). Economic complexity and environmental behavior: Evidence from cross-country analysis. Environmental Research Letters, 16(5), 054012. [Google Scholar] [CrossRef]
- Le, T., Vo, D., & Nguyen, T. (2023). Eco-innovation, cleaner production, and resilience in circular economy transitions. Journal of Cleaner Production, 400, 136731. [Google Scholar] [CrossRef]
- Lee, S., & Olasehinde-Williams, G. (2024). Economic complexity and environmental sustainability in OECD countries. Ecological Economics, 215, 107011. [Google Scholar]
- Liu, Q., Wang, H., & Zhou, X. (2022). Digital technologies and circular manufacturing. Technological Forecasting and Social Change, 180, 121676. [Google Scholar] [CrossRef]
- Liu, Y., Zhang, X., & Chen, L. (2023). Technological innovation, corporate social responsibility, and eco-innovation in manufacturing firms. Journal of Cleaner Production, 389, 135976. [Google Scholar] [CrossRef]
- Ma, R., Jin, X., & Zhou, T. (2022). Resource efficiency and economic complexity: A global panel study. Resources Policy, 78, 102905. [Google Scholar] [CrossRef]
- Machado, J. A. F., & Santos Silva, J. M. C. (2019). Quantiles via moments. Journal of Econometrics, 213(1), 145–173. [Google Scholar] [CrossRef]
- Maldonado-Guzmán, G., Garza-Reyes, J. A., & Pinzón-Castro, Y. (2020). Eco-innovation and the circular economy in the automotive industry. Benchmarking: An International Journal, 27(2), 621–635. [Google Scholar] [CrossRef]
- Montiel-Hernández, M. G., Pérez-Hernández, C. C., & Salazar-Hernández, B. C. (2024). The intrinsic links of economic complexity with sustainability dimensions: A systematic review and agenda for future research. Sustainability, 16(1), 391. [Google Scholar] [CrossRef]
- Mügge, J., Seegrün, A., Hoyer, T.-K., Riedelsheimer, T., & Lindow, K. (2024). Digital twins within the circular economy: Literature review and concept presentation. Sustainability, 16(7), 2748. [Google Scholar] [CrossRef]
- Neves, S. A., Marques, A. C., & Silva, I. P. (2024). Promoting the circular economy in the EU: How can the recycling of e-waste be increased? Structural Change and Economic Dynamics, 70(C), 192–201. Available online: https://ideas.repec.org/a/eee/streco/v70y2024icp192-201.html (accessed on 5 November 2025). [CrossRef]
- OECD. (2024). Green transition in emerging Africa: Policy insights for circular growth. OECD Publishing. [Google Scholar]
- Pesaran, M. H. (2004). General diagnostic tests for cross section dependence in panels. CESifo Working Paper No. 1229. CESifo. [Google Scholar] [CrossRef]
- Peyravi, B., & Jakubavičius, A. (2022). Drivers in the eco-innovation road to the circular economy: Organizational capabilities and exploitative strategies. Sustainability, 14(17), 10748. [Google Scholar] [CrossRef]
- Peyravi, M., Marzaleh, M. A., & Hatami, M. (2024). Investigating the barriers to air medical services in accidents and disasters in Iran and suggesting solutions: A qualitative study. BMC Research Notes, 17, 365. [Google Scholar] [CrossRef] [PubMed]
- Pichlak, M., & Szromek, A. R. (2022). Linking eco-innovation and circular economy—A conceptual approach. Journal of Open Innovation: Technology, Market, and Complexity, 8(3), 121. [Google Scholar] [CrossRef]
- Priyadarshini, J., Singh, R. K., Mishra, R., He, Q., & Braganza, A. (2024). Implementation of additive manufacturing in the healthcare supply chain for circular economy goals: Paradoxical tensions and solutions from an Industry 5.0 perspective. Information Systems Frontiers. [Google Scholar] [CrossRef]
- Raasens, J., & van Leeuwen, E. (2024). The evolving concept of circularity: From a circular economy to a circular society in 60 years. In S. Bourdin, A. Torre, & E. van Leeuwen (Eds.), Regions, cities and the circular economy: Theory and practice (pp. 44–60). Edward Elgar Publishing. [Google Scholar] [CrossRef]
- Sang, T. M., & Anh, N. Q. (2025). Adopting digital technology for sustainable performance: Circular economy practice in the transportation sector. Discover Sustainability, 6, 166. [Google Scholar] [CrossRef]
- Schumpeter, J. A. (1950). Capitalism, socialism, and democracy. Harper & Row. [Google Scholar]
- Thakker, V., & Bakshi, B. R. (2023). Ranking eco-innovations to enable a sustainable circular economy with Net-Zero emissions. ACS Sustainable Chemistry & Engineering, 11(4), 1363–1374. [Google Scholar] [CrossRef]
- United Nations Development Programme (UNDP). (2024). 2024 UNDP trends report: The landscape of development. UNDP. [Google Scholar]
- United Nations Economic Commission for Africa (UNECA). (2024). Africa green industrialization initiative: Pathways to circular transformation. UNECA Publications. [Google Scholar]
- United Nations Environment Programme. (2023). Africa waste management outlook. UNEP. Available online: https://www.greenpolicyplatform.org/sites/default/files/downloads/resource//Africa_Waste_Management.pdf (accessed on 5 November 2025).
- United Nations Environment Programme. (2024). Annual report 2024. UNEP. Available online: https://www.unep.org/resources/annual-report-2024 (accessed on 5 November 2025).
- Usman, M., Simionescu, M., Radulescu, M., & Balsalobre-Lorente, D. (2024). Breaking barriers, cultivating sustainability: Discovering the trifecta influence of digitalization, natural resources, and globalization on eco-innovations across 27 European nations. Resources Policy, 94, 105109. [Google Scholar] [CrossRef]
- World Bank. (2024). World development indicators. Available online: https://databank.worldbank.org/source/world-development-indicators (accessed on 5 November 2025).
- World Development Indicators. (2024). DataBank. Available online: https://databank.worldbank.org/id/c4511412 (accessed on 5 November 2025).
- Yoguel, G., Barletta, F., & Pereira, M. (2013). De Schumpeter aos post-schumpeterianos: Velhas e novas dimensões analíticas. Problemas del Desarrollo, 44(174), 35–59. [Google Scholar]
- Zerbino, P. (2022). The circular economy rebound: The third wheel on the date between circularity and sustainability. Journal of Circular Economy, 1(1). [Google Scholar] [CrossRef]


Disclaimer/Publisher’s Note: The statements, opinions and data contained in all publications are solely those of the individual author(s) and contributor(s) and not of MDPI and/or the editor(s). MDPI and/or the editor(s) disclaim responsibility for any injury to people or property resulting from any ideas, methods, instructions or products referred to in the content. |
© 2025 by the author. Licensee MDPI, Basel, Switzerland. This article is an open access article distributed under the terms and conditions of the Creative Commons Attribution (CC BY) license (https://creativecommons.org/licenses/by/4.0/).