Abstract
Polyethersulfone (PES) films are widely employed in the construction of membranes where there is a desire to make the surface more hydrophilic. Therefore, UV photo-oxidation was studied in order to oxidize the surface of PES and increase hydrophilicity. UV photo-oxidation using low pressure mercury lamps emitting both 253.7 and 184.9 nm radiation were compared with only 253.7 nm photons. The modified surfaces were characterized using X-ray photoelectron spectroscopy (XPS), atomic force microscopy (AFM), and water contact angle (WCA) measurements. Both sets of lamps gave similar results, showing an increase of the oxygen concentration up to a saturation level of ca. 29 at.% and a decrease in the WCA, i.e., an increase in hydrophilicity, down to ca. 40°. XPS detected a decrease of sp2 C-C aromatic group bonding and an increase in the formation of C-O, C=O, O=C-O, O=C-OH, O-(C=O)-O, and sulphonate and sulphate moieties. Since little change in surface roughness was observed by AFM, the oxidation of the surface caused the increase in hydrophilicity.
1. Introduction
Polyethersulfone (PES) (Figure 1) is a material which is widely used in the construction of membranes because its chemical structure causes the polymer to maintain mechanical strength, thermal and chemical resistance, and oxidative properties making it suitable for the preparation of asymmetric membranes with different surfaces and pore sizes.
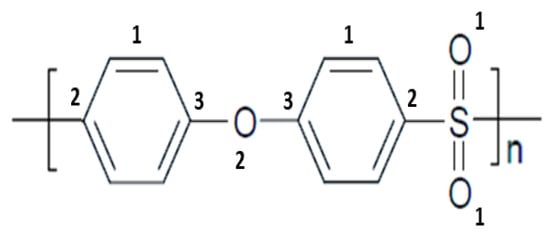
Figure 1.
Chemical structure of PES showing three kinds of C bonding: (1) C=C, (2) C-S, and (3) C-O, and two types of O bonding: (1) O=S, and (2) O-C.
A number of surface modification techniques have been used to make the surface more hydrophilic, such as blending with polymers and inorganic nanoparticles [1]. To increase hydrophilicity for biomedical applications, PES has been polymerized with vinyl pyrrolidone, then copolymerized with methyl methacrylate [2], and blended with hydrophilic submicrogels of poly(acrylic acid-co-N-vinyl-2-pyrrolidone) [3]. For wastewater treatment, PES was functionalized with ß-cyclodextrin to incorporate –OH groups on the surface [4]. In addition, since PES is a very photosensitive polymer, photo-oxidation using UV wavelengths, such as 253.7 nm, activates the PES surface, as detected by FTIR, SEM, atomic force microscopy (AFM) and water contact angle (WCA) measurements, for successful grafting of hydrophilic monomers without the need for a photo-initiator [5,6,7].
One key factor in improving PES membranes is monitoring the functional groups during surface modification, such as by using X-ray photoelectron spectroscopy (XPS) analysis. XPS analysis for the reaction of ozone, which is often used for treating wastewater, with PES detected an increase in concentration of O atoms on the surface up to ca. 25 atomic% (at%) and the formation of primarily C-O, sulphonate and sulphate groups resulting in an increase in hydrophilicity of ca. 28% [8]. Therefore, this research investigated the UV photo-oxidation of PES with low pressure Hg lamps, which emitted both 253.7 and 184.9 nm photons, and compared the results with a set of lamps that emitted only 253.7 nm radiation. The 184.9 nm radiation is absorbed by oxygen [9] and breaks the molecular bond to form ground state O(3P) atoms at a threshold wavelength of 242.4 nm [10]. Using atmospheric pressure of O2, ozone is produced by Equation (1) and involves a stabilizing molecule (M), which is the oxygen molecule in this study.
O(3P) + O2 + M → O3 + M
Because oxygen molecules do not absorb 253.7 nm radiation [9], the 253.7 nm photons are transmitted through the oxygen to photo-activate the PES film. The resulting surface modification was characterized using XPS, WCA, and AFM measurements to determine changes in chemistry, hydrophilicity, and surface roughness, respectively.
2. Materials and Methods
2.1. Materials
PES film (0.125 mm thick) was purchased from Goodfellow Corp. (Coraopolis, PA, USA) (catalog no. 494-219-10), cleaned with Koptec 200 proof ethanol (DLI, King of Prussia, PA, USA) in an ultrasonic bath for 20 min and then stored in a desiccator, which contained calcium sulfate, for at least 24 h. The cleaned PES film was treated with UV photo-oxidation at different treatment times.
2.2. UV Photo-Oxidation
The PES sample was placed in the center of a cylindrical photochemical cell (2.54 cm diameter, 17.8 cm long), constructed of Suprasil® (Heraeus Quartz America LLC, Buford, GA, USA) quartz and fitted with a Cajon removable high vacuum stainless steel fitting, and put inside a Rayonet photochemical chamber (Southern New England Ultraviolet Co., Branford, CT, USA) with 16 low-pressure Hg lamps. One set of lamps emitted both 253.7 and 184.8 nm photons with about a 6:1 intensity ratio, while the other set emitted only 253.7 nm radiation. High purity oxygen (99.99%) flowed through the photochemical cell while high purity nitrogen, which is transparent to the UV radiation, flowed through the chamber for at least 10 min at flow rates of ca. 43 and 5 × 10³ sccm, respectively, in order to displace the air prior to the ignition of the radiation source. Because ozone is linked to a broad array of health threats [11], the exiting gas was passed through a solution of saturated KI in order to react with the ozone prior to emission into the vacuum hood.
2.3. X-ray Photoelectron Spectroscopy (XPS)
The samples were analyzed with a Physical Electronics VersaProbe II 5000 XPS that examined the top 2–5 nm of a sample’s surface using a take-off angle of 45° between the sample and analyzer. A rectangular region of about 1400 μm by 600 μm was analyzed. The monochromatic Al Kα (1486 eV) X-ray beam irradiated the sample and the electron optics of the analyzer were focused to accept only photoelectrons emitted from the samples. The quantitative analyses are precise to within 5% relative for major constituents and 10% relative for minor constituents. The samples were charge neutralized with a dual beam charge neutralization system that utilized both a cold cathode electron flood source (~1 eV) and a very low energy ion source (≤10 eV).
The high-resolution C 1s, O 1s, and S 2p spectra were normalized to the peak intensities at the main peaks and curve-fitting was performed by using spectra for a cleaned and untreated PES sample as the initial model. The process subtracted the control spectrum from that of the treated sample. The remainder spectrum was curve-fitted to determine the number of peaks, their binding energies, and peak widths resulting from the treatment. The peaks from curve-fitting the remainder spectrum were used to curve-fit the total treated spectrum. Any missing peaks, such as weak energy loss peaks, were then added to the curve-fitting of the treated sample to achieve a good chi-square fit. A materials balance was calculated to test if the results of the curve-fitting agreed with the concentrations as determined from the quantitative analyses.
2.4. Contact Angle (CA) Goniometry
Water contact angles on the PES films were measured using a Ramé-Hart model 250-F1 standard contact angle goniometer. The instrument included a fiber optic illuminator, 3-axis specimen stage with leveling, U1 Series SuperSpeed digital camera, and DROPimage Advanced software. During the contact angle measurement, the intensity of the illuminator was set at 70%. The samples were placed on double-sided tape to keep the surface flat. A micropipette was used to deposit a 10 µL deionized water droplet on the surface. As soon as the water droplet was placed on the film, a picture was captured by the U1 Series Camera. The left- and right-side contact angles were measured by the DROPimage contact angle (CA) program. The standard deviation of the measurements was about ±2.5°.
2.5. Surface Topography
Each specimen was imaged with a Bruker DI-3000 AFM in the tapping or intermittent contact mode. Each image was 15 μm × 15 μm in size with 512 pixels per line resolution. The same OTESPA tip, with a nominal tip radius of <10 μm and a resonant frequency of 330 kHz, was used to acquire each image. Surface roughness was computed using Nanoscope Analysis v1.3 software.
3. Results
3.1. Quantitative XPS and Water Contact Angle
The XPS quantitative analysis for the eight untreated PES samples gave average concentrations for C, S, and O of 74.1 ± 1.0, 5.5 ± 0.2, and 20.0 ± 0.8 at%, with a trace amount of N (0.2 ± 0.2 at%), which is in good agreement with the theoretical values 75, 6.2, and 18.8 at%, respectively. Eight sets of 3–5 samples were exposed to various treatment times of 253.7 and 184.9 nm radiation for up to 60–90 min. As shown in Figure 2, the surface carbon and oxygen concentrations reached constant values of 63.3 ± 1.4 and 28.6 ± 1.0 at%, respectively. There were only slight changes in the S (5.6 ± 0.2 at%.) and N (2.4 ± 0.7 at%) concentrations and the WCA decreased by ca. 43%, i.e., an increase in hydrophilicity from 70.3° for pristine PES down to 39.9°.
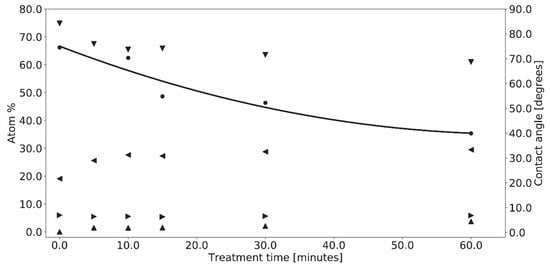
Figure 2.
Quantitative XPS atom% of C (▼), N (▲), O (◀), and S (▶), and contact angle (˜) results for PES treated with 253.7 and 184.9 nm UV photo-oxidation as a function of treatment time.
Similar results were obtained for treatment with 253.7 nm where the C and O atom concentrations saturated at 62.3 and 29.5 at.%, respectively, while the WCA decreased from 73.0° down to 40.3°.
3.2. XPS Chemical State Analysis
Figure 3 displays the overlapped C 1s spectra for the control and 253.7 and 184.9 nm UV photo-oxidized PES samples reported in Figure 2. Curve-fitting of the C 1s spectra (Table 1) showed a decrease in sp2 C-C aromatic group bonding and the energy loss π → π* transition, and an increase in oxidation of the surface producing C-O, C=O, O=C-O, O=C-OH, and O-(C=O)-O functional groups as a function of treatment time. Curve-fitting of the C 1s spectra for 253.7 nm UV photo-oxidized PES (Table 2) gave similar results.
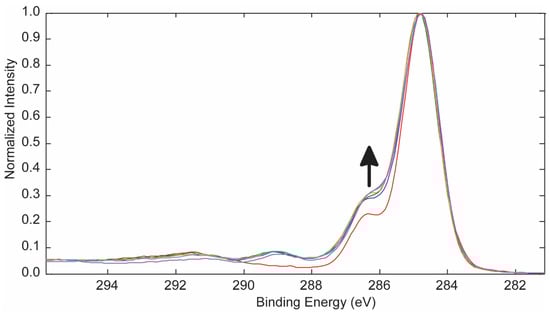
Figure 3.
Overlapped C 1s spectra for the control and PES samples treated with 253.7 and 184.9 nm UV photo-oxidation. The arrow indicates increasing treatment time for 0, 5, 10, 15, 30, and 60 min.

Table 2.
Assignments [12] and% areas for the C 1s peaks for 253.7 nm UV photo-oxidized PES as determined by curve-fitting. Carbons (1), (2), and (3) are illustrated in Figure 1.
The changes in the O 1s spectra of the 253.7 and 184.9 nm UV photo-oxidized PES (Figure 4) and curve-fitting (Table 3) confirmed the oxidation of carbon on the PES surface. Similar O 1s results were obtained for the 253.7 nm UV photo-oxidized PES samples (Table 4).
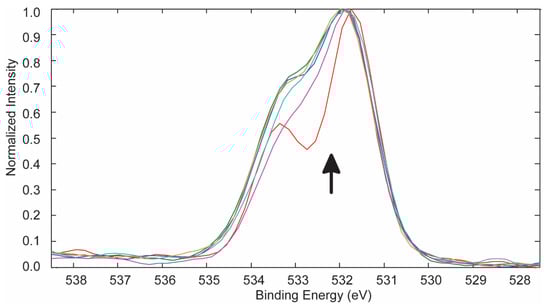
Figure 4.
Overlapped O 1s spectra for the control and PES samples treated with 253.7 and 184.9 nm UV photo-oxidation. The arrow indicates increasing treatment time for 0, 5, 10, 15, 30, and 60 min.
Table 4.
Assignments [12] and% areas of O 1s peaks for the 253.7 nm UV photo-oxidized PES samples as determined by curve-fitting for the oxygen atoms (1) and (2) in Figure 1.
For both sets of treatment methods, the S 2p spectra (Figure 5) and curve-fitting results (Table 5) showed, for untreated PES, the correct ratio of 2:1 for the 2p3/2 and 2p1/2 species, which are separated by 1.2 eV [12], and an increase in S-O bonding as a function of treatment time due to the formation of sulphonate (-SO3) and sulphate (-SO4) moieties which, within experimental error, have similar binding energies at 168.6 and 169.8 eV, respectively [12].
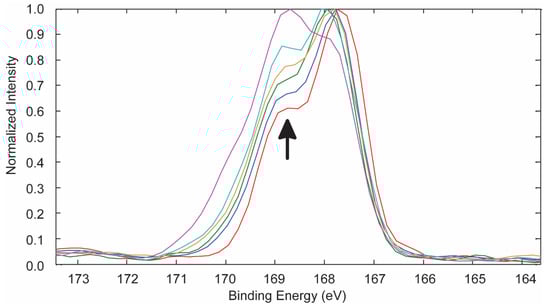
Figure 5.
Overlapped S 2p spectra for the control and PES samples treated with 253.7 and 184.9 nm UV photo-oxidation. The arrow indicates increasing treatment time for 0, 5, 10, 15, 30, and 60 min.
Table 5.
Assignments [12] and% areas for S 2p3/2 and S 2p1/2 peaks as determined by curve-fitting the Figure 5 spectra for PES treated with 253.7 and 184.9 nm UV photo-oxidation.
3.3. Surface Topography
Figure 6a shows the surface topography of the untreated PES film. It has long grooves from the manufacturing process, similar to the images of PES films that were treated by ozone [8]. The root mean squared (RMS) surface roughness, Rq, was 1.5 nm. Figure 6b,c show the surface topography after a 30 min UV photo-oxidation treatment with both wavelengths and 253 nm only, respectively. There was no significant change in either surface topography or roughness with treatment.
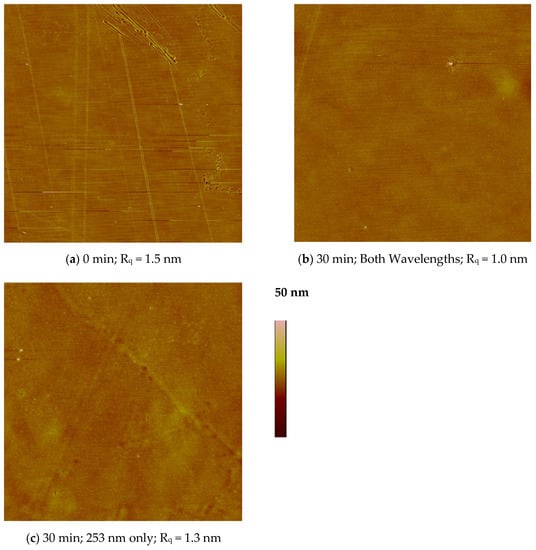
Figure 6.
AFM surface topographic images (15 μm × 15 μm) in tapping mode showing the root mean squared roughness in nanometers for PES: (a) untreated, and treated for 30 min with (b) both wavelengths, and (c) only 253.7 nm photons.
4. Discussion
The similarities between the UV photo-oxidation results using 253.7 and 184.9 nm lamps and 253.7 nm lamps were primarily due to the dominant effect of the radiation on the surface rather than ozone. The 253.7 and 184.9 nm lamps had approximately a 6:1 ratio, where the 184.9 nm was responsible for producing the ozone by Equation (1). Although, ozone may still have contributed to the formation of some of the C-O bonding observed in Table 1 by reacting with PES (RSO2-R) to initiate C-S bond breakage by Equation (2) and then the recombination of the free radicals would form the stable sulphonate compound observed in this study (Equation (3)) [8].
RSO2-R + O-O2 → RSO2-O·+ R + O2
RSO2-O + R·→ RSO2-OR
In addition, Equations (4)–(7) show that the free radical, R·, may be oxidized to also form C-O bonding, as illustrated in Equation (7) and the sulphonate moiety (Equation (8)).
R·+ O2 → RO2·
RO2·+ RO2·→ 2RO·+ O2
R + RO2·→ 2RO
RO + R·→ ROR
RO + RSO2 → RSO2-OR
Similar to Equation (2), ozonation of the C-S bond in RSO2-OR would lead to the formation of RO-SO2-O· which would produce the sulphate compound, RO-SO2-OR, by Equation (9) [8].
ROSO2-O + R·→ ROSO2-OR
The presence of 253.7 and 184.9 nm radiation in this study greatly altered the surface modification of the PES compared to when ozone was generated in the absence of radiation [8]. There was more of a decrease in sp2 C-C aromatic group bonding with a corresponding decrease of the energy loss π → π* transition (Figure 3, Table 1 and Table 2), indicating photo-oxidation of the phenyl groups in the structure of PES (Figure 1) which resulted in in the formation of C-O, C=O, O=C-O, O=C-OH, and O-(C=O)-O functional groups (Table 1, Table 2, Table 3 and Table 4). These results are consistent with ESCA analysis for l > 290 nm photo-oxidation of PES [13]. The substantial increase in the formation of sulphonate and sulphate (Figure 5, Table 5) may be due to photo-oxidation of the aromatic rings to form peroxy free radicals which abstract a hydrogen atom to produce reactive hydroperoxide groups, ROOH, thereby leading to the formation of hydroxylated-containing compounds, like the carboxylic acid detected in this study (Figure 3, Table 1 and Table 2) [13], and sulphonate and sulphate moieties (Equations (8) and (9)).
The abstraction of hydrogen atoms by peroxy free radicals to produce hydroperoxide groups during UV and ozone pretreatment activated the PES membrane surface and enhanced the reaction with the hydrophilic polymers poly(vinyl alcohol), poly(ethylene glycol) and chitosan, resulting in reduced protein adsorption [14].
Photo-oxidation of the PES with 253.7 nm photons, detected by UV-Vis, HPLC and FTIR analysis, showed cleavage of the aromatic rings and photo-dissociation of the C-S bond, resulting in hydroxylated and carbonylated products with low molecular weight [5,15]. Carbon dioxide was also released during the 253.7 nm photo-oxidation of the PES [15], which is consistent with polymer chain bond breakage and the observations in this study of: (1) a small amount of carbonate and anhydride groups which would release CO2, and (2) the washing away of a weak boundary layer (WBL) of oxidized material after treatment. A time-of-flight secondary ion mass spectrometry study of the 253.7 nm photo-degradation of the PES in a nitrogen atmosphere showed that no SO2 was detected in the gas phase which is consistent with the negligible change in at% S observed in this study [16].
Washing away the WBL for the treated PES samples with distilled water decreased the O at% saturation level by 60% compared to the 50% for the reaction of ozone with PES [8] because of greater bond breakage due to the absorption of the 253.7 nm photons.
At the observed saturation oxidation levels in this study, the percentage increase in at% O and decrease in water contact angle were approximately the same for 253.7 and 184.9 UV photo-oxidation (43%, 43%), 253.7 nm UV photo-oxidation (47.5%, 45%), and treatment with ozone in the absence of radiation (25%, 27%) [8], indicating that the oxygen content had a strong influence on the hydrophilicity of the modified PES surface.
To enhance the hydrophilicity of the UV photo-oxidized PES surface, incorporation of graphene oxide [17,18,19,20,21] and sulfonated groups on the surface [20,22] may help create increased interfacial adhesion via H-bonding and dipole-dipole interaction. In addition, surface treatment of PES with polymerized dopamine [23] and waterborne nanocellulose coatings [24] increased hydrophilicity and improved the antifouling and antibacterial properties of PES.
5. Conclusions
An XPS analysis of PES samples treated with UV photo-oxidation using 253.7 and 184.9 nm radiation, and only 253.7 nm photons, resulted in a similar increase of the oxygen atomic% up to a saturation level of 29 at%. Water contact angle measurements of the treated PES showed an increase in hydrophilicity from 73° for pristine PES down to 40°. The radiation produced cleavage of the aromatic ring and photo-dissociation of the C-S bond, resulting in a decrease of sp2 C-C by AFM, the oxidation of the surface primarily contributed to the increase in hydrophilicity.
Author Contributions
I.C., S.O., S.S., M.T., S.L., D.S. and K.M.A. performed the experiments. J.S. helped initiate the research. M.M. and S.K.G. conducted the XPS and AFM analyses, respectively. G.A.T. supervised the students, designed the experiments, and wrote the manuscript. All authors have read and agreed to the published version of the manuscript.
Funding
This research received no external funding.
Institutional Review Board Statement
Not applicable.
Informed Consent Statement
Not applicable.
Data Availability Statement
The data presented in this study are available in.
Acknowledgments
The authors gratefully acknowledge the help of Tom Allston and Jeff Mills with the instrumentation and preparation of figures, respectively. Some of this research was presented at the Tenth International Symposium on Polymer Surface Modification: Relevance to Adhesion, Rochester Institute of Technology, Rochester, NY, USA, 19–21 June 2019.
Conflicts of Interest
The authors declare no conflict of interest.
References
- Otitoju, T.A.; Ahmad, A.L.; Ooi, B.S. Recent advances in hydrophilic modification and performance of polyethersulfone (PES) membrane via additive blending. RSV Adv. 2018, 8, 22710–22728. [Google Scholar] [CrossRef]
- Ran, F.; Li, J.; Wang, L.; Nie, S.; Song, H.; Zhao, L. A simple method to prepare modified polyethersulfone membrane with improved hydrophilic surface by one-pot: The effect of hydrophobic segment length and molecular weight of copolymers. Mater. Sci. Eng. C 2014, 37, 68–75. [Google Scholar] [CrossRef]
- Ji, H.-F.; He, C.; Wang, R.; Xiong, L.; Zhao, W.-F. Multifunctional polyethersulfone membranes with networked submicrogels to improved antifouling property, antibacterial adhesion and blood compatability. Mater. Sci. Eng. C. 2019, 96, 402–411. [Google Scholar] [CrossRef] [PubMed]
- Giwa, A.; Hasan, S.W. Nucleophilic-functionalized ß-cyclodextrin-polyethersulfone structures from facile lamination process as nanoporous membrane active layers for wastewater post-treatment: Molecular implications. J. Membr. Sci. 2018, 563, 914–925. [Google Scholar] [CrossRef]
- Kilduff, J.E.; Mattaraj, S.; Pieracci, J.P.; Belfort, G. Photochemical modification of poly(ether sulfone) and sulfonated poly(sulfone) nanofiltration membranes for control of fouling by natural organic matter. Desalination 2000, 132, 133–142. [Google Scholar] [CrossRef]
- He, D.; Susanto, H.; Ulbricht, M. Photo-irradiation for preparation, modification, and stimulation of polymeric membranes. Prog. Polym. Sci. 2009, 34, 62–98. [Google Scholar]
- Rahimpour, A. UV photo-grafting of hydrophilic monomers onto the surface of nano-porous PES membranes for improving surface properties. Desalination 2011, 265, 93–101. [Google Scholar]
- Lutondo, S.; Turo, M.; Sachdev, S.; Shertok, J.; Bailey, A.; Mehan, M.; Gupta, S.K.; Takacs, G.A. Surface modification of polyethersulfone (PES) with ozone. Ozone Sci. Eng. 2019, 41, 448–453. [Google Scholar]
- Calvert, J.G.; Pitts, J.N. Photochemistry; John Wiley & Sons: New York, NY, USA, 1966; pp. 206–207. [Google Scholar]
- Okabe, H. Photochemistry of Small Molecules; John Wiley & Sons: New York, NY, USA, 1978; p. 179. [Google Scholar]
- Hess, H. Ozone conflict rages. Chem. Eng. News 2014, 92, 24–25. [Google Scholar] [CrossRef]
- Beamson, G.; Briggs, D. High Resolution XPS of Organic Polymers; John Wiley & Sons: Chichester/West Sussex, UK, 1991. [Google Scholar]
- Munro, H.S.; Clark, D.T. An ESCA investigation of the surface photo-oxidation of polyethersulphone. Polym. Degrad. Stabil. 1985, 1, 225–231. [Google Scholar]
- Liu, S.K.; Kim, J.-T. Characterization of surface modification of polyethersulfone membrane. J. Adhes Sci. Technol. 2012, 25, 193–212. [Google Scholar] [CrossRef]
- Rivaton, A.; Gardette, J.L. Photodegradation of polyethersulfone and polysulfone. Polym. Degrad. Stabil. 1999, 66, 385–403. [Google Scholar] [CrossRef]
- Norrman, K.; Kingshott, P.; Kaeselev, B.; Ghanbari-Siahkali, A. Photodegradation of poly(ether sulfone) Part 1. A time-of-flight secondary ion mass spectrometry study. Surf. Interface Sci. 2004, 36, 1533–1541. [Google Scholar] [CrossRef]
- Besharat, F.; Manteghian, M.; Russo, F.; Galiano, F.; Figoli, A.; Abdollahi, M.; Lazzeri, A. Investigation of electric field-aligned edge-oxidized graphene oxide nanoplatelets in polyethersulfone matrix in terms of pure water permeation and dye rejection. Polym. Adv. Technol. 2021, 32, 1531–1547. [Google Scholar] [CrossRef]
- Behdarvand, F.; Valamohammadi, E.; Tofighy, M.A.; Mohammadi, T. Polyvinyl alcohol/polyethersulfone thin-film nanocomposite membranes with carbon nanomaterials incorporated in substrate for water treatment. J. Environ. Chem. Eng. 2021, 9, 104650–104663. [Google Scholar] [CrossRef]
- Besharat, F.; Manteghian, M.; Gallone, G.; Lazzeri, A. Electric field induced alignment of graphene oxide nanoplatelets in polyethersulfone matrix. Nanotechnology 2020, 31, 155701–155716. [Google Scholar] [CrossRef] [PubMed]
- Ahmad, M.W.; Dey, B.; Al Saidi, A.K.A.; Choudhury, A. Functionalized-graphene reinforced polyethersulfone nanocomposites with improved physical and mechanical properties. Polym. Compos. 2020, 41, 4104–4116. [Google Scholar] [CrossRef]
- Suhartono, J.; Pertiwi, D.S.; Noersalim, C.; Yulianingsih, D.; Sofianti, F.; Saptoro, A.; Chafidz, A. Characteristics and performances of blended polyethersulfone and carbon-based nanomaterial membranes: Effect of nanomaterial types and air exposure. Chem. Eng. Technol. 2020, 43, 1630–1637. [Google Scholar] [CrossRef]
- Gumbi, N.N.; Li, J.; Mamba, B.B.; Nxumalo, E.N. Relating the performance of sulfonated thin-film composite nanofiltration membranes to structural properties of macrovoid-free polyethersulfone/sulfonated polysulfone/O-MWCNT supports. Desalination 2020, 474, 114176–114189. [Google Scholar] [CrossRef]
- Mulyati, S.; Muchtar, S.; Arahman, N.; Meirisa, F.; Syamsuddin, Y.; Zuhra, Z.; Rosnelly, C.M.; Shamsuddin, N.; Nawi, N.I.M.; Wirzal, M.D.H.; et al. One-pot polymerization of dopamine as an additive to enhance permeability and antifouling properties of polyethersulfone membrane. Polymers 2020, 12, 1807–1820. [Google Scholar] [CrossRef] [PubMed]
- Aguilar-Sanchez, A.; Jalvo, B.; Mautner, A.; Nameer, S.; Poehler, T.; Tammelin, T.; Mathew, A.P. Waterborne nanocellulose coatings for improving the antifouling and antibacterial properties of polyethersulfone membranes. J. Membr. Sci. 2021, 620, 118842–118851. [Google Scholar] [CrossRef]
Publisher’s Note: MDPI stays neutral with regard to jurisdictional claims in published maps and institutional affiliations. |
© 2021 by the authors. Licensee MDPI, Basel, Switzerland. This article is an open access article distributed under the terms and conditions of the Creative Commons Attribution (CC BY) license (https://creativecommons.org/licenses/by/4.0/).