1. Introduction
Postural control is an innate capability of human motor skills and a fundamental component in maintaining an upright stance in both static and dynamic activities. The inherent complexity of the tight cooperation between sensory perception and motor output makes the comprehensive quantification of postural competence very difficult. Nevertheless, a plethora of diverse qualitative and quantitative methods for the evaluation of postural stability have been developed, especially when considered in the context of other pathologies [
1,
2,
3,
4,
5,
6]. These assessments have called for improvement in the quality of measurement of balancing capabilities, subsequent identification of unstable persons and the elucidation of the underlying postural pathomechanism.
One of the most commonly exploited quantitative processes is the evaluation of parameters for the description of center of pressure (COP) excursions. The COP is the origin of all ground reactionary forces in the transverse plane, which are monitored by an objective force plate over a defined time interval [
7,
8]. The COP trajectory allows the indirect quantification of postural competence, based on body sway in quiet stance.
Beyond the conventional, costly force plates made by established manufacturers, an increasing number of cost-effective, portable force plates are finding relevance in day-to-day clinical practice. The most commonly utilized representatives of this group include the Midot posture scale analyser (MPSA) [
4,
5] and the Nintendo WII Balance Board (WBB), which functions not only as a training program [
9,
10], but also as a diagnostic tool [
2]. The validity and reliability of this system for the quantification of postural control has previously been researched in various ways and in numerous studies [
1,
2,
3,
4,
5].
Evaluation of the performance criteria typically occurs during cross-sectional clinical studies, in which volunteers of varying ages or health conditions are tested with conventional (previously evaluated) force plates, as well as with the new systems, such as the WBB. Depending on calculated parameters, the COP-tracks detected display good to excellent intra- and inter-study reliability values and satisfactory validity [
4,
11]. On the basis of these studies, it can be concluded that the WII Balance Board is valid for use in a clinical setting [
12].
A further method to determine the suitability of a system is by use of a technical pendulum [
11] and an inverted, spring-dampened pendulum has been used to evaluate the WII Balance Board. The inverse pendulum is considered a simple abstraction of postural stability and is frequently used as an approximation for human postural control [
11,
13,
14,
15,
16]. Evaluation based on such a pendulum not only allows conclusions to be drawn about performance criteria, such as reliability, but creates the possibility to properly calibrate the force plates. The availability of such a complex device as an inverse pendulum or the creation of such a pendulum necessitates great technical expertise and is therefore associated with high costs. In most cases, a simpler design, based on a mechanical (physical) pendulum, suffices for verification and calibration.
To our knowledge, the evidence supporting the validity and reliability of the HUMAC Balance System is lacking. Within the scope of this study, the HUMAC Balance System from CSMI Solutions, was evaluated in comparison to conventional force plates using a mechanical pendulum. The HUMAC Balance System is mechanically based on the WBB, yet differs regarding its communications interface. While the WBB’s data exchange is done via a bluetooth interface, the HUMAC Balance System makes use of a USB controller to create a virtual COM port. The virtual COM Port combines the advantages of a USB port (present in a standard Computer) and a RS232 interface which does not require the knowledge to write a USB driver. The sampling rate of the latter system equates to 100 Hz, implying that the boards are technical equivalents of one another. As a result of their high similarity, especially with regard to each board’s measurement procedures, it is expected that the HUMAC Balance System will prove to be a valid tool and possesses reliability values similar to those of the WII Balance Board.
2. Materials and Methods
2.1. Instruments
For evaluation, the precision of the HUMAC Balance System was compared to conventional force plates, each of which relies on different measurement principles. To eliminate equipment-specific deviations, reference data was collected for two AMTI force plates and two Kistler force plates. When testing the HUMAC Balance system, 26 devices were analyzed.
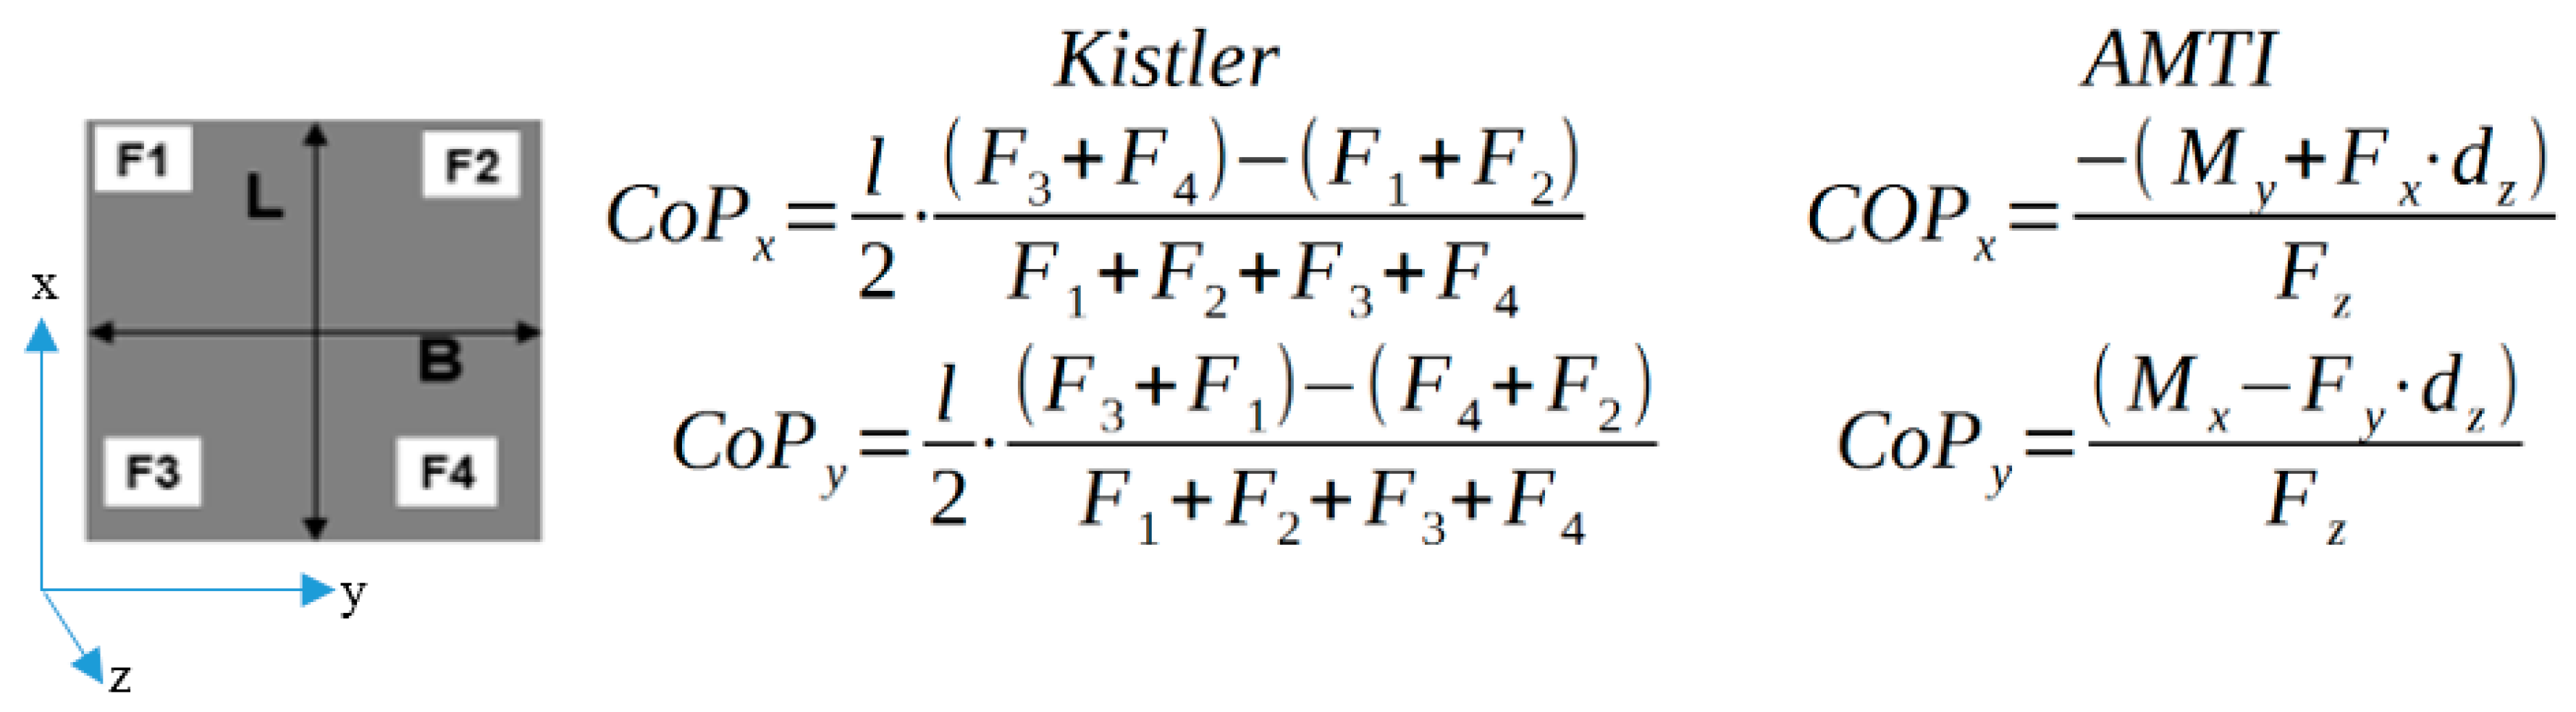
AMTI’s model OR6-7-OP-1000 is based on a central torque sensor, which records each torque value. In contrast, the load measurement system used in the Kistler device (9260AA) (Kistler, Winterthur, Switzerland) is based on a rectangular arrangement of force sensors in each corner. In addition to a vertical force (z-direction) applied to the platform, these sensors measure the proportional shear forces acting in the orthogonally oriented x- and y-directions, which can be used to determine the COP. In this process, both measurement systems have a sampling rate of 1 kHz.
The capture of raw data was completed using the original software provided by the manufacturer Mars (Kistler, Winterthur, Switzerland) and NetForce (AMTI, Watertown, Massachusetts, MA, USA). To achieve high comparability between the systems, the data was further processed and analyzed to identify relevant COP parameters with software developed by the authors.
An analogous process was utilized for data acquisition and analysis when evaluating the HUMAC Balance System. This device, resembling the Kistler model, is based on four force sensors located in each of the device’s four corners. However, in the HUMAC Balance System, calculation of the COP only takes into account the forces along the z-axis (see
Figure 1). At 100 Hz, the data collection rate of the HUMAC Balance Board is vastly lower than that of the parallel systems, but adequately accurate in its measurements [
17].
2.2. Static Measurement Conditions
The static evaluation of each force measurement system made use of a calibration weight, situated at five different positions for each device. The calibration weight consisted of a standardized cuboid with a homogenous mass distribution over its volume. Each respective position was determined according to a defined reference point (the midpoint of the force plate), from which a reference-system of coordinates was projected. The positions P1 to P4 were on the edge, in close proximity to each corner point, while P5 lay in the center of its respective force plate. The position coordinates of the mass respective to the central pressure point was measured over a time interval of 10 s using the COP-algorithm (see
Figure 1). The static measurement was repeated 10 times. A repetition of 10 measurements allows a sufficiently objective and valid evaluation of the measurement error under static condition.
Taking into consideration the static noise and quantization states, the raw data recorded for the Kistler and AMTI force plates were filtered by a second-order Butterworth low-pass filter and a cutoff frequency of 12 Hz following measurement. For the HUMAC Balance System, the results were processed by the manufacturer’s software and were taken directly into analysis.
2.3 Dynamic Measurement Parameters
Under dynamic conditions, the course of the COP in motion over time was documented. For a reliable simulation of such a one-dimensional, time-invariant reference movement, a mechanical pendulum was used. The pendulum, resembling a four-legged tripod, was fitted with a 25 kg spherical, lead weight hanging from a steel cable. Since the mass of the cable was negligible compared to the mass of the weight, it can be disregarded. The reference values for the evaluation of measurement accuracy were thus determined on the basis of the length of the pendulum, the pendulum’s angle of release, and time interval, corresponding to
Figure 2.
Over the course of this study, the pendulum’s length remained constant at 97 cm. The frequency of the reference movement was calculated using the formula:
The modelling of a movement for reference applies to a simple pendulum, as displayed in
Figure 2. The arc created by the pendulum’s movement is not relevant in this case, since the force plates only register the projection of the weight’s force vector in a transverse plane. The reference distance, corresponding to the model, is limited to the horizontal connection between the pendulum’s maximum amplitudes. Limiting the period of measurement to 10 s throughout the study is sufficient to make the expected dampening of the pendulum system negligible.
For statistical analysis, the measurement of the weight’s path over the force plate was repeated 20 times and data was collected in both the x- and y- directions. The COP-tracks’ distance signals in these trials were filtered in a similar manner to data collected under static conditions, using a second-order Butterworth low-pass filter and a cutoff frequency of 12 Hz.
2.4 Statistical Analysis
For the statistical analysis, each individual data point was clustered according to the system of measurement used to collect the data and summarized (group divisions: Kistler, AMTI, HUMAC Balance System).
The reliability of the systems was quantified by their intraclass correlation coefficients (ICC). The ICC is a parametric process for quantification of the data’s reproducibility based on its intra- and interindividual variability. This dimensionless gauge is based on a concept of variance analysis and is calculated using the quotient of systematic variance and the overall variance, as described by Shrout et al. [
19]. The consistency of measurements between the conventional force plate and the HUMAC Balance System was evaluated with the standard error of measurement (SEM), corresponding to Formula 2, where
σ is the standard deviation of the population.
The Root Mean Square Error (RMSE) is a statistical measure of the quantification of the average overlap between observed (y
i) and simulated values (ŷ
i) and allows an evaluation of forecasting quality of mathematical models with regard to the calculated values. It is calculated by taking the square root of the mean squared deviation (see Formula 3).
2.5 Validation of Methods
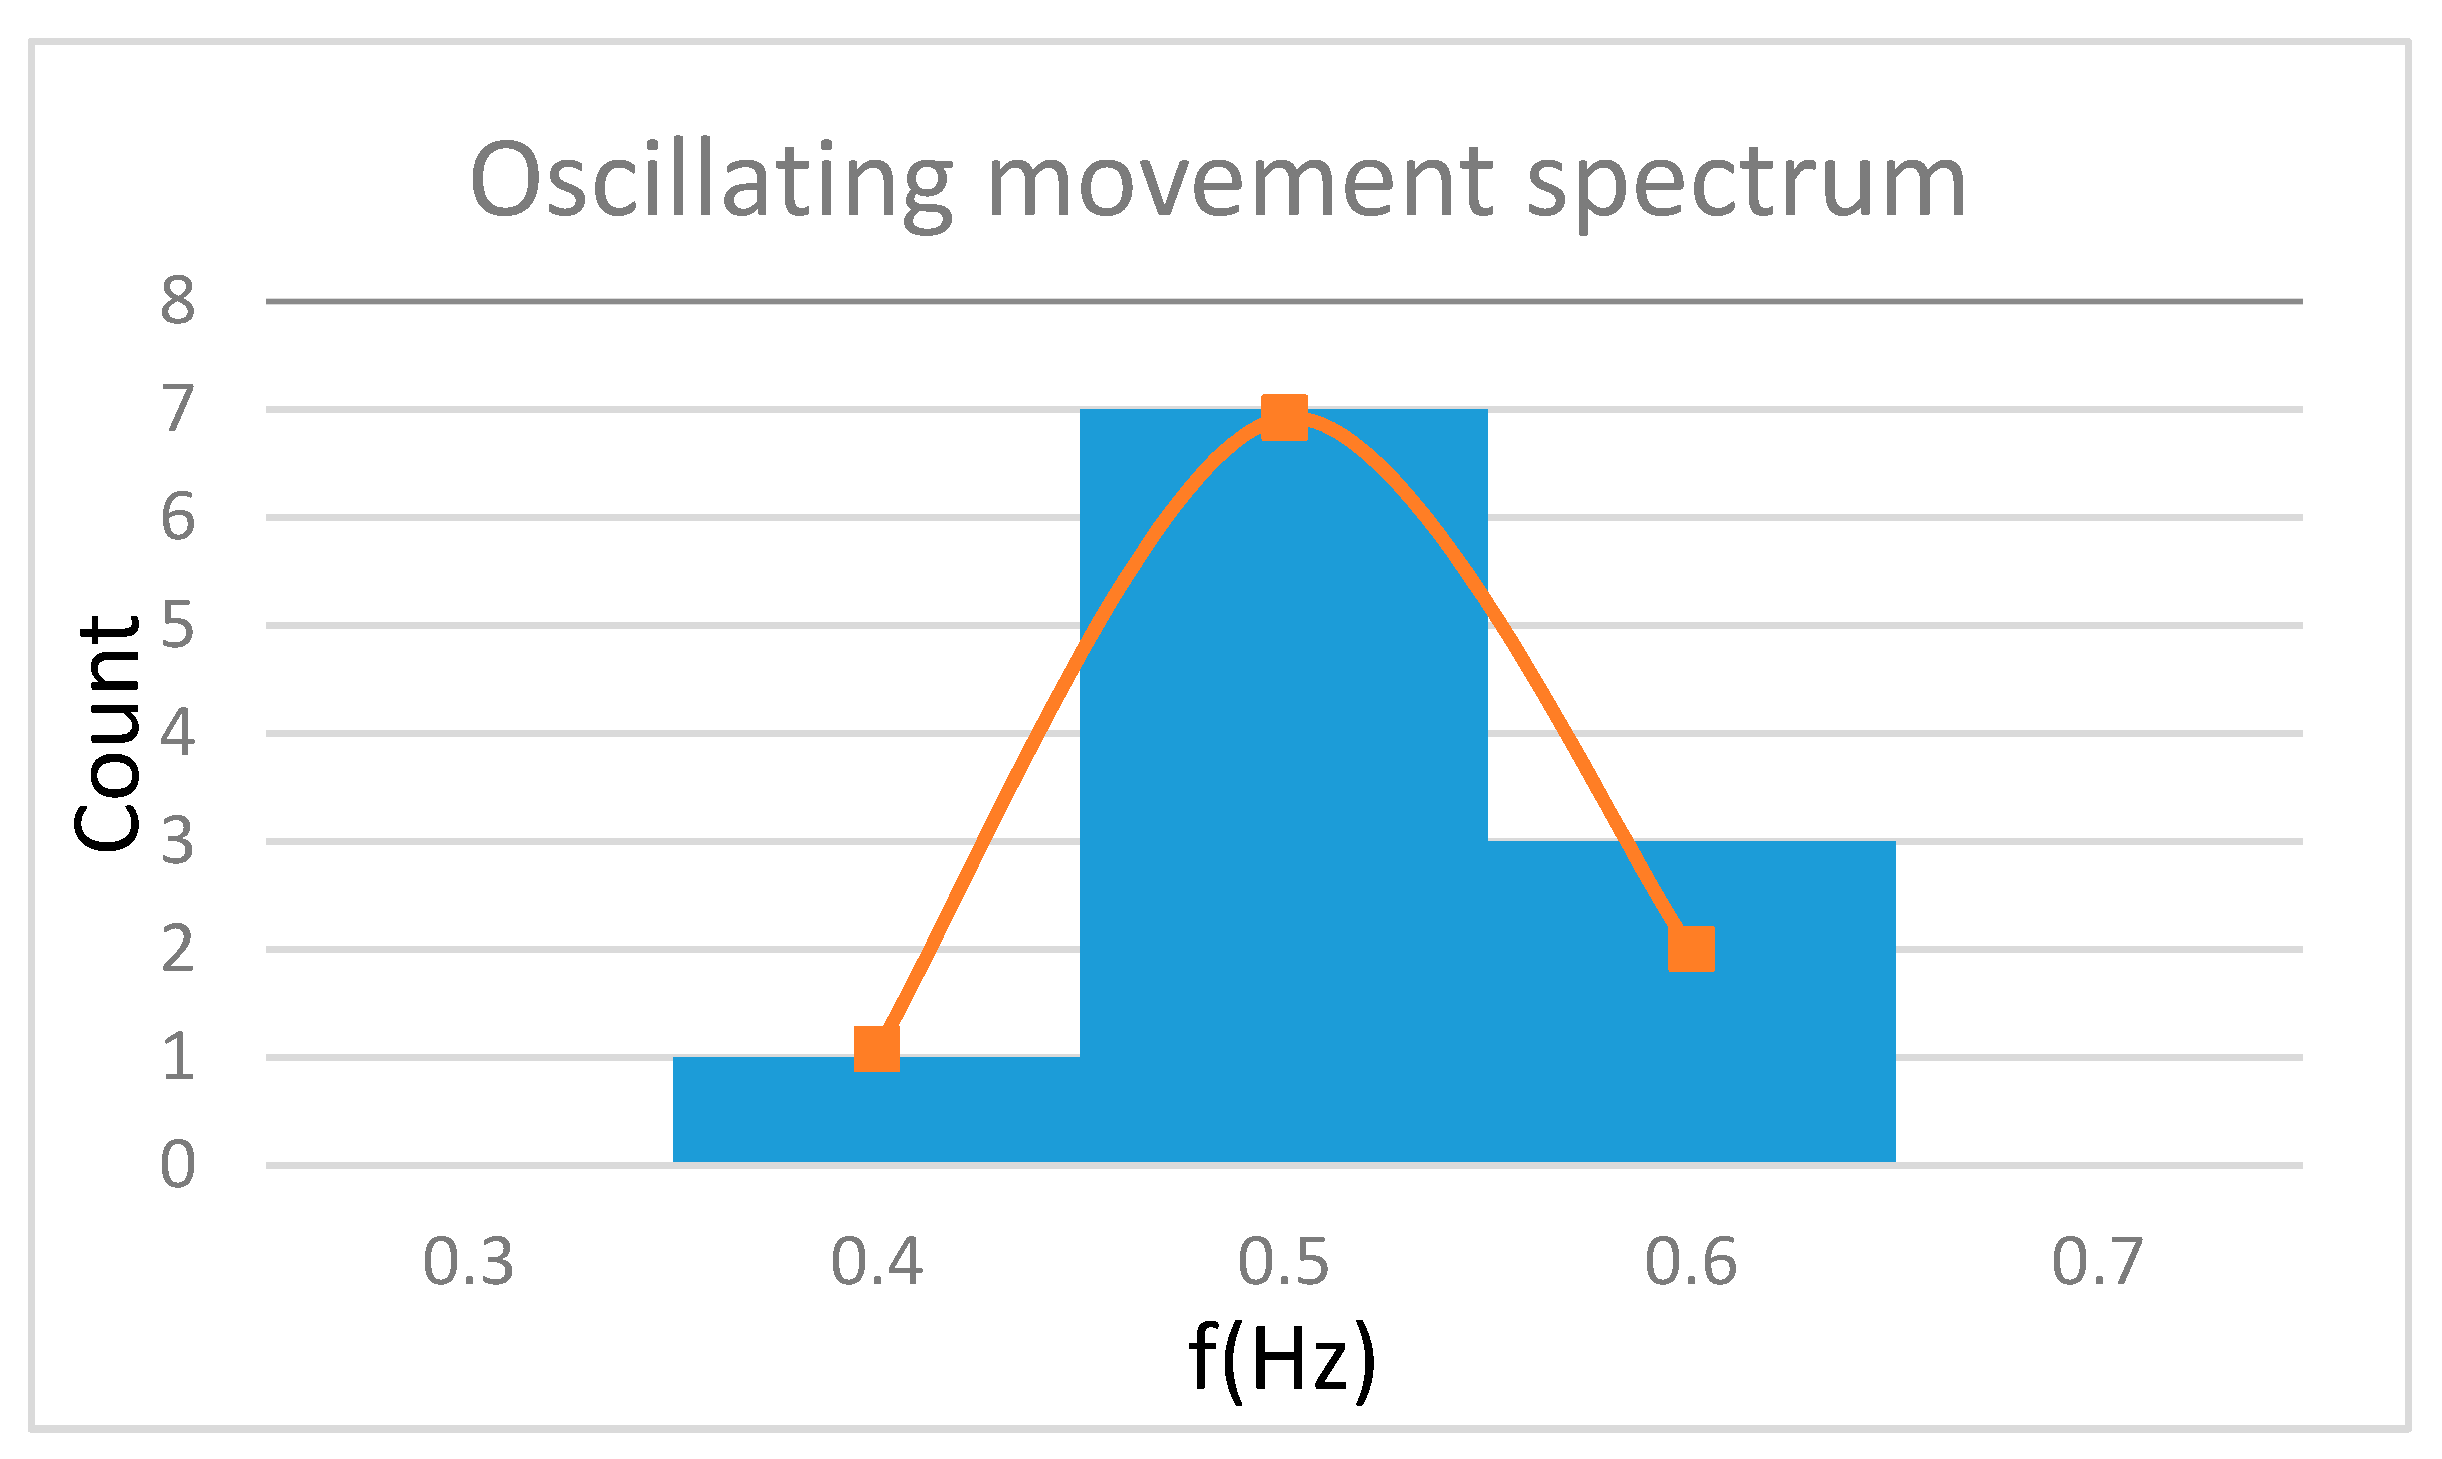
This study also took into consideration an analysis of the test setup (mechanical pendulum). Using a Fast Fourier Transformation (FFT), it was proven that the pendulum used was suitably reliable with respect to its application in the evaluation of the force plates. On average, the frequency of the swings equaled 0.5 Hz, as expected. The frequency deviation is consistent with a Gaussian normal distribution (see
Figure 3) and this implies that the pendulum’s displacement and mounting tend to produce few or no harmonic waves.
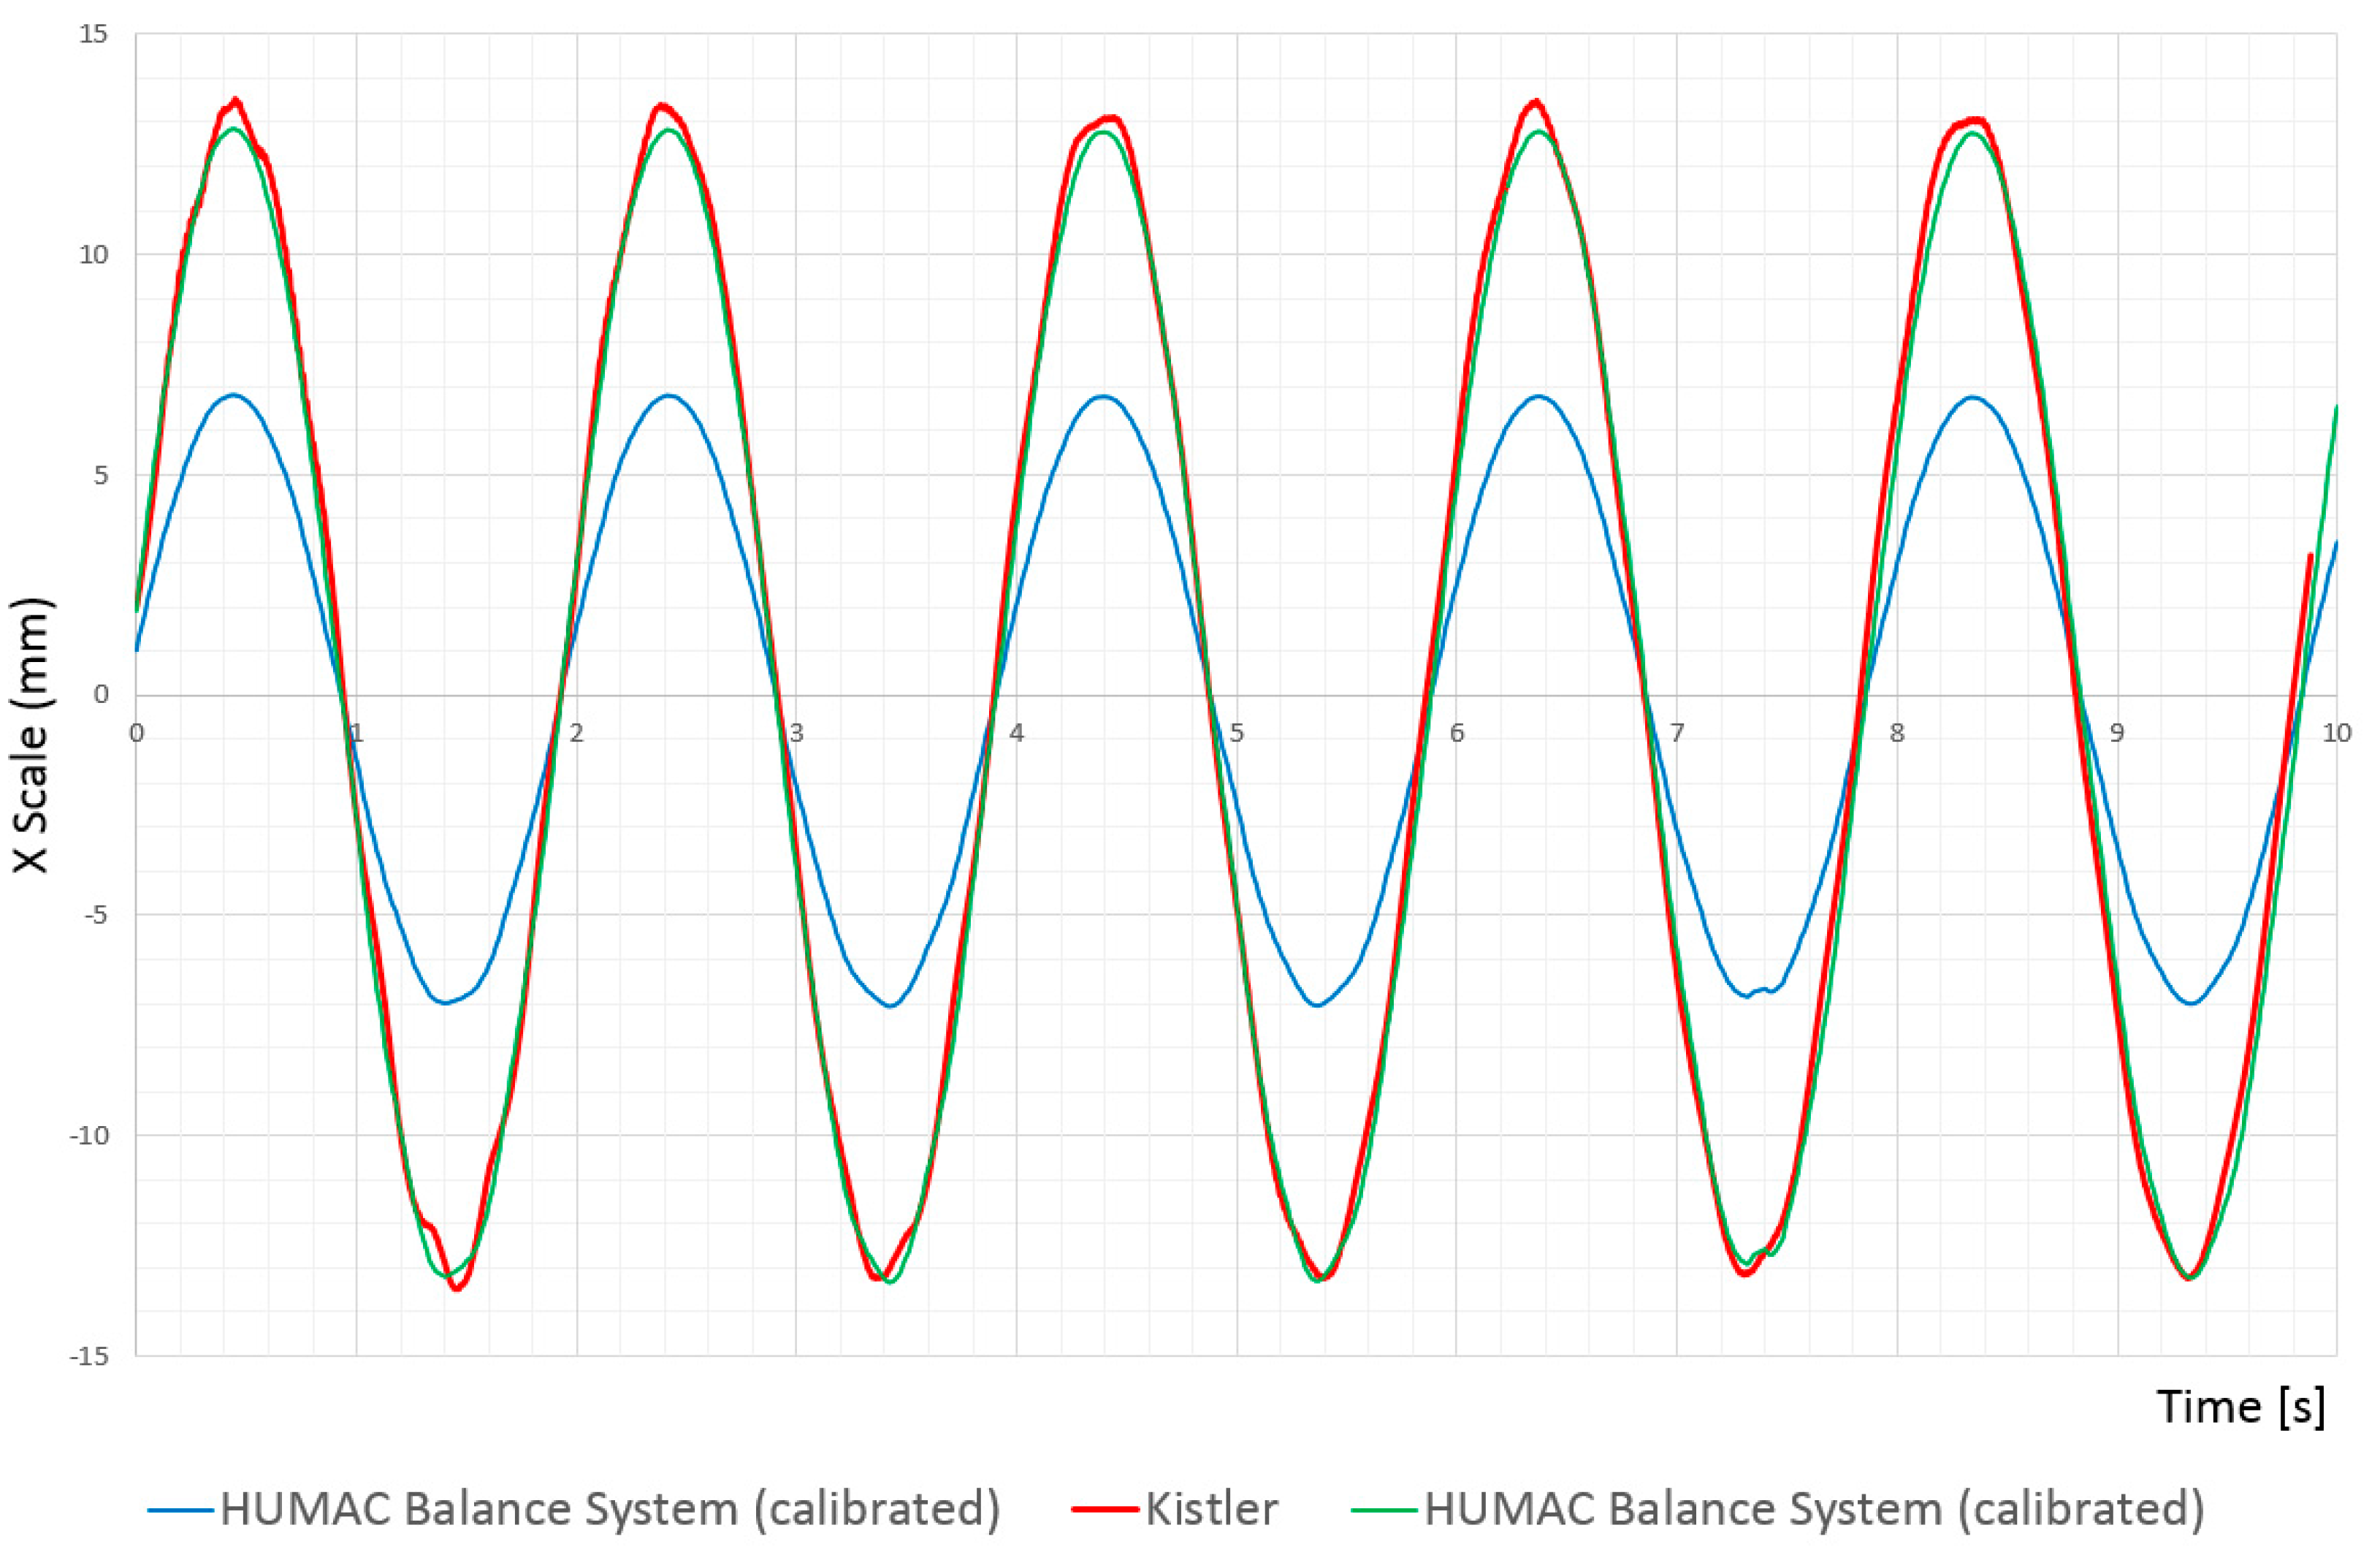
Subsequently, it was proven that, within five swings of a measurement cycle, no significant dampening of the pendulum’s movement with respect to the COP-track was evident (see
Figure 4).
The dampening was quantified using the following formula:
A mean dampening of δ = 0.00285 can be considered negligible for this short period of measurement.
3. Results
The series of studies performed included 26 HUMAC Balance Systems and 2 Kistler and 2 AMTI force plates. The HUMAC Balance System is based on the Nintendo WII Balance Board technology and possesses a method of measurement similar to the Kistler system. The static analysis was conducted using a defined calibration weight, while a mechanical pendulum was employed when testing dynamic conditions. The results under static conditions are summarized in
Table 1 below. The Forces in
Figure 1 correlate with the positions in
Table 1 (position1 (F1), Position 2 (F2), position 3 (F3), position 4 (F4), position 5 (center)).
The results of measurements under static conditions indicate that the measurements collected in all systems showed high reproducibility. For all measurements, as expected a priori, an ICC >0.99 could be achieved.
The absolute error of the HUMAC Balance system was consistantly under 6.60 mm. The error margin of the tested devices proved to be proportionately small and relatively constant. Contingent upon the principle of measurement used, the Kistler and AMTI systems showed a higher margin of error of up to 43.70 mm.
Under dynamic conditions, reciprocal results became evident, wherein the conventional force plates showed the smallest error margin. These results are summarized in
Table 2.
The results of the analysis under dynamic conditions illustrate that all measurement systems are reproducible. For all measurement systems and algorithms, the ICC was over 0.93.
For the conventional force plates, from the manufacturers Kistler and AMTI, the relative error margin lay at a maximum of 2.5%. Even in comparison to the HUMAC Balance System, they revealed the smallest RSME in both the x- and y-directions. The standard devices performed well in the categories of accuracy and precision when compared to the HUMAC Balance System.
In contrast, the HUMAC Balance System’s error percentage was over 5% (8.6% in the x-direction and 6.1% in the y-direction), which is substantially higher than the conventional force plates. Despite the HUMAC Balance System’s lesser accuracy, which is the cause of the error values, the system shows high precision of the selected test parameters.
4. Discussion
Quantitative assessments are generally subject to both systematic and random measurement errors. Depending on the measurement techniques used, the respective margins of error vary in magnitude and, in particular, external factors such as temperature can influence results. These factors affect not only the force plates, but also the testing system (the pendulum). Other sources of error lie in the technical setup of the systems, such as static noise of sensors and distortion of measurement amplification.
4.1. Static Conditions
For all of the force measurement systems, the mean margins of error were within an acceptable range, with the exception of those under dynamic conditions. The results of the static experiment, however, indicated an inhomogeneous distribution of accuracy for AMTI and Kistler’s conventional force plates, depending on the position of measurement. The AMTI system showed higher accuracy near the edge of the force plates (P1–P4) than in the center (P5). A possible cause for this could lie in the measurement procedure, which uses a central torque sensor. The positions P1 to P4, because of their relative proximity to the edge of the force plate, have a significantly larger lever arm and therefore produce a larger moment. Position 5 (P5), in the center of the force plate, has the smallest moment as a result of a small lever arm and as a result, the detectable forces and momenta in the center are considerably smaller even with an identical load.
The Kistler force plates have an inverse distribution of error. The error margins in the outlying areas were largest on average. It is to be assumed that this phenomenon can also be traced back to the sensor positions. The sensors are located on the outer edge of the force plate, in the corners of the platform. By positioning the test objects right on the edge of the force plate, the system limits are exceeded, which again leads to an increased margin of error, whereas the results at position P5 reveal a lower error margin. As the Kistler plate is fitted with piezoelectric sensors, the plate is generally considered to handle dynamic conditions well. However, under purely static conditions, its performance is exceeded by other systems, like the HUMAC Balance System. The measurement system of the HUMAC Balance System is based on strain gauges, which register stretching or compressing deformations and, therefore, the HUMAC Balance System can be utilized under purely static conditions, where the expected margin of error lies below 5 mm and was lowest in comparison to the others tested.
4.2. Dynamic Conditions
For the evaluation of the various force plates under dynamic conditions, this study made use of a mechanical pendulum. A mechanical pendulum sets itself apart from an inverse pendulum by relying on a simpler setup and better applicability. The analysis of such a setup assumes that a simple pendulum is suitable for the evaluation. The system produces a constant oscillating movement with a nearly constant frequency. The dampening of the pendulum’s swings is trivial, at δ = 2.85 × 10⁻³, and aside from the frequency, the amplitude within five oscillations can be considered constant.
For the assessment of the suitability of the different systems, the error margin over a period of 10 s was quantified. The absolute error of the conventional systems was relatively low and the spread was within a reasonable range. The force plates manufactured by AMTI and Kistler were comparable to others in their class and a maximum relative error margin of 2.5% was calculated.
The HUMAC Balance System, a low-cost alternative to conventional force plates, indicated a significantly higher margin of error under dynamic conditions. The measured COP-tracks in the x-direction and especially in the y-direction were drastically lower than the values calculated according to theory. In their sum, the COP-tracks were consistently 7–10% shorter than the expected value.
Furthermore, a noteworthy spread of results was observed over the entire group of HUMAC Balance Systems. The variability calculated for the system (SEM x = 1.78 and y = 1.4) lies within the range of error of the conventional systems. The reproducibility of these results was very good, but only conditionally comparable to the other boards.
4.3. Calibration of the HUMAC Balance System
The error analysis of static and dynamic conditions indicated that the measurement systems are affected by different classes of error due to their varying fields of application and contrasting methods of data collection. While the HUMAC Balance System revealed the lowest margin of error under static conditions, its error margins for the COP-tracks in motion (pendulum motions) were the largest when compared to the conventional force plates and this error was traced to the consistently low data values. This result made the necessity of a calibration of the HUMAC Balance Systems clear.
In the study by Lech et al. [
11], the authors suggested an error accommodation for WII Balance Boards using a linear regression. In this study, the mean regression coefficients m
x, m
y, b
x, b
y for all 26 boards were calculated using the aforementioned procedure. For calculation of the corrected COP-tracks, the following coefficients were used: m
x = 0.97308; m
y = 0.8961. With this calibration, the correction of the offset was made possible. Subsequently, the COP-tracks under dynamic conditions were recalculated using equation 5 [
13].
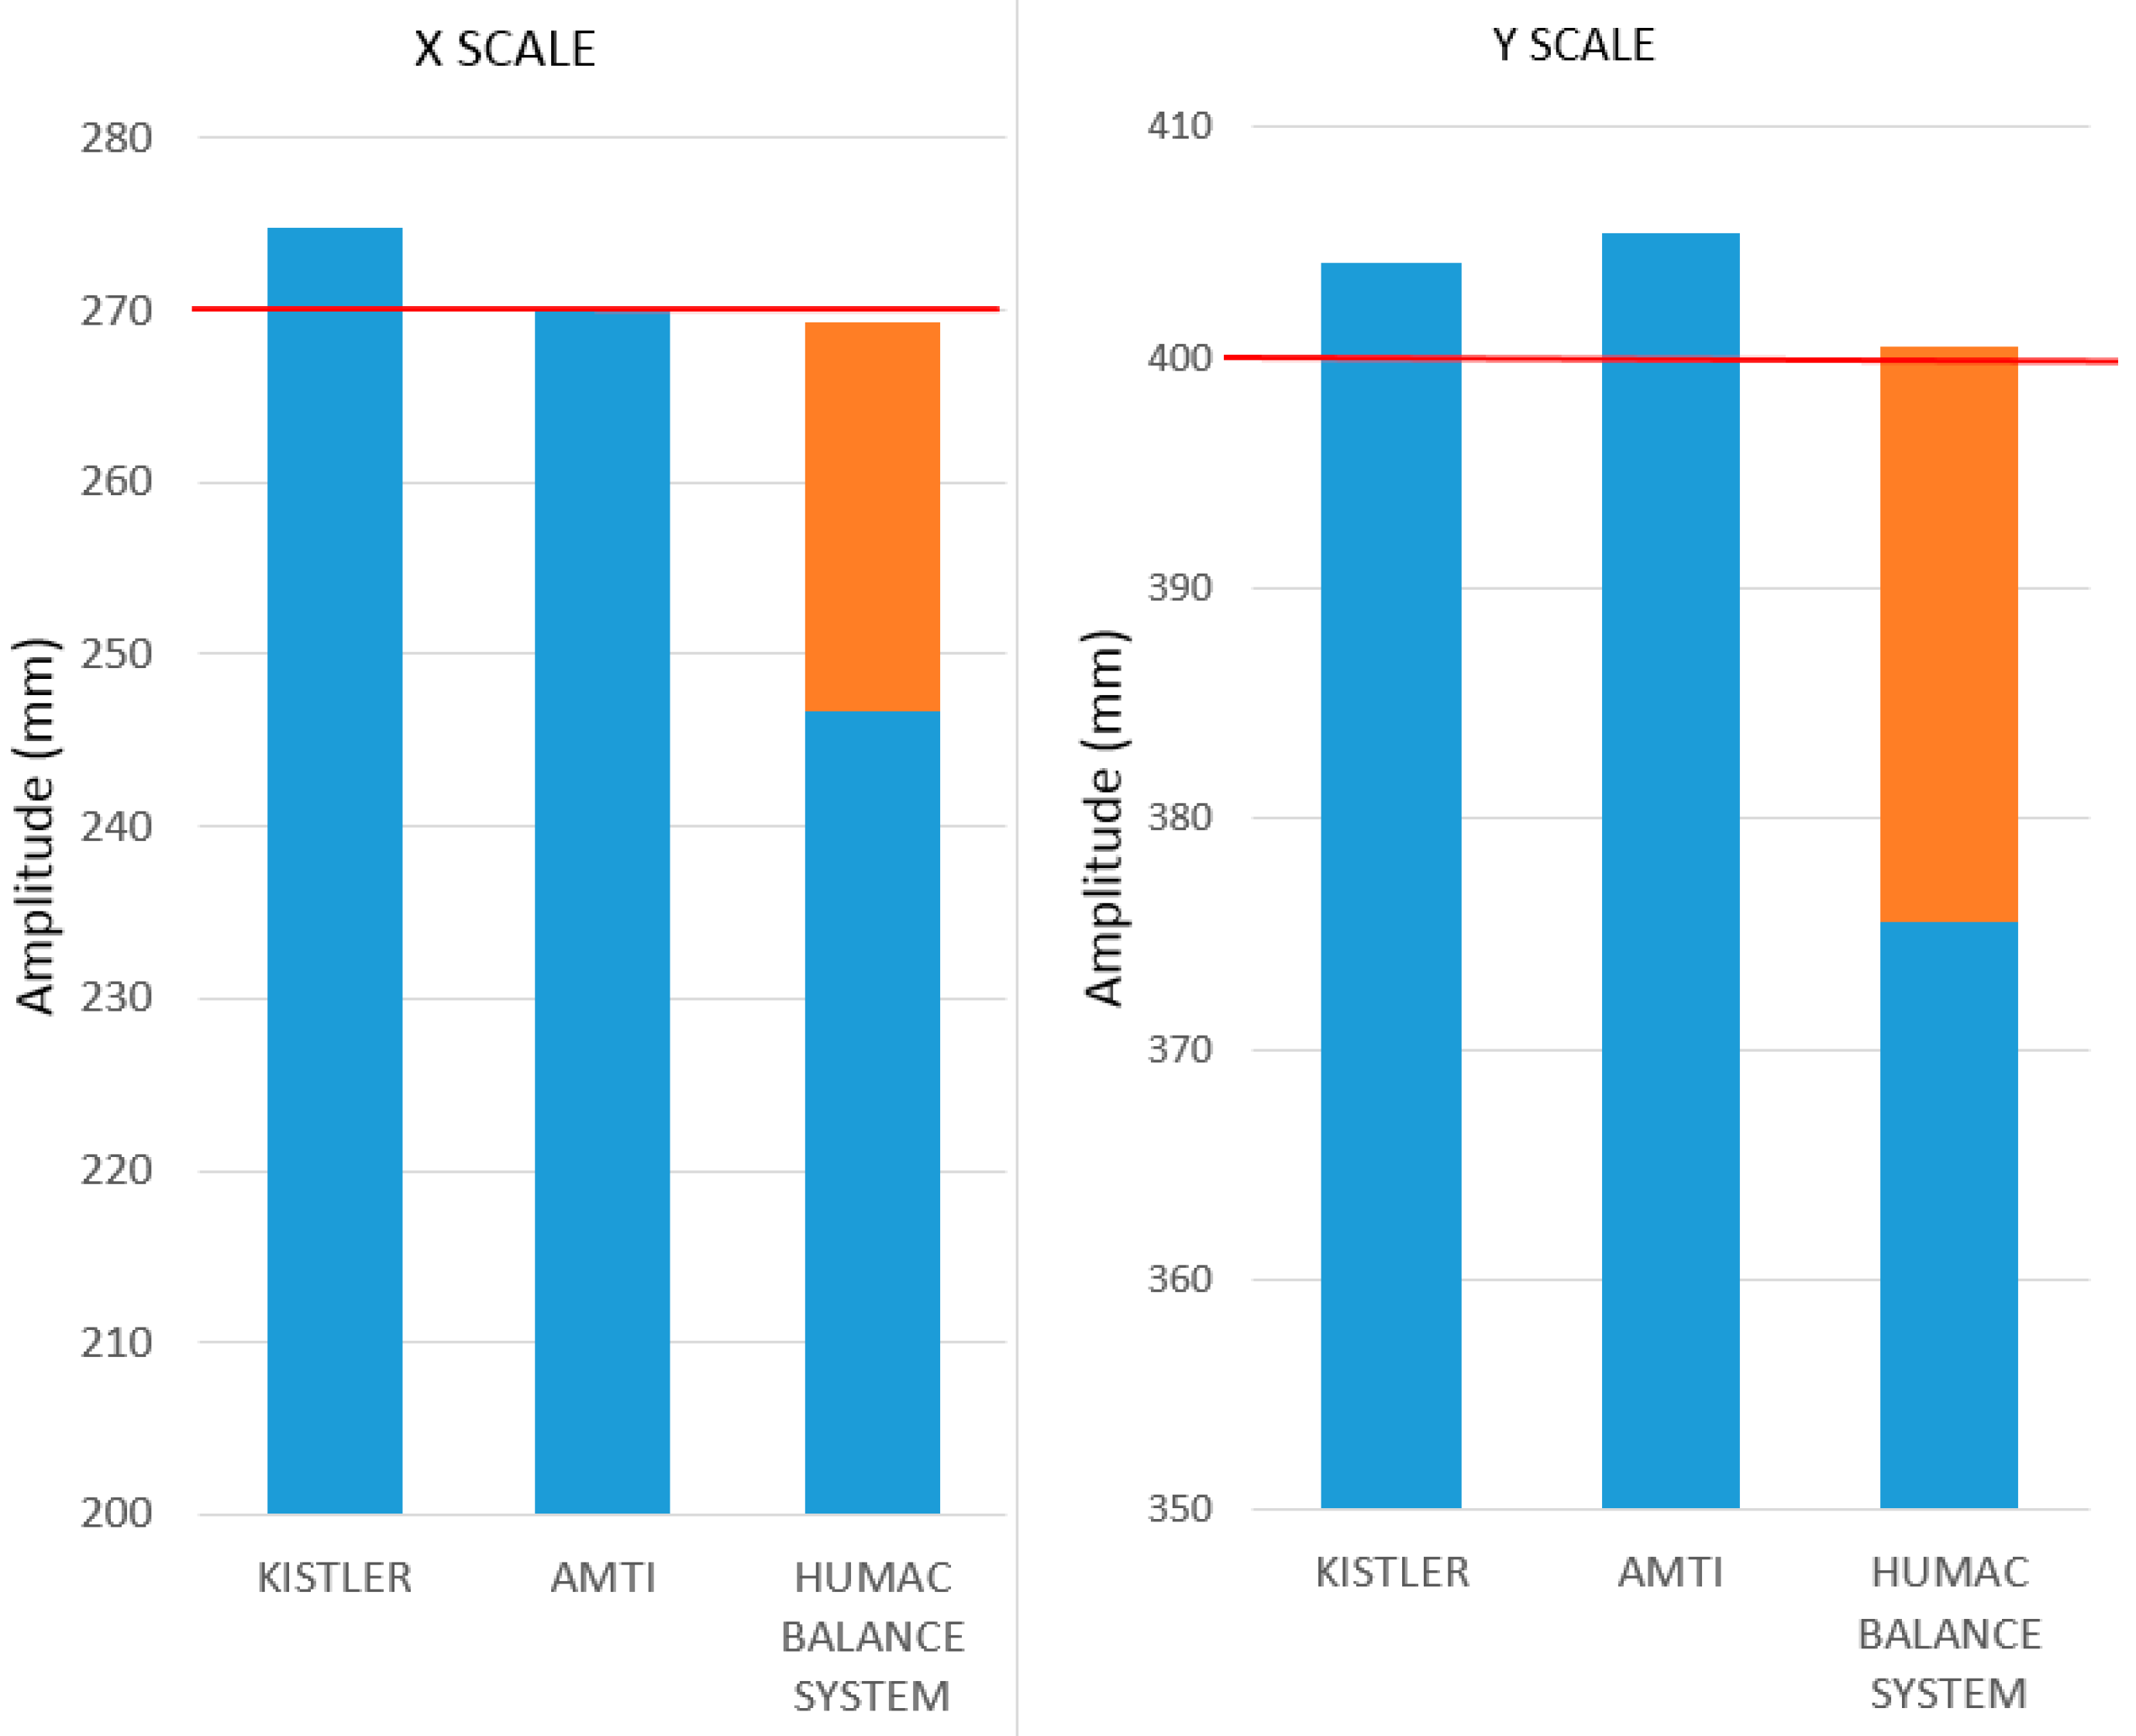
The correction using linear regression enables a significant reduction of the mean error in the x- and y-directions and the resulting margin of error could be reduced to 0.1% in the x-direction and 0.18% in the y-direction. Following the calibration, the HUMAC Balance Systems appeared comparable to the conventional force plates (see
Figure 5).
With reference to the expected value for the measurement (red line), the HUMAC Balance Systems did not indicate high discrepancies after calibration (orange section). This means that the calibrated HUMAC Balance System displays a high quality, similar to the conventional force plates.
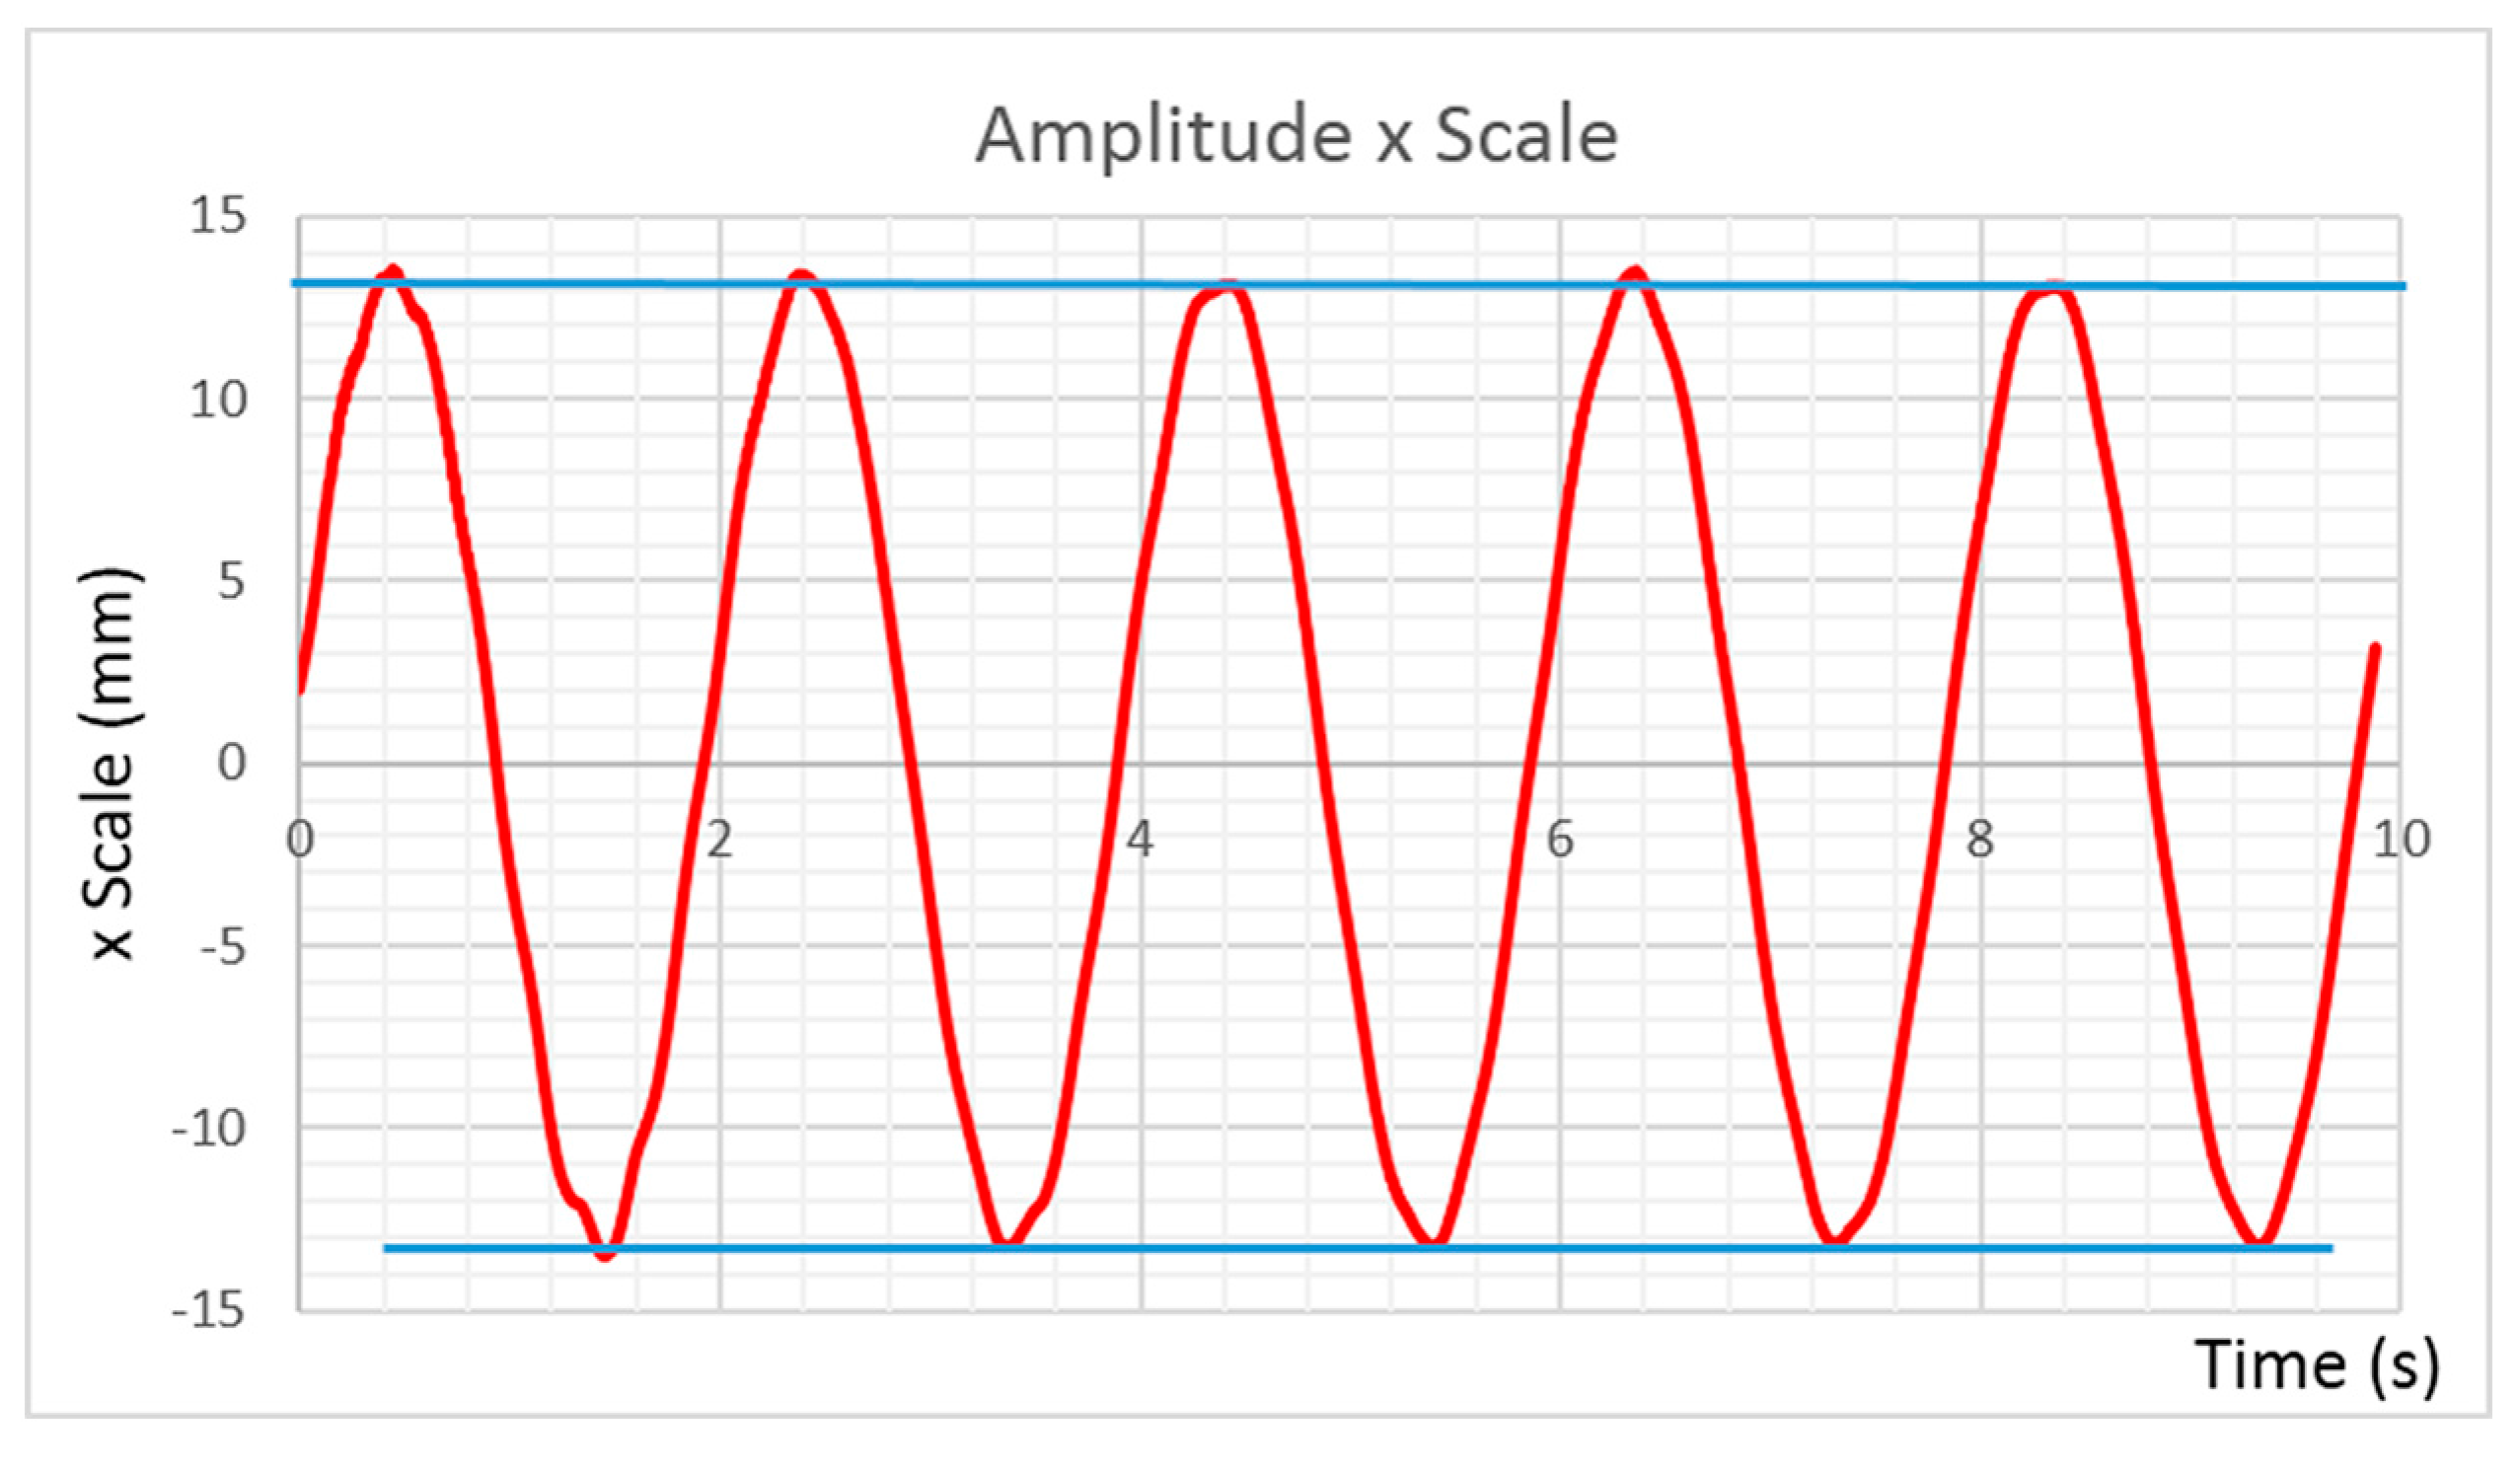
Rather than altering the properties of the data points, linear calibration merely stretches the data curve by a scaling factor (see
Figure 6) and the resulting measurements have lower error margins, implying that the HUMAC Balance Systems have higher accuracy. The calculated corrected values are based on a group calibration process, which included a total of 26 HUMAC Balance Systems (mean calibration factor).
For higher accuracy, this form of calibration is insufficient and the group calibration must be supplemented by the individual calibration of each board.
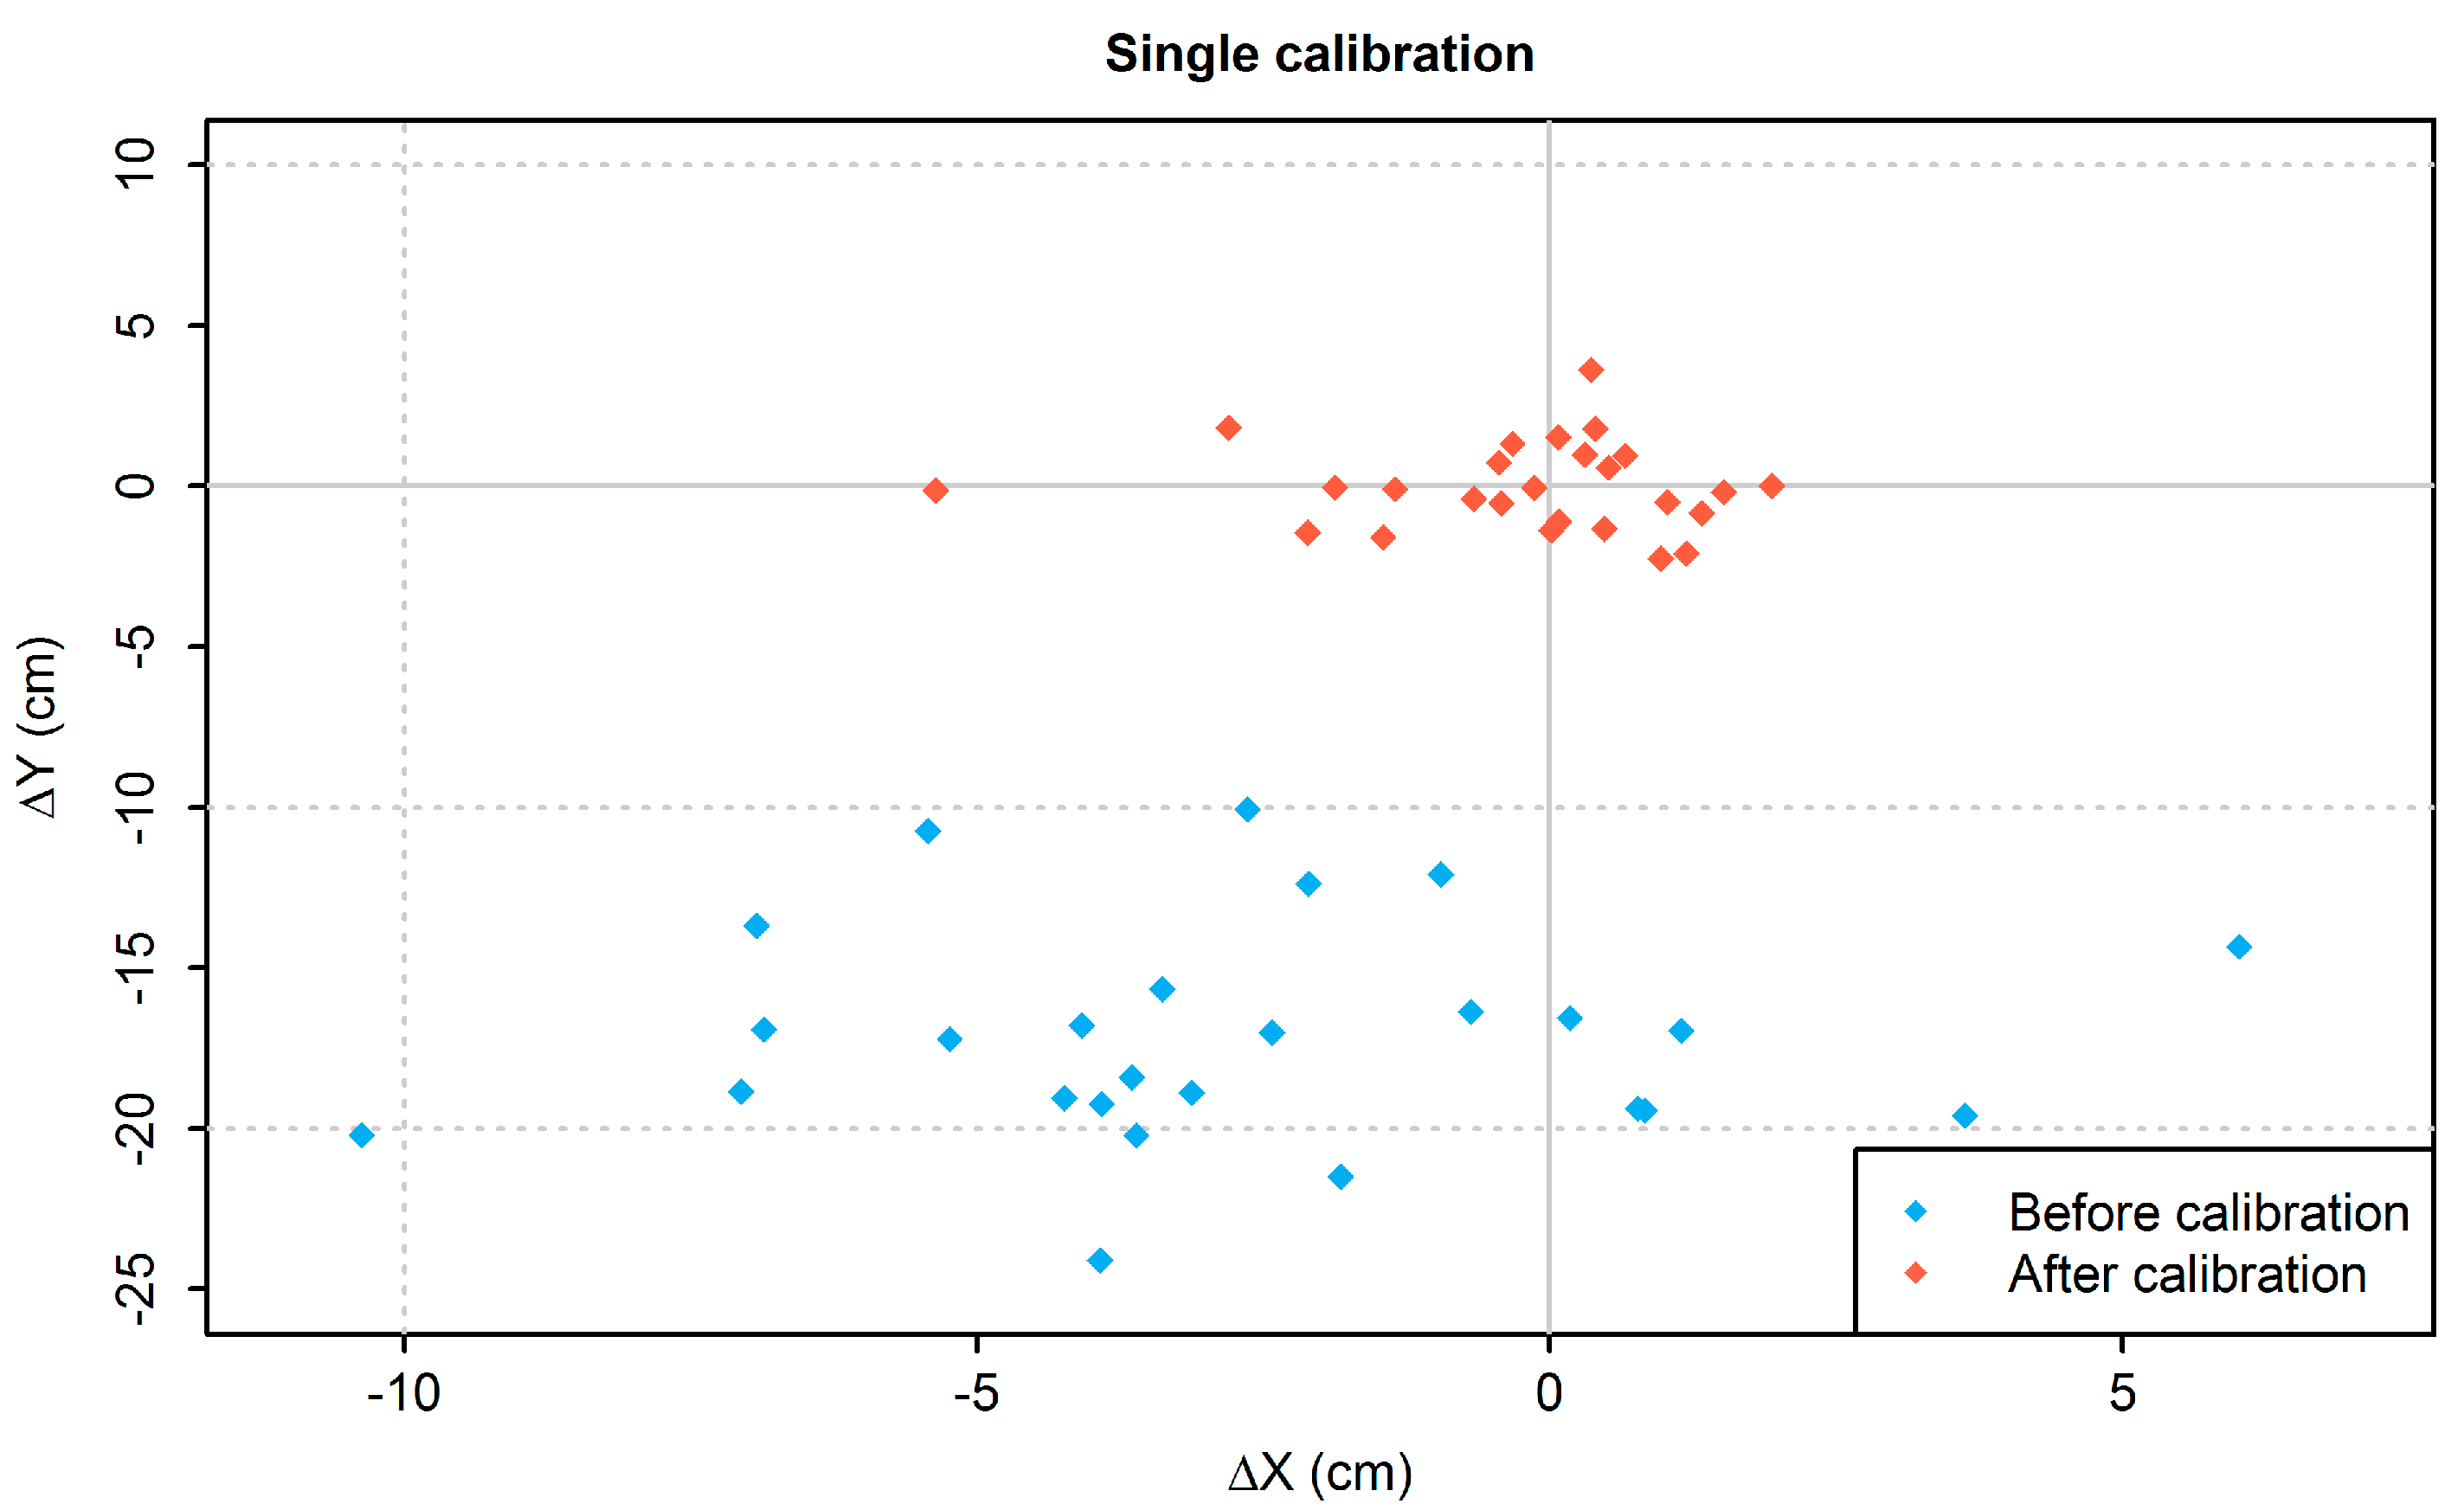
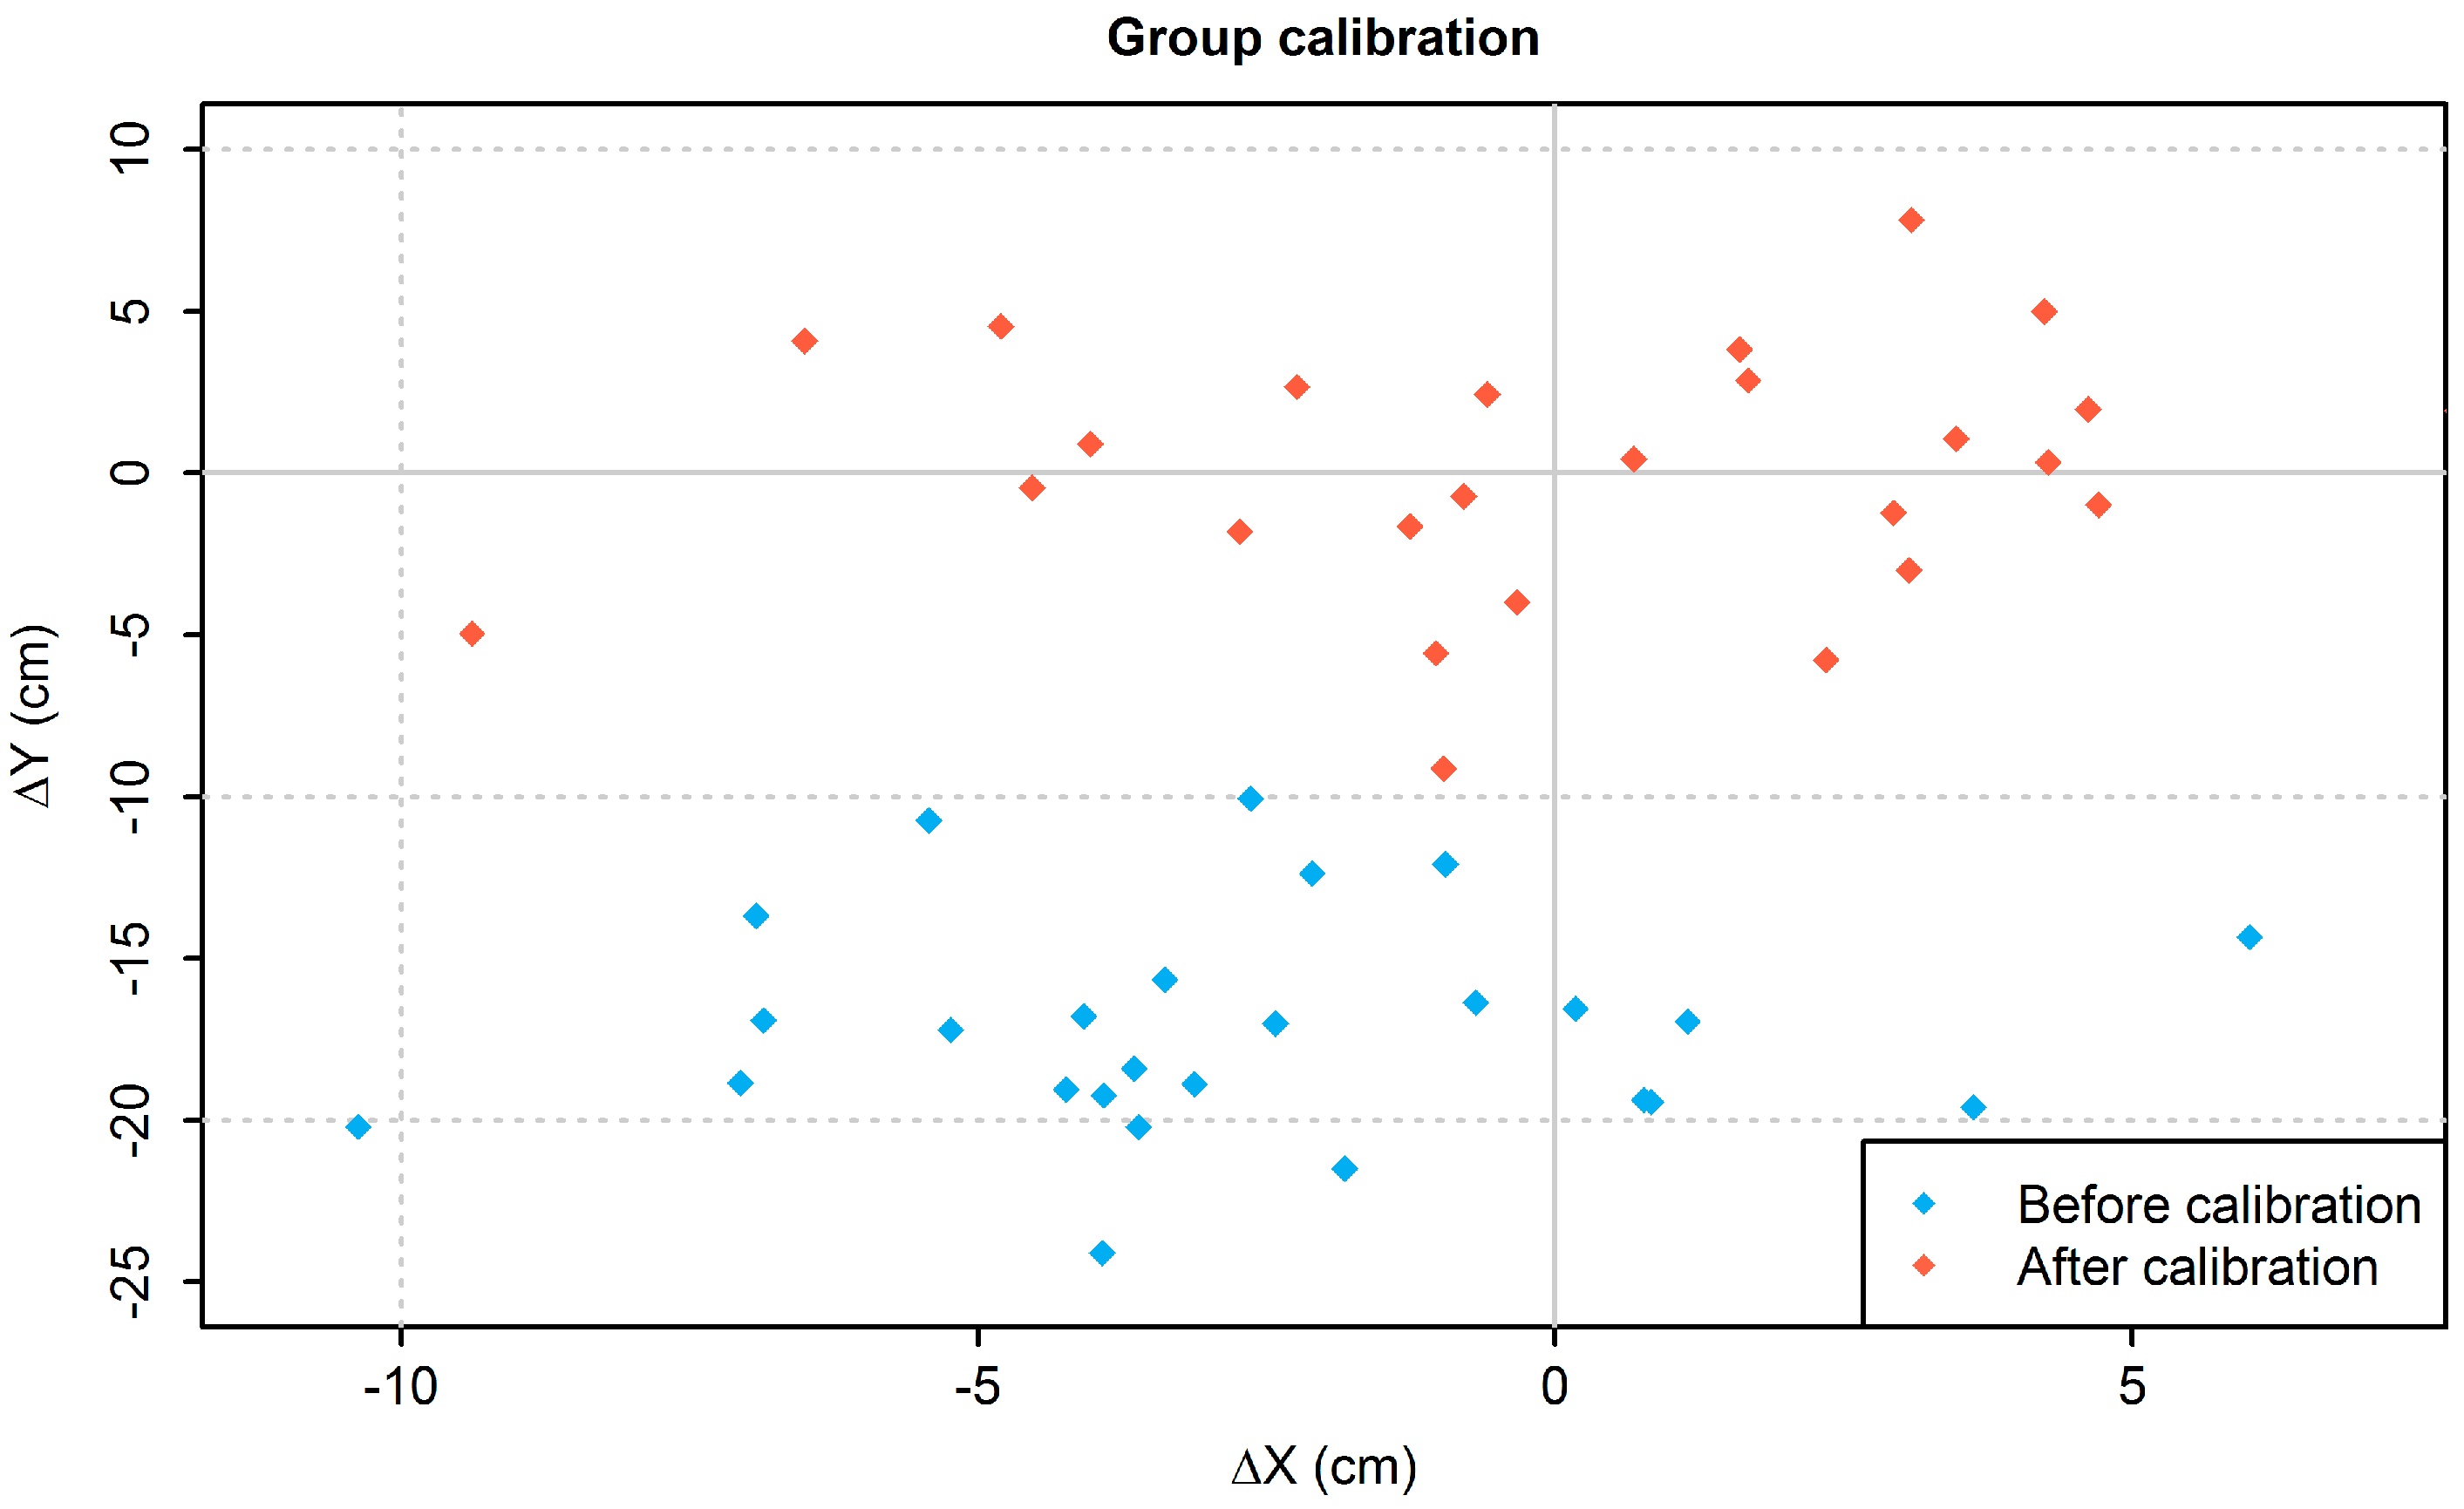
The comparison of the scatterplots (
Figure 7) exemplifies how the different methods of calibration affect the accuracy and precision of the entire group of HUMAC Balance Systems. In a group calibration, the corrected values are based on the entire group of tested boards and because of the large sample size, these results carry a general validity within the study. By undertaking this procedure, the boards’ accuracy is improved overall, but their precision is mainly unaltered. In contrast, an individual calibration improves the accuracy and precision of each individual board, which consequently also enhances those values for the group overall.
5. Conclusions
The goal of this study was to examine the HUMAC Balance System’s viability for the valid and reliable quantification of the COP or a COP-track.
This study demonstrated that the force plates manufactured by AMTI and Kistler delivered results fitting and comparable within their own groups. The reliability of these systems proved to be good to very good. When considering defined parameters, the quantifiable margins of error are less than or equal to 2.5% of the standard result and are therefore in an acceptable range.
The results of the HUMAC Balance System or similar devices can be improved by device-specific calibrations and can thereby achieve standards set by the conventional force plates. Assessing the devices intended purpose is relevant; if the results were to be compared with other measurements, the devices should all be calibrated using the same method. As long as the device is used individually for the visualization of the COP-track, for example in a therapeutic environment, the complex process of calibration can, under certain circumstances, be avoided altogether, since it must be repeated regularly to compensate for the effect of aging.
To avoid errors in static measurements created by placing the test object on the board’s outer edge, which is distorted by some force plate systems, this methodology should be modified in a manner that the test object is positioned on the edge of the area registered by the sensors.
The data collected in the test series serves as an example of a system which achieves the standard of conventional force plates, and can be utilized when searching for or designing cost-effective devices to be used in doctors’ offices. It is suggested that systems like the WII Balance Board be researched using the described method.
From previous studies, it can be gleaned that the speed of the COP-track is also a significant variable [
20,
21]. Based on the mathematical-physical relationship between speed and path, it can be assumed that the path measurements can be deduced from the speed.
In summary, this study has shown that the mechanical pendulum is suitable for comparison and calibration of force plates for the calculation of the COP-track. To reduce the variability of the dynamic data, the starting point of the weight could be altered. Ideally, this could be done by providing a fixed starting position, from which the weight automatically detaches at the beginning of the measurement period. Similarly, the mounting of the pendulum could be modified in a way that would prohibit lateral oscillations.


