Abstract
Increasing electric vehicle (EV) adoption raises concerns about EV waste management and the impact on the environment. To improve energy efficiency and exploit their remaining usable capacity, the retired batteries may be repurposed in second-life applications. This paper predicts the usable second-life capacity of retired EV batteries, considering the European Union (EU) regulation regarding the mandatory recycled critical material quotas in newly manufactured batteries from 2031 onwards. Based on political influences and the market’s capacity to return to pre-pandemic values, four scenarios are proposed regarding future EV sales in the EU market. The algorithm implemented in Matlab R2025a indicates the batteries that must be recycled to meet the mandatory targets and the ones that can be repurposed as battery energy storage systems. Historical data and future predictions are used to determine the number of EV batteries sold, lifetime, the market’s chemistry share and the usable capacity for second life. The annual mandatory recycled critical material content is compared to the available recyclable mass from both retired batteries in the current year and those that are already active in their second life. The economic analysis reveals the scenario with the highest total revenue, including the cascade benefits and recycling value.
1. Introduction
Efforts to reach the Sustainable Development Goals by 2030 are intensifying. Regarding energy and climate objectives, reliance on renewable energy is increasing, while energy efficiency is improving in nearly all countries around the world [1]. The adoption of electric vehicles (EVs) has an important impact in reducing greenhouse gas emissions and achieving climate goals. The global EV fleet, which mainly consists of Battery Electric Vehicles (BEVs) and Plug-in Hybrid Electric Vehicles (PHEVs), reached approximately 58 million at the end of 2024 and displaced over 1 million barrels per day of oil consumption in the same year [2].
Although global EV sales have increased significantly in the last five years, exceeding 17 million in 2024, the spread of EVs is not even across the world. As can be seen in Figure 1, the leader in EV sales is China, which recorded half of global EV sales in 2021, the share growing to almost two-thirds in 2024. It is followed by Europe, with one in five EVs sold in 2024, and the United States, with 1.6 million EVs sold in the same year [2].
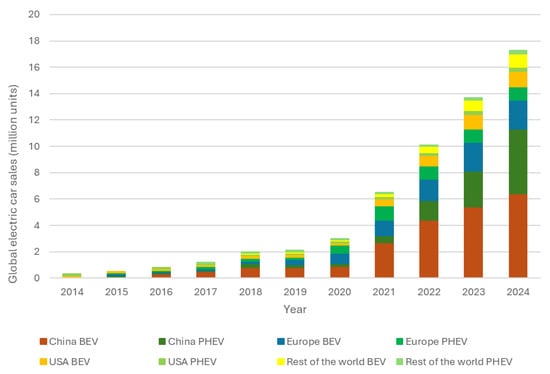
Figure 1.
Global electric vehicle sales, 2014–2024 [2].
The European Union (EU) has set several policy guidelines to aid the member countries in the energy transition towards electric mobility and to reduce dependence on fossil fuels. The promotion of low-carbon transportation alternatives rapidly increased the adoption of BEV and PHEV. Several factors can influence the consumer’s behavior: charging station availability, charging time, battery range and quality, technological advancements, price, environmental tax revenues, income and level of education [3]. Although the integration of EVs offers significant benefits, it also raises challenges related to battery decommissioning and disposal at the primary End of Life (EoL). Retired EV batteries typically retain 70–80% of their initial capacity, making their repurposing in second-life applications—such as energy arbitrage, peak shaving, grid services, renewable integration and backup power—an attractive option [4,5]. However, battery degradation is driven by multiple factors, including operating temperature, high charge/discharge currents, depth of discharge, state of charge, driving behavior and accumulated mileage [6,7,8].
In addition to electrochemical aging, safety-related degradation mechanisms impose important constraints on the usable capacity of retired EV batteries for second-life applications. High-rate and deep discharge can substantially increase heat generation, with lower cut-off voltages and higher C-rates leading to higher maximum temperatures and intensified side reactions. These conditions promote Solid/Cathode Electrolyte Interface (SEI/CEI) decomposition and reconstruction, transition-metal dissolution (e.g., Mn, Ni, Co), cathode particle fracture, and copper current-collector dissolution, ultimately causing irreversible structural damage and cell failure even when residual capacity remains [9]. Notably, discharge rate exerts a stronger influence on thermal behavior than cutoff voltage, highlighting the importance of load history when assessing repurposing suitability [9]. Furthermore, external heating has been shown to trigger thermal runaway in LiFePO4 cells, while coupled external heating and short-circuit conditions can escalate to combustion due to rapid gas release and ignition by high-temperature conductors, with electrode tabs or damaged wiring acting as potential ignition sources [10]. These findings indicate that usable-capacity prediction must be complemented by safety-oriented screening, as batteries retaining significant nominal capacity may still present elevated risks of thermal runaway or catastrophic failure under second-life operating or fault conditions, underscoring the need for safety-aware assessments when evaluating batteries for second-life deployment.
This paper proposed an algorithm that predicts the usable capacity of retired EV batteries, considering the EU’s new Battery Regulation, which mandates lifecycle sustainability through higher collection/recycling targets for valuable materials. There are several studies in the literature that consider different approaches to determining global and regional second-life battery capacity. The analysis performed in [11] considered performance potential, technological and economic aspects of the utilization of retired EV batteries in decentralized mini- and micro-grids. Three battery chemistries were analyzed, and the Bass Diffusion model was implemented to project the technological adoption rate in major EV markets. The results show that by the end of 2028 there will be a potential of 120–549 GWh in retired storage, available to be used in second-life applications.
In [12], two scenarios are considered in the management of end-of-life lithium-ion batteries (LIBs): the Stated Policy Scenario (STEPS), which incorporates existing government policy regarding the recycling of batteries, and the Sustainable Development Scenario (SDS), which considers the targets set until 2030 for EV car deployment. The adoption of circular economy business models, involving the Remanufacturing, Reusing and Recycling (3R) of EoL LIBs, is combined with the Weibull distribution function to forecast the number and capacity of LIBs available in EU countries (EU-27) and in Germany and France, the countries with the highest EV adoption. The results show that in EU-27 the accumulated LIBs available for second life applications would reach 3.9–7.9 million by 2035, with an energy storage of 212–617 GWh. The estimations for Germany and France indicate that the available energy storage will support 98 GW and 42 GW of photovoltaic systems installations by 2030.
Based on the State-of-Health (SoH) of the retired EV batteries in the United Kingdom, ref. [13] analyzes the EoL to determine the opportunity of a second life as stationary energy storage systems. There are different factors considered to determine SoH at the EoL, including available capacity, age degradation, mileage and duty cycles. Based on several distribution functions (Weibull, Gamma, Logistic and Normal) an ageing model for EV batteries is proposed. The results show that by 2035 there will be a 43.5 GWh capacity available for repurposing in second-life applications.
The Convolutional Neural Network–Bidirectional Long Short-Term Memory (CNN-BiLSTM) model integrated with a Weibull-based battery retirement model was used in [14] to forecast the New Energy Vehicles (NEV) to study the potential of retired NEV batteries. The results project annual NEV sales of around 26–36 million units by 2040, translating to a second-life storage capacity of 14.21 TWh. Table 1 summarizes the findings of the above-mentioned literature studies.

Table 1.
Comparison of literature studies that predicted the available capacity of retired EV batteries.
Even though there are similar studies that predict the volumes of retired EV battery capacities and propose future policies for the European market [12], predict the distribution share between recycling and repurposing volumes [15] or implement the EU regulation regarding recycling targets [16], there is no research, to the authors’ knowledge, that analyzes in detail the lifecycle of available EV battery chemistries, which represents an extensive and complex analysis of their exploitation.
The main objective of this study is to predict, in four scenarios, the usable second-life capacity resulting from the retirement of EV batteries, after meeting the mandatory recycled critical material quotas, according to the EU regulation. This paper considers the following factors: number of EVs sold, battery capacity, chemistry market share, battery lifetime (both in 1st and 2nd life), battery SoH and degradation, EU regulation regarding both recycling content targets and recycling efficiency, mass of battery recyclable materials and composition of resulting second-life capacities. Moreover, the economic analysis performed indicates the scenario with the highest revenue obtained by repurposing retired batteries and recycling them.
The rest of the paper is structured as follows: Section 2 presents in detail the proposed methodology, the flowchart of recycling, the second-life decision process and the batteries’ SoH and lifetime distribution; Section 3 describes the analyzed case studies, proposing four scenarios regarding the number of EV sales, as well as the considered evolution of battery capacity and chemistry market share; Section 4 illustrates the results, the estimations made for all four scenarios, containing the annual battery retirements, recyclable material masses, usable second-life capacity after recycling requirements and the distribution of the second life batteries; Section 5 presents an economic analysis that indicates the scenario with the highest revenue obtained as a result of battery cascading use and recycling, and finally, Section 6 highlights the study’s conclusions.
2. Materials and Methods
The aim of this study is to predict the usable capacity of retired EV batteries for second-life applications, after the mandatory quotas of recycled materials are fulfilled. The proposed algorithm, developed in Matlab R2025a, involves several steps, presented in Figure 2, where the methodology is explained. The proposed model considers that an EV battery sold within the European market is in one of the following states: in operation, in second life, recycled after first life or recycled after second life. Moreover, a differentiation is made between vehicle and battery lifetime. The vehicle lifetime can be regarded as the chassis lifetime, which is extracted from the EoL conditions of conventional, internal combustion engine (ICE)-powered vehicles. They do not have any special limitation regarding the lifetime of their powertrain or energy storage system. The vehicle lifetime considered in this study is based on a parametric distribution of the EoL mileage of vehicles according to the age of retirement developed by Canals Casals et al. [13].
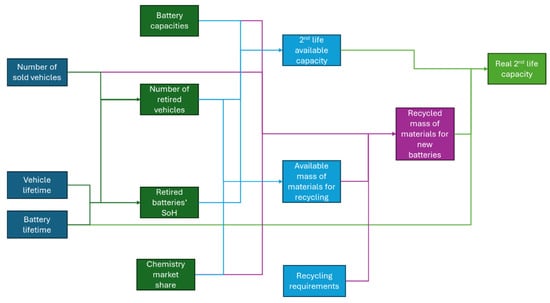
Figure 2.
The proposed methodology flowchart.
For the battery lifetime, a Deloitte report [17] is considered which proposes a dynamic lifespan model, where continuous innovation is expected to prolong the average lifetime of EV batteries. Weibull continuous distribution is adopted, for its reliability in engineering and lifetime analysis, to model time-to-failure behavior of EV batteries. Two-parameter Weibull distribution is defined by the shape parameter β, which determines how the failure rate evolves over time, defining the shape of the Probability Density Function (PDF), and the scale parameter η, representing the characteristic life of the system (the average lifespan of EV batteries). More precisely, η indicates the time at which 63.2% of the analyzed population has failed [18]. The shape parameter β is kept constant throughout the manufacturing years, with a value of 3.5. With a value higher than 1, it represents an increasing hazard (failure rate) over time, which corresponds to wear-out failures due to aging and degradation. However, the scale parameter η increases from 10 years, for batteries manufactured before 2024, to 12 years, for the ones produced between 2025–2029, and finally to 14 years for the ones from 2030 onwards.
Based on the EV’s chassis and battery limitations, the vehicle’s lifetime and retirement year are determined. The boxplot presented in Figure 3 indicates the EoL mileage of EVs based on their retirement year. As can be observed, the median mileage increases steadily in the first 9 years, followed by stagnation for the next few years and then a slow decrease. These later failures are observed among lighter EV users, where EVs reach technical or economic EoL around a similar mileage threshold, while earlier failures are likely due to manufacturing errors. Moreover, the interquartile range, illustrated by the height of the box, represents the spread of the central 50% of the data and increases with age in the first years. The outliers (red crosses) are predominantly high-mileage ones and earlier failures, which are likely due to high usage, like taxis or fleet vehicles. From this point, the annual battery retirements, number of EVs in operation and retirement rate by manufacturing year can easily be determined.
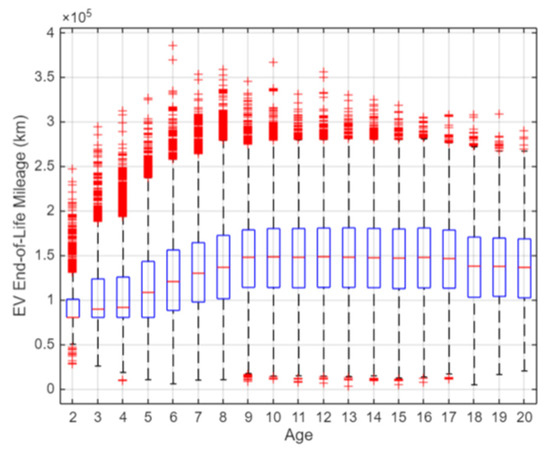
Figure 3.
Boxplot of EV End-of-Life mileage by year.
Another important parameter is retired batteries’ SoH. It influences their suitability to be reused in second life applications, like battery energy storage systems. The results regarding the SoH distribution for different retirement ages of EV batteries are extracted from the model developed by Fallah et al. [19]. They are presented in Figure 4 and show that early retirements still have a good SoH, influenced by lower median mileage, and a narrow distribution, due to short available usage time to create a meaningful impact. It is also noted that the rate of decreasing SoH slows down with age, caused by similar EoL mileage values, from the age of 9 onwards but maintains a descending trend, due to the impact of age itself on the SoH of LIBs.
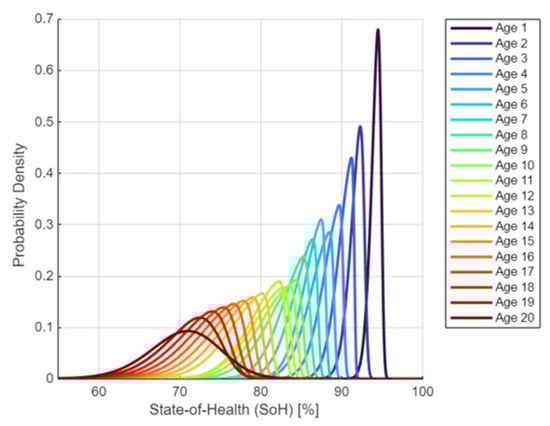
Figure 4.
SoH distribution of EV batteries with various ages of retirement.
Based on the input parameters, presented above, each entry is assigned the following data: manufacturing year, nominal capacity, chemistry, age and year of retirement, SoH at retirement, useful (real) capacity at retirement, determined as the product between the nominal capacity and the SoH at retirement.
The next step is to determine the available capacity, if all retired batteries were reused in second-life applications, and the total material mass, if all retired batteries were recycled. The first one is calculated as a sum between the remaining useful capacity of each retired battery, while the second requires some additional calculations. In this study, the batteries’ cathode materials and copper are considered. The mass composition of the cathodes is determined based on their chemical formula. Thirteen battery chemistries (listed in Table 2) are analyzed in this study, chosen from historical data and predictions regarding the market share of EV batteries [12,20,21,22,23,24,25,26]. The chemistries considered can be classified in the following way: there are seven NMC cathodes, two LFP cathodes, three additional cathodes (NCA, LMO, LCO), all of which form a group of twelve chemistries from the LIB family, and finally the sodium-ion battery (SIB) family. SIBs are an emerging chemistry in the composition of EV batteries, and for now no single cathode has emerged as the universal solution for EV batteries. Additionally, all chemistry share data still present SIBs in a general way, without any details regarding the exact cathode chemistry. In this study, from the numerous SIB cathodes Na3V2(PO4)2F3 was chosen, due to excellent thermal stability and long cycle life [27], making it a promising candidate for use in EV batteries. The battery’s mass is determined using the chemistries’ energy density [28], while the cathodes and copper’s mass content is determined based on several reports [2,29,30] that analyze the mass composition of batteries. Finally, a battery material vector is built and assigned to each entry, as presented in Table 2.
Table 2.
Mass fractions of materials for the battery chemistries considered.
The reused EV batteries have a limited lifetime in second-life applications, which, according to the model developed by Fallah et al. [19], depends on the age of the EV’s retirement. In Figure 5 the results of second lifetime distribution for different retirement ages of EV batteries is presented. As it is shown, each battery has a limited total lifetime, after which it is recycled. The recycled materials may be reused in the construction of future EV batteries, supporting the circular economy.
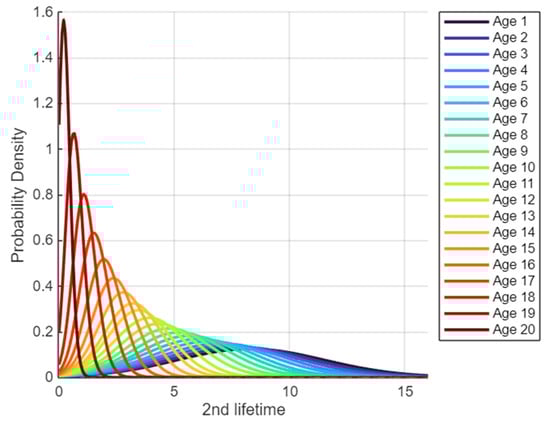
Figure 5.
Second lifetime of batteries with various ages of retirement.
This study considers a battery degradation of 2.5% per year from first life SoH during the second life [30]. All batteries that are currently in their second life are defined by current age, SoH and capacity, which are all updated after every year simulated.
The European Parliament and the Council impose, based on 2023/1542 regulation [31], minimum quotas of recycled materials that must be reused in the composition of commercialized batteries on the EU market, to promote the recycled raw materials. Therefore, every battery model must contain at least 16% Co, 6% Li and 6% Ni, starting with August 2031, and 26% Co, 12% Li and 15% Ni, starting with August 2036, from recycled resources. Thus, these raw materials need to be recovered from manufacturing or recycling the batteries at the EoL. The regulation encourages the recycling of raw materials, the reduction of dependency on other countries for procuring these materials, supporting sustainability and circular economy [32,33].
At the end of the primary life, a decision must be made between repurposing the battery for a second-life application or recycling it. Figure 6 presents a flowchart regarding the decision process, while the battery state flowchart is presented in Figure 7, where four possible states are identified for the battery: in operation, being used in the primary life, recycled after the first life, repurposed for a second-life application and recycled after the second life.
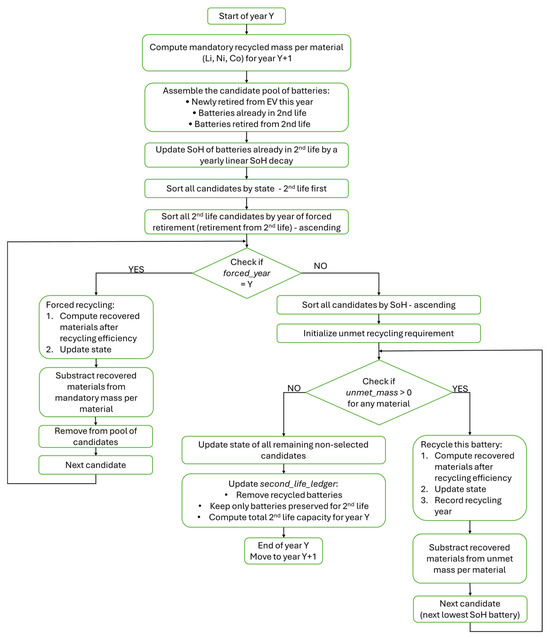
Figure 6.
Flowchart of recycling and second life decision process.
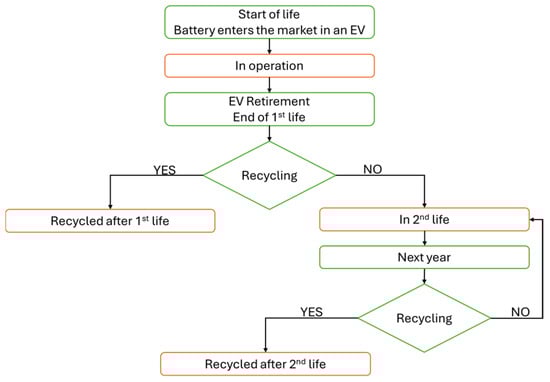
Figure 7.
Battery state flowchart.
The logic for computing the mandatory recycled content is as follows:
- Total battery demand per year is calculated [kWh/year].
- Demand is distributed across chemistries; the chemistry market share is used to allocate a capacity demand to each chemistry.
- Capacity demand is converted to mass per chemistry, using the respective energy densities.
- Battery materials vectors are applied to obtain the mass demand of each element per chemistry.
- Identical materials are summed across chemistries to get total material demand per year.
- A 1-year lag is applied; considering that the materials recycled in the year Y become available to be introduced in the manufacturing process of new batteries in the year Y + 1.
First, the batteries that are in second-life application are automatically sent to recycling at EoL. Based on the battery’s materials vector, the mass of recovered materials is computed and subtracted from the required mass, but only after applying the recycling efficiency. The used recycling efficiencies, presented in Table 3, are set in the European Batteries Regulation proposal from 2020 [34] and are also referred to in Crespo et al. [35] and several reports [36,37]. The increases in recycling efficiencies from 2030 to 2040 are adopted from Xu et al. [38].
Table 3.
Recycling efficiency evolution for the materials of interest.
Then, the vector containing the gap of required mass is initialized by being made equal to the remaining mandatory mass for each material. All remaining candidates are sorted based on their SoH, after their first life. Therefore, the lowest SoH candidate is the first one to be retired and recycled, followed by the update of the unmet mass per material. This step is repeated until the mandatory recycling mass per material for the following year (Y + 1) is met. Once the yearly mandatory recycling mass target is reached, the candidates’ status is updated following the proposed framework presented in Figure 7. The updated structure allows for the evaluation of the already existing second life batteries and the estimation of the annual storage capacity that becomes available, as well as several statistics regarding its composition (function of capacity, SoH, age, chemistry etc.). This can be of great interest when considering the compatibility of the numerous individual batteries when trying to integrate them into one single, large stationary energy storage system, as well as the upcoming challenges regarding the management of the system [13].
3. Case Study
The present study focuses on the European market only, for a time interval between 2010 and 2040. Firstly, extensive research was conducted to create a representative data set for the algorithm’s necessary inputs: number of sold vehicles, vehicle and battery lifetime, battery capacities and battery chemistry market share. The number of vehicles sold is implemented using historical data [2], followed by different scenarios regarding the future development of these values, which depend on political decisions, such as revoking the controversial wholesale ban on ICE vehicles adopted in March 2023 [39] and forcing European Union-based car makers to comply with a 90% reduction in CO2 emissions from 2035 [40], instead of the 100% previously set in EU law, and the market’s capacity to return to pre-pandemic values [41]. Four scenarios are considered, proposing two outcomes for each development:
- enforced policy (E):
- ○
- governments reinstate the 2035 ban on commercializing fossil fuel-powered ICE vehicles with binding regulations and no loopholes (e-fuels, hybrids);
- ○
- strong incentives: charging infrastructure, subsidies;
- ○
- market certainty: automakers and consumers plan around full electrification.
- diluted policy (D):
- ○
- current trend, with a softening of the 2035 ban and with loopholes that allow hybrids or alternative fuels (e-fuels, biofuels) to remain in play;
- ○
- incentives taper, infrastructure rollout slows, and consumer confidence weakens.
- strong recovery (S):
- ○
- total vehicle sales rebound close to pre-pandemic levels;
- ○
- production is scaled, supply chains stabilize, and affordability improves.
- slow recovery (W):
- ○
- vehicle sales plateau because of various geopolitical and/or economic reasons, never fully regaining pre-pandemic peaks.
Using various forecasts and predictions [2,42,43], the considered scenarios are presented in Figure 8, while Figure 9 presents the trendline of EV batteries’ average nominal capacity [2,12,13,29], which is expected to plateau at around 80 kWh [15].
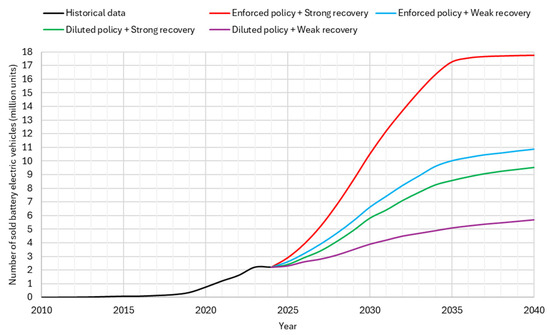
Figure 8.
Analyzed scenarios regarding the sales of battery electric vehicles.
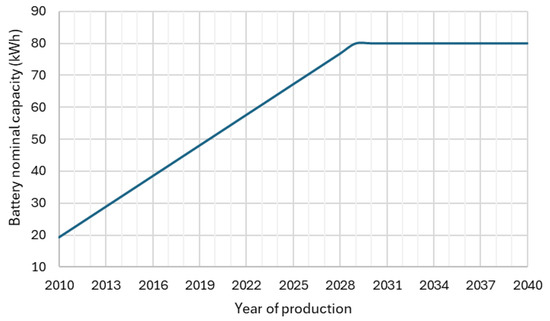
Figure 9.
Evolution of EV batteries’ average nominal capacity.
Finally, Figure 10 illustrates the EV batteries’ chemistry market share over time, which was determined using historical data [12,20,21,22,23] and predictions [12,24,25] until 2032 [26] and by a smoothing spline fit extrapolation until 2040. It can be observed that there is an increasing focus on improving the affordability of EVs by developing lower-cost chemistries, despite their lower energy density, like Na-ion batteries, or lithium iron phosphate (LFP) and its derivatives: lithium manganese iron phosphate (LMFP). Moreover, these chemistries have an increased lifetime and higher safety, which allows for the reduction of energy density handicap at a pack level by the reduction of thermal propagation measures [26], and consume fewer critical minerals, representing the key concern of EV manufacturers and European policymakers [44,45].
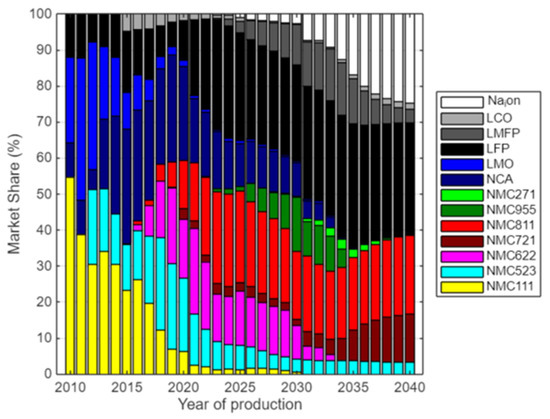
Figure 10.
Evolution of EV batteries’ chemistry market share.
Other chemistries such as lithium cobalt oxide (LCO), lithium manganese oxide (LMO) and nickel-cobalt-aluminum (NCA) are slowly exiting the market due to multiple disadvantages related to their energy density, cycle life, thermal instability or high ratio of critical raw materials. Nickel-manganese-cobalt (NMC) chemistries, due to their high energy density, are still expected to play an important role in the market. A shift can be observed from chemistries that require a higher cobalt content (NMC111, NMC523) towards higher nickel and manganese concentrations (NMC955, NMC811, NMC721) [26,46].
4. Results and Discussion
The scenarios considered influence the number of retired vehicles, as presented in Figure 11, as well as the number of EVs on the road. The prediction of retired EVs, in the four scenarios, for 2040 are the following: for the scenario Enforced + Strong (ES) 8.62 million units, for Enforced + Weak (EW) around 5.36 million, for Diluted + Strong about 4.64 million and for Diluted + Weak (DW) 3.18 million.
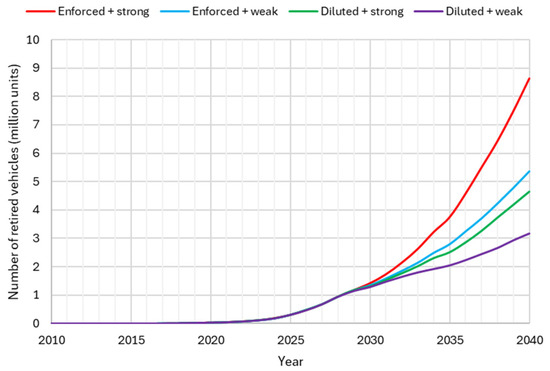
Figure 11.
Evolution of the number of retired EVs.
The cumulated second-life capacity is presented in Figure 12 and is determined as the sum of the retired batteries each year multiplied by their corresponding SoH at retirement. These are the theoretical values if all batteries enter second life with no degradation. These results underline the importance of adopting electric mobility early, since the delay propagates in the second life availability and, therefore, hinders the capacity to store the energy surplus produced by renewable sources.
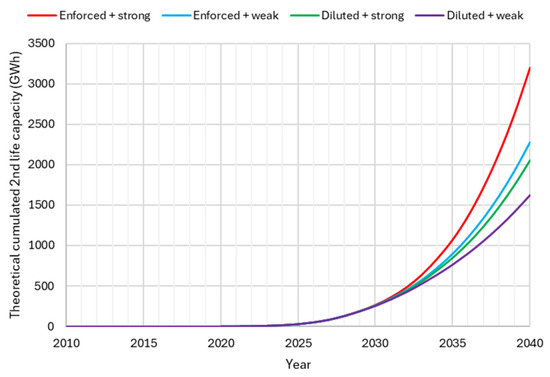
Figure 12.
Cumulated second life capacity.
Figure 13 presents the lifecycle fate of retired batteries and the recovered material mass that are mandatory to be recycled (Li, Ni, Co). As can be observed, there is a sudden increase in the recovered mass for 2030 and 2035, representing the one-year lag before the two-step mandatory recycled material quotas, used in the newly manufactured batteries. The ES scenario, defined by a large pool of candidates that are healthier and have a high capacity, is the only one that surpasses the 100 ± 5 kt interval, being significantly higher than all the other policies, at an estimation close to 180 kt of recovered mass by 2040. This implies that the recycling facilities need to be scaled up by approximately 80%, to address the growing demand for recycling. A large pool of candidates offers greater flexibility in the choice of the batteries to be sent for recycling, allowing additional criteria, such as chemistry, materials and related costs, opening the possibility to more homogeneous, easier to manage and therefore more efficient energy storage systems, as second-life applications. Regarding the fate of retired batteries, it can be noticed that the two diluted policies (DS and DW) have a larger number of forced recycling, which means that the batteries present an accelerated degradation.
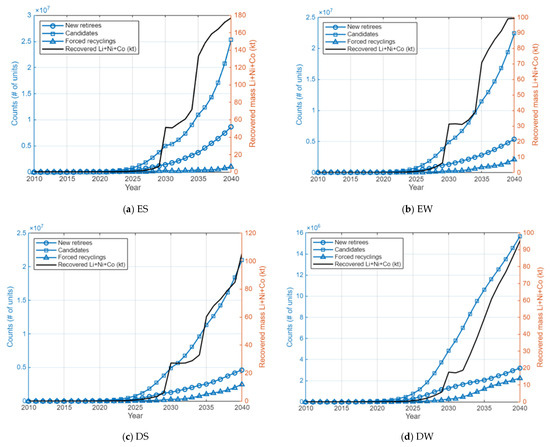
Figure 13.
Lifecycle of retired batteries in: (a) ES; (b) EW; (c) DS; (d) DW scenarios.
The annual mass material of retired batteries is illustrated in Figure 14. The recorded differences are significant, with a total retired mass of 1193 kt for the ES, 742 kt for the EW, 641 kt for the DS and 437 kt for the DW policy. However, despite the large mass differences, the share of materials is the same for all policies, given that they differ only by quantity. The results obtained with the ES policy are in good accord with the values reported in [36] for 2030, where the recycling availability is predicted at 45 kt for nickel, 8 kt for cobalt and 14 kt for manganese. The results correspond for manganese for 2035 as well, while in the case of nickel, the report places the availability between the present study’s ES and EW scenarios. The total cathode materials available for recycling from the DS policy are in good accordance with the projected results in [17].
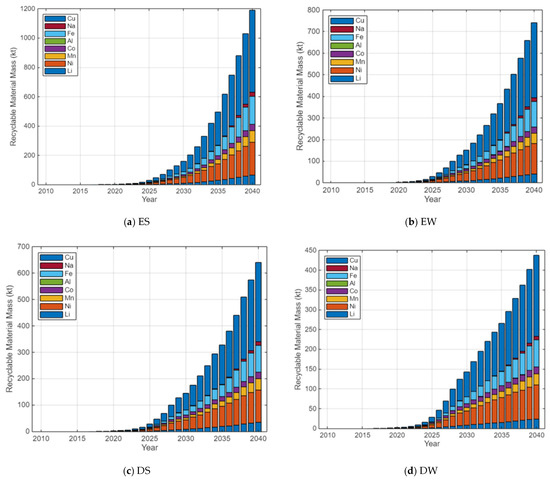
Figure 14.
Annual potentially recyclable material mass by element in: (a) ES; (b) EW; (c) DS; (d) DW scenarios.
Copper is the most present metal of all, with a cumulated share of over 45%. It is easy and profitable to recycle outside battery-specific recycling processes as well, so despite its heavy presence in anode current collectors, busbars and cabling, it is not considered critical material. The critical materials are the ones that have mandatory quotas in the manufacturing of the new batteries. One of these is cobalt, with a cumulated share of 5.3%, being the primary economic driver due to its high market value, which is also one of the reasons for the shift within the NMC chemistries to ones that have a lower cobalt content.
Another critical material is Ni and has the highest cumulated share of the three critical materials, with 22.6%. It has an increasing importance, given the fact that future chemistries, with higher nickel ratios, are expected to become dominant, at least within the NMC cathodes. Lithium has a cumulated share of 5.8% and has great relevance in the EU market. Although it had, historically, a very low recovery rate, it is now improving, and it is estimated that it will have a 90% rate in the future.
The next most important material would be aluminum. With the decrease in NCA chemistries’ market share, which are the ones containing Al, the recovery potential is very limited. Iron is found in LFP cathodes, expected to maintain a market share of 20–25% in the future, as well as in cases and structural parts. It can easily be recovered in large quantities, with an expected cumulated material share of 13.8%, based on the model. Finally, manganese is easy to recover but economically weak, and sodium is technically complex and unnecessary given its low economic value.
Figure 15 illustrates the required recycled content considering the EU regulation-imposed mandatory quotas. Despite the continuous increase in vehicle sales in all four scenarios, the required total mass has small drops in 2034 and 2035. These fluctuations can be attributed to the highest predicted market share of Na-ion and LFP chemistries. With the recovery of the NMC chemistries’ market share starting with 2036, the required recycled content is also progressively increasing up until the last considered year. The average increase in total recycled mass between the two mandatory steps is 150%, which is higher than the average percentage increase between the two steps, meaning that, despite market share shifts, the total number of vehicles sold is the main driving factor for these quantities.
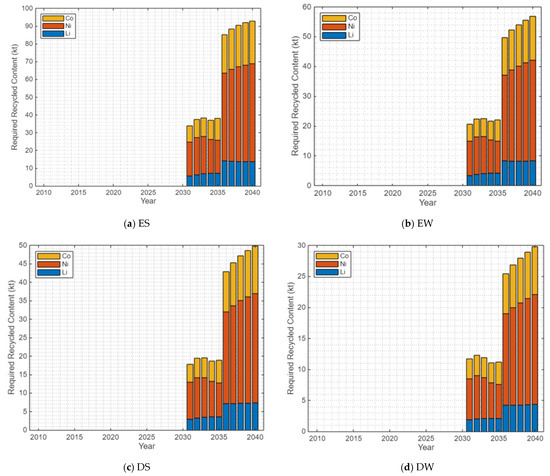
Figure 15.
Mandatory recycled content in new batteries per EU Regulation in: (a) ES; (b) EW; (c) DS; (d) DW scenarios.
The annual gap between the required and recovered mandatory materials is presented in Figure 16. It can be observed that the limiting factor is cobalt, by having the smallest gap, because more batteries are recycled, until the mandatory mass of cobalt is met. This also increases the recycled quantity of Ni and Li, being nearly double as the required mass in the ES, EW and DS policies. The fact that Co is the limiting factor also explains the reason for the highest mandatory percentage quotas. There are still relatively many high-cobalt batteries that become available for recycling, especially due to the high market share of NMC111, 523 and 622 that have their first EoL when the mandatory quotas are imposed. However, with the replacement of these cobalt-rich chemistries with other formulas, there will be less of this critical material in the pool of candidates for recycling. Depending on the future market share, the balance between available and required Co must be maintained. Thus, to reduce the number of batteries that get recycled, instead of staying longer in their second life, additional criteria (besides the SoH value proposed in this study) should be considered when choosing which batteries are sent for recycling.
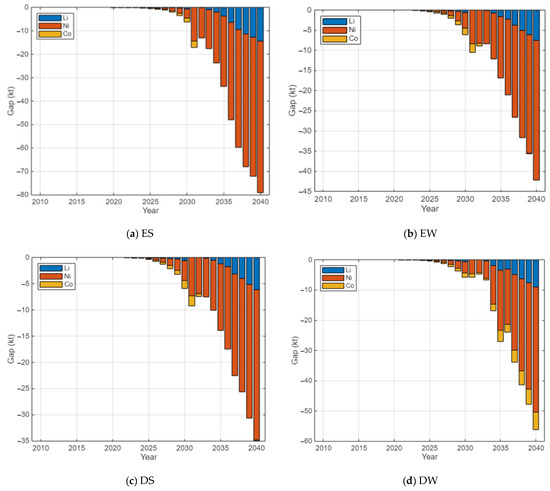
Figure 16.
Annual gap between required and recovered mandatory materials in: (a) ES; (b) EW; (c) DS; (d) DW scenarios.
The annual gap behavior in the DW policy case differs from the other three, where all critical materials have negative gaps between the required and actual recovered mass. This means that the recycling system is producing more than the EU regulation demands, because of the large number of forced battery recycling, including batteries that have reached the end of their second life, offering greater stability and predictability in the waste management system.
Figure 17 illustrates the usable second-life capacity, after the mandatory recycling requirements are met. It can be observed that there are no notable differences for usable second-life capacity between the four policies until 2029, despite the fact that the number of vehicles sold differs. It is attributed to the first batteries, with life potential, that are recycled to meet the EU regulation starting 2030. Given the considerably higher recycling demand, the ES policy’s usable second-life capacity suffers a significant reduction in its growth rate the year before both recycling steps, offering the lowest capacity. After each transition year, it exhibits rapid growth and finally becomes the policy with the greatest usable second-life capacity, starting with 2039.
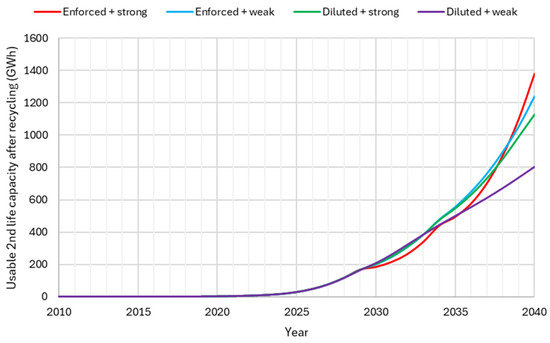
Figure 17.
Usable second life capacity after recycling requirements.
The EW and DS policies have very similar behaviors, with negligible differences until 2036, when the EW starts to gain some ground. Surprisingly, the DW scenario offers the highest capacity for the battery energy storage systems between 2030 and 2032, that seems somehow unaffected by the EU regulation, which can have some advantages, albeit yielding in the end the lowest capacity for energy storage systems.
The yearly batteries’ fate distribution is presented in Figure 18, for each considered scenario. For each fate, the ES policy creates significantly different outcomes compared to the other three:
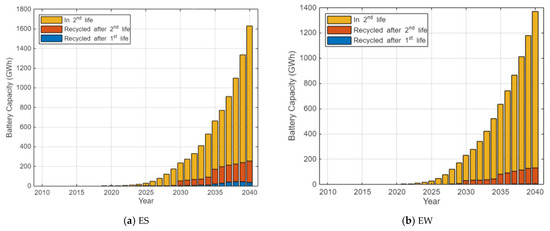
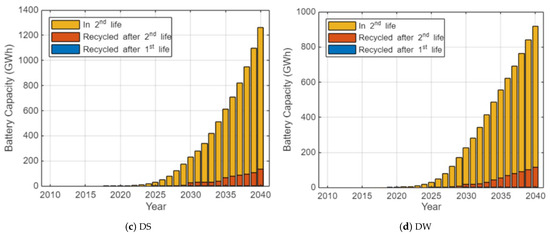
Figure 18.
Annual battery retirement allocations by fate in: (a) ES; (b) EW; (c) DS; (d) DW scenarios.
- 2.94% of the batteries are recycled after their first life, while for the other policies this value is under 0.4%;
- 16.83% of the batteries are recycled after their second life, while for the other policies this value is between 10% and 10.8%;
- 80.23% of the batteries are still in their second life by 2040, while for the other policies this value is between 88.8% and 89.3%.
The last figures, Figure 19, Figure 20, Figure 21 and Figure 22, show the annual distribution of the active second-life batteries as a function of their useful capacity, current SoH, age and chemistry. Regarding their capacity, it can be observed that in the ES scenario most of the batteries have a capacity of 60–70 kWh, while after 2036 there are no batteries with a capacity below 50 kWh. It is also noted that after each transition year, batteries with lower capacity are recycled, leaving the ones with a higher SoH and capacity being used in battery energy storage systems. At the other end, the DW scenario is the only one in which batteries below 40 kWh would still be present in 2040. The upside of this scenario is the better use of the full potential of batteries, which equals the improvement of their life cycle assessment and decreasing CO2 emissions per battery. Additionally, the related costs are also lower, requiring fewer replacements within the operating energy storage systems.
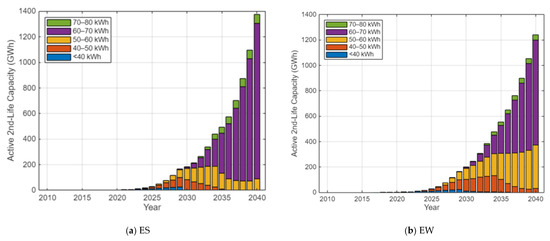
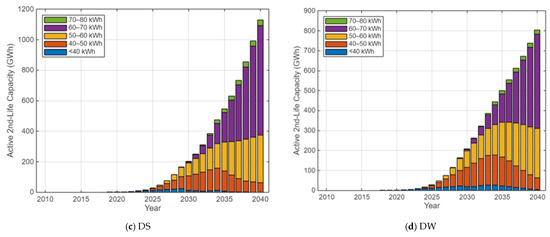
Figure 19.
Usable second life capacity by batteries’ capacity in: (a) ES; (b) EW; (c) DS; (d) DW scenarios.
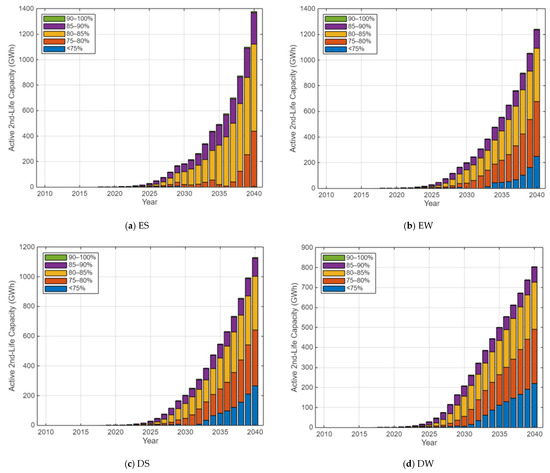
Figure 20.
Usable second life capacity by batteries’ SoH in: (a) ES; (b) EW; (c) DS; (d) DW scenarios.
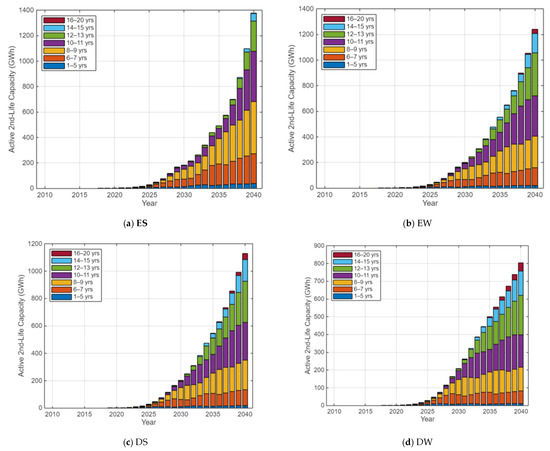
Figure 21.
Usable second life capacity by batteries’ age in: (a) ES; (b) EW; (c) DS; (d) DW scenarios.
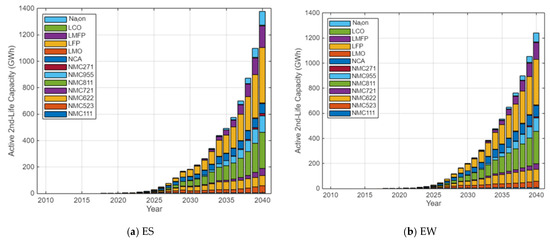
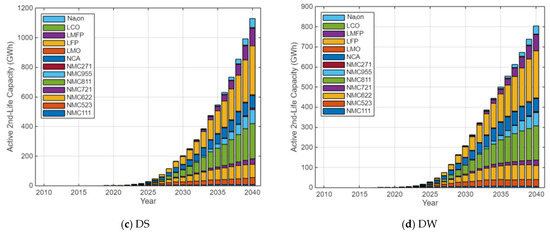
Figure 22.
Usable second life capacity by batteries’ chemistry in: (a) ES; (b) EW; (c) DS; (d) DW scenarios.
Regarding the SoH values, it is noted that most retired EV batteries, active in their second life, are still in a relatively good condition, most of them having an SoH above 75%, and above 80%. This means that these batteries are technologically suitable for second-life applications.
Despite the advantages of repurposing the retired EV batteries, second life businesses face other challenges, like different operating conditions than the ones they were designed for, which require considering complex technical aspects, the adaptation of communication protocols, assuring adequate thermal management, and connecting batteries with significant SoH gradients. Solving these battery management issues implies high installation costs, that grow with the heterogeneity of the batteries and with the frequency of removing/adding batteries to an already operational static energy storage system.
Finally, Figure 22 presents the chemistry share evolution in the four considered scenarios. As it is shown, the second life chemistry distributions are identical. The iron-based and high-nickel content NMC chemistries are expected to be predominant in the mix of battery energy storage systems, especially from 2035 onwards, with a surging presence of Na-ion batteries towards 2040.
5. Economic Analysis
The economic benefits of retired EV batteries depend on the remaining usable capacity at EoL and the price of the materials that can be recovered by recycling the battery. The price depends on the scarcity of the material, the complexity of its extraction and its recycling process. Moreover, supply chain disruptions caused by geopolitical situations, natural disasters and epidemics may influence the material prices [47].
Due to material price fluctuations, this study estimates the total benefits [$] of recycling the EV batteries in the timeframe 2025–2030 for the analyzed scenarios: ES, EW, DS and DW. The total benefits are calculated as a sum between the cascading benefits, for the retired EV batteries that are reused in second-life applications [48], and the recycling value. The cascading benefits of repurposing EV batteries consider the remaining usable capacity at the end of the first life and the unit revenue of 85.41 $/kWh for the analyzed period [49]. The recycling value is based on the usable capacity remaining at the end of second life and has different values, depending on the battery chemistry. For LCO, LFP, LMFP and LMO chemistries the unit revenue is 21.93 $/kWh, and for NCA, NMC111, NMC271, NMC523, NMC622, NMC721, NMC811 and NMC955 the unit revenue is 37.91 $/kWh, while for Na-ion chemistry the unit revenue is considered 0 $/kWh [50].
The results obtained, presented in Figure 23, show that the scenario with the highest revenues for the analyzed period is ES, with a predicted value of over 62 million $, underlying the importance of government incentives and support for the full electrification of the transportation infrastructure in order to increase EV sales to pre-pandemic levels. If EV sales recover slowly (scenario EW), due to geopolitical and/or economic influences, the total benefits reach approximately 35 million $ in 2030.
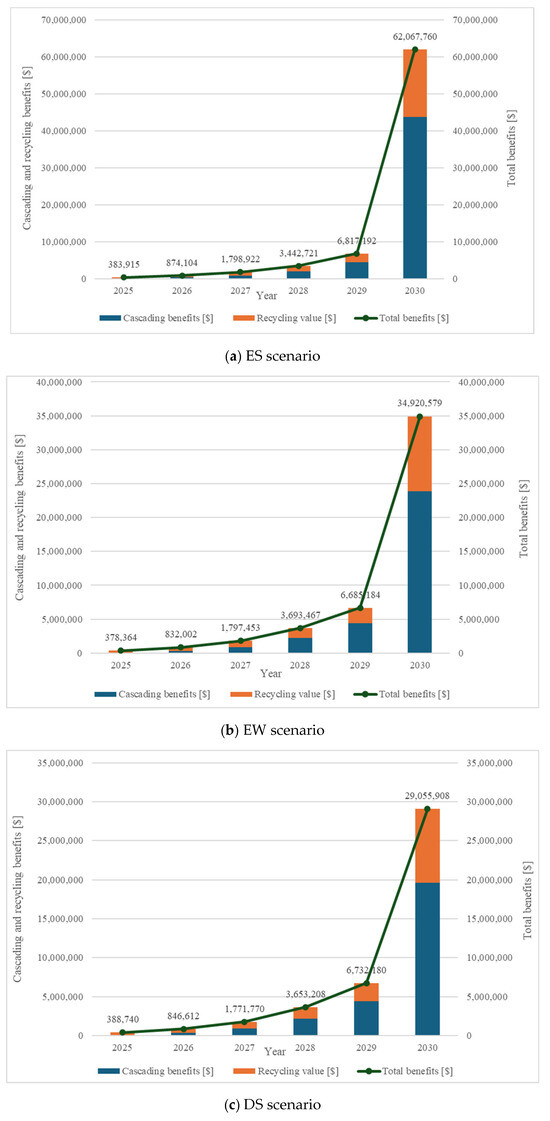
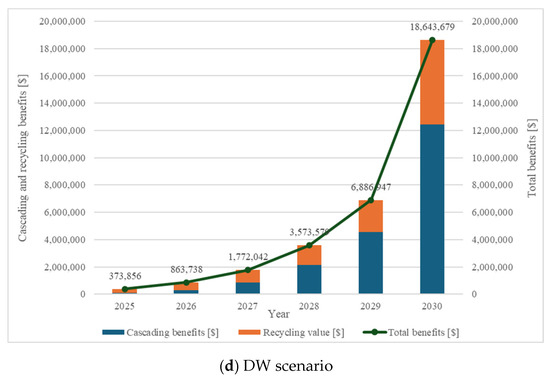
Figure 23.
The cascading, recycling and total benefits of retired EV batteries for scenarios: (a) ES, (b) EW, (c) DS, (d) DW.
The diluted policy scenarios, regarding the softening of the ICE vehicle ban in 2035 and the government incentives taper, reflect lower revenue values in both cases. A strong recovery of EV sales to pre pandemic levels involves total benefits of around 29 million $ in 2030 (scenario DS), while a slow EV sales recovery decreases the revenue to approximately 18.6 million $ (scenario DW).
The decision to repurpose retired EV batteries depends not only on the technical parameters but also on the revenue obtained from reusing them in second-life applications and then recycling them. The revenue may directly vary depending on the usable second-life capacity and the material price, but it is also influenced by government policies and incentives and EV market volatility.
6. Conclusions
This paper proposes an algorithm developed in Matlab that predicts the usable capacity of retired EV batteries for second-life applications, more specifically for integration in battery energy storage systems, used to store the energy surplus produced by renewable energy sources. Based on the number of EVs sold, battery capacity, chemistry market share, battery lifetime (both in primary and second life) and battery SoH and degradation, four scenarios are considered: enforced policy with strong/weak recovery of EV sales and diluted policy with strong/weak recovery of EV sales. All scenarios are required to comply with EU regulations regarding the mandatory recycled critical material quotas, that support the sustainability and circular economy of the EU.
The results demonstrate that the mandatory recycling shares strongly impact the dynamics of second-life applications. Scaling up the recycling industry in Europe for EV batteries is critical, and, at the same time, the performed simulations show that the current quotas would not sacrifice the currently emerging repurposing market, with an estimated maximum of 20% of all batteries that would need to be sent for recycling instead of serving in a second-life application. Therefore, the authors state that the current EU policies do support a two-loop system when it comes to retired EV batteries and ensure that both repurposing and recycling contribute to a sustainable European battery industry.
Favoring the repurposing of batteries could be attained by mandatory shares of second life batteries for the stationary energy storage market, or by financially incentivizing manufacturers to adopt two-loop systems in the batteries’ life cycle. The results also show that reducing the reliance on cobalt could significantly reduce the number of batteries that need to be recycled to meet the regulation-imposed mandatory shares. Therefore, the development in new chemistries could also promote the repurposing of batteries and lead to an increase in second life usable capacity.
There is also a scenario where with the current chemistry mix cobalt would not become a limiting factor, which is the one with the lowest EV sales considered. In such a case, because of the natural second EoL of batteries, the recycled materials would become higher than the mandatory content. This scenario allows the full lifetime potential of batteries to be exploited, improving their life cycle greenhouse gas equivalent emissions removal and offering better stability and predictability for energy storage system businesses that use such batteries. On the other hand, higher EV sales would offer more homogeneous energy storage systems, made of healthier and newer batteries, but would require more frequent changes within the system, leading to higher operational and battery management costs.
This study, through its dynamic simulation model, contributes to discussion on finding the balance between recycling requirements and second life energy storage capacities and offers relevant quantitative information for businesses entering the recycling or repurposing market. The main findings show predictions for 2040 between 430 and 1200 kt of available recyclable materials, between 95 and 180 kt of recovered critical material (Li + Ni + Co), and between 800 and 1400 GWh of usable second life storage capacity. The economic analysis revealed that the total revenues, which consider cascade and recycling benefits, vary depending on the usable second-life capacity and the material price, but it is also influenced by government policies, incentives and EV market volatility. Additionally, the results can help policymakers better understand the possible outcomes of the existing and possible future regulations.
The study’s limitations provide further development perspectives, such as considering different lifetimes for the analyzed chemistry, applying distributions for the annual capacity, adding to the dynamic model an environmental and financial perspective or considering novel battery technologies, such as solid-state batteries.
Author Contributions
Conceptualization, T.I.C.B., M.C. and C.C.; methodology, T.I.C.B. and C.C.; software, T.I.C.B.; validation, T.I.C.B., M.C. and C.C.; formal analysis, T.I.C.B. and C.C.; investigation, T.I.C.B., M.C. and C.C.; resources, T.I.C.B., M.C. and C.C.; data curation, T.I.C.B. and C.C.; writing—original draft preparation, T.I.C.B. and C.C.; writing—review and editing, M.C.; visualization, M.C.; supervision, M.C.; project administration, M.C.; funding acquisition, M.C. All authors have read and agreed to the published version of the manuscript.
Funding
This research was funded by Academy of Romanian Scientists, grant number: 413/15.03.2025 Modeling and optimal sizing of solar energy storage systems through the sustainable integration of electric vehicle batteries using artificial intelligence techniques.
Data Availability Statement
The data presented in this study is available upon request from the corresponding author.
Conflicts of Interest
The authors declare no conflicts of interest.
References
- United Nations Economic Commission for Europe. The United Nations Economic Commission for Europe Crises Are Further Slowing Sustainable Development in Europe, North America and Central Asia, Warns UNECE Report; United Nations Economic Commission for Europe: Geneva, Switzerland, 2024. [Google Scholar]
- Global, E.V. Outlook 2025 Expanding Sales in Diverse Markets. International Energy Agency. 2025. Available online: https://www.iea.org/reports/global-ev-outlook-2025 (accessed on 25 November 2025).
- Neves, S.A.; Marques, A.C. What Has Driven the Adoption of BEV and PHEV in the EU? Res. Transp. Bus. Manag. 2025, 60, 101331. [Google Scholar] [CrossRef]
- Neigum, K.; Wang, Z. Technology, Economic, and Environmental Analysis of Second-Life Batteries as Stationary Energy Storage: A Review. J. Energy Storage 2024, 103, 114393. [Google Scholar] [CrossRef]
- Etxandi-Santolaya, M.; Canals Casals, L.; Montes, T.; Corchero, C. Are Electric Vehicle Batteries Being Underused? A Review of Current Practices and Sources of Circularity. J. Envrion. Manag. 2023, 338, 117814. [Google Scholar] [CrossRef] [PubMed]
- Li, Z.; Qu, Z.; Jiang, Z.; Huang, H.; Tao, W. Degradation Mechanism of Lithium-Ion Battery under Appropriate in-Plane Temperature Gradient. Green Energy Intell. Transp. 2025, 4, 100352. [Google Scholar] [CrossRef]
- Yang, S.; Zhang, R.; Ma, Y.; Zuo, X. Adaptive Large Neighborhood Search Incorporating Mixed-Integer Linear Programming for Electric Vehicle Routing Problem with Mobile Charging and Nonlinear Battery Degradation. Appl. Soft. Comput. 2025, 175, 112988. [Google Scholar] [CrossRef]
- Altawabeyeh, S.; Abutayeh, H.; Hijazi, K.; Daoud, H. Techno-Economic Feasibility of Repurposing Retired Electric Vehicle Batteries in Residential off-Grid Photovoltaic Systems. Renew. Energy Focus 2025, 54, 100717. [Google Scholar] [CrossRef]
- Zhou, L.; Jin, X.; E, C.; Wang, Z.; Liu, J. Thermal behavior and failure mechanisms of lithium-ion battery under high discharging rate. Appl. Therm. Eng. 2025, 278, 127043. [Google Scholar] [CrossRef]
- Liu, J.; Jin, X.; Zhang, H.; Zhao, K.; Wang, Z. Thermal runaway and combustion of LiFeO4 lithium-ion battery induced by electric-thermal coupling abuse. J. Energy Storage 2026, 141, 119271. [Google Scholar] [CrossRef]
- Ambrose, H.; Gershenson, D.; Gershenson, A.; Kammen, D. Driving Rural Energy Access: A Second-Life Application for Electric-Vehicle Batteries. Environ. Res. Lett. 2014, 9, 094004. [Google Scholar] [CrossRef]
- Kastanaki, E.; Giannis, A. Dynamic Estimation of End-of-Life Electric Vehicle Batteries in the EU-27 Considering Reuse, Remanufacturing and Recycling Options. J. Clean. Prod. 2023, 393, 136349. [Google Scholar] [CrossRef]
- Canals Casals, L.; Etxandi-Santolaya, M.; Bibiloni-Mulet, P.A.; Corchero, C.; Trilla, L. Electric Vehicle Battery Health Expected at End of Life in the Upcoming Years Based on UK Data. Batteries 2022, 8, 164. [Google Scholar] [CrossRef]
- Liu, B.; Han, J.; Liang, X. Assessment of the Potential of Retired New Energy Vehicle Batteries for Renewable Energy Storage in China Based on CNN-BiLSTM. Sustain. Energy Technol. Assess. 2025, 83, 104637. [Google Scholar] [CrossRef]
- Kampker, A.; Heimes, H.H.; Offermanns, C.; Frank, M.; Klohs, D.; Nguyen, K. Prediction of Battery Return Volumes for 3R: Remanufacturing, Reuse, and Recycling. Energies 2023, 16, 6873. [Google Scholar] [CrossRef]
- Seika, J.; Kubli, M. Repurpose or Recycle? Simulating End-of-Life Scenarios for Electric Vehicle Batteries under the EU Battery Regulation. Sustain. Prod. Consum. 2024, 51, 644–656. [Google Scholar] [CrossRef]
- Global Battery Alliance Members. Navigating the Unknowns: Drivers and Projections for EV Battery Recycling; Deloitte: Sydney, Australia, 2024. [Google Scholar]
- Timilsina, L.; Badr, P.R.; Hoang, P.H.; Ozkan, G.; Papari, B.; Edrington, C.S. Battery Degradation in Electric and Hybrid Electric Vehicles: A Survey Study. IEEE Access 2023, 11, 42431–42462. [Google Scholar] [CrossRef]
- Fallah, N.; Fitzpatrick, C. Exploring the State of Health of Electric Vehicle Batteries at End of Use; Hierarchical Waste Flow Analysis to Determine the Recycling and Reuse Potential. J. Remanufacturing 2024, 14, 155–168. [Google Scholar] [CrossRef]
- Dunn, J.; Slattery, M.; Kendall, A.; Ambrose, H.; Shen, S. Circularity of Lithium-Ion Battery Materials in Electric Vehicles. Environ. Sci. Technol. 2021, 55, 5189–5198. [Google Scholar] [CrossRef]
- Takahashi, M. Plug-in Hybrid and Battery Electric Cars 2025–2045: Technologies, Players, Regulations, Market Forecasts. IDTechEx Reports. 2024. Available online: https://www.idtechex.com (accessed on 30 November 2025).
- Ragonnaud, G. Powering the EU’s Future: Strengthening the EU Battery Industry. European Parliament. 2025. Available online: https://www.europarl.europa.eu (accessed on 2 December 2025).
- Global, E.V. Outlook 2024. International Energy Agency. 2024. Available online: https://www.iea.org/reports/global-ev-outlook-2024 (accessed on 25 November 2025).
- IRENA. Critical Materials: Batteries for Electric Vehicles; International Renewable Energy Agency: Abu Dhabi, United Arab Emirates, 2024; Available online: https://www.irena.org (accessed on 4 November 2025).
- Bolech, M.; Rossi, M.; Van Berkum, S. Battery Composition. Project: Green Transport Delta—Electrification. 2023. Available online: https://www.tno.nl/nl (accessed on 13 December 2025).
- Bernhart, W.; Chan, I.; Hotz, T.; Gordon, K. Battery Monitor 2024/2025: A Turbulent Year and Outlook for Value Chain Players. Roland Berger. 2025. Available online: https://www.rolandberger.com (accessed on 13 December 2025).
- Yang, Y.; Xu, G.-R.; Tang, A.-P.; Zheng, J.-C.; Tang, L.-B.; Huang, Y.-D.; Chen, H.-Z. Na3V2(PO4)3-decorated Na3V2(PO4)2F3 as a high-rate and cycle-stable cathode material for sodium ion batteries. RSC Adv. 2024, 14, 11862. [Google Scholar] [CrossRef]
- Murdock, B.E.; Toghill, K.E.; Tapia-Ruiz, N. A Perspective on the Sustainability of Cathode Materials Used in Lithium-Ion Batteries. Adv. Energy Mater. 2021, 11, 2102028. [Google Scholar] [CrossRef]
- Unlocking the Value of the EU Battery Passport, Battery Pass. 2024. Available online: https://thebatterypass.eu (accessed on 25 November 2025).
- Raugei, M.; Brannigan, C.; Appan, A.; Sheehan, C.; Kilstein, A.; Long, F.; Eyton, E.; Mullin, D. Research on Environmental Sustainability and Energy Efficiency of Electric Vehicles; Ricardo Energy & Environment: Didcot, UK, 2024. [Google Scholar]
- European Parliament and of the Council. Regulation (EU) 2023/1542 Concerning Batteries and Waste Batteries; European Parliament and of the Council: Strasbourg, France, 2023. [Google Scholar]
- Farmer, A.; Watkins, E. Managing Waste Batteries from Electric Vehicles: The Case of the European Union and Japan, Report; Institute for European Environmental Policy: London, UK, 2023. [Google Scholar]
- Moise, E.; Rubinova, S. Trade policies to promote the circular economy: A case study of lithium-ion batteries. In OECD Trade and Environment Working Papers; OECD: Paris, France, 2023. [Google Scholar] [CrossRef]
- European Union. Proposal for a Regulation of the European Parliament and of the Council on Markets in Crypto-Assets; European Commission: Brussels, Belgium, 2020. [Google Scholar]
- Sanclemente Crespo, M.; Van Ginkel González, M.; Talens Peiró, L. Prospects on End of Life Electric Vehicle Batteries through 2050 in Catalonia. Resour. Conserv. Recycl. 2022, 180, 106133. [Google Scholar] [CrossRef]
- Racu, A.; Poliscanova, J. An Industrial Blueprint for Batteries in Europe. Report. Transport & Environment. 2024. Available online: https://www.transportenvironment.org (accessed on 28 November 2025).
- Giljum, S.; Maus, V.; Kreimel, J.; Weber, L.; Kroiss, A. Driving Change, Not Deforestation: How Europe Could Mitigate the Negative Impacts of Its Transport Transition; Institute for Ecological Economics WU Vienna University of Economics and Business: Vienna, Austria, 2024. [Google Scholar]
- Xu, C.; Dai, Q.; Gaines, L.; Hu, M.; Tukker, A.; Steubing, B. Future Material Demand for Automotive Lithium-Based Batteries. Commun Mater 2020, 1, 99. [Google Scholar] [CrossRef]
- European Parliament. EU Ban on the Sale of New Petrol and Diesel Cars from 2035 Explained. 2022. Available online: https://www.europarl.europa.eu (accessed on 29 November 2025).
- Pacheco, M. EU Carmakers to Comply with 90% Emissions Reduction by 2035 as Full Combustion Engine Ban Scrapped. Europe News. 2025. Available online: https://www.euronews.com/my-europe/2025/12/16/eu-carmakers-to-comply-with-90-emissions-reduction-by-2035-as-full-combustion-engine-ban-s (accessed on 30 November 2025).
- European Automobile Manufacturers’ Association. Passenger Car Registrations in Europe 1990–2021, by Country. 2022. Available online: https://www.acea.auto (accessed on 30 November 2025).
- Bekker, H. 2025 (Outlook) Global: Worldwide Car Sales Forecast. Car Sales Statistics. 2025. Available online: https://www.best-selling-cars.com/global/2025-outlook-global-worldwide-car-sales-forecast/ (accessed on 30 November 2025).
- Bekker, H. 2025 (Outlook) Europe: Car and Electric Car Sales Forecasts. Car Sales Statistics. 2025. Available online: https://www.best-selling-cars.com/europe/2025-outlook-europe-car-and-electric-car-sales-forecasts/ (accessed on 30 November 2025).
- Climate Risks to EU Commodity Supplies. PwC. 2024. Available online: https://www.pwc.com/gx/en/about.html (accessed on 14 December 2025).
- Hove, A. 2025 EVs and Battery Supply Chains Issues and Impacts—Issue 144. The Oxford Institute for Energy Studies. 2025. Available online: https://www.oxfordenergy.org (accessed on 14 December 2025).
- Efanova, D.; Kuszak, V. Electric Vehicles & Battery Materials-Supply Chain Analysis; Sucden Financial Limited: London, UK, 2024. [Google Scholar]
- Li, J.; Li, H.; Jiao, J.; Xu, Y. Which Policy Can Effectively Alleviate the Impact of Raw Material Price Fluctuations on Battery Recycling? Envrion. Impact Assess. Rev. 2025, 115, 107996. [Google Scholar] [CrossRef]
- Ahmadi, L.; Young, S.B.; Fowler, M.; Fraser, R.A.; Achachlouei, M.A. A Cascaded Life Cycle: Reuse of Electric Vehicle Lithium-Ion Battery Packs in Energy Storage Systems. Int. J. Life Cycle Assess. 2017, 22, 111–124. [Google Scholar] [CrossRef]
- Li, X.; Du, J.; Liu, P.; Yue, X.; Ji, X.; Song, C.; Ma, C. Reverse Channel Choice for Retired Electric Vehicle Batteries under a Deposit Refund System. Comput. Ind. Eng. 2026, 212, 111685. [Google Scholar] [CrossRef]
- Kronemeyer, N.; Wu, X.; Leker, J. Profitability and Carbon Footprint of Battery Recycling and the Potential Impact on Battery Cost: A Structured Machine-Learning Based Review. Renew. Sustain. Energy Rev. 2026, 226, 116182. [Google Scholar] [CrossRef]


Disclaimer/Publisher’s Note: The statements, opinions and data contained in all publications are solely those of the individual author(s) and contributor(s) and not of MDPI and/or the editor(s). MDPI and/or the editor(s) disclaim responsibility for any injury to people or property resulting from any ideas, methods, instructions or products referred to in the content. |
© 2026 by the authors. Licensee MDPI, Basel, Switzerland. This article is an open access article distributed under the terms and conditions of the Creative Commons Attribution (CC BY) license.