Abstract
This paper introduces a novel approach to hand motion gesture recognition by integrating the Fourier transform with hypergraph convolutional networks (HGCNs). Traditional recognition methods often struggle to capture the complex spatiotemporal dynamics of hand gestures. HGCNs, which are capable of modeling intricate relationships among joints, are enhanced by Fourier transform to analyze gesture features in the frequency domain. A hypergraph is constructed to represent the interdependencies among hand joints, allowing for dynamic adjustments based on joint movements. Hypergraph convolution is applied to update node features, while the Fourier transform facilitates frequency-domain analysis. The T-Module, a multiscale temporal convolution module, aggregates features from multiple frames to capture gesture dynamics across different time scales. Experiments on the dynamic hypergraph (DHG14/28) and shape retrieval contest (SHREC’17) datasets demonstrate the effectiveness of the proposed method, achieving accuracies of 96.4% and 97.6%, respectively, and outperforming traditional gesture recognition algorithms. Ablation studies further validate the contributions of each component in enhancing recognition performance.
1. Introduction
Hand gesture recognition has become a pivotal technology in healthcare, enabling intuitive control of assistive devices, precise rehabilitation monitoring, sterile surgical interfaces, and enhanced patient communication [1,2]. By interpreting hand movements, it facilitates non-intrusive interactions, improving accessibility and efficiency in medical settings. Beyond healthcare, hand gesture recognition plays a crucial role in human–computer interaction (HCI), behavior analysis, and immersive technologies. In HCI, it allows users to interact with systems through natural gestures, eliminating the need for physical controllers [3,4,5]. This technology is also instrumental in virtual and augmented reality applications, where it enables realistic manipulation of virtual objects and environments [6,7]. Additionally, in behavior analysis, hand gestures serve as non-verbal cues that can be analyzed to understand human intentions and emotions.
In recent times, significant progress has enabled the easy collection of multimodal data for hand gesture recognition, including RGB images [8,9], depth maps [10], and skeleton sequences [11]. Devineau et al. were pioneers in directly applying a convolutional neural network (CNN) to skeleton joint sequences for feature extraction [12]. However, since skeletons inherently form non-Euclidean graphs, graph convolutional networks (GCNs) have emerged as a focused approach to capture their spatial–structural patterns [7]. Consequently, GCN-based frameworks have become the predominant choice for achieving accurate, real-time hand gesture recognition.
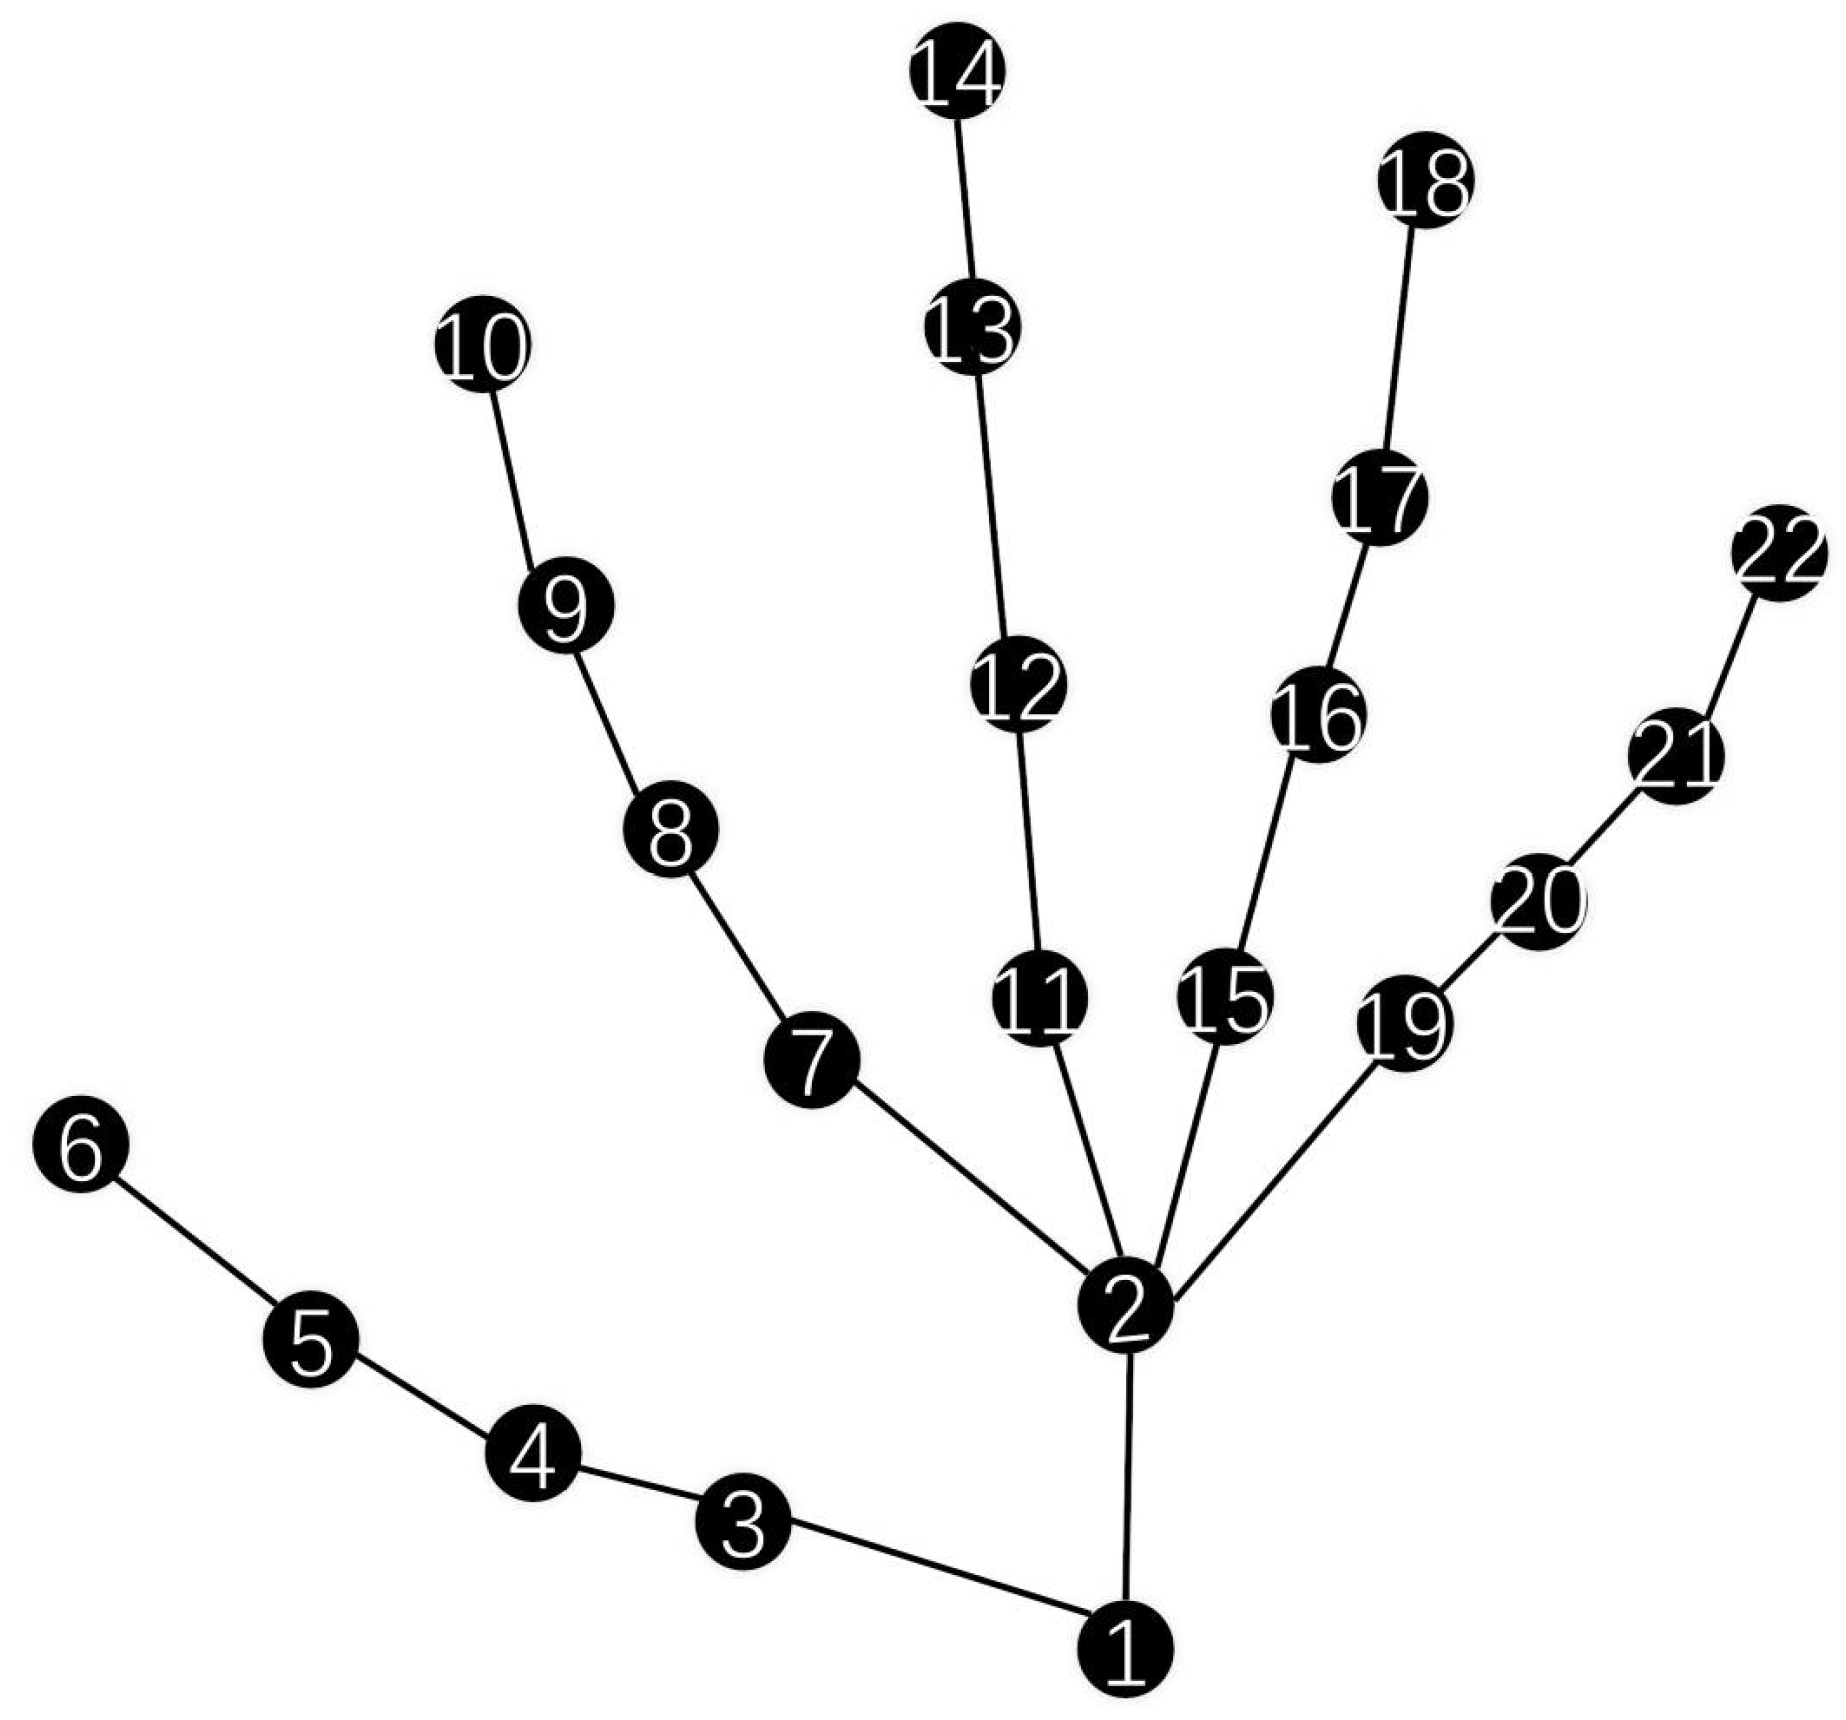
The graph structure, typically represented by the adjacency matrix, is a crucial component in GCNs. Most existing methods initialize the adjacency matrix based on the physiological dependence of the skeletal structure, as illustrated in Figure 1. This approach, though, leads to a long-range dependency problem in graph convolution [13]. For instance, in Figure 1, node 10 needs a relatively large number of hops to reach node 14, despite the possibility that they are spatially close. This clearly shows that defining the relationship between nodes solely based on physiological factors is insufficient.

Figure 1.
Schematic representation of a hand-skeleton graph. The nodes are numbered from 1 to 22, representing different joints in the hand-skeleton. The connections between the nodes illustrate the structural relationships among the joints, which are essential for modeling hand gesture-related spatial information.
Niepert et al. proposed Patchy-San. This method extracts fixed-size, locally ordered neighborhoods from arbitrary graphs. In this way, standard CNN filters can learn node representations that are on par with those learned by graph kernels [14].
Spatial methods commonly utilize adjacency matrices to encode the relationships between nodes. For example, Yan et al.’s spatial–temporal graph convolutional network (ST-GCN) [15] employs a hand-skeleton adjacency matrix within a series of stacked spatial–temporal GCN blocks. To address the issue of vanishing gradients, each block in ST-GCN incorporates residual (skip) connections, which were first introduced by He et al. [16]. These residual connections allow for the construction of deeper and more stable models.
Spatial blocks are components that use GCNs to aggregate spatial information from individual frames. Meanwhile, temporal blocks utilize one-dimensional convolution to link information across frames in the temporal dimension. Although ST-GCN outperforms CNN/RNN methods, a limitation exists in its design. Specifically, the graph adjacency matrix in ST-GCN remains static throughout the training process. This fixed nature of the adjacency matrix hinders the integration of information from nodes that are separated by a large hop-distance. As a result, ST-GCN is unable to effectively deal with the long-range dependency problem.
To overcome the issue of dealing with long-range dependencies due to static adjacency matrices in graph-based models, subsequent research efforts have focused on introducing learnable adjacency matrices. These matrices are designed to adaptively modify the relationships between nodes during the training process.
The pioneering work [17] was the first to suggest uncovering node-to-node relationships through network training. Following this, CTR-GCN [18] took a step further by enabling the specialization of an adjacency matrix for the input channel. Recognizing that the dependencies among joints evolve over time, Liu et al. [19] proposed the TD-GCN. This model employs a frame-by-frame approach to calculate the adjacency matrix, effectively accounting for the temporal variations in joint relationships.
Although the aforementioned studies have alleviated the long-range dependency issue to some degree, they all initialize the adjacency matrix based on the physiological skeletal structure. This approach causes the final trained adjacency matrix to be overly biased toward the inherent relationships of the physiological skeleton. However, since the “key nodes” in input data may not strictly correspond to actual anatomical joints, this physiological initialization introduces inherent bias.
To further address long-range dependencies and eliminate such biases, Lee et al. [13] proposed the hierarchically decomposed graph convolutional network (HD-GCN). This model effectively decomposes each joint node into multiple subsets, enabling it to capture both structurally adjacent and distant node-edge relationships. Meanwhile, Duan et al. [20] introduced a novel framework called DG-GCN, which improves skeleton-based action recognition by addressing limitations in traditional GCNs. DG-GCN uses learnable affinity matrices to capture dynamic joint relationships, enabling more flexible and accurate spatial modeling.
The research and experimental results of Lee et al. [13] and Duan et al. [20] demonstrate that relationships between graph nodes should involve multiple nodes rather than just pairwise correlations. However, traditional graph data structures are limited by edges that can only connect pairs of nodes, meaning graph convolutional networks (GCNs) cannot simultaneously model relationships among multiple nodes. To address this limitation, our work adopts a hypergraph structure, where hyperedges can connect multiple nodes to capture higher-order dependencies.
In this paper, we propose a hand gesture recognition method called the dynamic hypergraph convolutional network (DHGCN). The codes are provided in the link https://github.com/CoderHoooK/DHGCN (accessed on 5 May 2025). Its key features and innovations include the following:
- Hypergraph Integration: Building on graph convolutional networks (GCNs), DHGCN incorporates hypergraph structures to model higher-order relational features among multiple nodes. Unlike traditional graphs with pairwise edges, hyperedges in hypergraphs can connect multiple nodes simultaneously, enabling the network to capture complex, multinode dependencies.
- Dynamic Hypergraph Structure: The hypergraph in DHGCN is data-driven and non-predefined, learned directly from input data during training. This dynamic scheme ensures objective and adaptive feature extraction, avoiding the biases of manually predefined structures.
- Multistream Fusion Strategy: By fusing prediction vectors from hypergraph convolutional networks with varying numbers of hyperedges, the model achieves enhanced performance. This strategy leverages diverse hypergraph configurations to capture complementary information and improve recognition accuracy.
2. Materials and Methods
The following subsections present summaries of the mathematical framework. The mathematical structures we use to describe networks are graphs. In this section, we review some definitions and results from basic graph theory and theories specific for hyper graphs. As shown in Figure 1, a hand-skeleton graph is represented as a graph. For more advanced representations, hypergraphs can be utilized to model higher-order relationships between joints, capturing more complex interactions within hand gestures.
Hand gesture recognition aims to identify and interpret human hand movements through computational models. This process typically involves mapping hand gestures—often represented as sequences of joint coordinates—into a structured format suitable for analysis. ST-GCNs [20] are designed to model and recognize human actions by capturing both spatial (structural) and temporal (sequential) dependencies in skeleton-based data.
The following subsections summarize the mathematical framework of the approach. Graphs are used to describe the network structures, and this section reviews key definitions and concepts from basic graph theory and hypergraph theory. As illustrated in Figure 1, a hand-skeleton is naturally represented as a graph, where nodes correspond to joints and edges encode physiological connections (e.g., bones). For more complex representations, hypergraphs are employed to model higher-order relationships between joints. Unlike traditional graphs with pairwise edges, hypergraphs use hyperedges to connect multiple nodes simultaneously, enabling the capture of intricate, multijoint interactions within hand gestures.
2.1. GCNs
This mathematical framework underpins various hand gesture recognition systems, enabling accurate and efficient interpretation of hand movements in applications such as human–computer interaction, sign language recognition, and virtual reality interfaces. Definition of Graphs are as follows:
- represents a graph, where is the set of vertices corresponding to hand joints, and is the set of edges representing relationships between joints.
- represents the matrix of node features, where each row is a feature vector for vertex .
- represents the adjacency matrix, with entries indicating the presence and weight of the edge between vertices and .
In GCNs, the node feature matrix is updated through the following layer-wise propagation rule as Equation (1).
where
- is the matrix of node features at layer , with .
- is the adjacency matrix with added self-loops.
- is the degree matrix of .
- is the trainable weight matrix at layer .
- is an activation function, typically ReLU.
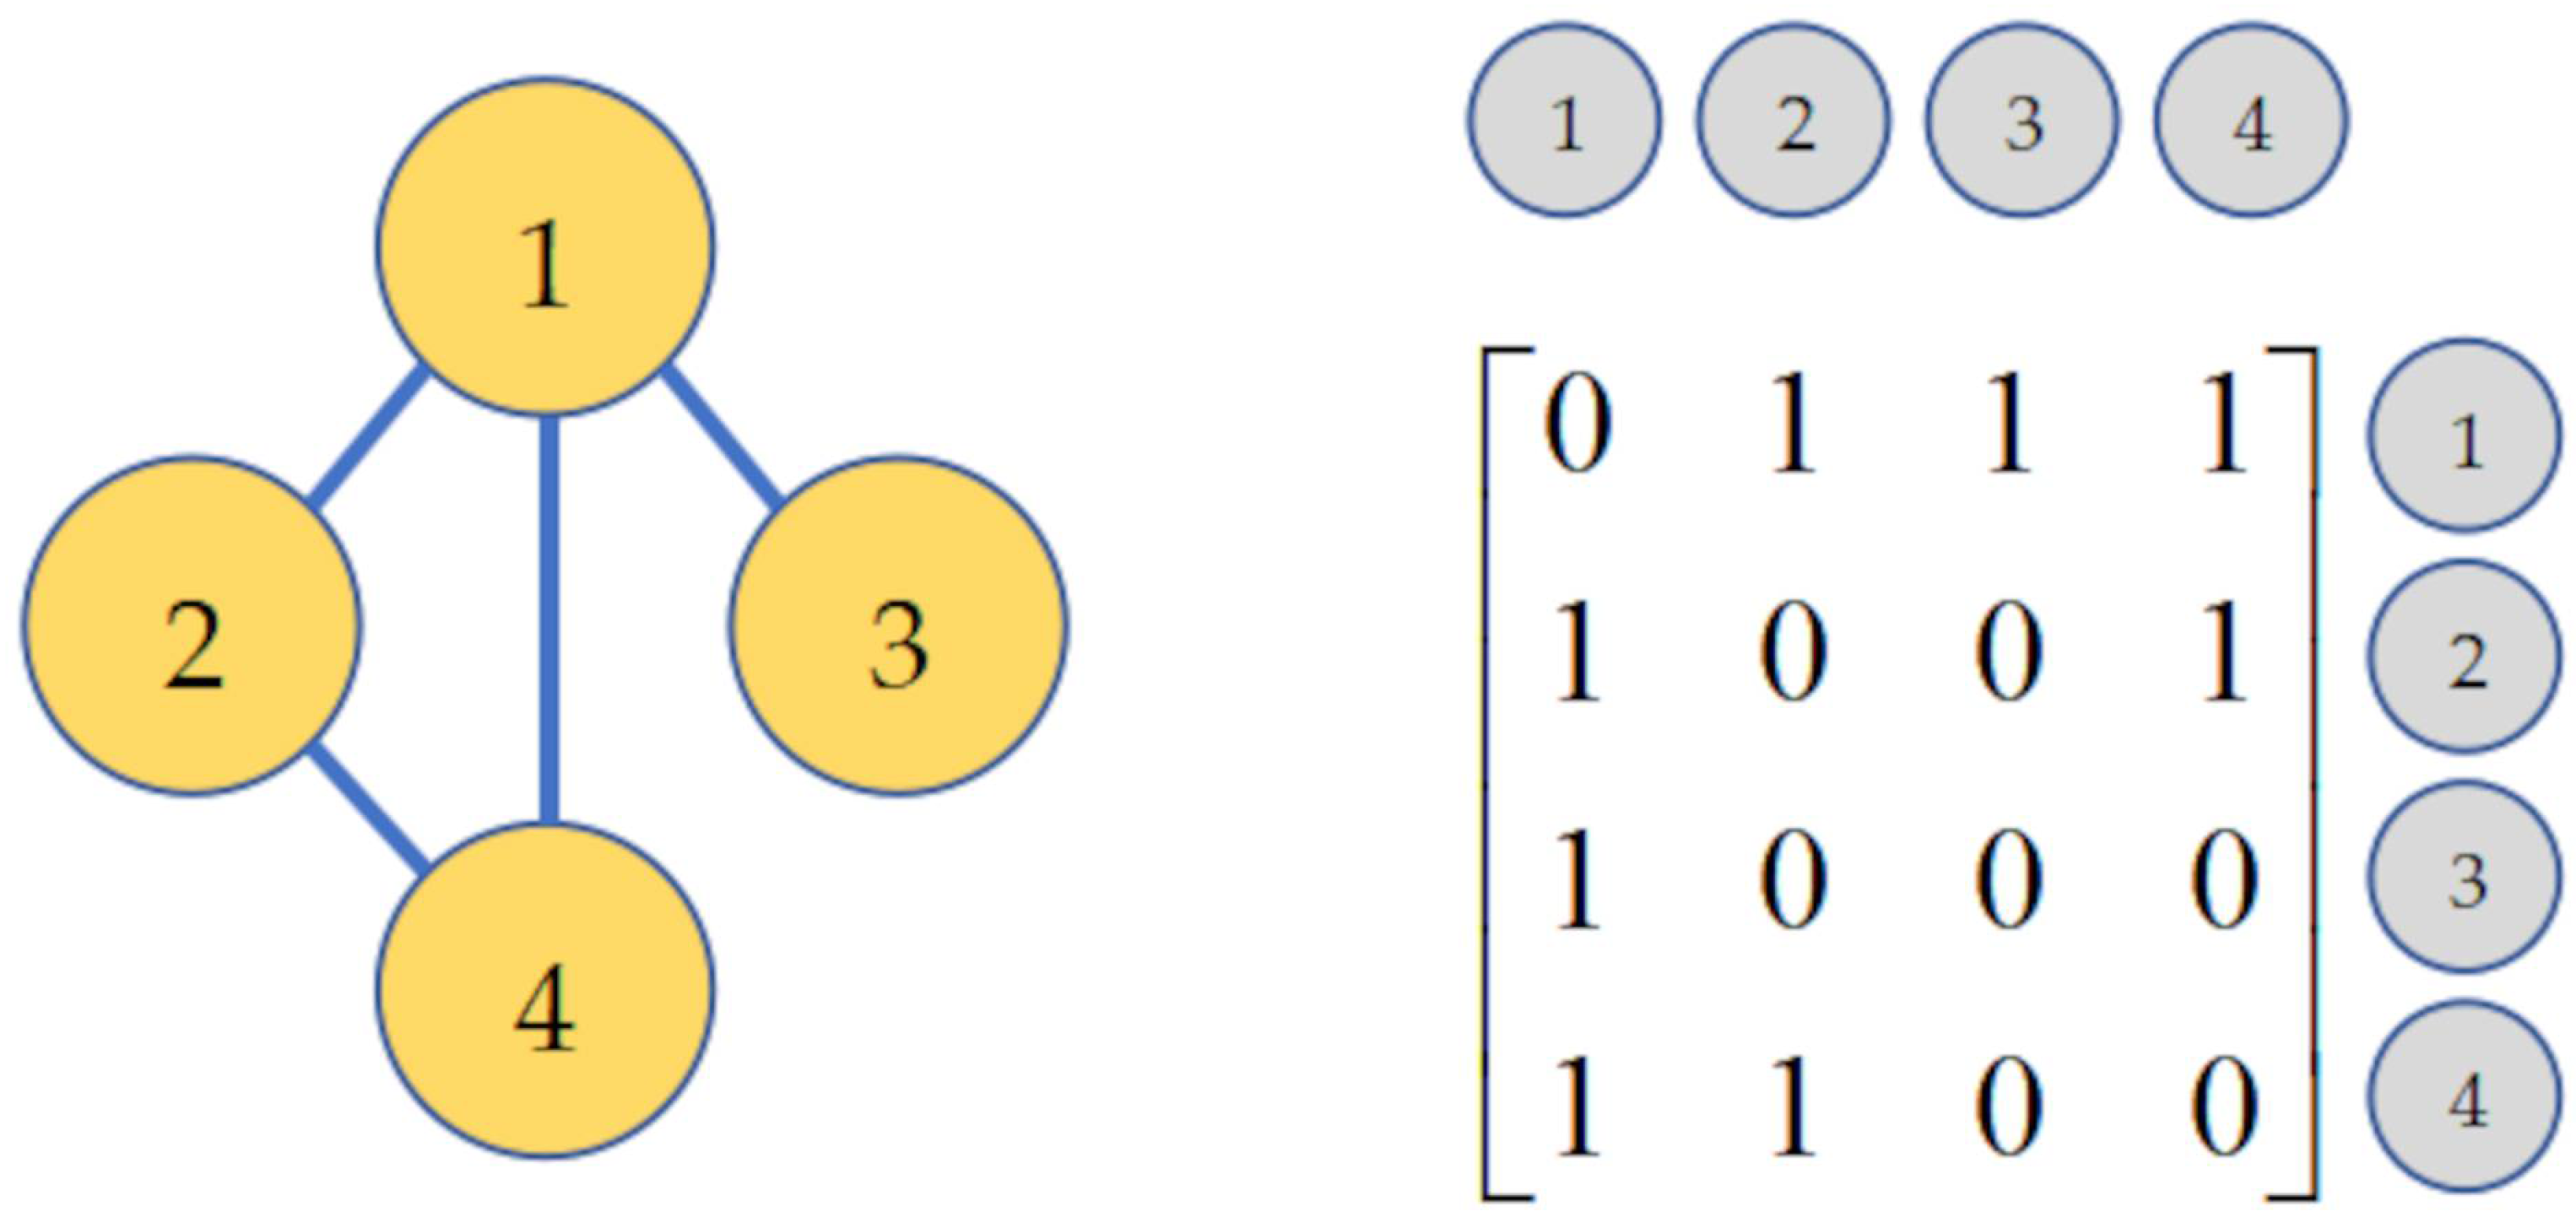
This formulation allows GCNs to capture spatial dependencies between hand joints. The GCNs mainly fall into spectral methods and spatial methods. The former utilizes Fourier transforms based on the Laplacian matrix to perform graph convolution operation on the spectral domain. In contrast, the latter directly aggregate information from nodes and their neighboring nodes through graph connectivity, extracting and normalizing features. The graph connectivity is designed by the adjacency matrix and an example of the adjacency matrix is shown in Figure 2. In the adjacency matrix , a non-zero element Aij implies a connection from node i to node j, and a zero indicates no direct connection.
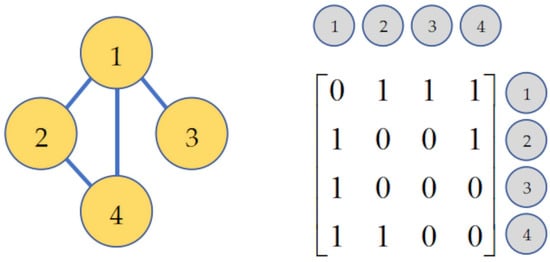
Figure 2.
Illustration of a graph and its corresponding adjacency matrix. On the left, a graph is depicted with four nodes labeled 1, 2, 3, and 4, where edges connect the nodes to show their relationships. On the right, the adjacency matrix corresponding to this graph is shown. Each row and column in the matrix corresponds to a node in the graph. A value of 1 in the matrix indicates an edge connection between the corresponding nodes, while a 0 indicates no connection.
2.2. Hypergraph Convolution
A hypergraph is a special type of graph structure, where the main difference from a regular graph is that multiple nodes can be connected by a single hyperedge [21]. The relationships between nodes are represented using an incidence matrix. In order to apply the properties of hypergraph, Feng et al. [22] proposed HGNN by drawing an analogy to the spectral-based GCN method. Bai et al. [23] argued that in real-world scenarios, nodes (such as in recommendation systems or citation networks) are not just pairwise related but are involved in more complex-wise correlations. Therefore, they used the hypergraph to represent the relationships between nodes provided in the datasets and applied hypergraph convolution to extract high-order relational features. Since [23] achieved remarkable results in node classification on three citation network datasets, demonstrating the effectiveness of hypergraph convolution operation.
Hypergraph Convolution extends traditional graph convolution to model high-order relationships by allowing hyperedges to connect multiple nodes. This enables richer information aggregation across complex structures, making it ideal for tasks like classification, clustering, and representation learning in domains where interactions go beyond simple pairwise connections. Let the hypergraph be , where
- is the set of nodes (vertices);
- is the set of hyperedges, where each .
Let the following definitions apply:
- : input node features (each row is a feature of node );
- : output node features after convolution.
The incidence matrix is defined as Equation (2):
The following definitions apply:
- : diagonal matrix of vertex degrees, with the following entries: );
- : diagonal matrix of hyperedge degrees, with ;
- : diagonal matrix of hyperedge weights .
In graph learning, spatial convolution means aggregating information from neighbors (like message passing). In hypergraphs, the neighbors of a node are defined via shared hyperedges—which can connect multiple nodes simultaneously. The convolution theorem is a well-known result in signal processing and Fourier analysis that relates the convolution of two signals in the time or spatial domain to the multiplication of their Fourier transforms in the frequency domain. This theorem is fundamental in traditional convolution, and we can extend its concept to hypergraphs by utilizing the Fourier transform of the hypergraph Laplacian. A spectrally motivated hypergraph convolution layer [22] is Equation (3):
where : input node features; : trainable weight matrix; : non-linear activation function (e.g., ReLU); and : output node features. The term is a hypergraph similarity matrix. This operator captures feature propagation from a node to others via shared hyperedges.
Traditional convolution is a standard operation in signal processing, where neighboring information is aggregated using a kernel. In the context of hypergraphs, this is generalized to aggregate signals from vertices connected by hyperedges. The convolution theorem provides an efficient way to compute convolutions by transforming signals to the frequency domain and performing multiplication in that domain. As shown in Table 1, traditional convolution operates in the time or spatial domain using sine and cosine basis functions defined by the classical Fourier transform. In contrast, graph convolution generalizes this operation to non-Euclidean data by applying the Fourier transform based on the graph Laplacian, enabling modeling of pairwise relationships in structured data. Hypergraph convolution further extends this framework by utilizing the hypergraph Laplacian, allowing for the modeling of complex, higher-order interactions among multiple nodes within hyperedges.

Table 1.
Comparison of convolution methods.
2.3. Architecture Design
The DHGCN architecture, as shown in Figure 3, is designed to dynamically model higher-order joint relationships via learnable hypergraph convolutions, aggregate multiscale temporal features through stacked T-Modules, and distill spatiotemporal representations via hierarchical T- and N-pooling. A final fully connected layer then maps these rich embeddings to gesture classes.
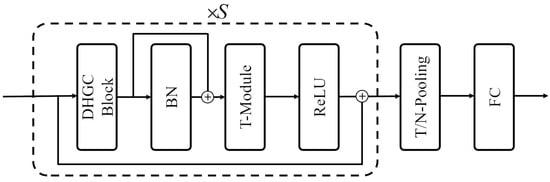
Figure 3.
The architecture of DHGCN model. The input passes through the dynamic hypergraph convolution (DHGC) block first. Subsequently, the output of the DHGC block goes through a batch normalization (BN) layer, which is then added (⊕) to the input of the BN layer. The result is fed into the T-module, followed by a rectified linear unit (ReLU) activation function, with another addition operation (⊕) applied. The output then undergoes temporal normalization (TN) pooling and is finally processed by a fully connected (FC) layer. The entire structure within the dashed box is repeated S times.
The principle and structure of the DHGC Block are detailed in Section 2.4. The T-Module is the Multiscale TemporalConv module from [18], which is used for aggregating multiframe features from both past and future frames.
Below is the formal definition of the Multiscale TemporalConv module, which aggregates features across multiple frames both before and after the current time step: Suppose we have an input feature tensor , where is the number of frames, the feature channels, and the number of vertices (e.g., hand joints). The Multiscale TemporalConv (MSTC) module employs parallel 1D convolutional branches, each with a different dilation rate for . We denote the convolution operator in branch as (kernel size ); its output is
where BN refers to batch normalization and Act is a nonlinear activation.
To fuse multiscale information, we simply sum the branch outputs element-wise, as in Equation (5).
This aggregation lets small capture short-term dynamics, while larger capture long-term dependencies. Optionally, if and the input share the same shape, a residual connection can be added to stabilize training and preserve the original features, as in Equation (6).
This MSTC design efficiently integrates multiscale past and future context into a unified temporal representation.
2.4. DHGC Block
This work leverages hypergraph convolution to capture higher-order relational features between hand joints. Building on the findings of [20], which validated the feasibility of dynamic graphs, we propose a dynamic hypergraph convolution approach for hand gesture recognition. Let the hypergraph be denoted as , where represents the set of vertices (hand nodes) and represents the set of hyperedges (relationships between nodes). Based on [23], the dynamic hypergraph convolution is defined as Equation (7).
where
- represents the average pooling operation across the temporal dimension.
- is the convolution operation, with input channels and output channels .
- is the weight matrix that adjusts the feature channels.
- The incidence matrix encodes the relationships between vertices and hyperedges, with each element initialized randomly from a standard normal distribution and learnable during training.
- The degree matrices and represent the degree of vertices and hyperedges, respectively.
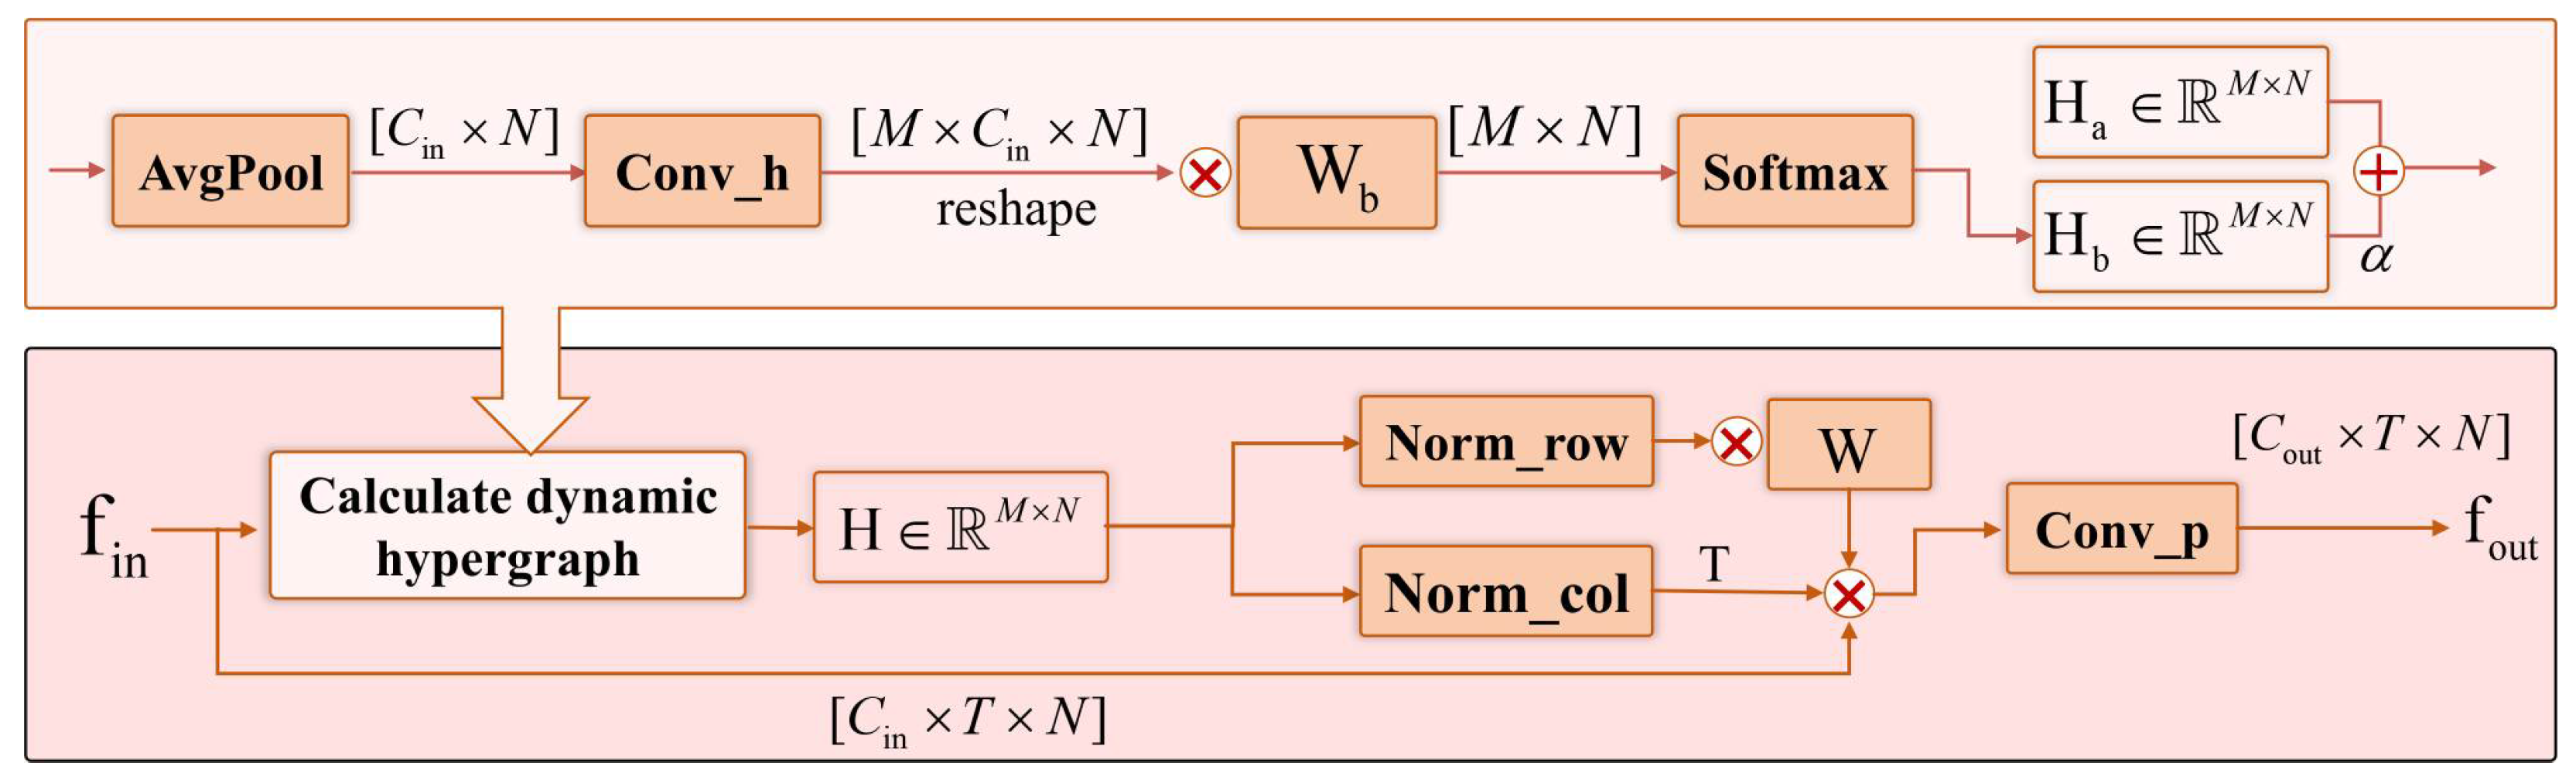
The detailed architecture of the dynamic hypergraph convolution (DHGC) block is shown in Figure 4. In this figure, AvgPool, Conv_h, and Conv_p correspond to the average pooling, hypergraph convolution, and the subsequent convolution layers, respectively. Row normalization (Norm_row) and column normalization (Norm_col) are applied to normalize the features across spatial and temporal dimensions.
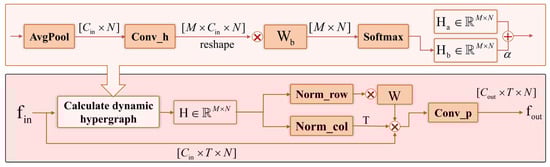
Figure 4.
Dynamic hypergraph convolution block. This block integrates multiple operations to process input features with dimensions . The top path first applies AvgPool to reduce the spatial dimensionality of the input related to channels and spatial dimension N, followed by Conv_h (convolution operation) to transform the feature dimensions to ; then, it reshapes and is multiplied by the weight matrix, , and finally passes through Softmax to output , which is combined with another component, , via the operation denoted by . The bottom path calculates a dynamic hypergraph , normalizes it row-wise (Norm_row) and column-wise (Norm_col), multiplies with matrices W and T, respectively, and then applies Conv_p (convolution operation) to generate the output feature with the same dimensions as the input. Here, ⊗ represents matrix multiplication, and ⊕ represents the summation operation.
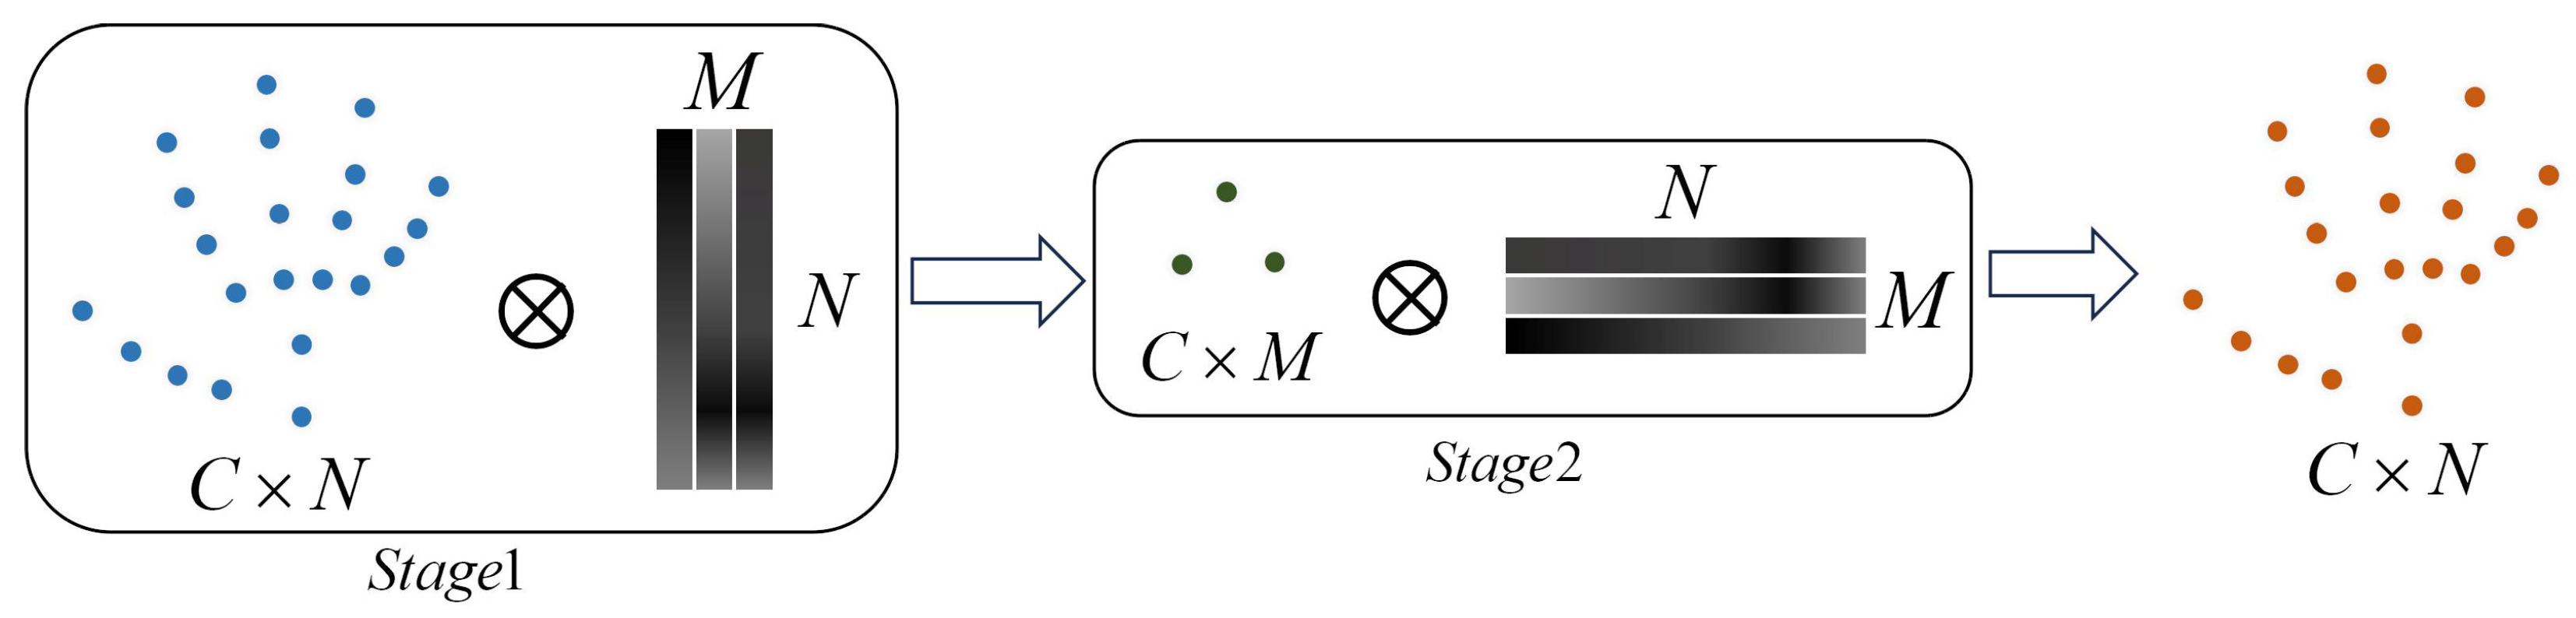
The visualization of the DHGC block extracting higher-order relational features is depicted in Figure 5 and can be divided into two main stages. In the first stage, the input features are multiplied by the incidence matrix to generate the hyperedge features. In the second stage, these hyperedge features are multiplied by the transposed incidence matrix to produce the final output.
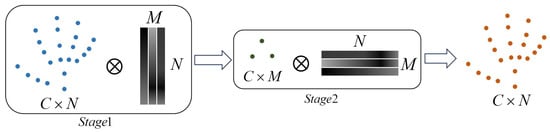
Figure 5.
Visualization of adaptive hypergraph convolution operation. In Stage 1, input features with dimensions (depicted as blue dots) are multiplied by a matrix with dimensions , generating intermediate hyperedge features of size (shown as green dots). In Stage 2, these intermediate features are multiplied by a matrix of size , resulting in the final output features with dimensions (represented as orange dots). This two-stage process enables the extraction of higher-order relational features within the hypergraph framework.
2.5. Multistream Strategy
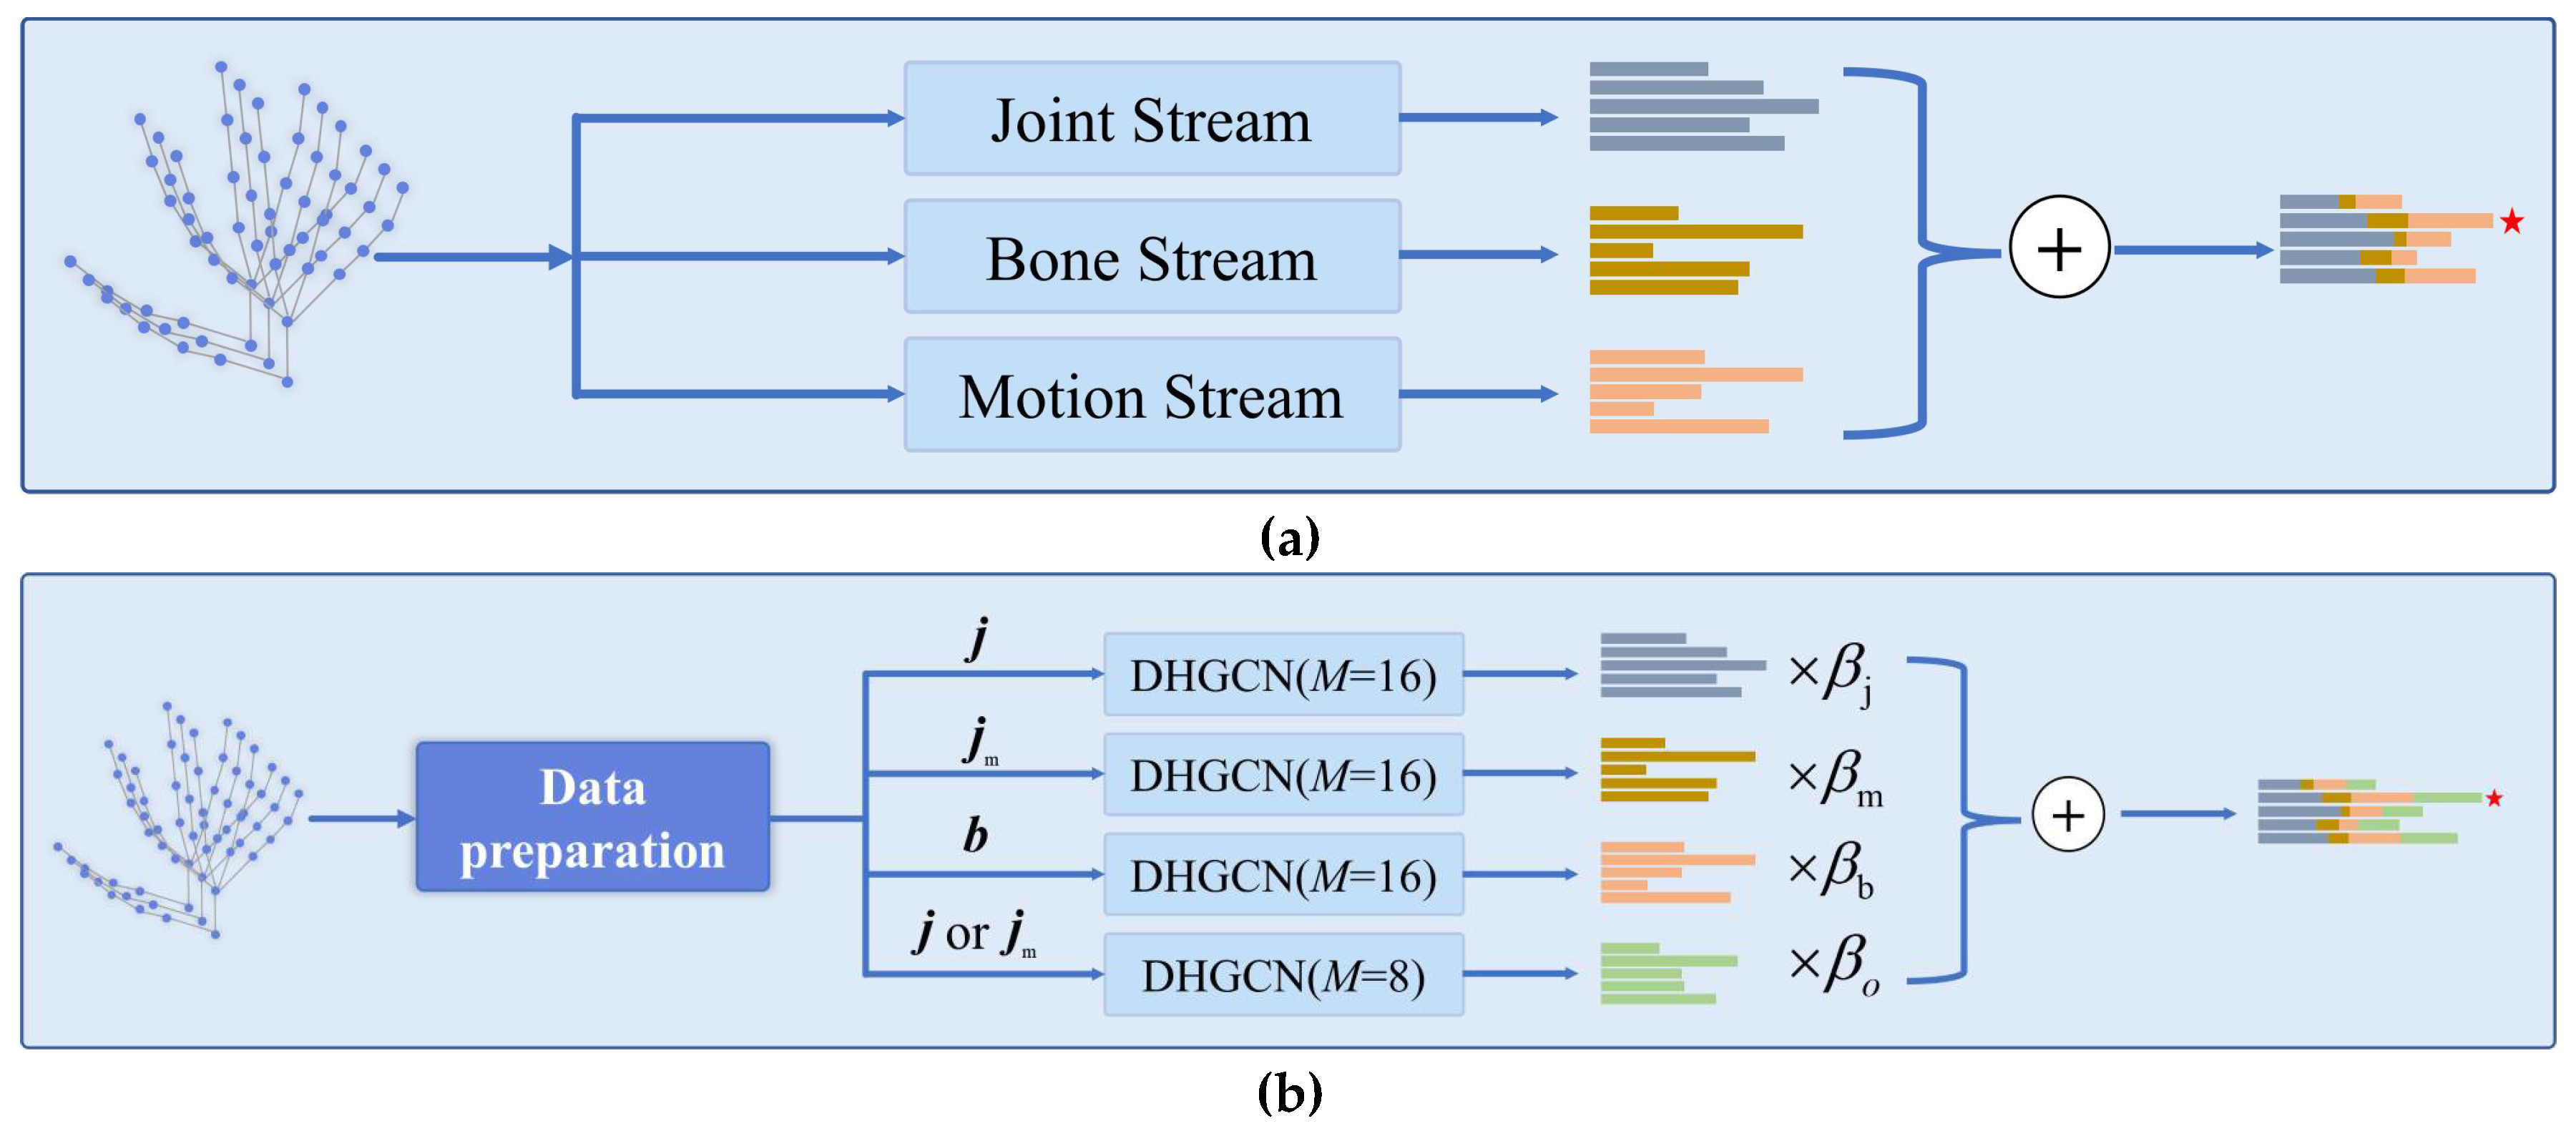
Figure 6 illustrates two multistream architectures for hand gesture recognition. Figure 6a presents a multistream architecture that integrates joint, bone, and motion features for comprehensive gesture understanding. Each stream outputs a set of features (represented by bar charts colored in grey, yellow, and orange, respectively) and specializes in a different modality. Their fusion enables richer representation learning for hand gesture classification. The architecture of the multistream fusion strategy is shown in Figure 6a. The input is a hand-skeleton sequence—a set of nodes representing hand joints over time. The input is fed into three parallel streams, each designed to capture a specific aspect of the hand motion:

Figure 6.
(a) Multistream feature fusion architecture for hand gesture recognition. The input hand-skeleton data is processed through three distinct streams: the Joint Stream, which focuses on features related to individual joints; the Bone Stream, handling features associated with bone connections; and the Motion Stream, capturing motion-related features. Each stream generates its own set of feature representations, depicted by differently colored bars. These representations are then combined via an addition operation (⊕), resulting in a unified feature vector that integrates information from all streams, denoted by the final set of bars with an asterisk. (b) Feature processing and fusion pipeline. After data preparation, the input hand-skeleton data is split into different components: (joint-related data), (motion-related joint data), (bone-related data), and or (alternatively processed joint data). Each of these components is fed into a dynamic hypergraph convolutional (DHGC) module with (except for the last one with ). The output of each DHGC module is multiplied by a corresponding weight factor (, , , ). These weighted outputs are then combined via an addition operation (⊕) to form the final integrated feature representation, denoted by the bars with an asterisk.
- Joint Stream:
- Processes the raw joint positions.
- Extracts spatial configuration features of the hand.
- Bone Stream:
- Processes bone vectors, i.e., the directional vectors between connected joints.
- Captures structural and relational features between joints.
- Motion Stream:
- Processes temporal differences (e.g., joint velocities).
- Captures motion dynamics, helpful for distinguishing gestures with similar poses but different movements.
To address this limitation, Figure 6b introduces an enhanced model incorporating DHGCN. In this version, each input stream—corresponding to joint (j), motion (), and bone (b) features—is processed through a distinct DHGCN module. By varying the number of hyperedges in each stream, the architecture encourages diversity among the learned representations. The outputs are then fused through a learnable weighted combination, improving the expressiveness of the final prediction vector. This design allows the model to capture rich spatial–temporal dynamics of hand gestures more effectively, enabling fine-grained recognition. The integration of dynamic hypergraphs further empowers the network to move beyond static priors and adaptively tailor its topology to the input data. Here is a description of the components in Figure 6a as follows:
- The input is a hand-skeleton sequence.
- A data preparation module extracts three types of node features:
- j: joint;
- : motion;
- b: bone features (possibly inter-joint vectors).
A description of the components as Figure 6b. The input data is first preprocessed into three distinct feature types: joint data, bone data, and motion data. The joint data is used in its raw form. The bone data is computed by subtracting the coordinates of adjacent joints, effectively representing the hand-skeleton structure. The motion data is obtained by calculating the temporal difference of each joint across consecutive frames, capturing dynamic movement information. Each type of data is then fed into a dedicated model stream, resulting in four distinct processing paths: the j-stream (joint), -stream (motion), b-stream (bone), and o-stream (other). The o-stream, proposed in this paper, flexibly takes either joint or motion data as input but differs from the other streams by using a different number of hyperedges, allowing it to learn complementary representations. During inference, each stream produces its own prediction vector. These outputs are then scaled by predefined weights (, , , ) and combined through weighted summation to generate the final prediction. This multistream strategy enhances the model’s ability to integrate spatial and temporal features for robust hand gesture recognition. The final prediction vector is computed using the following Equation (8):
where and . represents the prediction vectors of different data stream models.
3. Results
All experiments in this paper are conducted using the DHG-14/28 [24] and SHREC’17 [25] datasets to evaluate the effectiveness of the proposed DHGCN for hand gesture recognition. The DHG-14/28 dataset contains 14 dynamic hand gestures; each performed in two modes, namely, using a single finger and using the whole hand. These gestures were performed by 20 different subjects, with each gesture repeated five times. This results in a total of 2800 gesture sequences. Each sequence includes both depth images and the 3D coordinates of 22 hand joints, captured using an Intel RealSense camera. To ensure fair evaluation, a leave-one-subject-out cross-validation strategy is employed. In this setup, the model is trained on data from all participants except one and tested on the held-out subject, ensuring that the evaluation reflects the model’s ability to generalize to unseen individuals.
3.1. Implementation Details
All experiments were implemented using PyTorch 1.13 and Python 3.9, running on Ubuntu 20.04 with an NVIDIA RTX 3090 GPU with 24 GB of memory. The network was trained using the stochastic gradient descent (SGD) optimizer with a batch size of 48. A warm-up learning rate strategy was employed during the initial training phase: the learning rate was linearly increased from 0.02 to 0.1 over the first five epochs. After the warm-up phase, cosine annealing was applied to gradually reduce the learning rate from 0.1 to a minimum value of . Additionally, a weight decay of was used to regularize the model and prevent overfitting.
3.1.1. Datasets
This study uses the publicly available DHG14/28 [24] and SHREC’17 [25] datasets to evaluate the proposed model. The DHG14/28 dataset contains 2800 gesture sequences captured with an Intel RealSense camera at 30 frames per second. Each sequence consists of 20 to over 50 frames and includes both depth images and 3D coordinates of 22 hand joints. Gestures are performed by 20 individuals, each executing 14 distinct dynamic gestures five times using only one finger. This subset forms the DHG14 dataset (14 classes). The same participants then repeated the gestures using the whole hand, resulting in the DHG14/28 dataset (28 classes). The SHREC’17 dataset follows the same data collection protocol and device settings as DHG14/28 but involves 28 performers. Like DHG14/28, SHREC’17 also includes subsets with 14 and 28 gesture classes. For dataset partitioning, DHG14/28 adopts a leave-one-subject-out strategy, using gesture data from the first 19 subjects for training and the 20th subject for testing. Since SHREC’17 does not provide a predefined split, this study follows the partitioning method introduced by De et al. [25]. As a result, the DHG14/28 dataset contains 2600 training samples and 140 test samples, while SHREC’17 includes 1960 training samples and 840 test samples. Due to varying sequence lengths, a sampling algorithm is applied to standardize the number of frames: 128 frames per sequence for DHG14/28 and 180 frames for SHREC’17. This normalization ensures compatibility with batch-based deep learning training.
3.1.2. Model Evaluation
The system’s performance was evaluated using the accuracy metric. Accuracy is defined as the percentage of samples that were correctly classified out of the total number of samples. This metric provides a clear indication of how well the system performs in correctly identifying the appropriate classification for each sample. The calculation of accuracy is detailed in Equations (9) and (10), which outline the specific steps and variables involved in determining this key performance indicator (Accuracy).
where is the predicted category of the -th sample and is the true label of the -th sample.
where is the total number of samples in the test set.
3.1.3. Comparison of Results
A quantitative performance comparison was conducted between the proposed method and several authoritative baseline models on the DHG14/28 and SHREC’17 datasets. The selected comparative methods, listed in Table 2, span a range of classical and state-of-the-art approaches across different architectures and modalities.
Table 2.
Summary of baseline methods used for comparison in this study, including their source conferences or journals and year of publication.
As shown in Table 3, the proposed DHGCN model achieves superior accuracy on the DHG14/28 dataset using a three-stream fusion. With the addition of the o-stream to form a four-stream fusion, the model attains the highest performance across both 14-class and 28-class settings, highlighting the contribution of the o-stream to discriminative feature learning.
Table 3.
Experimental results with dataset DHG14/28.
Similarly, Table 4 reports results on the SHREC’17 dataset, where our approach consistently outperforms existing methods under both three- and four-stream configurations. These findings further confirm the generalizability and effectiveness of the proposed DHGCN model across diverse gesture datasets.
Table 4.
Results comparison of methods with dataset SHREC’17.
3.1.4. Ablation Study
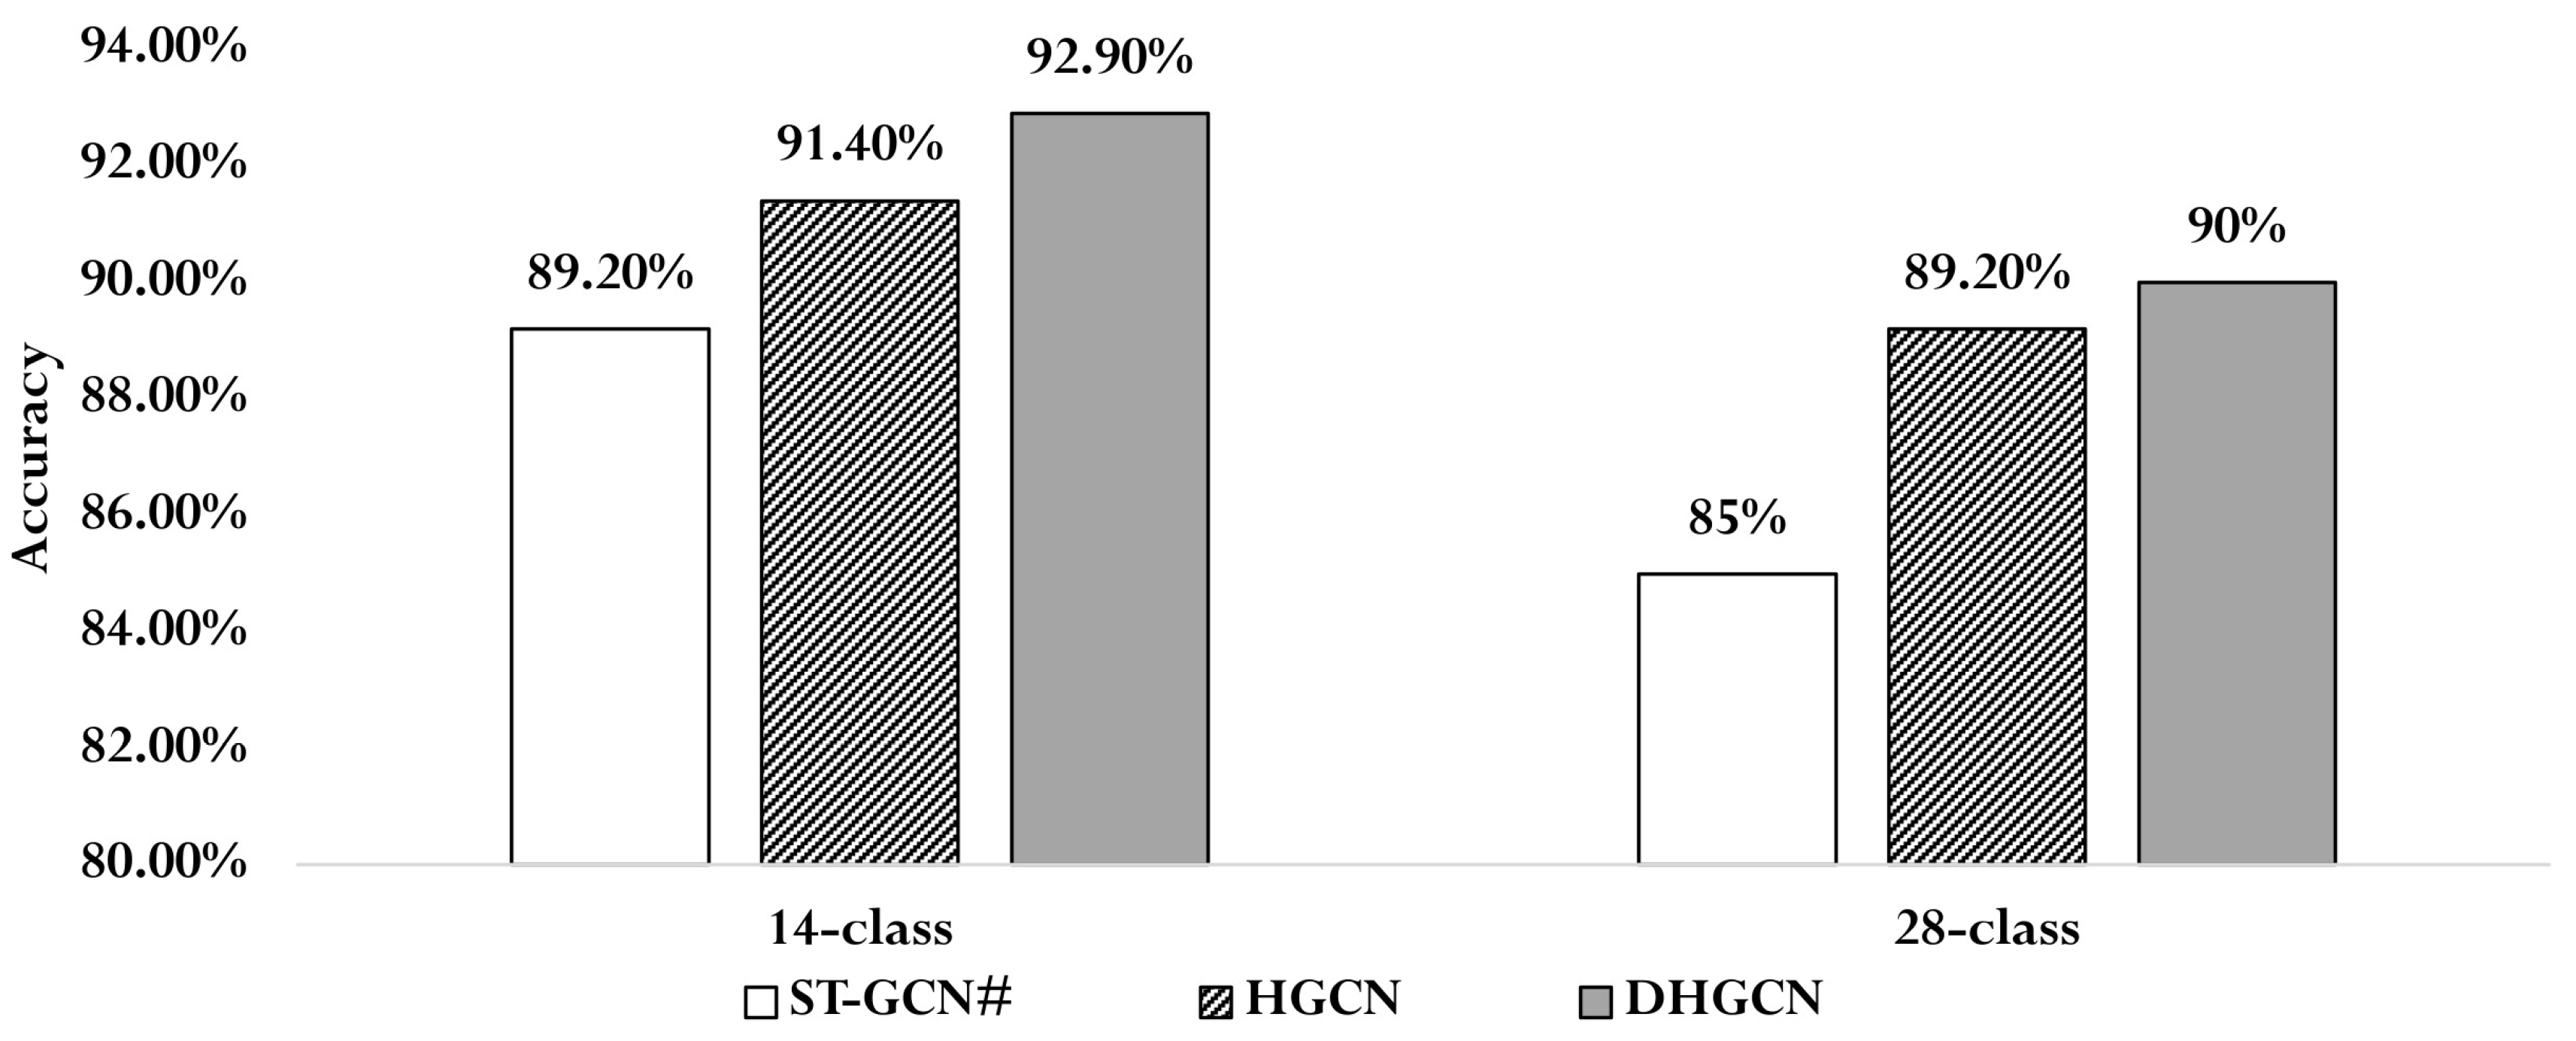
To evaluate the effectiveness of hypergraph convolution without predefined structures and the proposed dynamic hypergraph convolution, we conducted a set of ablation experiments comparing different construction strategies. As shown in Table 5, the baseline model ST-GCN# shares the same temporal module (T-Module) as DHGCN but employs a standard graph convolution structure. The HGCN variant, which uses a randomly initialized hypergraph incidence matrix without any predefined connections, achieved accuracies of 91.4% on the 14-class task and 89.2% on the 28-class task on the DHG14/28 dataset in Figure 7. These results validate the feasibility of using non-predefined hypergraphs in hypergraph convolution and demonstrate their potential to capture richer structural information. Furthermore, HGCN outperformed ST-GCN# by 1.2% and 4.2% in accuracy on the 14-class and 28-class tasks, respectively, suggesting that hypergraph convolution is more effective than traditional graph convolution for gesture feature extraction. Finally, by incorporating a data-driven, dynamically constructed hypergraph into HGCN, the full DHGCN model further improved performance, achieving an additional 1.5% gain in accuracy for the 14-class task and 0.8% for the 28-class task. These improvements clearly demonstrate the added benefit of dynamic hypergraph convolution in enhancing the model’s feature extraction capability and overall recognition performance.
Table 5.
Dynamic hypergraph convolution ablation experiment methods.
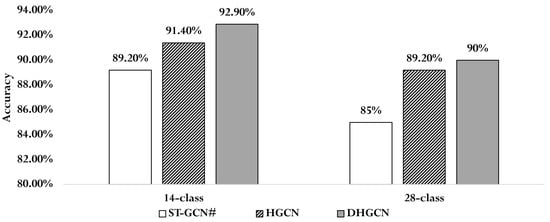
Figure 7.
Performance comparison experiment between STGCN, HGCN, and DHGCN using the j-stream on DHG14/28.
After concluding the ablation study, which systematically evaluated the contribution of individual components within our model, we shift our focus to analyzing the fusion performance of different streams. The transition from assessing standalone components to examining their collaborative impact is critical for understanding how spatial, temporal, and structural features interact to enhance gesture recognition.
3.2. Fusion Performance of Different Streams
To address the issue of feature homogeneity among different streams, as discussed in Section 2.5, we introduce a novel feature stream—referred to as the “o-stream”—which is trained using a different number of hyperedges. This stream is then fused with the conventional j, , and b streams for final gesture recognition. To evaluate the effectiveness of various fusion strategies, we conducted experiments on the DHG14/28 and SHREC’17 datasets using the DHGCN model. These experiments tested multiple fusion configurations, including single-stream, two-stream, three-stream, and four-stream combinations. The detailed performance results are reported in Table 6. The three-stream fusion strategy (e.g., j + + b), commonly adopted in prior work [19,32], already shows strong performance. However, as shown in Table 6, extending this to a four-stream fusion by incorporating the o-stream (i.e., j + + b + o) leads to further improvements: On the DHG14/28 dataset, the four-stream fusion achieves a 2.1% gain for the 14-class task and 0.7% for the 28-class task compared to the three-stream setup. On the SHREC’17 dataset, improvements of 0.1% and 0.4% are observed for the 14-class and 28-class tasks, respectively. While the performance gains on SHREC’17 are relatively small, likely due to already-high single-stream accuracies, the improvements still suggest that the o-stream contributes complementary features not captured by the j, , or b streams. This helps mitigate feature homogeneity in the fusion process. Furthermore, analysis of the fusion weights in Table 6 shows that integrating the o-stream consistently leads to performance improvements across various combinations. Notably, in the 14-class task on the DHG14/28 dataset, the weight coefficient for the b-stream drops to 0.0 in several fusion settings (e.g., j + + b and j + + b + o), suggesting that the o-stream can compensate for weaker streams and enhance fusion robustness. This further confirms that the o-stream plays a crucial role in diversifying the fused representations and improving recognition accuracy.
Table 6.
Fusion performance of different streams on SHREC’17.
4. Discussion
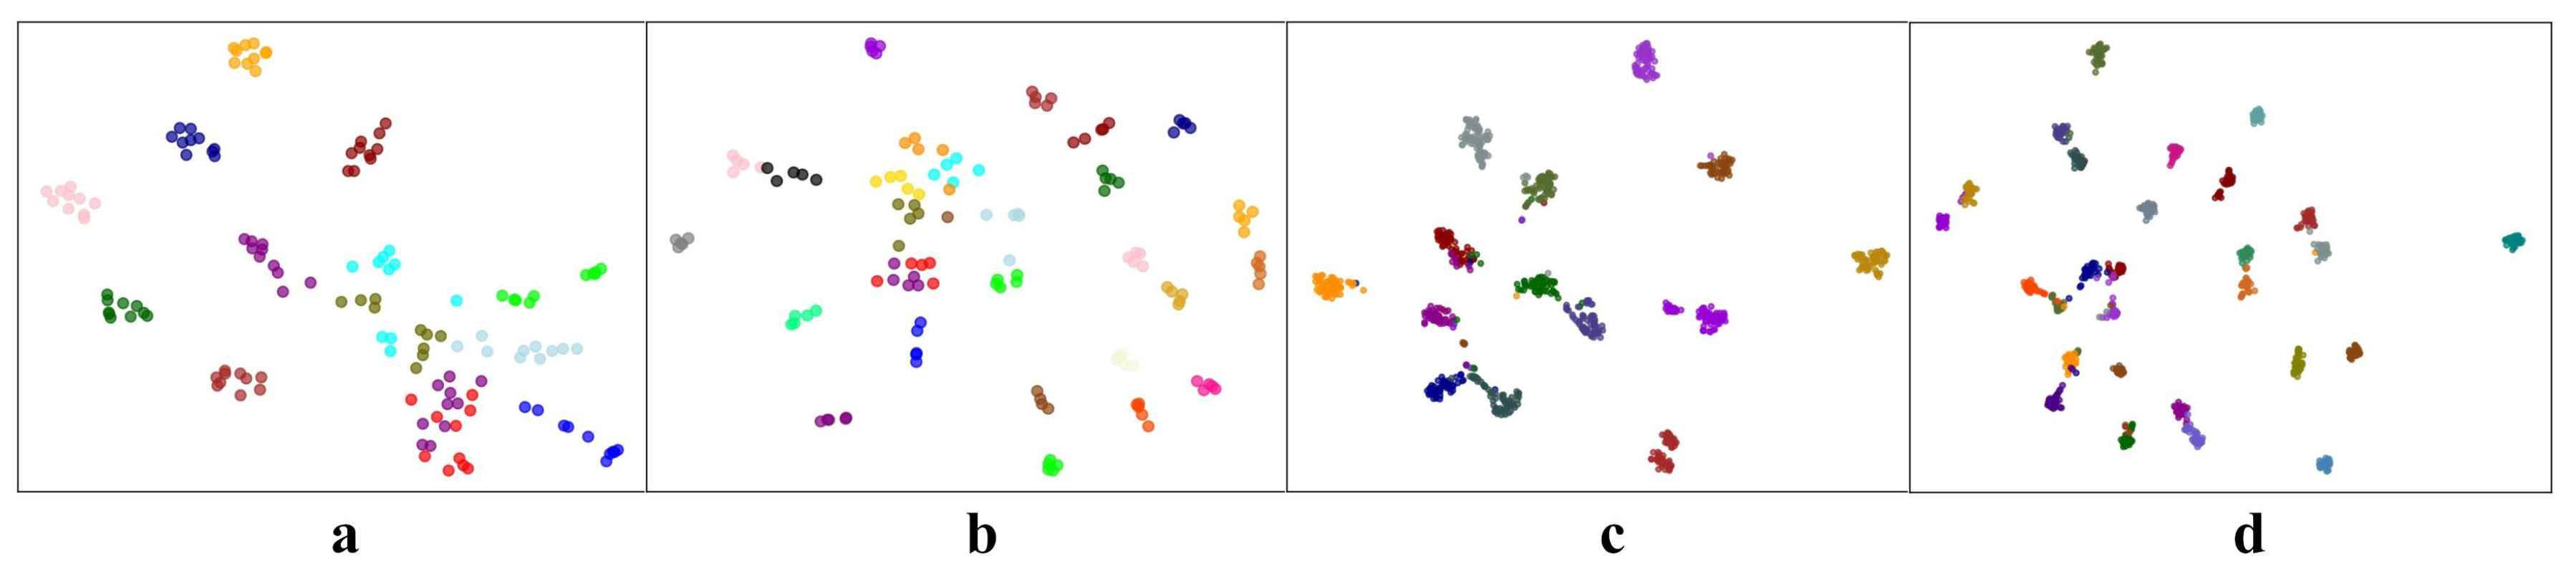
To gain a better understanding of the DHGCN’s classification performance across various categories, Figure 8 presents the single-stream output features of the DHGCN model on the DHG14/28 and SHREC’17 test sets. These features are reduced to two dimensions using the t-SNE method and depicted as scatter plots. As shown in Figure 8, the DHGCN model effectively clusters samples of the same class into the same region. While in subplots a and b of Figure 8, a few classes have relatively close distribution regions, the boundaries between them remain fairly distinct. This demonstrates that the DHGCN model is capable of extracting similar features for different samples within the same class. This ability can be attributed to the dynamic hypergraph structure in DHGCN, which is adept at extracting rich feature information.
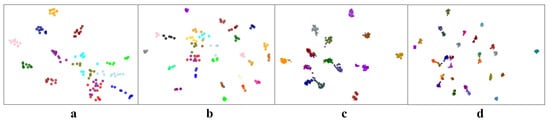
Figure 8.
t-SNE visualization of DHGCN output features. (a–d) represents the output features of the DHG14, DHG28, Shrec’17 14-class, and Shrec’17 28-class test set respectively. Samples of the same color correspond to the same hand gesture class, and each node represents a sample feature output by DHGCN.
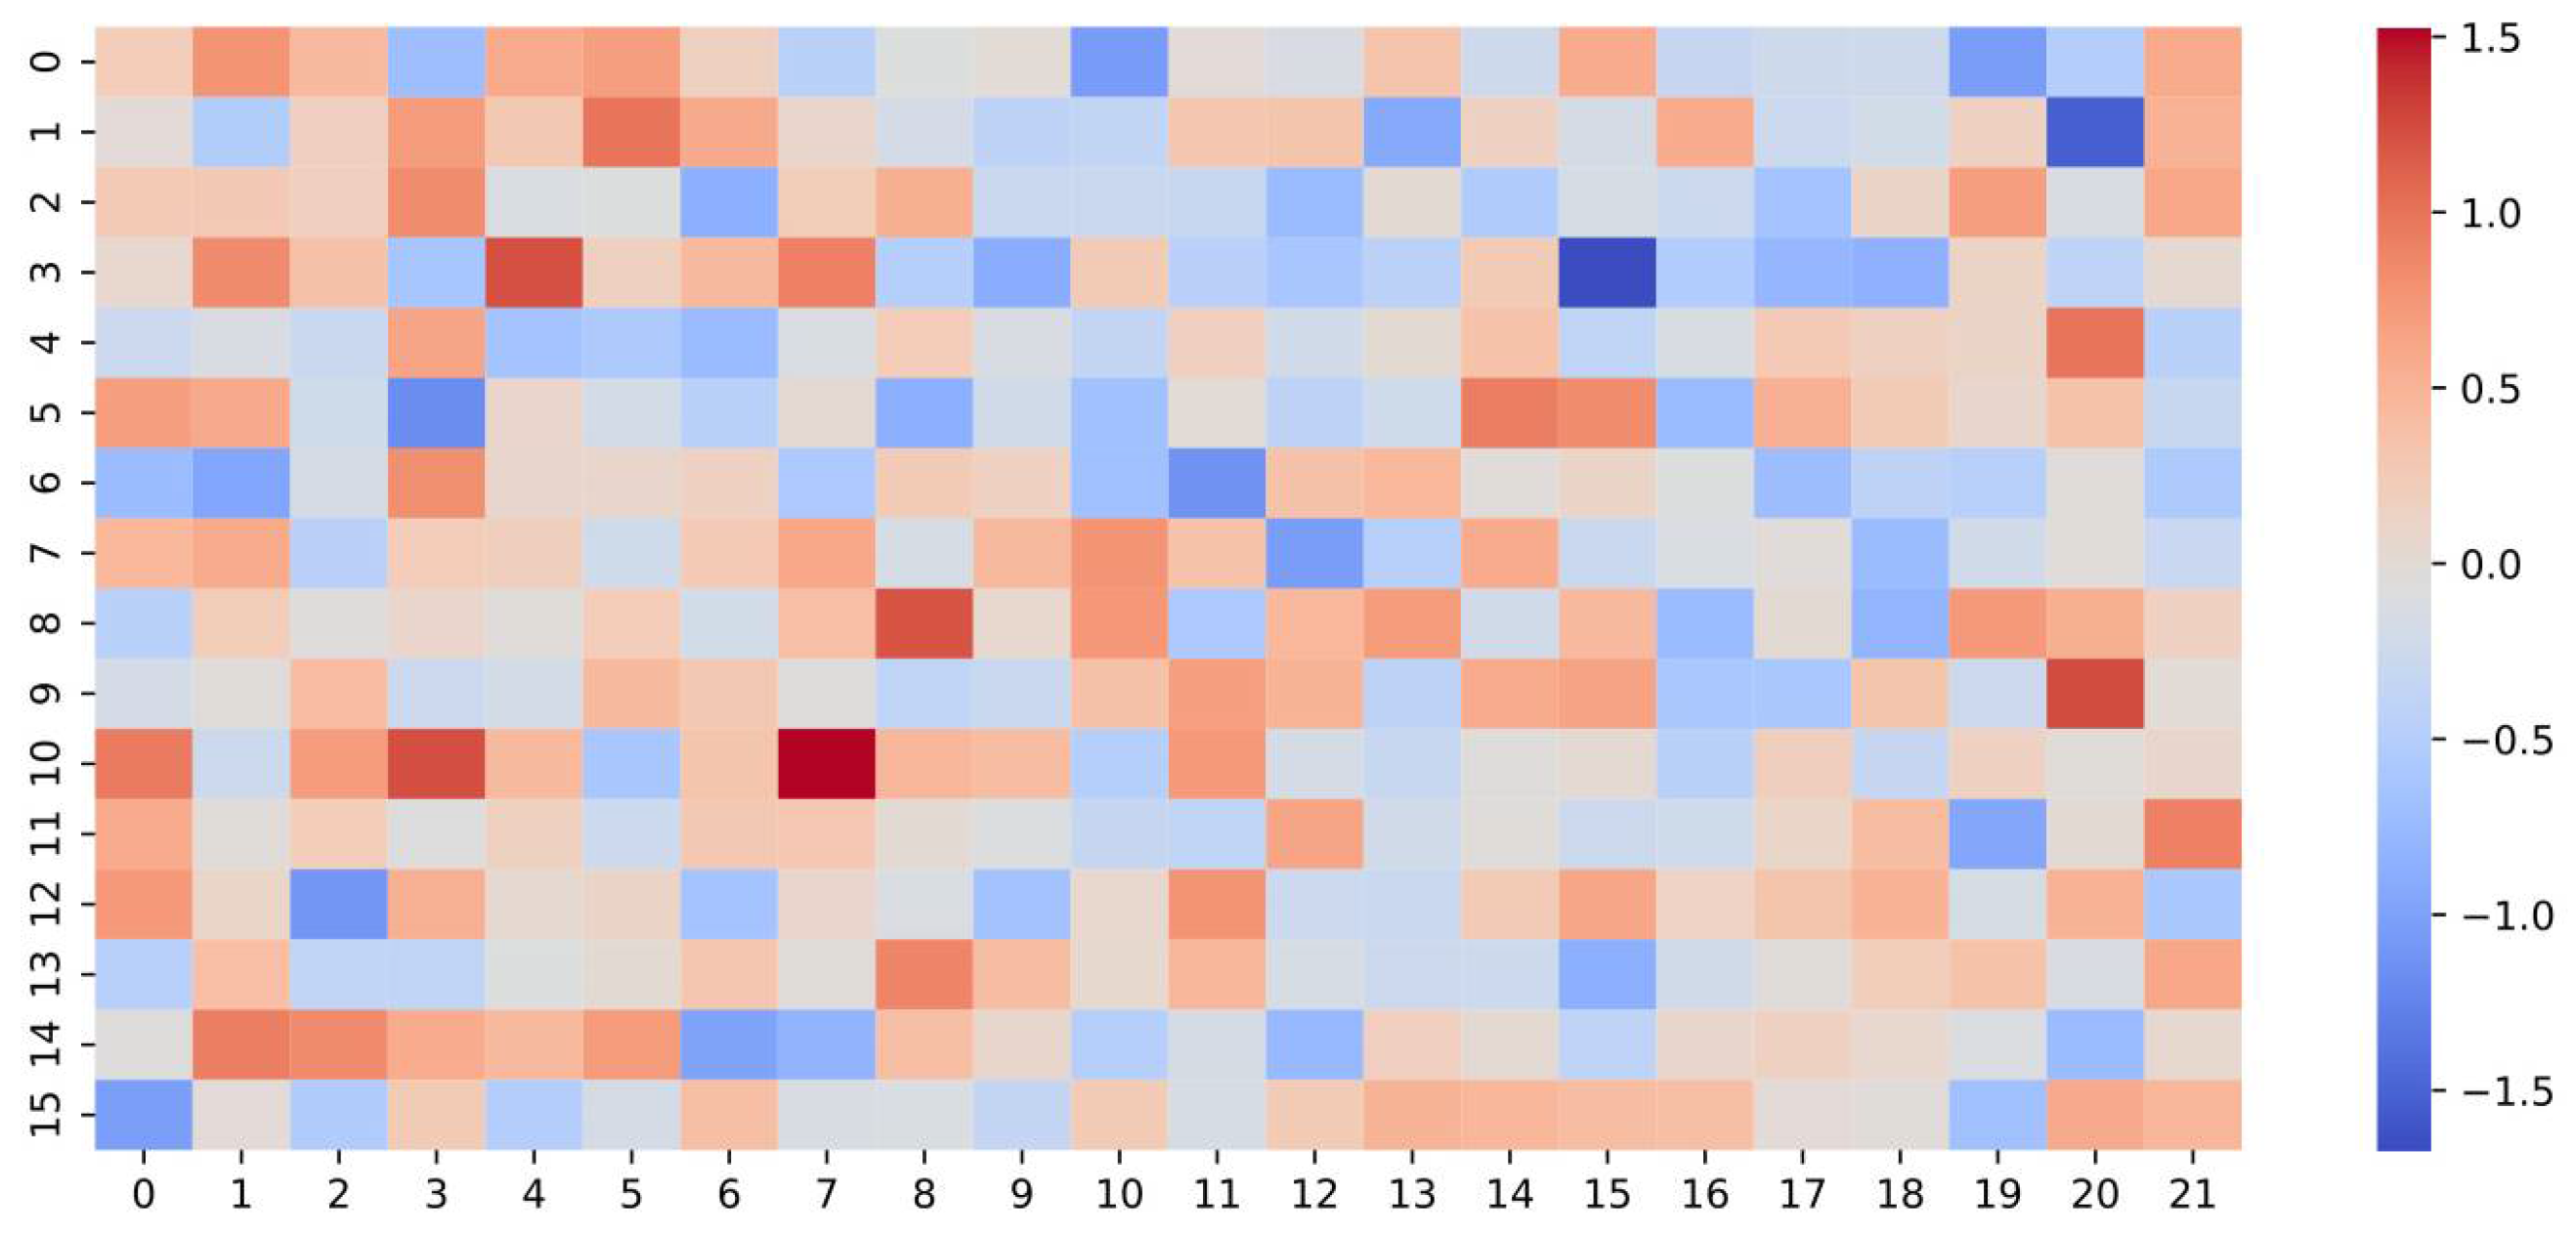
Figure 9 shows a heatmap visualization of the first-layer incidence matrix learned by the DHGCN model. The color gradient—from blue (indicating low values) to red (indicating high values)—reflects the intensity of connections among nodes within learned hyperedges. These patterns illustrate how DHGCN autonomously identifies and prioritizes meaningful node associations during training. Unlike static, manually designed graphs, the hypergraph structure here is entirely data-driven and dynamically formed based on input features. This adaptive hyperedge aggregation mechanism enables the model to capture complex, high-order structural dependencies that are essential for accurate gesture recognition. The heterogeneous connectivity patterns evident in the heatmap highlight the model’s flexibility and effectiveness in modeling intricate relationships within the data, ultimately contributing to improved feature representations and predictive performance.
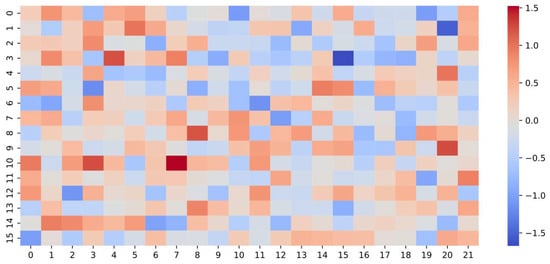
Figure 9.
Heatmap visualization of the first-layer incidence matrix learned by the DHGCN model.
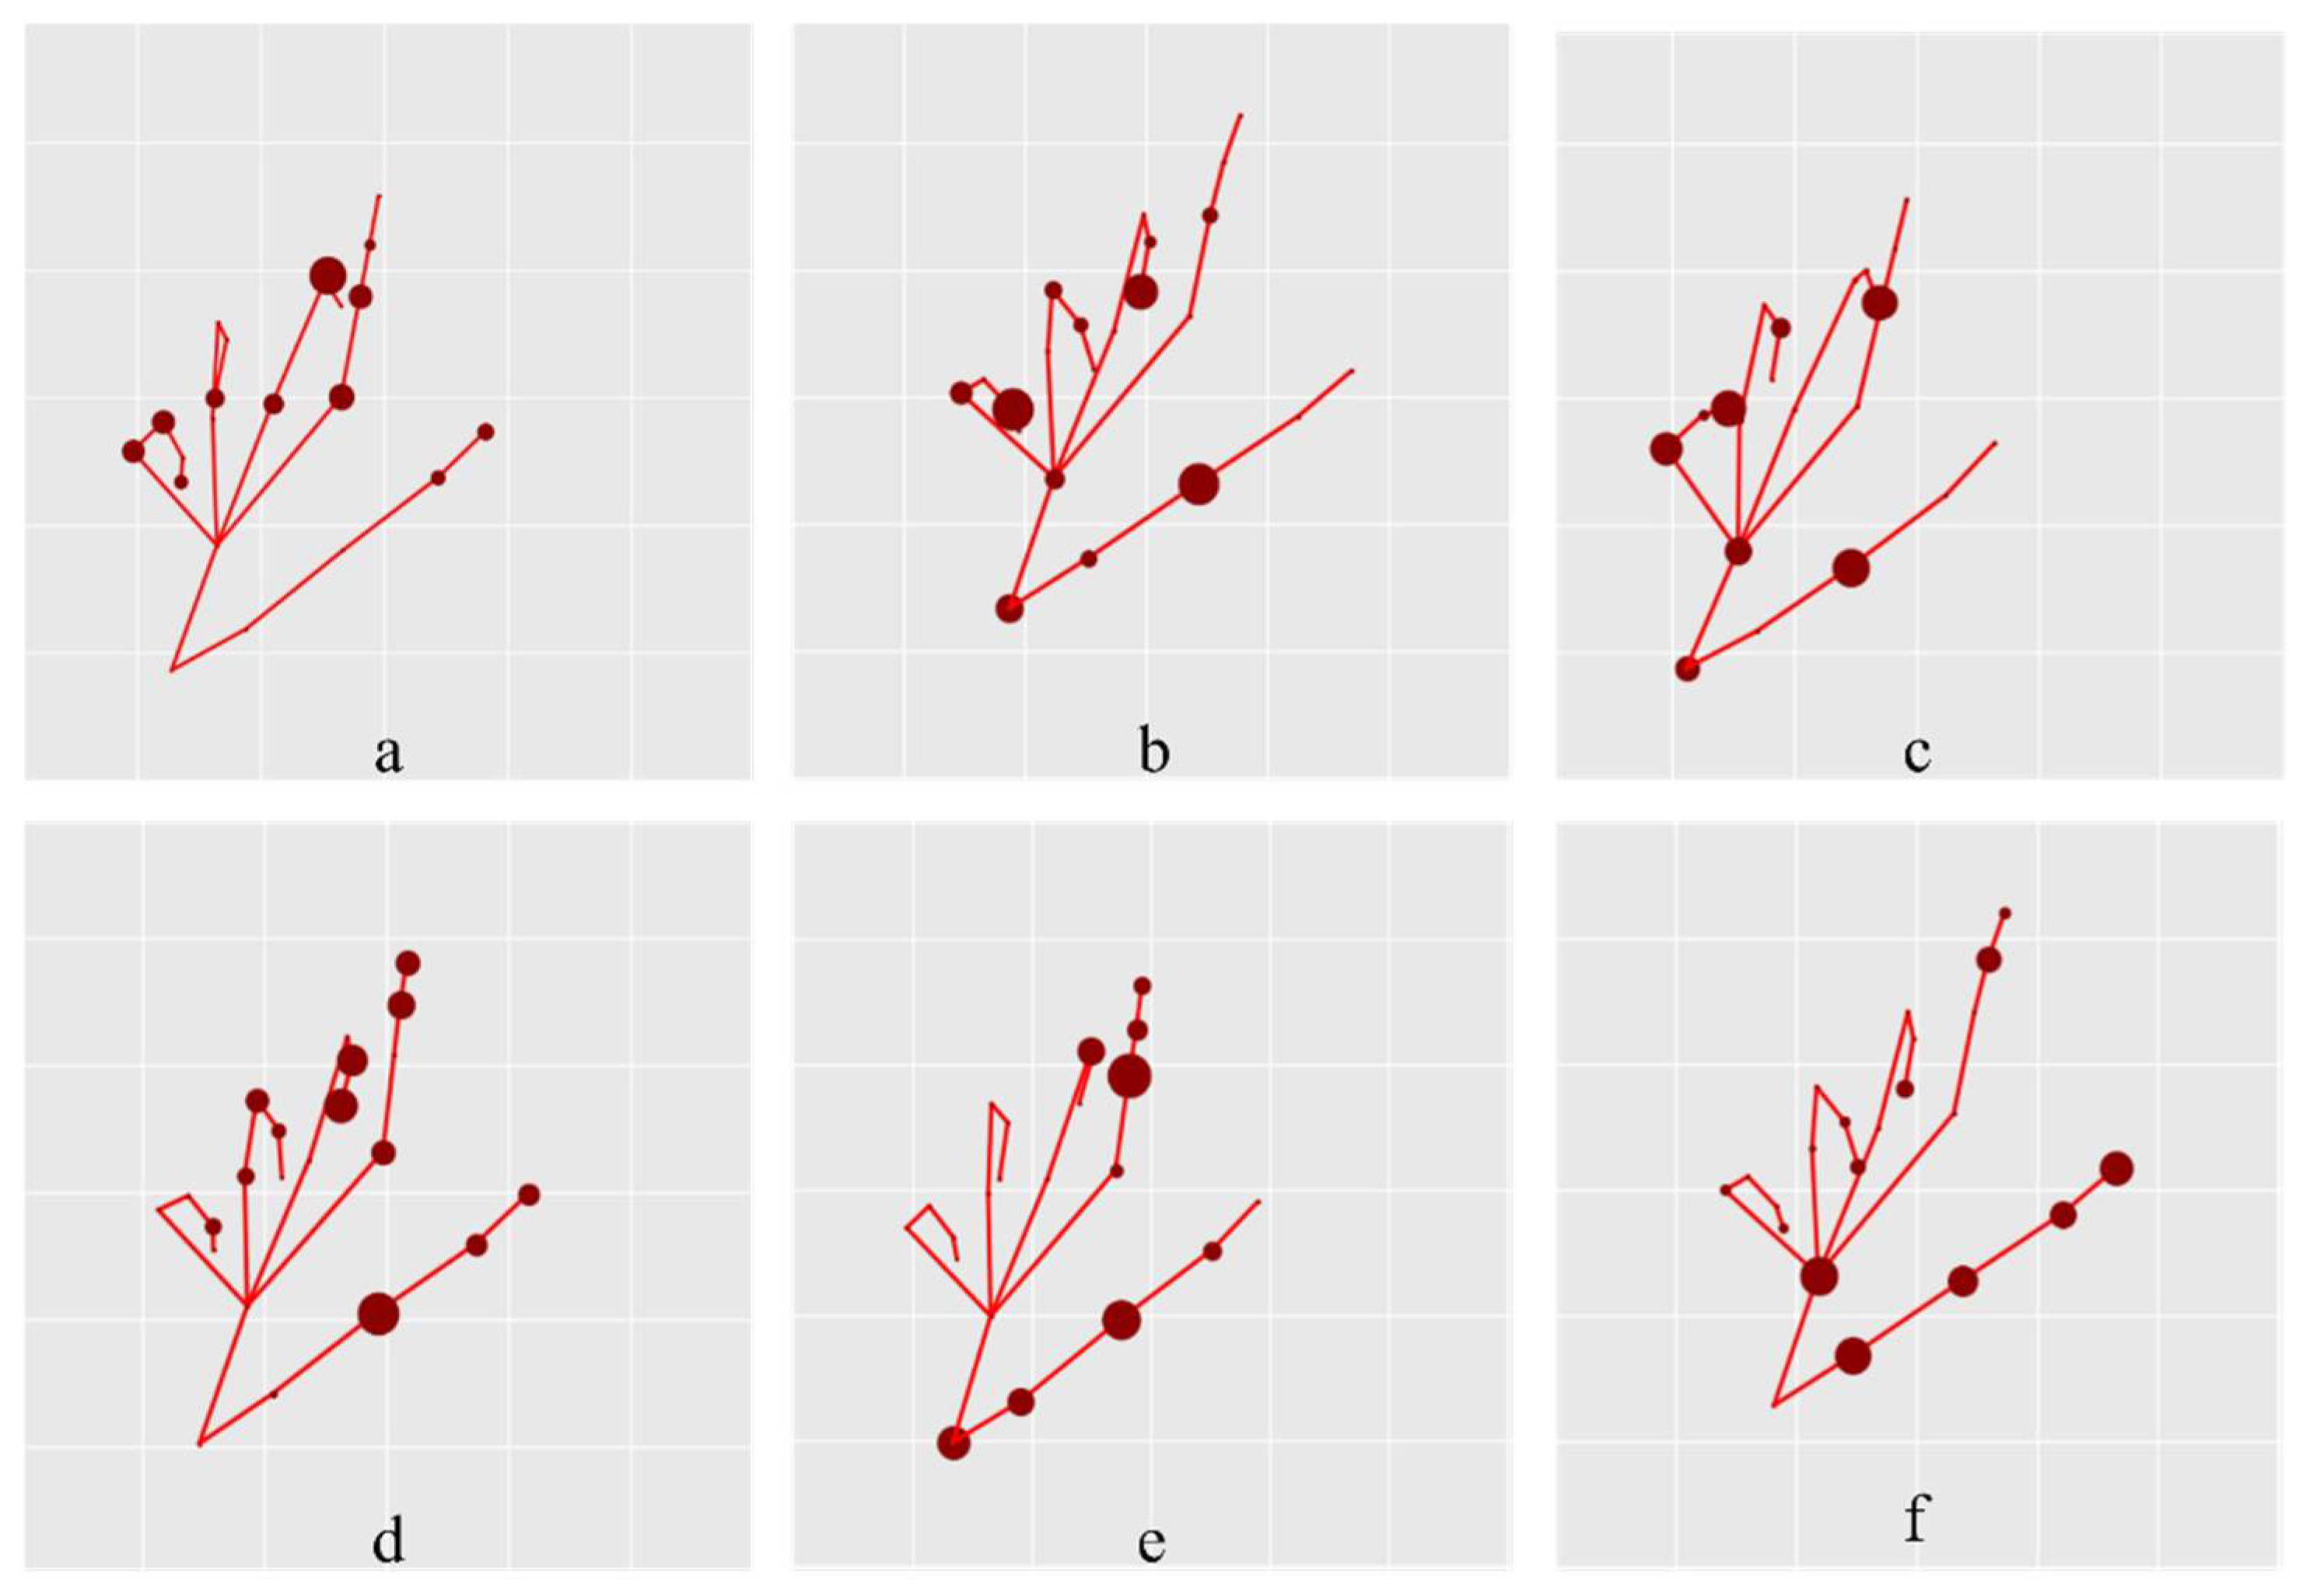
Figure 10 presents a visualization of the hyperedges corresponding to and in the DHGCN model for a sample from the “Grab” gesture category. The red lines indicate the relative positions of hand nodes for reference only and are not part of the learned structure. Each subfigure highlights the nodes connected by a single hyperedge. Figure 10a–c show the shared hyperedge structure , which significantly differs from the manually defined hand-skeleton graph. This contrast illustrates the model’s ability to move beyond static, predefined priors. Comparing Figure 10a–c with Figure 10d–f, which visualize the dynamic graph , reveals that the data-driven structure places greater emphasis on nodes around the thumb and index finger, which are critical for recognizing the “Grab” gesture. This observation suggests that adaptively refines the hypergraph topology based on input data, thereby enhancing the model’s capability for fine-grained gesture interpretation.
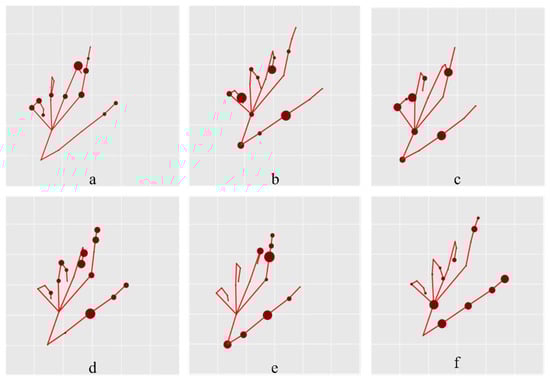
Figure 10.
Visualization of hyperedges corresponding to and for a “Grab” gesture sample in the SHREC’17 dataset. Subfigures (a–c) illustrate the hyperedges formed by , while (d–f) show those generated by . In each subplot, the visible nodes represent those connected within the same hyperedge, with node size indicating their degree of connectivity.
5. Conclusions
This paper proposed a novel hand gesture recognition framework, the DHGCN, which advances beyond traditional graph convolutional methods that are limited to modeling pairwise relationships. By leveraging hypergraph convolution, DHGCN captures higher-order relational features among multiple nodes. A key innovation of this work lies in the use of a data-driven strategy to dynamically initialize and update the hypergraph incidence matrix, thereby constructing adaptive hypergraph structures that reduce dependency on predefined priors and mitigate structural bias. To overcome the homogeneity limitations found in existing multistream fusion approaches, our method introduced multiple DHGCN variants with differing numbers of hyperedges. These variants generate diverse and complementary feature representations, which are then integrated through a voting-based fusion strategy. The voting-based fusion strategy combines prediction results from multiple data streams (e.g., joint, bone, motion, and o-stream) to enhance overall recognition accuracy. Each stream independently produces a prediction vector, which is then weighted according to its reliability or performance. These weighted predictions are summed to generate a final classification output. This approach increases robustness by leveraging diverse features and reducing the impact of noisy or redundant information from any single stream. This design significantly enhances gesture recognition accuracy across multiple benchmark datasets. While this study focused primarily on modeling spatial graph structures, future work could explore incorporating CNN-based methods to preprocess spatial maps or applying hybrid CNN-GCN architectures for early-stage feature extraction, further enriching spatial–temporal representation capabilities. Additionally, a critical avenue for future research is the exploration of initialization strategies for the incidence matrix and degree matrices in the dynamic hypergraph convolution framework. These components have a substantial impact on training dynamics, convergence behavior, and generalization. A combination of rigorous theoretical analysis and comprehensive empirical studies will be essential to uncover optimal configurations. Advancing these aspects will further improve the robustness, interpretability, and general applicability of hypergraph-based learning for dynamic gesture recognition tasks.
Author Contributions
Conceptualization, D.-X.J.; methodology, K.H.; software, K.H.; formal analysis, S.-J.L.; writing—original draft preparation, K.H.; writing—review and editing, S.-J.L. and C.-Y.H.; supervision, Z.Z.; funding acquisition, D.-X.J. All authors have read and agreed to the published version of the manuscript.
Funding
This research was funded by Department of Science and Technology of Hunan Province, grant number 2024JJ7549, Xiangxi Vocational and Technical College for Nationalities, grant number 2024KTZ201, and Department of Education of Hunan Province, grant number 24C1236.
Institutional Review Board Statement
Not applicable.
Informed Consent Statement
Not applicable.
Data Availability Statement
The dataset used in this study is publicly available at SHREC2025-3D Shape Retrieval Challenge 2025. http://www.shrec.net/ (accessed on 5 May 2025). No new data were generated in this research; all analyses were performed using the aforementioned benchmark dataset. For details on data usage and licensing, please refer to the dataset’s official documentation.
Conflicts of Interest
The authors declare no conflicts of interest.
Abbreviations
The following abbreviations are used in this manuscript:
| Abbreviation | Full Term |
| CNN | Convolutional Neural Network |
| CTR-GCN | Channel-wise Topology Refinement Graph Convolutional Network |
| DG-GCN | Dynamic Graph Convolutional Network |
| DHGCN | Dynamic Hypergraph Convolutional Network |
| FC | Fully Connected |
| GCN | Graph Convolutional Network |
| GCNs | Graph Convolutional Networks |
| HD-GCN | Hierarchically Decomposed Graph Convolutional Network |
| HGCN | Hypergraph Convolutional Network |
| HGCNs | Hypergraph Convolutional Networks |
| HCI | Human–Computer Interaction |
| MSTC | Multiscale Temporal Convolution |
| RGB | Red, Green, Blue |
| RNN | Recurrent Neural Network |
| SGD | Stochastic Gradient Descent |
| ST-GCN | Spatial–Temporal Graph Convolutional Network |
| TD-GCN | Temporal Difference Graph Convolutional Network |
References
- Gu, Y.; Xu, Y.; Shen, Y.; Huang, H.; Liu, T.; Jin, L.; Ren, H.; Wang, J. A review of hand function rehabilitation systems based on hand motion recognition devices and artificial intelligence. Brain Sci. 2022, 12, 1079. [Google Scholar] [CrossRef] [PubMed]
- Ohn-Bar, E.; Trivedi, M.M. Hand gesture recognition in real time for automotive interfaces: A multimodal vision-based approach and evaluations. IEEE Trans. Intell. Transp. Syst. 2014, 15, 2368–2377. [Google Scholar] [CrossRef]
- Qi, J.; Ma, L.; Cui, Z.; Yu, Y. Computer vision-based hand gesture recognition for human-robot interaction: A review. Complex Intell. Syst. 2024, 10, 1581–1606. [Google Scholar] [CrossRef]
- Peng, S.H.; Tsai, P.H. An efficient graph convolution network for skeleton-based dynamic hand gesture recognition. IEEE Trans. Cogn. Dev. Syst. 2023, 15, 2179–2189. [Google Scholar] [CrossRef]
- Okano, M.; Liu, J.Q.; Tateyama, T.; Chen, Y.W. DHGD: Dynamic Hand Gesture Dataset for Skeleton-Based Gesture Recognition and Baseline Evaluations. In Proceedings of the 2024 IEEE International Conference on Consumer Electronics (ICCE), Las Vegas, NV, USA, 6–8 January 2024; pp. 1–4. [Google Scholar] [CrossRef]
- Jacob, M.G.; Wachs, J.P.; Packer, R.A. Hand-gesture-based sterile interface for the operating room using contextual cues for the navigation of radiological images. J. Am. Med. Inform. Assoc. 2013, 20, e183–e186. [Google Scholar] [CrossRef] [PubMed]
- Bulugu, I. Adaptive shift graph convolutional neural network for hand gesture recognition based on 3D skeletal similarity. SIViP 2024, 18, 7583–7595. [Google Scholar] [CrossRef]
- Köpüklü, O.; Gunduz, A.; Kose, N.; Rigoll, G. Real-time Hand Gesture Detection and Classification Using Convolutional Neural Networks. In Proceedings of the 2019 14th IEEE International Conference on Automatic Face & Gesture Recognition (FG 2019), Lille, France, 14–18 May 2019; pp. 1–8. [Google Scholar] [CrossRef]
- Strezoski, G.; Stojanovski, D.; Dimitrovski, I.; Madjarov, G. Hand Gesture Recognition Using Deep Convolutional Neural Networks. In ICT Innovations 2016, Advances in Intelligent Systems and Computing; Stojanov, G., Kulakov, A., Eds.; Springer: Cham, Switzerland, 2016; Volume 665, pp. 51–61. [Google Scholar] [CrossRef]
- Chen, X.; Guo, H.; Wang, G.; Zhang, L. Motion Feature Augmented Recurrent Neural Network for Skeleton-Based Dynamic Hand Gesture Recognition. In Proceedings of the 2017 IEEE International Conference on Image Processing (ICIP), Beijing, China, 17–20 September 2017; pp. 2881–2885. [Google Scholar] [CrossRef]
- Lai, K.; Yanushkevich, S.N. CNN+RNN depth and skeleton based dynamic hand gesture recognition. In Proceedings of the 2018 24th International Conference on Pattern Recognition (ICPR), Beijing, China, 20–24 August 2018; pp. 3451–3456. [Google Scholar] [CrossRef]
- Devineau, G.; Moutarde, F.; Xi, W.; Yang, J. Deep Learning for Hand Gesture Recognition on Skeletal Data. In Proceedings of the 2018 13th IEEE International Conference on Automatic Face & Gesture Recognition (FG 2018), Xi’an, China, 15–19 May 2018; pp. 106–113. [Google Scholar] [CrossRef]
- Lee, J.; Lee, M.; Lee, D.; Lee, S. Hierarchically decomposed graph convolutional networks for skeleton-based action recognition. In Proceedings of the 2023 IEEE/CVF International Conference on Computer Vision (ICCV), Paris, France, 1–6 October 2023; pp. 10410–10419. [Google Scholar] [CrossRef]
- Niepert, M.; Ahmed, M.; Kutzkov, K. Learning convolutional neural networks for graphs. In Proceedings of the 33rd International Conference on Machine Learning, Proceedings of Machine Learning Research, New York, NY, USA, 20–22 June 2016; Balcan, M.F., Weinberger, K.Q., Eds.; PMLR: New York, NY, USA; Volume 48, pp. 2014–2023. [Google Scholar]
- Yan, S.; Xiong, Y.; Lin, D. Spatial temporal graph convolutional networks for skeleton-based action recognition. In Proceedings of the AAAI Conference on Artificial Intelligence, New Orleans, LA, USA, 2–7 February 2018; Volume 32. [Google Scholar] [CrossRef]
- He, K.; Zhang, X.; Ren, S.; Sun, J. Deep residual learning for image recognition. In Proceedings of the 2016 IEEE Conference on Computer Vision and Pattern Recognition (CVPR), Las Vegas, NV, USA, 27–30 June 2016; IEEE: Las Vegas, NV, USA, 2016; pp. 770–778. [Google Scholar] [CrossRef]
- Shi, L.; Zhang, Y.; Cheng, J.; Lu, H. Two-stream adaptive graph convolutional networks for skeleton-based action recognition. In Proceedings of the 2019 IEEE/CVF Conference on Computer Vision and Pattern Recognition (CVPR), Long Beach, CA, USA, 15–20 June 2019; pp. 12018–12027. [Google Scholar] [CrossRef]
- Chen, Y.; Zhang, Z.; Yuan, C.; Li, B.; Deng, Y.; Hu, W. Channel-wise topology refinement graph convolution for skeleton-based action recognition. In Proceedings of the 2021 IEEE/CVF International Conference on Computer Vision (ICCV), Montreal, QC, Canada, 10–17 October 2021; pp. 13339–13348. [Google Scholar] [CrossRef]
- Liu, J.; Wang, X.; Wang, C.; Gao, Y.; Liu, M. Temporal decoupling graph convolutional network for skeleton-based gesture recognition. IEEE Trans. Multimed. 2024, 26, 811–823. [Google Scholar] [CrossRef]
- Duan, H.; Wang, J.; Chen, K.; Lin, D. DG-STGCN: Dynamic spatial-temporal modeling for skeleton-based action recognition. arXiv 2022, arXiv:2210.05895. [Google Scholar]
- Zhang, C.; Hu, S.; Tang, Z.G.; Chan, T.H.H. Re-revisiting learning on hypergraphs: Confidence interval and subgradient method. In Proceedings of the 34th International Conference on Machine Learning, Sydney, NSW, Australia, 6–11 August 2017; Volume 70, pp. 4026–4034. [Google Scholar]
- Feng, Y.; You, H.; Zhang, Z.; Ji, R.; Gao, Y. Hypergraph neural networks. In Proceedings of the AAAI Conference on Artificial Intelligence, Honolulu, HI, USA, 27 January–1 February 2019; pp. 3558–3565. [Google Scholar] [CrossRef]
- Bai, S.; Zhang, F.; Torr, P.H.S. Hypergraph convolution and hypergraph attention. Pattern Recognit. 2021, 110, 107637. [Google Scholar] [CrossRef]
- De Smedt, Q.; Wannous, H.; Vandeborre, J.P. Skeleton-based dynamic hand gesture recognition. In Proceedings of the 2016 IEEE Conference on Computer Vision and Pattern Recognition Workshops (CVPRW), Las Vegas, NV, USA, 26 June–1 July 2016; pp. 1206–1214. [Google Scholar] [CrossRef]
- De Smedt, Q.; Wannous, H.; Vandeborre, J.-P.; Guerry, J.; Le Saux, B.; Filliat, D. 3D hand gesture recognition using a depth and skeletal dataset. In Eurographics Workshop on 3D Object Retrieval; Pratikakis, I., Dupont, F., Ovsjanikov, M., Eds.; The Eurographics Association: Lyon, France, 2017; pp. 33–38. [Google Scholar] [CrossRef]
- Núñez, J.C.; Cabido, R.; Pantrigo, J.J.; Montemayor, A.S.; Vélez, J.F. Convolutional neural networks and long short-term memory for skeleton-based human activity and hand gesture recognition. Pattern Recognit. 2018, 76, 80–94. [Google Scholar] [CrossRef]
- Nguyen, X.S.; Brun, L.; Lézoray, O.; Bougleux, S. A neural network based on SPD manifold learning for skeleton-based hand gesture recognition. In Proceedings of the 2019 IEEE/CVF Conference on Computer Vision and Pattern Recognition (CVPR), Long Beach, CA, USA, 15–20 June 2019; pp. 12028–12037. [Google Scholar] [CrossRef]
- Liu, J.; Liu, Y.; Wang, Y.; Prinet, V.; Xiang, S.; Pan, C. Decoupled representation learning for skeleton-based gesture recognition. In Proceedings of the 2020 IEEE/CVF Conference on Computer Vision and Pattern Recognition (CVPR), Seattle, WA, USA, 13–19 June 2020; pp. 5750–5759. [Google Scholar] [CrossRef]
- Shi, L.; Zhang, Y.; Cheng, J.; Lu, H. Decoupled spatial-temporal attention network for skeleton-based action-gesture recognition. In Computer Vision—ACCV 2020: 15th Asian Conference on Computer Vision, Revised Selected Papers, Part V, 1st ed.; Ishikawa, H., Liu, C.L., Pajdla, T., Shi, J., Eds.; Springer: Berlin/Heidelberg, Germany, 2021; Volume 12626, pp. 38–53. [Google Scholar] [CrossRef]
- Guo, F.; He, Z.; Zhang, S.; Zhao, X.; Fang, J.; Tan, J. Normalized edge convolutional networks for skeleton-based hand gesture recognition. Pattern Recognit. 2021, 118, 108044. [Google Scholar] [CrossRef]
- Song, J.H.; Kong, K.; Kang, S.J. Dynamic hand gesture recognition using improved spatio-temporal graph convolutional network. IEEE Trans. Circuits Syst. Video Technol. 2022, 32, 6227–6239. [Google Scholar] [CrossRef]
- Huang, X.; Zhou, H.; Wang, J.; Feng, H.; Han, J.; Ding, E.; Wang, J.; Wang, X.; Liu, W.; Feng, B. Graph contrastive learning for skeleton-based action recognition. In Proceedings of the International Conference on Learning Representations (ICLR), Kigali, Rwanda, 1–5 May 2023. [Google Scholar]

Disclaimer/Publisher’s Note: The statements, opinions and data contained in all publications are solely those of the individual author(s) and contributor(s) and not of MDPI and/or the editor(s). MDPI and/or the editor(s) disclaim responsibility for any injury to people or property resulting from any ideas, methods, instructions or products referred to in the content. |
© 2025 by the authors. Licensee MDPI, Basel, Switzerland. This article is an open access article distributed under the terms and conditions of the Creative Commons Attribution (CC BY) license (https://creativecommons.org/licenses/by/4.0/).