Article

Optimizing LoRaWAN Gateway Placement in Urban Environments: A Hybrid PSO-DE Algorithm Validated via HTZ Simulations

by
Kanar Alaa Al-Sammak
1,*,
Sama Hussein Al-Gburi
1,*,
Ion Marghescu
1,
Ana-Maria Claudia Drăgulinescu
1,
Cristina Marghescu
1,
Alexandru Martian
1,
Nayef A. M. Alduais
2 and
Nawar Alaa Hussein Al-Sammak
3
1
Faculty of Electronics, Telecommunications and Information Technology, National University of Science and Technology Politehnica Bucharest, 060042 Bucharest, Romania
2
Faculty of Computer Science and Information Technology (FSKTM), Universiti Tun Hussein Onn Malaysia (UTHM), Parit Raja, Batu Pahat, Johor 86400, Malaysia
3
College of Education for Pure Science, University of Kerbala, Karbala 56001, Iraq
*
Authors to whom correspondence should be addressed.
Technologies 2025, 13(6), 256; https://doi.org/10.3390/technologies13060256
Submission received: 22 May 2025 / Revised: 12 June 2025 / Accepted: 15 June 2025 / Published: 17 June 2025

Abstract

:
With rapid advancements in the Internet of Things (IoT), Low-Power Wide-Area Networks (LPWANs) play a crucial role in expanding IoT’s capabilities while using minimal energy. Among the various LPWAN technologies, LoRaWAN (Long-Range Wide-Area Network) is particularly notable for its capacity to enable long-range, low-rate communications with low power needs. This study investigates how to optimize the placement of LoRaWAN gateways by using a combination of Particle Swarm Optimization (PSO) and Differential Evolution (DE). The approach is validated through simulations driven by HTZ to evaluate network performance in urban settings. Centered around the area of the Politehnica University of Bucharest, this research examines how different gateway placements on various floors of a building affect network coverage and packet loss. The experiment employs Adeunis Field Test Devices (FTDs) and Dragino LG308-EC25 gateways, systematically testing two spreading factors, SF7 and SF12, to assess their effectiveness in terms of signal quality and reliability. An innovative optimization algorithm, GateOpt PSODE, is introduced, which combines PSO and DE to optimize gateway placements based on real-time network performance metrics, like the Received Signal Strength Indicator (RSSI), the Signal-to-Noise Ratio (SNR), and packet loss. The findings reveal that strategically positioning gateways, especially on higher floors, significantly improves communication reliability and network efficiency, providing a solid framework for deploying LoRaWAN networks in intricate urban environments.

1. Introduction

IoT is considered a revolution transforming the globe. It entails massive objects linked to the internet that can gather and distribute data [1]. These are smart, primitive devices with wireless sensing and embedded communication functions [2]. There are intelligent and networked devices in an IoT ecosystem that include but are not limited to processors, sensors, and communication gadgets that work harmoniously to obtain, relay, and act on the information that they receive [3]. IoT sensor devices transport telemetric data via an IoT gateway or other edge devices to the cloud for either remote or local data analysis [3]. IoT and Wireless Sensor Networks (WSNs) are both integral in this wave of technologies [4]. This has made LPWANs the network of choice when it comes to implementing IoT, because they guarantee long-range communication and low power consumption [5]. LPWAN was developed to allow for long-range communications at a low data rate and with low energy consumption. Hence, LPWAN devices are low-complexity long-range devices. LPWAN works either in license-free frequency bands or in licensed frequency (cellular) bands [6]. Since the rise of IoT, LPWAN devices have become highly available to both industrial and commercial users. End devices are so commonly integrated in our society that they have become ubiquitous. A few examples include smart meters and temperature and humidity sensors. LoRaWAN, the most popular LPWAN, has been in existence since 2015 and has rapidly penetrated the market, with a growing number of applications on the Internet of Things, which have included significant features such as security and two-way communication and even localization services. While Semtech is the major manufacturer of LoRa chips, some manufacturers have a license to produce them (e.g., Microchip) or collaborate with Semtech (e.g., ST Microelectronics). Alternatively, manufacturers may develop a LoRa module based on a chip from Semtech [7]. LoRaWAN operates at 868 MHz in Europe and 915 MHz in North America in the sub-GHz Industrial, Scientific, and Medical (ISM) frequency bands [8]. The purpose of a LoRaWAN network is to send or receive information from a considerably large area using low power. LoRa is the physical layer, while LoRaWAN is the Medium Access Control (MAC) layer that adopts a star topology to permit communication between multiple end equipment and the network gateway [9]. Understanding key principles is still needed, as network characteristics should be studied from the point of view of environmental, physical, and meteorological factors [10]. Well-defined space and time series measurements must be undertaken, as they would assist in the representation and understanding of complex and varying parameters of real natural or artificial environments [11]. LoRa technology utilizes a modulation scheme known as Chirp Spread Spectrum (CSS), which is designed to permit strong, long-range communication while maintaining low power consumption, so LoRaWAN provides higher performance when the tradeoff between coverage and power consumption is considered. In CSS, data is transmitted using chirping signals, which are time-varying frequency signals that decrease or increase in frequency over time for LP. This modulation is resilient to noise and interference, which makes LoRa ideal as a PHY for LoRaWAN [12]. LoRa receiver sensitivity, which makes out its capability to reveal weak signals, depends on the spreading factor (SF) [13]. The SF determines the number of bits per symbol in the signal, affecting the tradeoff between the data rate and the range. Six spreading factors, ranging from SF7 to SF12, are supported by LoRaWAN, where a high level of data is provided by SF7, but the range is shortest, while the range is longest with SF12, but the data rate is lowest [14]. When the spreading factor increases, the signal takes more time in the air, which increases the sensitivity of the receiver (by increasing the energy per bit) and makes it possible to detect weaker signals. Adaptability makes LoRa a flexible solution for IoT applications, requiring changeable communication distances and network conditions [15].

Motivation and Contributions

The network deployment of LoRaWAN in urban environments leads to several challenges, mainly in gateway placement optimization terms to enhance coverage, reduce the loss of packets, and maintain high signal quality. This research investigates LoRaWAN devices’ performance under configuration with two spreading factors, SF7 and SF12. SF7 was chosen due to its higher data rate feature, which makes it suitable for environments where faster data transmission and shorter communication distances are required. SF12, on the other hand, operates at a lower data rate and provides reliable communication over long distances and in difficult environments. This makes SF12 suitable for obstructing environments or where devices are far from the gateway.
Additionally, this research addresses complex challenges such as signal obstruction and multipath fading, since urban environments are rife with dense infrastructures that block and reflect signals, severely degrading RSSI and SNR. Another challenge which is important is that 868/915 MHz ISM bands are notoriously crowded, leading to signal collisions and subsequent packet losses, a critical challenge for ensuring communication link stability. To face the challenges of designing communication systems based on LoRaWAN, we developed and validated GateOpt PSODE, a novel hybrid algorithm that dynamically optimizes gateway placements by balancing RSSI, SNR, and packet loss. Unlike existing approaches that often focus on single-objective optimizations, such as coverage or cost, our approach provides a real-time, scalable solution tailored to the intricate demands of urban IoT deployments. By integrating extensive HTZ simulations and empirical data, our methodology not only confirms the viability of proposed gateway placements but also offers a robust framework for future deployments, significantly enhancing network reliability and performance in urban settings.
The objectives of this paper are as follows:
  • To develop and implement the GateOpt PSODE algorithm for dynamic and optimal LoRaWAN gateway placement.
  • To evaluate the performance impacts of spreading factors SF7 and SF12 on urban network configurations.
  • To validate the optimization framework using both HTZ-driven simulations and empirical field data.
  • To provide actionable insights and strategic recommendations for effective gateway placements in urban IoT environments.
  • By addressing these objectives, this study contributes significantly to the field of urban IoT networking, offering substantial advancements in both theoretical and practical aspects of network design and deployment.
This paper is organized as follows: Section 2 reviews the related contributions to LoRaWAN gateway placement and strategies for the optimization of LPWAN. Section 3 reveals the research methodology, system architecture, and experimental setup. In Section 4, a discussion will be provided concerning network architecture and hardware components. The aim of Section 5 is to provide an analysis of the software implementation, data management, and hybrid GateOpt PSODE algorithm results. Section 6 presents experimental results that include RSSI, SNR, and packet loss analyses along with HTZ simulation validation. Finally, this study concludes with Section 7, which is devoted to recommendations aimed at the deployment of urban IoT.

2. Related Work

The development of efficient network architectures is pivotal in advancing IoT, particularly through the optimization of network protocols and deployment strategies in LPWAN. This section reviews relevant studies focusing on LoRaWAN, which is critical for enhancing IoT connectivity in urban and complex environmental settings. Several studies have emphasized the importance of strategic gateway placement to enhance LoRaWAN coverage and performance. Savithi et al. [16] explore the optimization of LoRaWAN gateway placement by balancing system costs and bitrate maximization. Citoni et al. [17] analyze packet loss in LoRaWAN networks, finding that proper gateway spacing enhances performance and that using SF11 and SF12 decreases packet delivery rates in denser networks. In [18], the authors explore the effectiveness of LoRa/LoRaWAN technology in IoT networks through experiments in both indoor and outdoor settings. They confirm that LoRa performance is superior outdoors and note that gateway elevation, ensuring a clear line of sight with IoT nodes, enhances signal quality and extends the communication distance. This study contributes to understanding LoRa’s operational strengths and limitations in different environments. Mikhaylov et al. [19] assess LoRaWAN performance in Brno, Czech Republic, testing over 231 locations with more than 20 gateways, and they found that the nearest gateway provided the strongest signal in only 47% of cases, and they analyze RSSI, SNR variations, and spreading factor distributions in urban settings.
Svertoka et al. [20] explore the potential of LoRaWAN (868 MHz band) for device localization in industrial IoT applications, addressing both its past criticisms and recent advancements. Their study, conducted through measurement campaigns at the Brno University of Technology and the University Politechnica of Bucharest, evaluates LoRaWAN’s feasibility across various indoor and outdoor settings. Findings indicate that a dense deployment of LoRaWAN gateways can achieve meter-level accuracy, making it a viable solution for worker localization in industrial environments. Dawaliby et al. [21] investigated network slicing in LoRa smart city networks, using maximum likelihood estimation to optimize spreading factors and transmission power. Their simulations show improved QoS metrics, like delay, throughput, and energy efficiency, while maintaining reliable and isolated network slices. The authors in [22] examine the effectiveness of LoRaWAN for localization in Industry 5.0 networks, where traditional methods often lack accuracy. Their work includes an analysis of two underground datasets and the development of two innovative k-nearest neighbor (k-NN) algorithms that improve position accuracy by up to 17% through optimized neighbor selection and preprocessing techniques.
Additionally, Cruz et al. [23] present a methodology for optimizing LoRa gateway placement using Evolutionary Particle Swarm Optimization (EPSO) in wooded campus environments. Their study, at the Federal University of Pará, adjusts local propagation models and applies EPSO to maximize coverage and minimize gateway numbers, whereas their simulations confirm that three gateways can effectively cover the campus, achieving the desired reception sensitivity of −108 dBm. In [24], a machine learning ensemble was employed to optimize LoRaWAN gateway placement, enhancing network scalability and efficiency. The authors’ approach includes a constrained K-means algorithm, regression model, and neural network.
The simulation in [25] addresses the overlooked challenge of efficiently planning and deploying LoRa networks, focusing on gateway placement, spreading factor assignment, and power allocation. The problem is formulated as a mixed-integer non-linear optimization problem, and the author develops an approximate algorithm for large-scale network planning. Mendes et al. [26] optimized LoRaWAN gateway placement to minimize power consumption, extend the network lifetime, and enhance spectrum efficiency, demonstrating effective planning for wide-area monitoring systems. Rezazadeh et al. [27] proposed a joint gateway placement and spread factor assignment framework for LoRaWAN in smart cities, addressing challenges of shadow fading in urban environments. Their unsupervised learning-aware greedy algorithm improved network coverage probability by up to 15% compared to traditional methods.
Nyirenda, in his book [28], examined PSO for gateway placement in LoRaWAN networks. Their simulations introduced a modified PSO that incorporates gateway distancing. Table 1 presents a comparison of our hybrid algorithm, GateOpt PSODE, with other works.

3. Methodology and System Overview

This section outlines the methodology used to optimize LoRaWAN gateway placement, including system design, data acquisition, and hybrid optimization. Also, a detailed overview of the experimental setup, hardware components, and network architecture is provided.

3.1. Methodology

This study adopts a systematic approach to optimize LoRaWAN gateway placement in urban environments, combining experimental measurements, clustering analysis, and hybrid optimization algorithms. The methodology is structured into five key stages as in Figure 1:
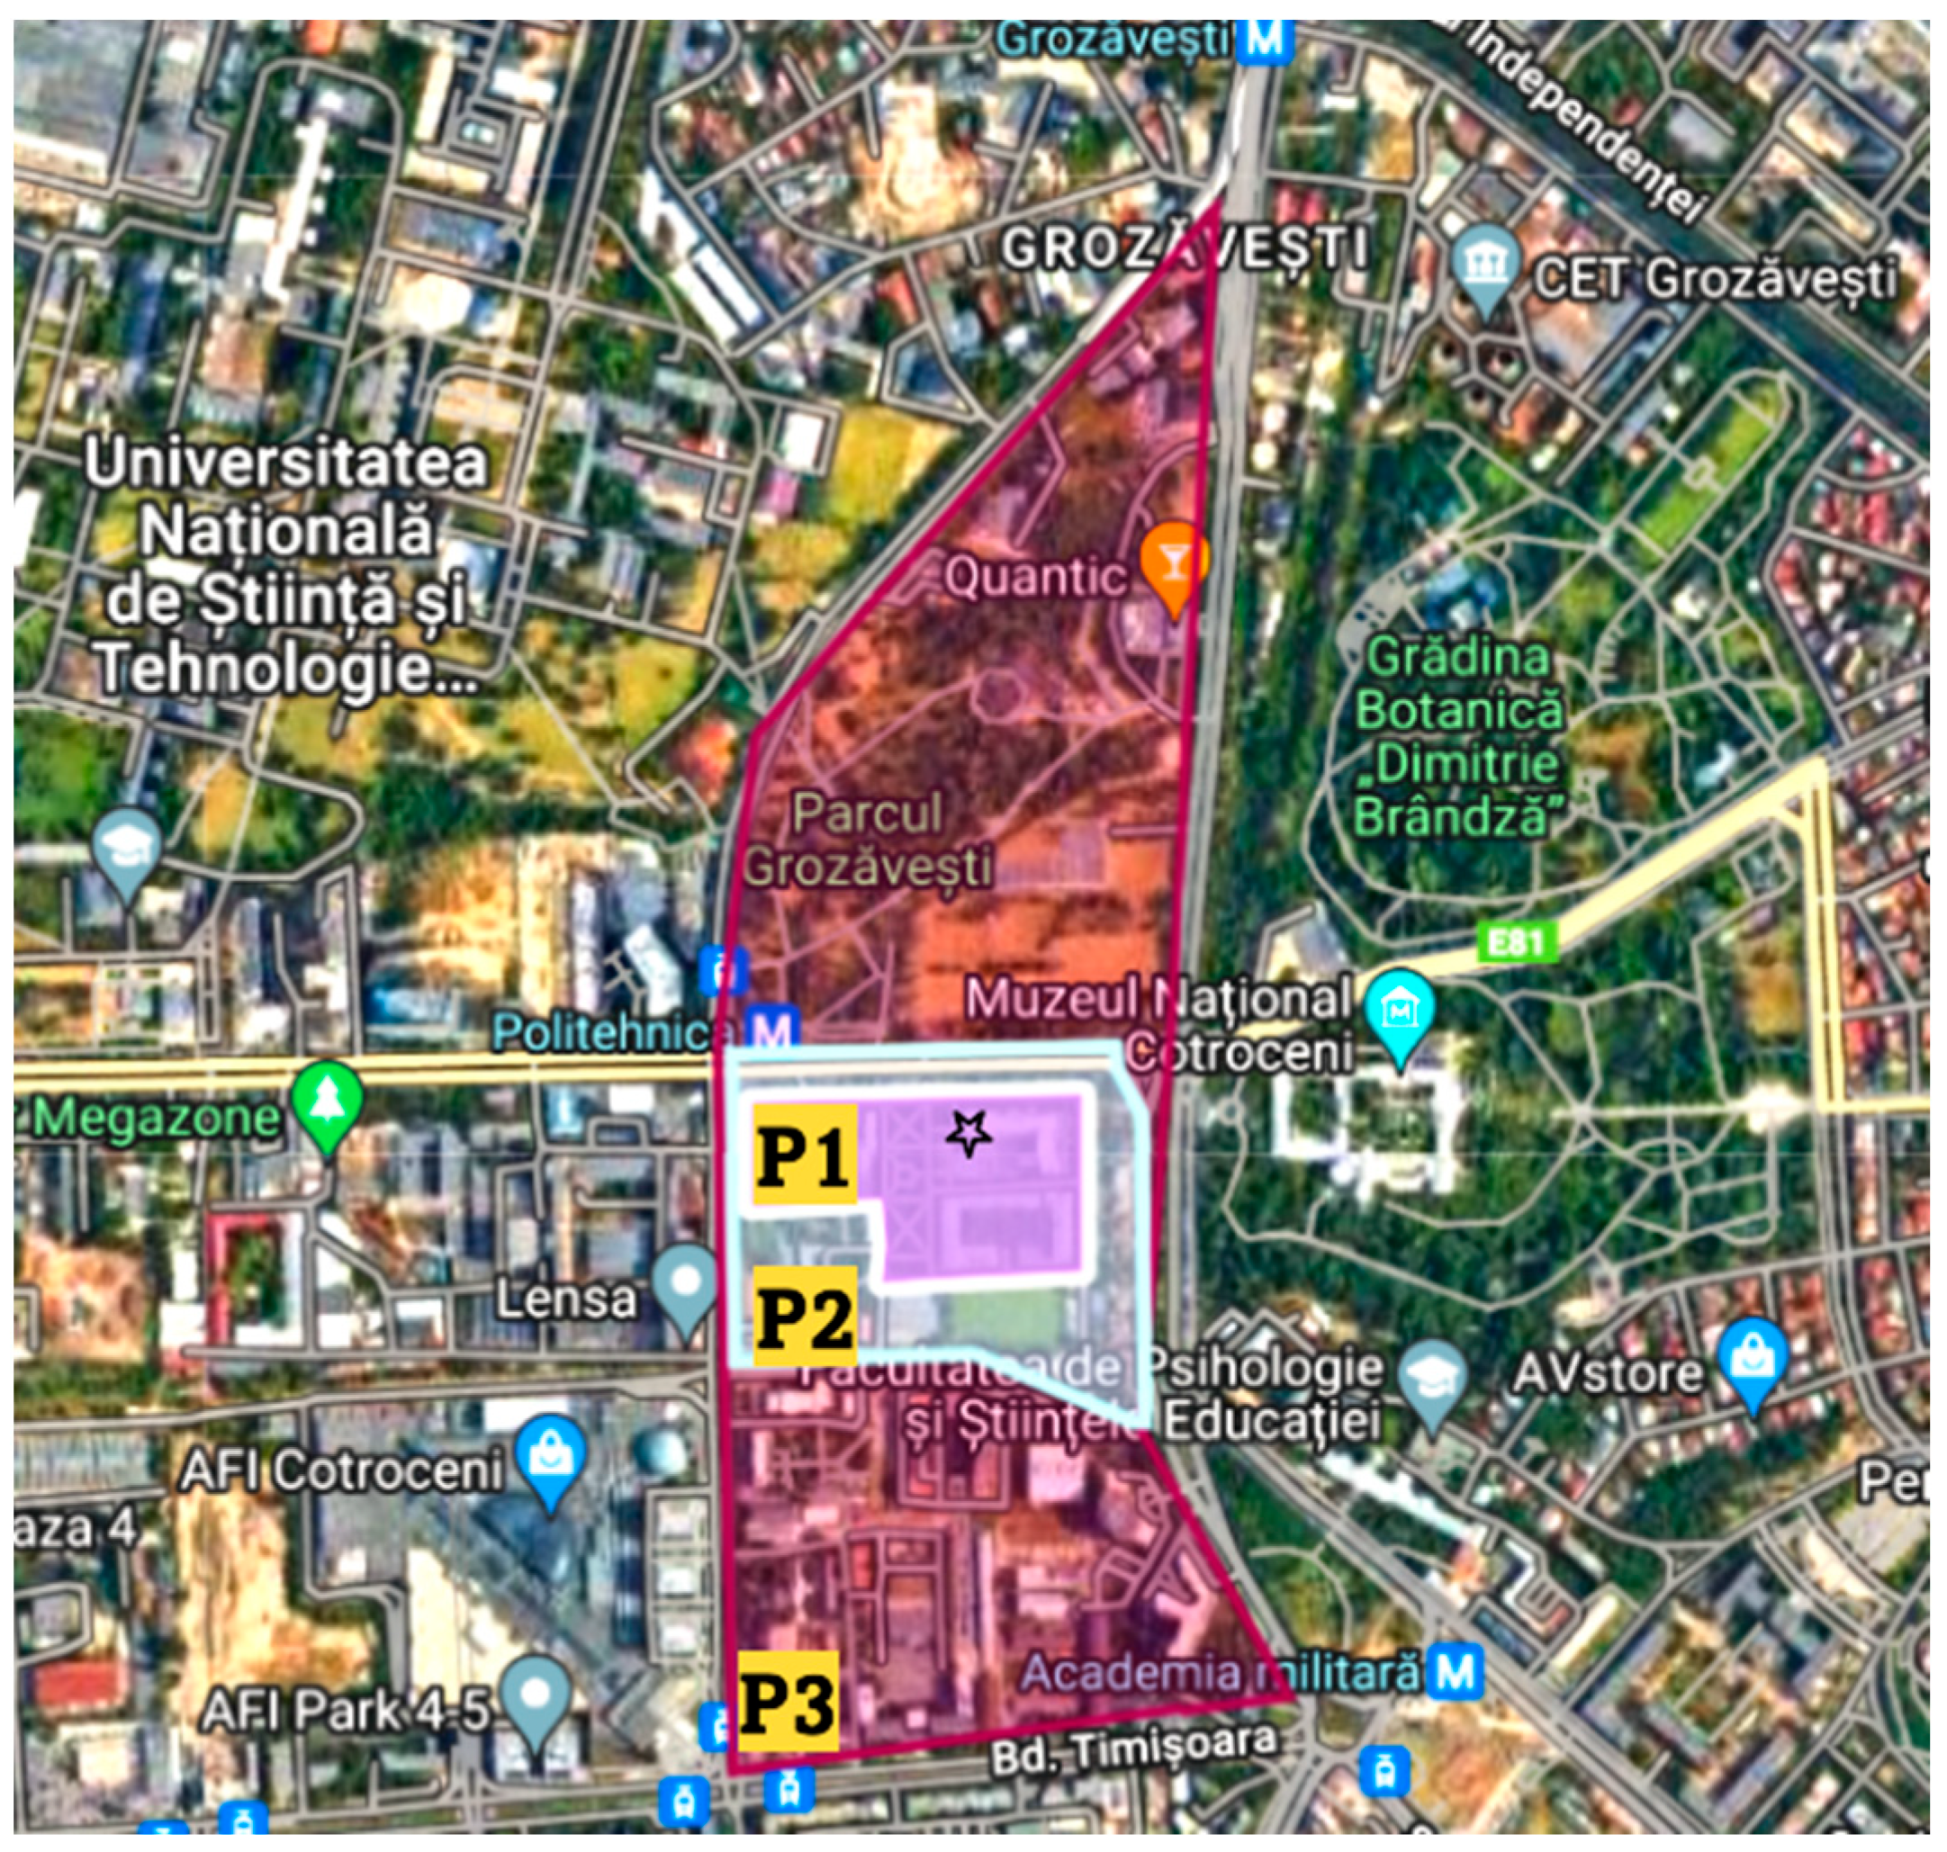
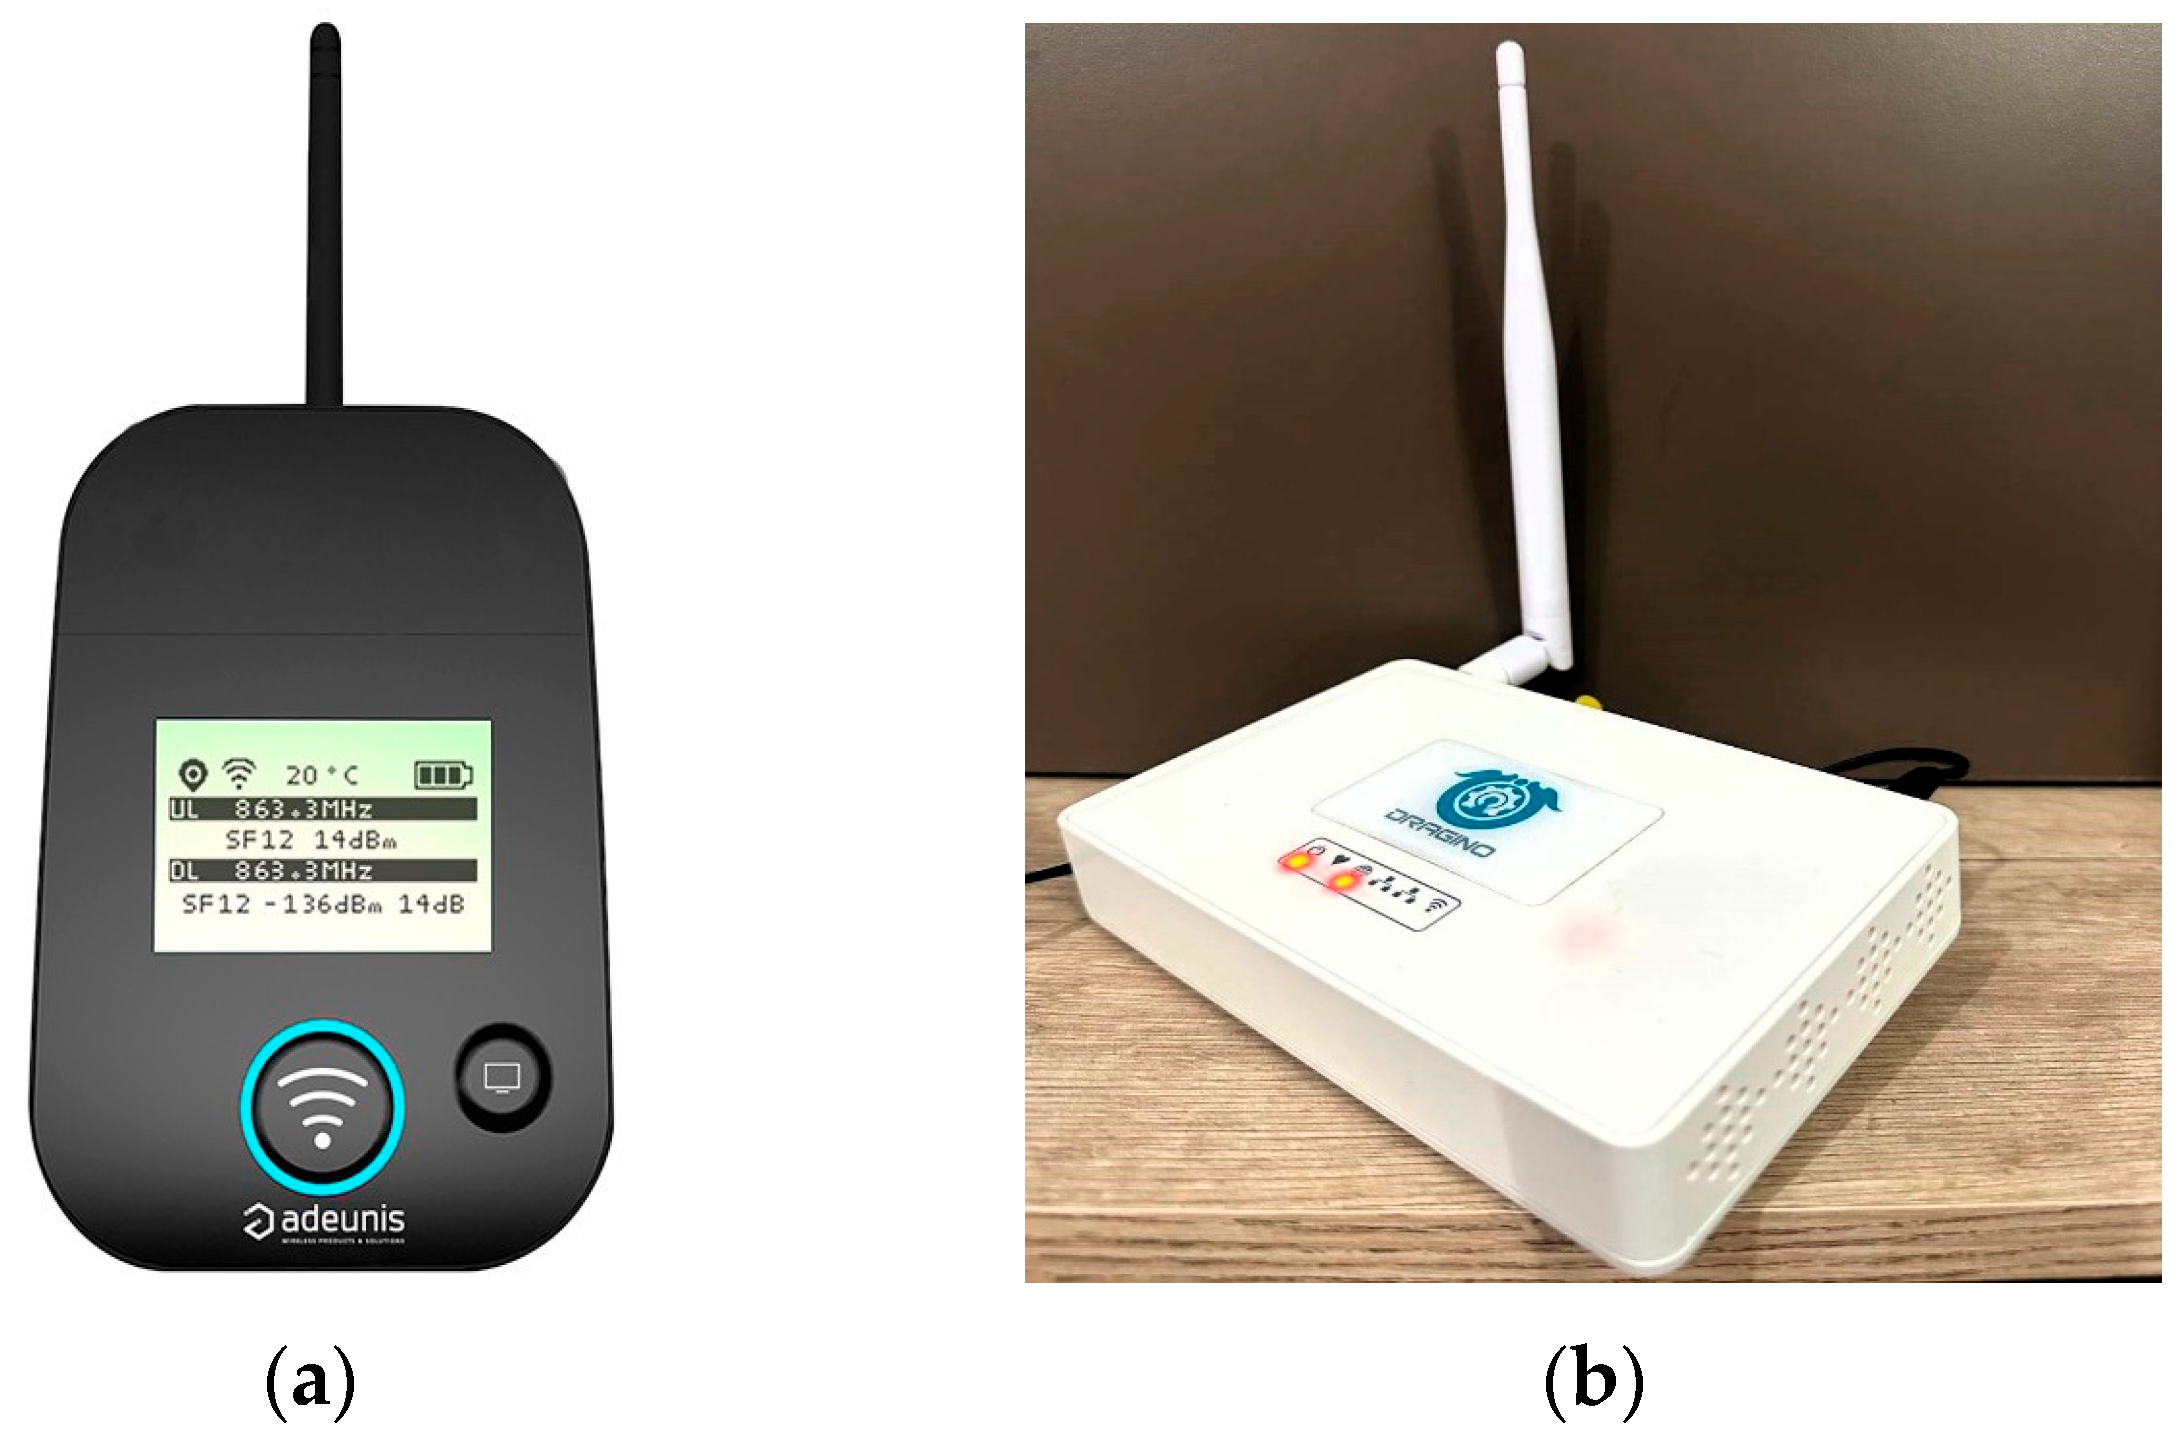
  • Step 1: System Design and Technology Selection: The LoRaWAN configuration in this study operates in the EU868 MHz band, utilizing SF7 for high data rate transmission and SF12 for long-range communication. The hardware selection includes Adeunis Class A/C FTDs for RSSI/SNR measurements, configured with Over-The-Air Activation (OTAA) and 14 dBm transmission power, while Dragino LG308-EC25 gateways with LTE backhaul were strategically placed at five building levels (from the ground to the 9th floor). The experiment was conducted over a 6 h continuous operation, divided into three phases (P1, P2, and P3), in the urban area around Politehnica University of Bucharest, as shown in Figure 2. This location was chosen for its diverse architectural styles and urban infrastructure, including closely packed buildings and open areas, providing a comprehensive environment to assess LoRaWAN performance in dense urban settings.
  • Step 2: System Implementation: In the system implementation, the hardware deployment involved positioning gateways vertically to analyze multi-story signal propagation. The network configuration integrated the setup with The Things Network (TTN) for real-time packet monitoring. The experiment assigned specific roles, where the operator manually triggered packet transmissions using the Adeunis FTD, while the monitor validated data reception on TTN.
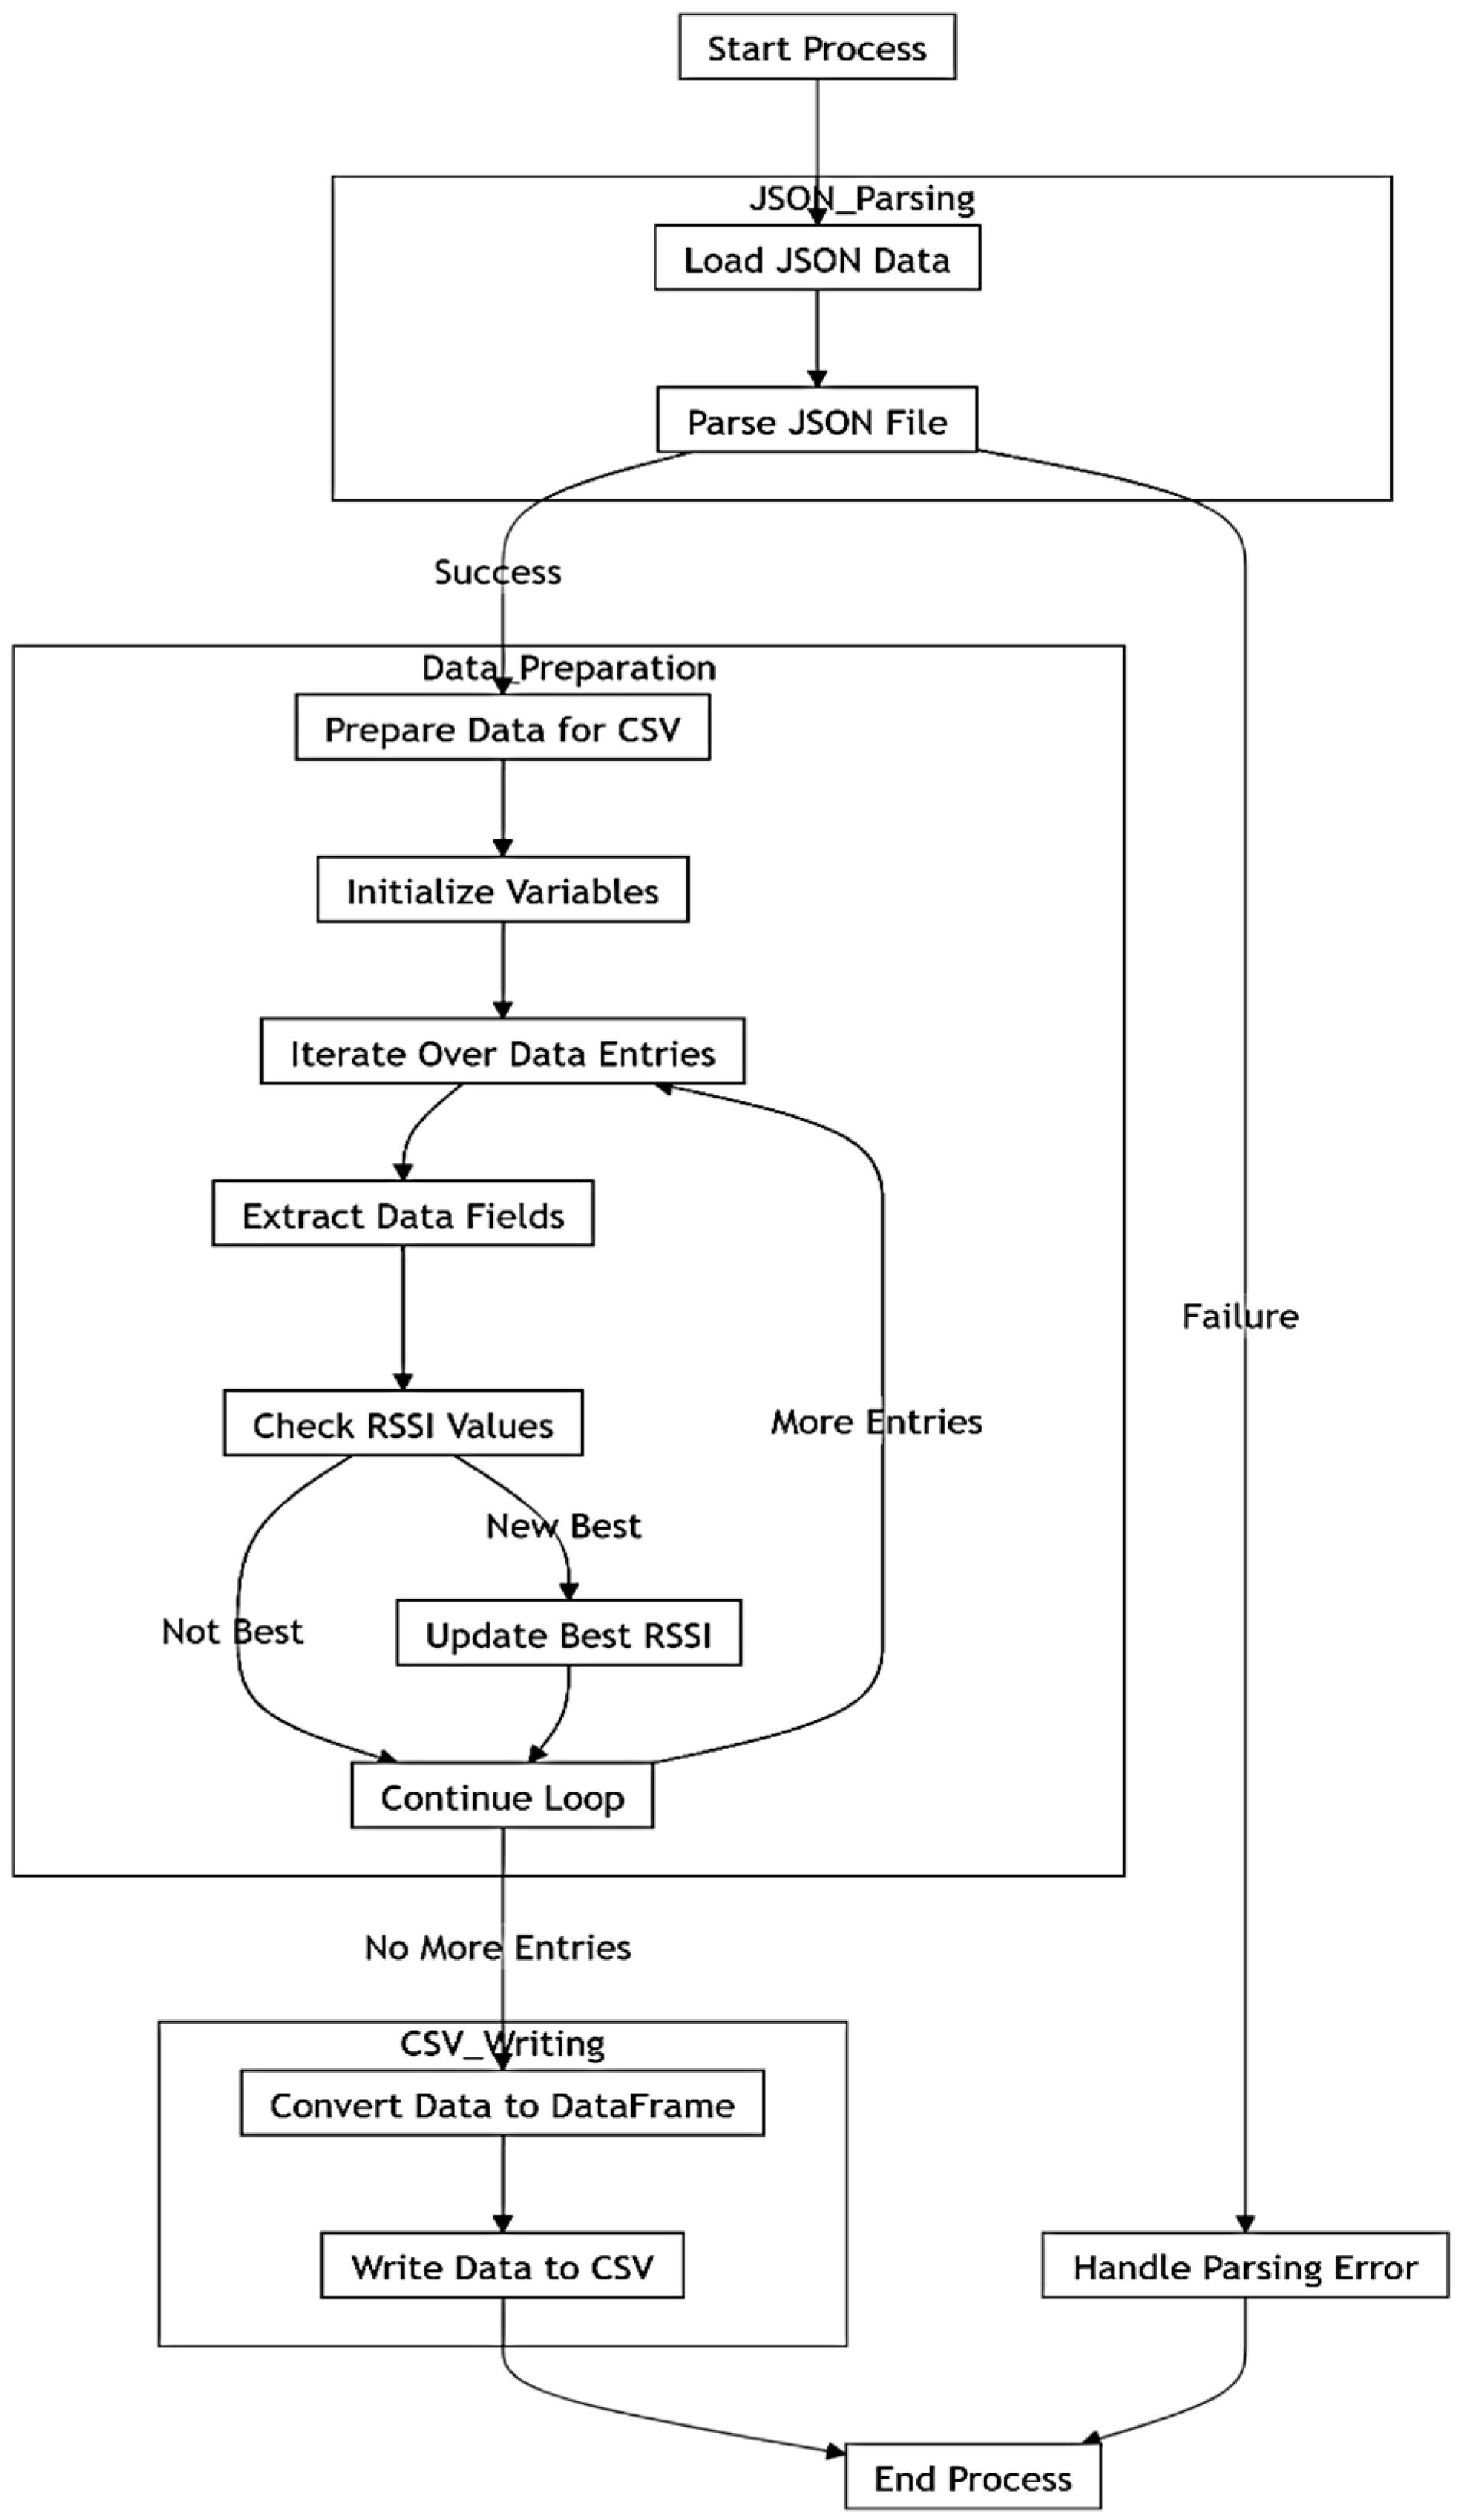
  • Step 3: Data Collection and Preprocessing: In the data collection and preprocessing phase, payload decoding was performed using custom payload formatter in JavaScript, and after that, JSON data was parsed from TTN using Python scripts (PyCharm 2023.2) extracting key metrics, such as RSSI, SNR, GPS, and packet loss. The geodesic distance between devices and gateways was calculated using the geopy library to ensure precise localization. Additionally, K-means clustering was applied, with six clusters for RSSI and seven for SNR, to classify signal quality and analyze network performance more effectively.
  • Step 4: Hybrid Optimization (GateOpt PSODE): In the hybrid optimization (GateOpt PSODE) phase, the objective function aimed at minimizing cost, defined as α·norm(RSSI) + β·norm(SNR) + γ·norm(packet loss). The PSO phase focused on global exploration to initialize the weights (α, β, and γ), ensuring an optimal starting point. Following this, the DE phase performed local refinement through mutation and crossover, enhancing the accuracy and efficiency of the gateway placement optimization.
  • Step 5: Simulation and Validation: In the simulation and validation phase, HTZ Communications was used to simulate urban propagation, applying the ITU-R 1812-6 model for the ground and 3rd floors and the Cost-Hata 231 model for the top floor. The validation process evaluated key metrics, including standard deviation, average error, and correlation between real-world measurements and simulated data, ensuring the accuracy and reliability of the proposed optimization approach.
This work analyzes the possibility of using LoRaWAN technology as smart metering systems, which require robust low-power long-range communication for data collection at utility meters. Our focus concerns a range of regions which include sparsely populated rural locations, small towns, and suburban regions on the periphery of larger cities. These areas have low infrastructure, with smart meters mostly installed outdoors. Gas meters are typically set at approximately one meter’s height, while electricity meters are positioned one to two meters from the ground level. Such installation patterns have considerable consequences for signal propagation in structured environments, such as outdoor-to-indoor or non-line-of-sight (NLoS) conditions. To improve the network coverage and increase ease of deployment, we optimized a scenario where LoRaWAN gateways (GWs) are located on top of tall buildings. By placing GWs on the upper floors of high-rise buildings, signal reach is enhanced while infrastructure clutter is diminished, making it easier to reduce deployment efforts. Figure 2 shows the experimental area, which is marked in the center, near Politehnica University in Bucharest. This site has mixed urban settings, as it contains tall buildings interspersed with other structures along unobstructed pathways for signal transmission. The primary building for GW placement is labeled P1, while the path taken by the mobile end device and all followed paths, including main and secondary transmission paths, are highlighted. For further details pertaining to the measurement points and their spatial distribution, see Figure 11.

3.2. Technology Overview

3.2.1. LoRaWAN Technology

LoRa/LoRaWAN is an open-source technology that can autonomously and cheaply build up a private network without the need for third-party infrastructure [36]. LoRa is used as the physical layer (PHY) of LoRaWAN, with low-energy and long-range capabilities that operate in sub-gigahertz unlicensed radio frequencies. LoRa Alliance developed LoRaWAN, a communication solution, including the MAC protocol for the datalink layer and a network layer based on star architecture [37].
LoRa/LoRaWAN is an LPWAN technology for a battery-operated wireless connection of objects to the internet in regional, national, or worldwide networks that aims at major IoT needs, including two-way communication, end-to-end protection, mobility, and localization. The LoRa physical layer supports long-range communication links, whereas the LoRaWAN protocol principally functions as a protocol to route the data between LoRaWAN gateways and LoRa devices. In the frame of LoRaWAN, one can also manage data rates, communication frequencies, and transmission power for all nodes in the network, which are asynchronous and transmit data on demand [36].
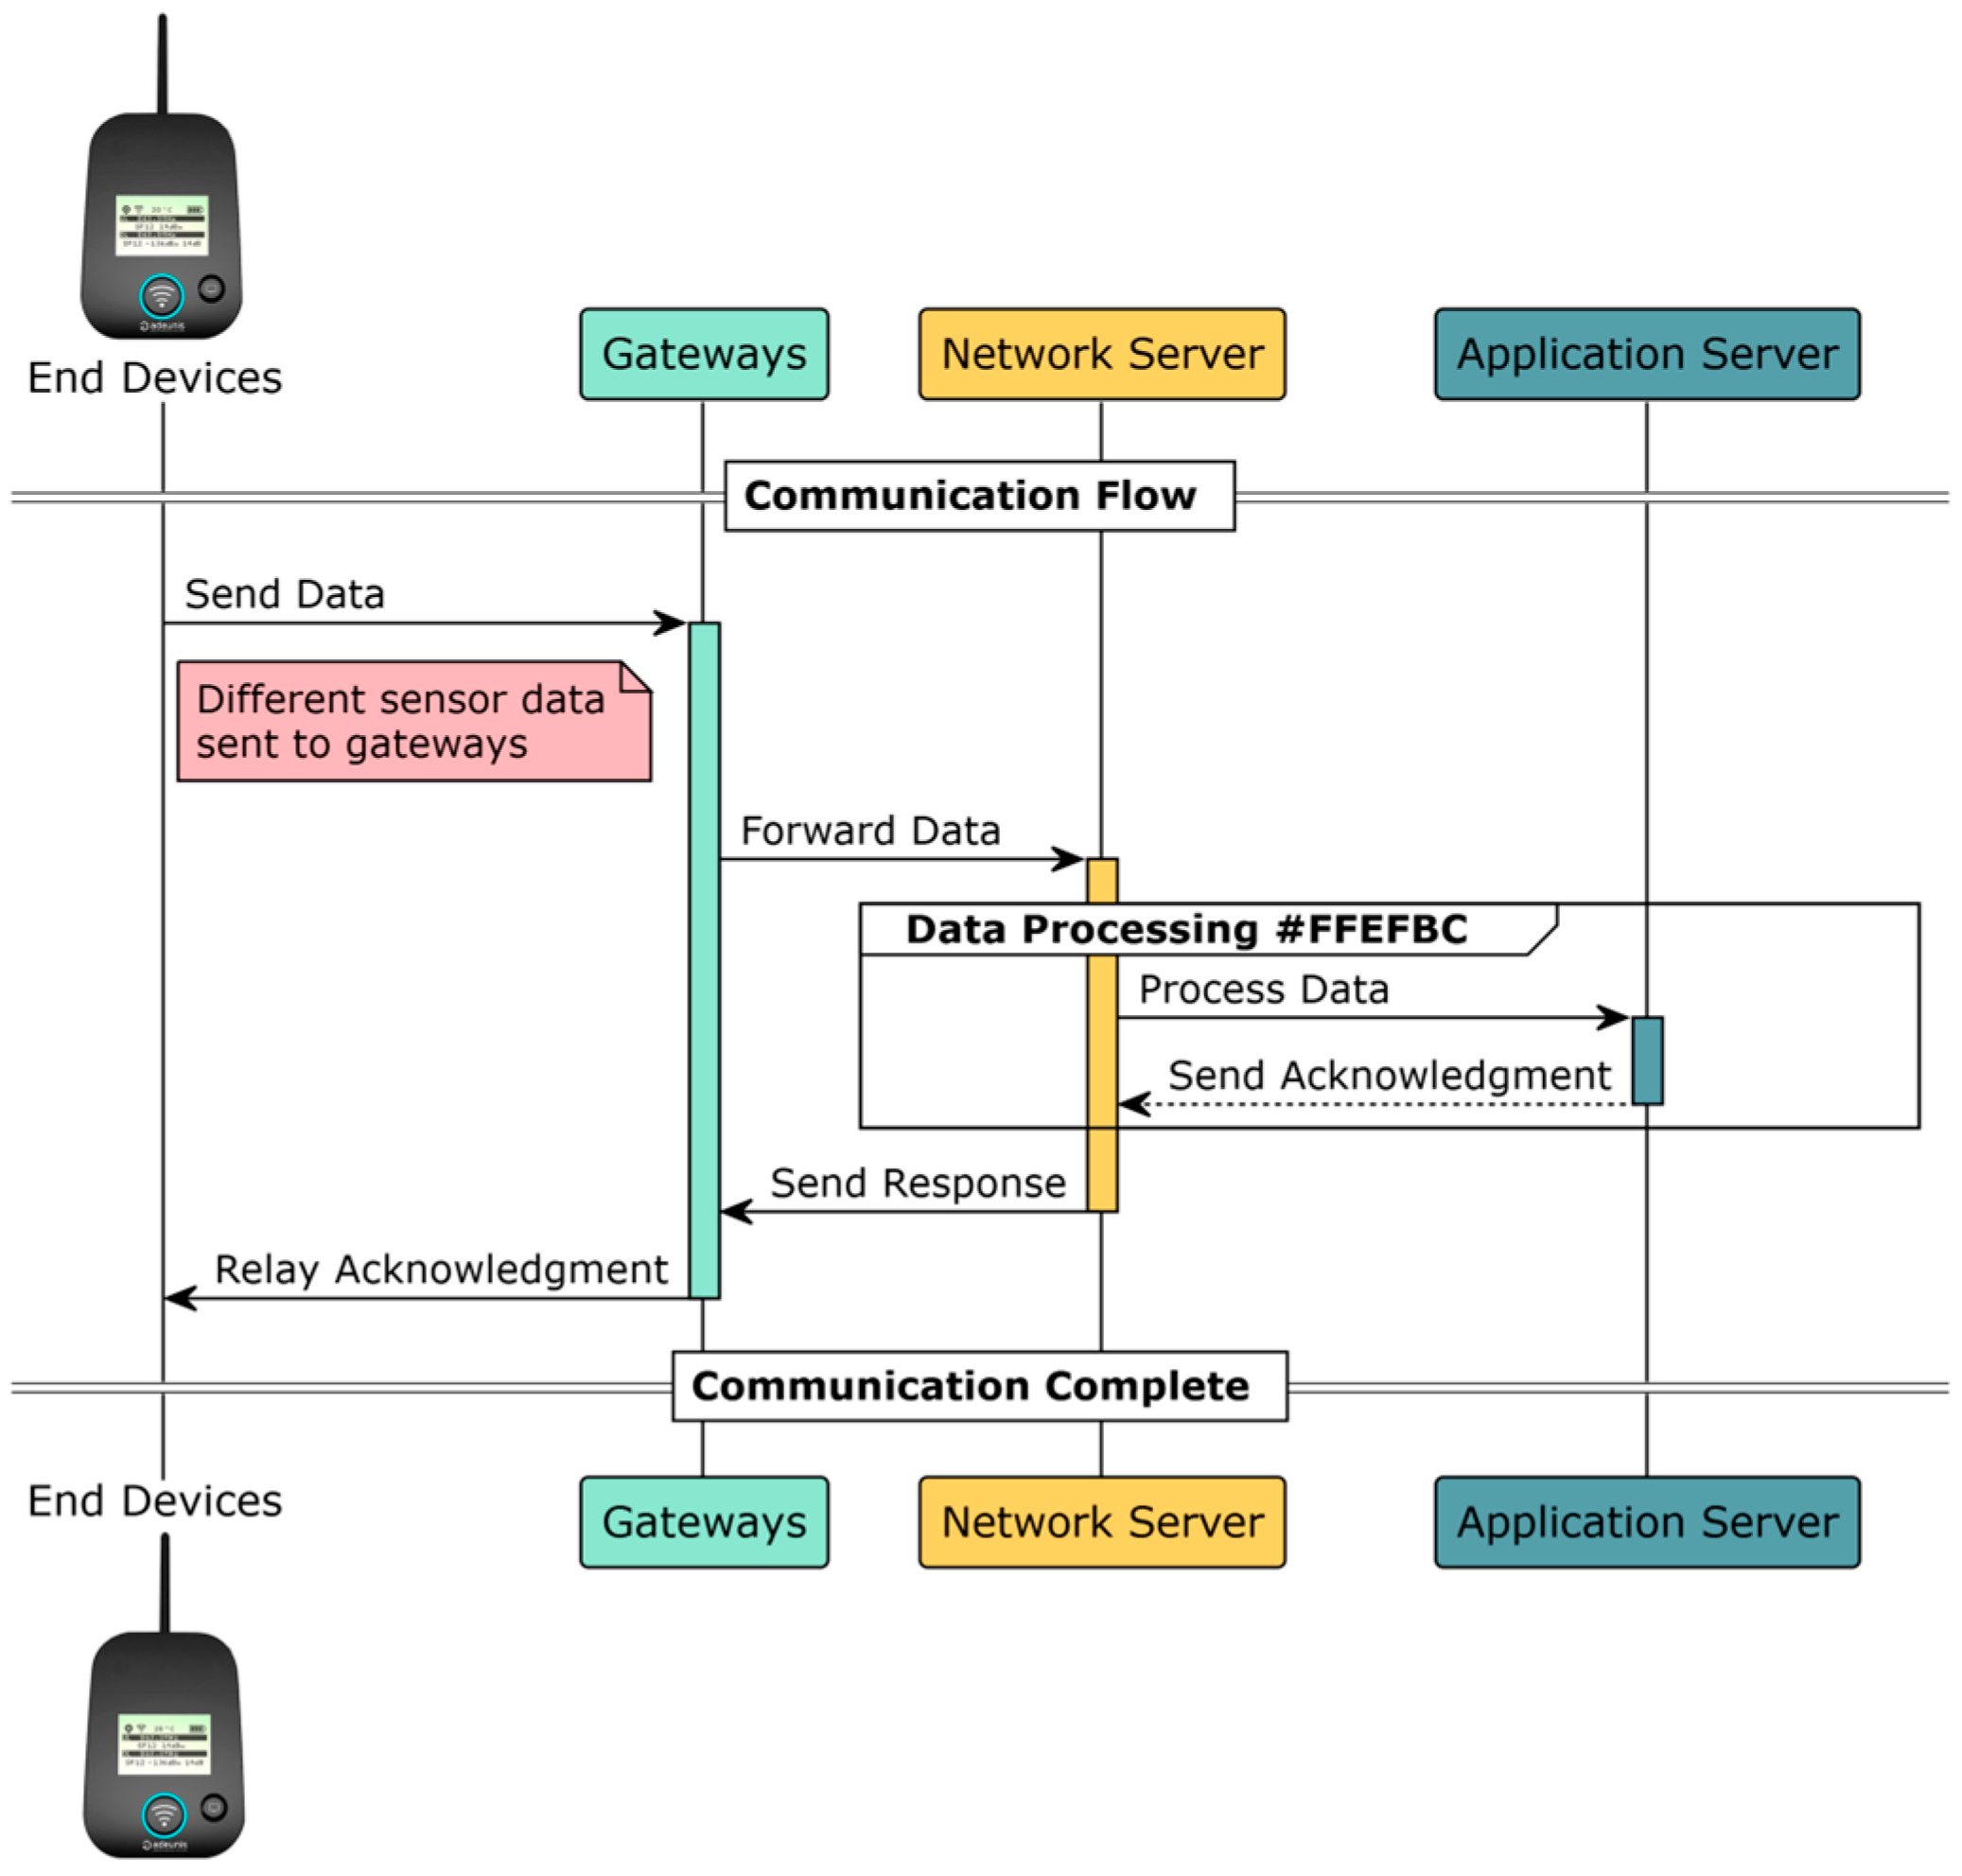
  • End devices: These are typically sensors or actuators and may include both. They are generally battery-powered and capable of wireless communication. These devices utilize RF signals modulated through the CSS technique to connect to the network via gateways.
  • Gateways: These act as bridges between end devices and the network server. Upon registration with a network server, gateways simply forward the received messages from end devices to the network server and vice versa without performing any computational tasks.
  • Network server: This serves as the central management hub of the network, handling all aspects of network operations, including the filtering of duplicate messages and the implementation of adaptive data rate schemes.
  • Application server: This manages application-specific data which involves operations such as decryption, data storage, and visualization. This server processes data received from end devices, managing both uplink and downlink data flows as required by the application.
In the LoRaWAN architecture, LoRaWAN networks depict a star-of-stars gateway, transferring messages between end devices and a central core network server. The LoRaWAN protocol supports privately owned networks, allowing customization and modification at various architectural levels. This flexibility underpins the deployment of tailored solutions that can address specific operational needs. It also proposes a network architecture indicating how the devices are to be connected, as well as the management and parameterization of the channels. The latest version of the protocol, published by the LoRa Alliance, is version 1.1 [38], which guarantees compatibility with its predecessor, 1.0, the first version of the protocol, as in Figure 3.
Classes of End Devices
LoRaWAN defines three classes of end devices to support various application needs:
  • Class A (Low-Power Bidirectional): This is the default class, where communication is always initiated by the end device. Each uplink transmission is followed by two downlink windows, providing a balanced approach to communication. This setup minimizes power consumption but leads to higher latency [39].
  • Class B (Bidirectional with Scheduled Downlink): Its operation is built on a synchronization mechanism between the network (gateway and LoRaWAN Network–Server) and the end devices. It supplements the Class A operation with additional scheduled downlink reception slots (ping slots), which are synchronized with the network via periodic beacons. This class allows for downlink communications at predetermined times, improving the predictability of communications at the cost of slightly increased power consumption [40].
  • Class C (Lowest Latency Bidirectional): Class C maintains an almost continuous open receive window, closing only when transmitting. This configuration guarantees the lowest latency to downlink communications, as the network server can send communications at any time, assuming the device’s receiver is open [41].

3.2.2. Hardware Overview

The experimental setup for optimizing LoRaWAN gateway placement required a robust selection of end devices and gateways to ensure accurate data collection and performance evaluation. This section details the hardware components, including their technical specifications, their role in the experiment, and the justification for their selection.
End Devices: The Adeunis FTD (see Figure 4a) [42] was chosen for its high reliability in measuring RSSI and SNR in real-world conditions. These devices operate in the EU868 MHz band, supporting Over-The-Air Activation (OTAA) and 14 dBm transmission power, which ensures secure network access and consistency in data collection. The Adeunis FTDs’ key specifications are summarized in Table 2. According to the manufacturer, the Adeunis FTD supports a range of up to 15 km in rural areas and 2–5 km in urban environments; however, in our urban experimental setup, the maximum measured transmitter-to-gateway distance was approximately 1 km, as determined by a GPS and Google Maps. The FTD devices were carried by a person walking outdoors during all phases, ensuring practical, real-world coverage analysis. Adeunis FTDs were most preferred for their high reliability and accuracy in reading such important metrics as RSSI and SNR. Of course, their basic compatibility with TTN and support of the LoRaWAN protocol made them ideal for field use, especially from the point of view of signal strength or different kinds of interference in urban settings that might affect communication quality. Also, device configuration included Over-the-Air Activation (OTAA) for secure network access. During the experiment, adaptive data rate (ADR) was set off to have consistent transmission performance.
Gateway—Dragino LG308-EC25: Dragino LG308-EC25 (Figure 4b) is an example of a robust LoRaWAN gateway, which uses a cellular backhaul (EC25 LTE module) and is also a multi-channel one regarding the reception of data from LoRaWAN devices [43]. Such TTN-optimized gateways are very good, especially for use in urban cases. The experiment was conducted using the EU868 frequency band (863–870 MHz). The gateway was placed at five different building levels—the ground floor, 1st floor, 3rd floor, 5th floor, and 9th floor (the top of building)—to assess variations in signal strength, packet loss, and SNR at different heights in the building. The key specifications of Dragino LG308-EC25 are summarized in Table 3 below:

4. Network Architecture Overview

A well-structured LoRaWAN network architecture is essential for optimizing data transmission, coverage reliability, and energy efficiency in urban environments. This study implements a multi-tier LoRaWAN architecture, integrating end devices, gateways, a network server, and an application server to ensure seamless communication, real-time monitoring, and data analysis.

4.1. LoRaWAN Network Architecture

The architecture of a typical LoRaWAN network comprises several critical components, including end devices, gateways, a network server, and an application server [44], as illustrated in Figure 5.

4.2. Data Transmission Workflow

The data transmission workflow in the LoRaWAN network follows a structured process to ensure accurate data collection, real-time monitoring, and reliable performance evaluation. Packet transmissions are manually triggered by the operator using the Adeunis FTD, enabling controlled and repeatable data collection across different environmental conditions. Once transmitted, the packets are received by The Things Network (TTN), where real-time validation is performed to monitor packet delivery, RSSI, SNR, and other key performance indicators. The function checks a bitmask to determine which data fields are included and then decodes each field accordingly:
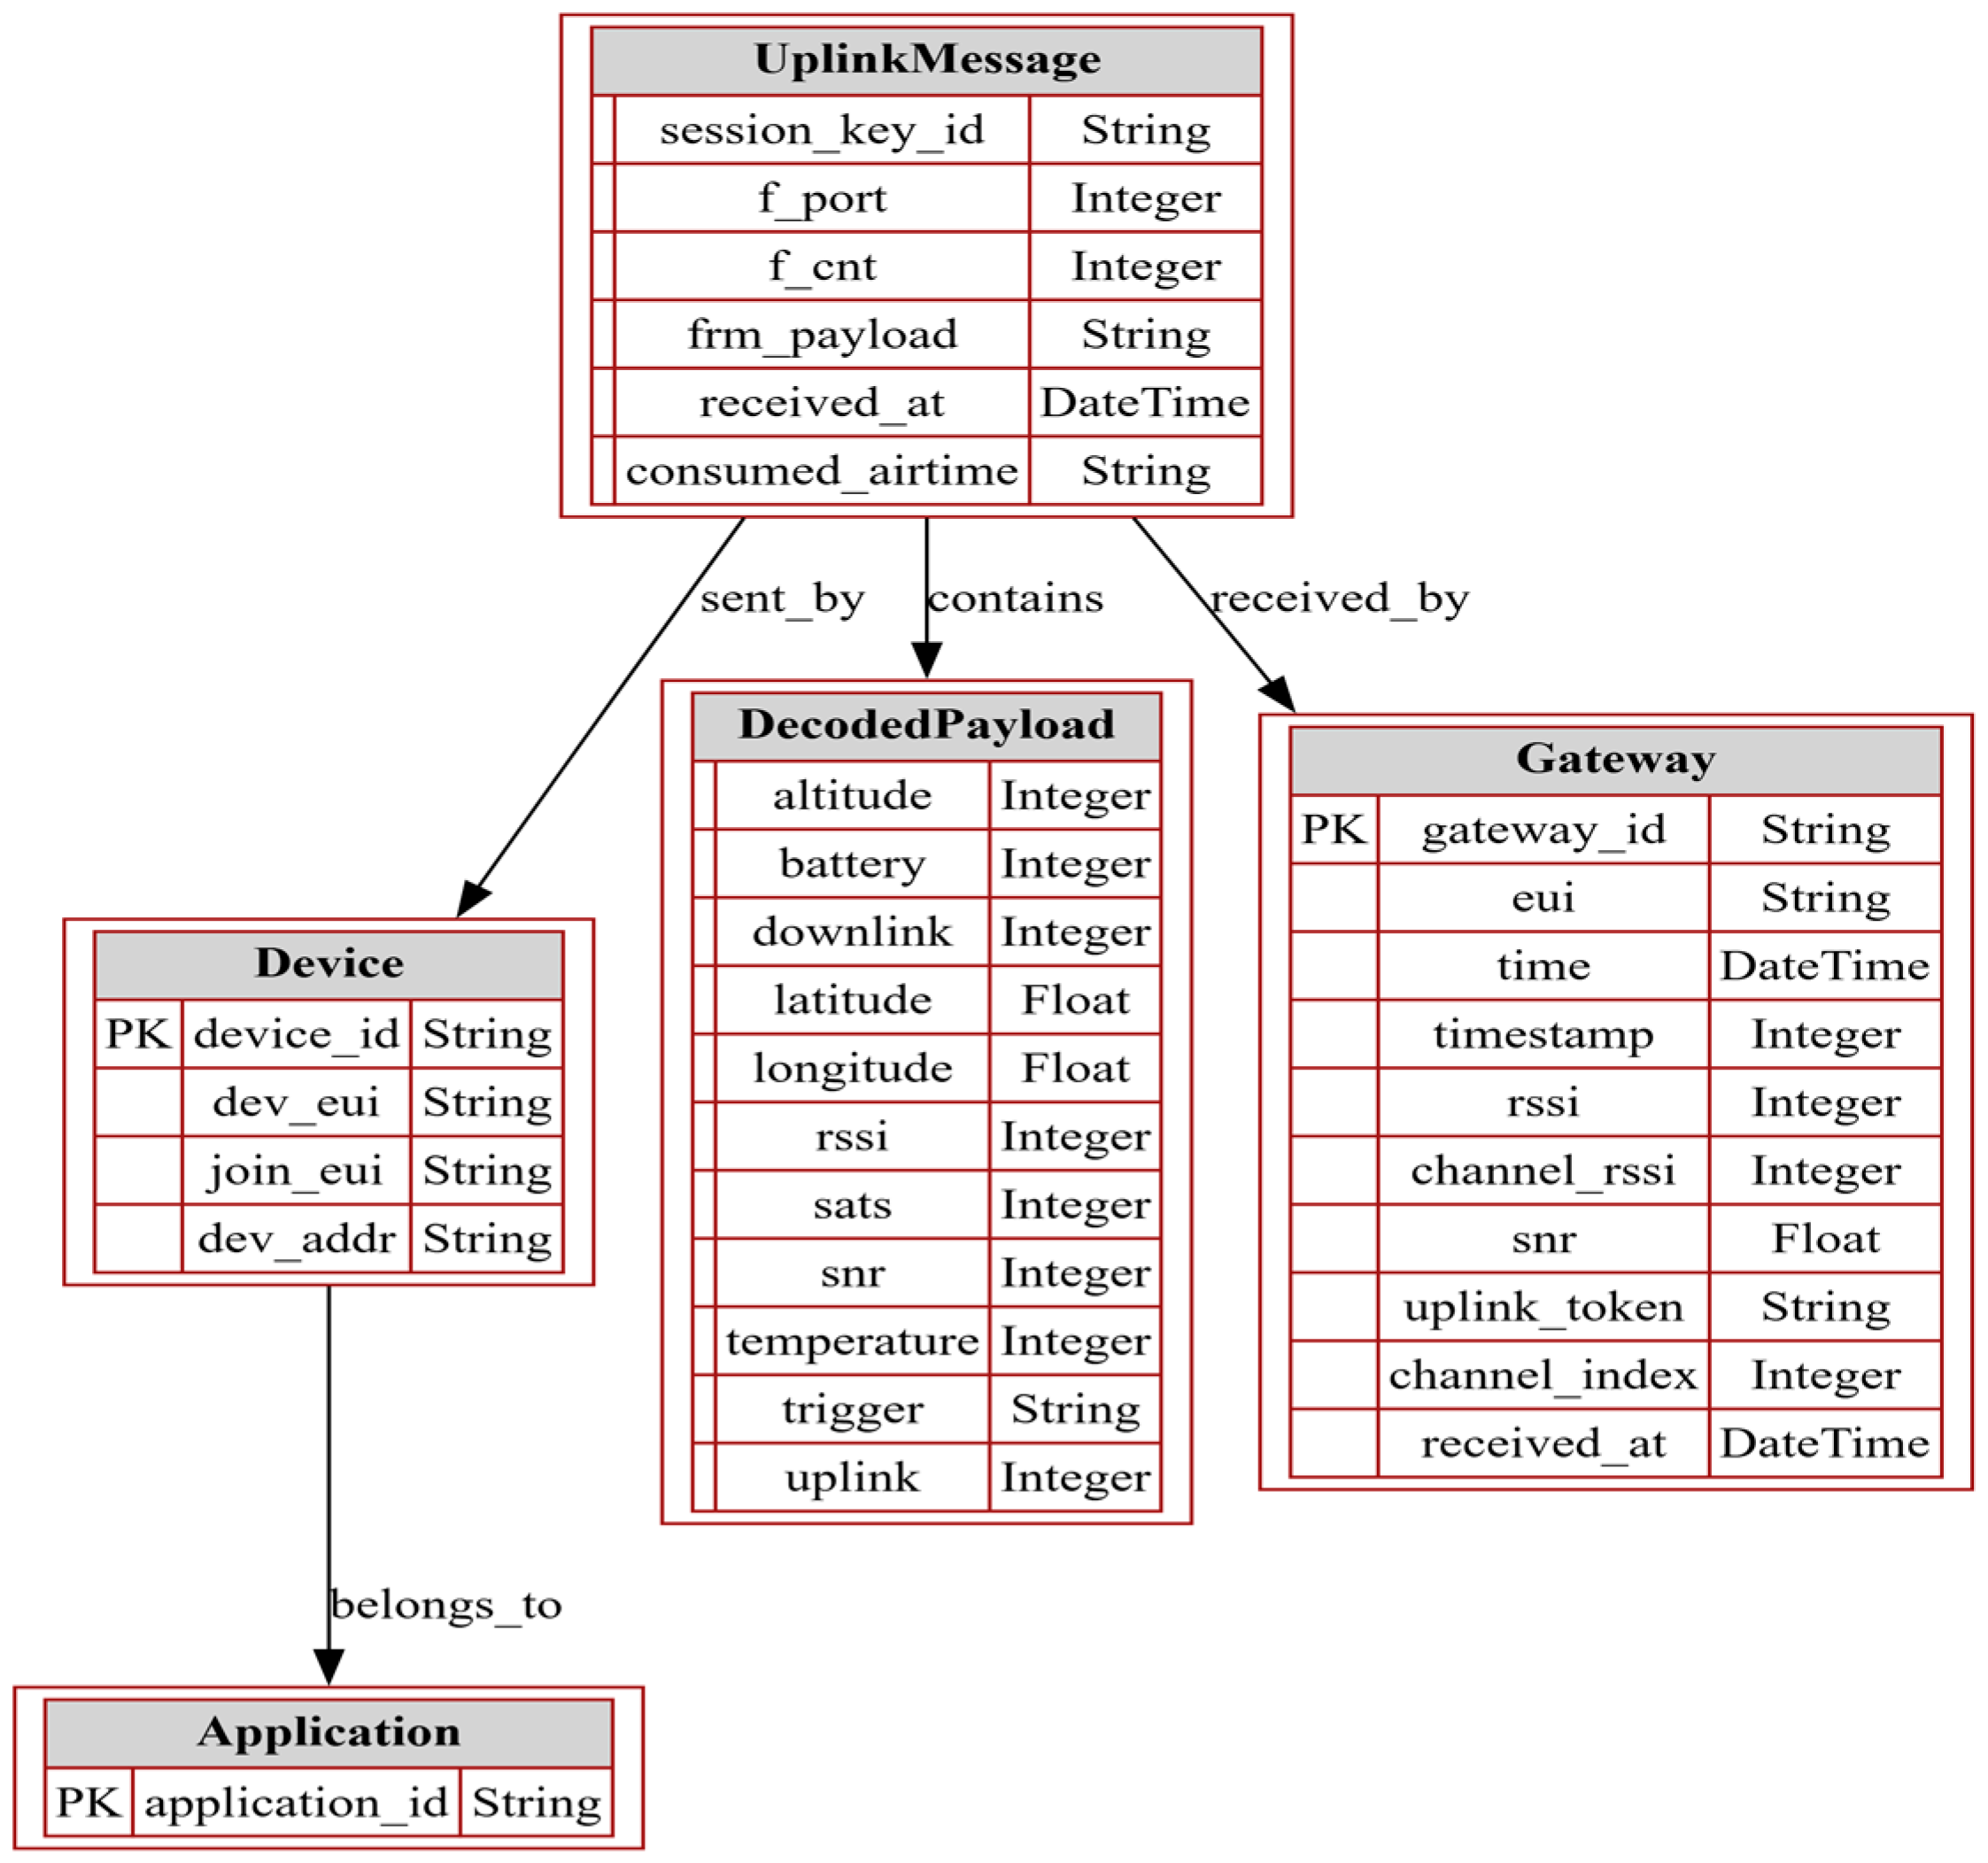
  • Temperature: This is decoded from the bytes, with adjustments for a signal, providing critical information for environmental monitoring that can affect device performance and data reliability.
  • Trigger Source: This parameter identifies whether data transmission was triggered by movements detected via the accelerometer or manual button presses. It is essential to understand the context in which data is sent, which is vital for applications that react to environmental changes or user interactions.
  • GPS Information: By calculating the latitude and longitude from multiple bytes, precise location data is obtained, which is essential for spatial analysis and validating the coverage effectiveness of deployed devices.
  • Frame Counters: These counters, which track uplink and downlink frames, are instrumental in identifying packet loss or duplications, which is crucial for maintaining data integrity and efficient network management.
  • Battery Level: Decoded from two bytes to reveal the voltage in millivolts, monitoring the battery level is key for predicting device maintenance schedules and ensuring operational longevity.
  • RSSI and SNR: These metrics provide data on signal strength and noise ratio, which is fundamental for analyzing communication reliability and optimizing network performance.
The payload was formatted using JavaScript on the application side in TTN, as illustrated in Figure 6. The decoded data, collected in a JSON file from TTN, underwent some steps of transformation to prepare it for the analysis stage. Figure 7 shows the structured dataset. These were then automated by Python scripts which not only improved the accuracy but also the speed of executing activities involving data. Figure 8 illustrates the concise steps for data preprocessing.

5. Computational Techniques for Signal Analysis and Network Optimization

To enhance LoRaWAN network performance, this study employs a multi-step computational framework that integrates geodesic distance calculations, clustering analysis, and hybrid optimization using PSO and DE algorithms. These techniques enable precise signal behavior analysis, gateway placement optimization, and performance evaluation.

5.1. Distance Calculation

The distance between the Adeunis FTDs and the Dragino LG308-EC25 gateways at different building levels was a key factor in analyzing signal behavior (RSSI and SNR), as well as determining packet loss rates. Since the devices and gateways were deployed at specific locations with known geographical coordinates, we calculated the distance between each device and the gateway using the geodesic method from the geopy Python library. The geodesic distance is the shortest path between two points on the earth’s surface, considering the curvature of the earth. This method is particularly accurate for calculating relatively short distances, as in this case, where the devices were deployed within a multi-story building.

5.2. Clustering Analysis Using K-Means Algorithm

K-means clustering is a commonly used unsupervised learning algorithm that partitions data into k clusters based on the minimization of the variance within each cluster. In this experiment, K-means clustering was applied to both SNR and RSSI metrics to classify signal performance into multiple distinct groups. Unlike the traditional approach of classifying signal quality into predefined categories, such as “Low,” “Moderate,” and “High,” we used six clusters for RSSI and seven clusters for SNR. This clustering approach allowed for a more granular analysis of the data, providing richer insights into the variations in signal quality across different distances from the gateway.
The K-means algorithm works through the following iterative process:
  • Step 1: Select the initial k centroids, where k is the number of clusters. In our case, k = 6 for RSSI and k = 7 for SNR, reflecting the data characteristics and allowing for fine distinctions between different signal quality levels.
  • Step 2: Assign each data point to the nearest centroid based on Euclidean distance d. The distance between a data point x and a centroid c is computed using Equation (1):
    d x , c = i = 1 n x i c i 2
    where x i is an individual dimension of the data point x , and c i is the corresponding dimension of the centroid.
  • Step 3: Recalculate the centroids by averaging the data points assigned to each cluster. The new centroid c for a cluster S is updated, as in Equation (2):
    c = 1 S x S x
    where |S| is the number of data points in cluster S, and the sum is the overall data points x in that cluster.
  • Step 4: Repeat the assignment and update the steps until the centroids stabilize and do not change significantly, indicating that the algorithm has converged.
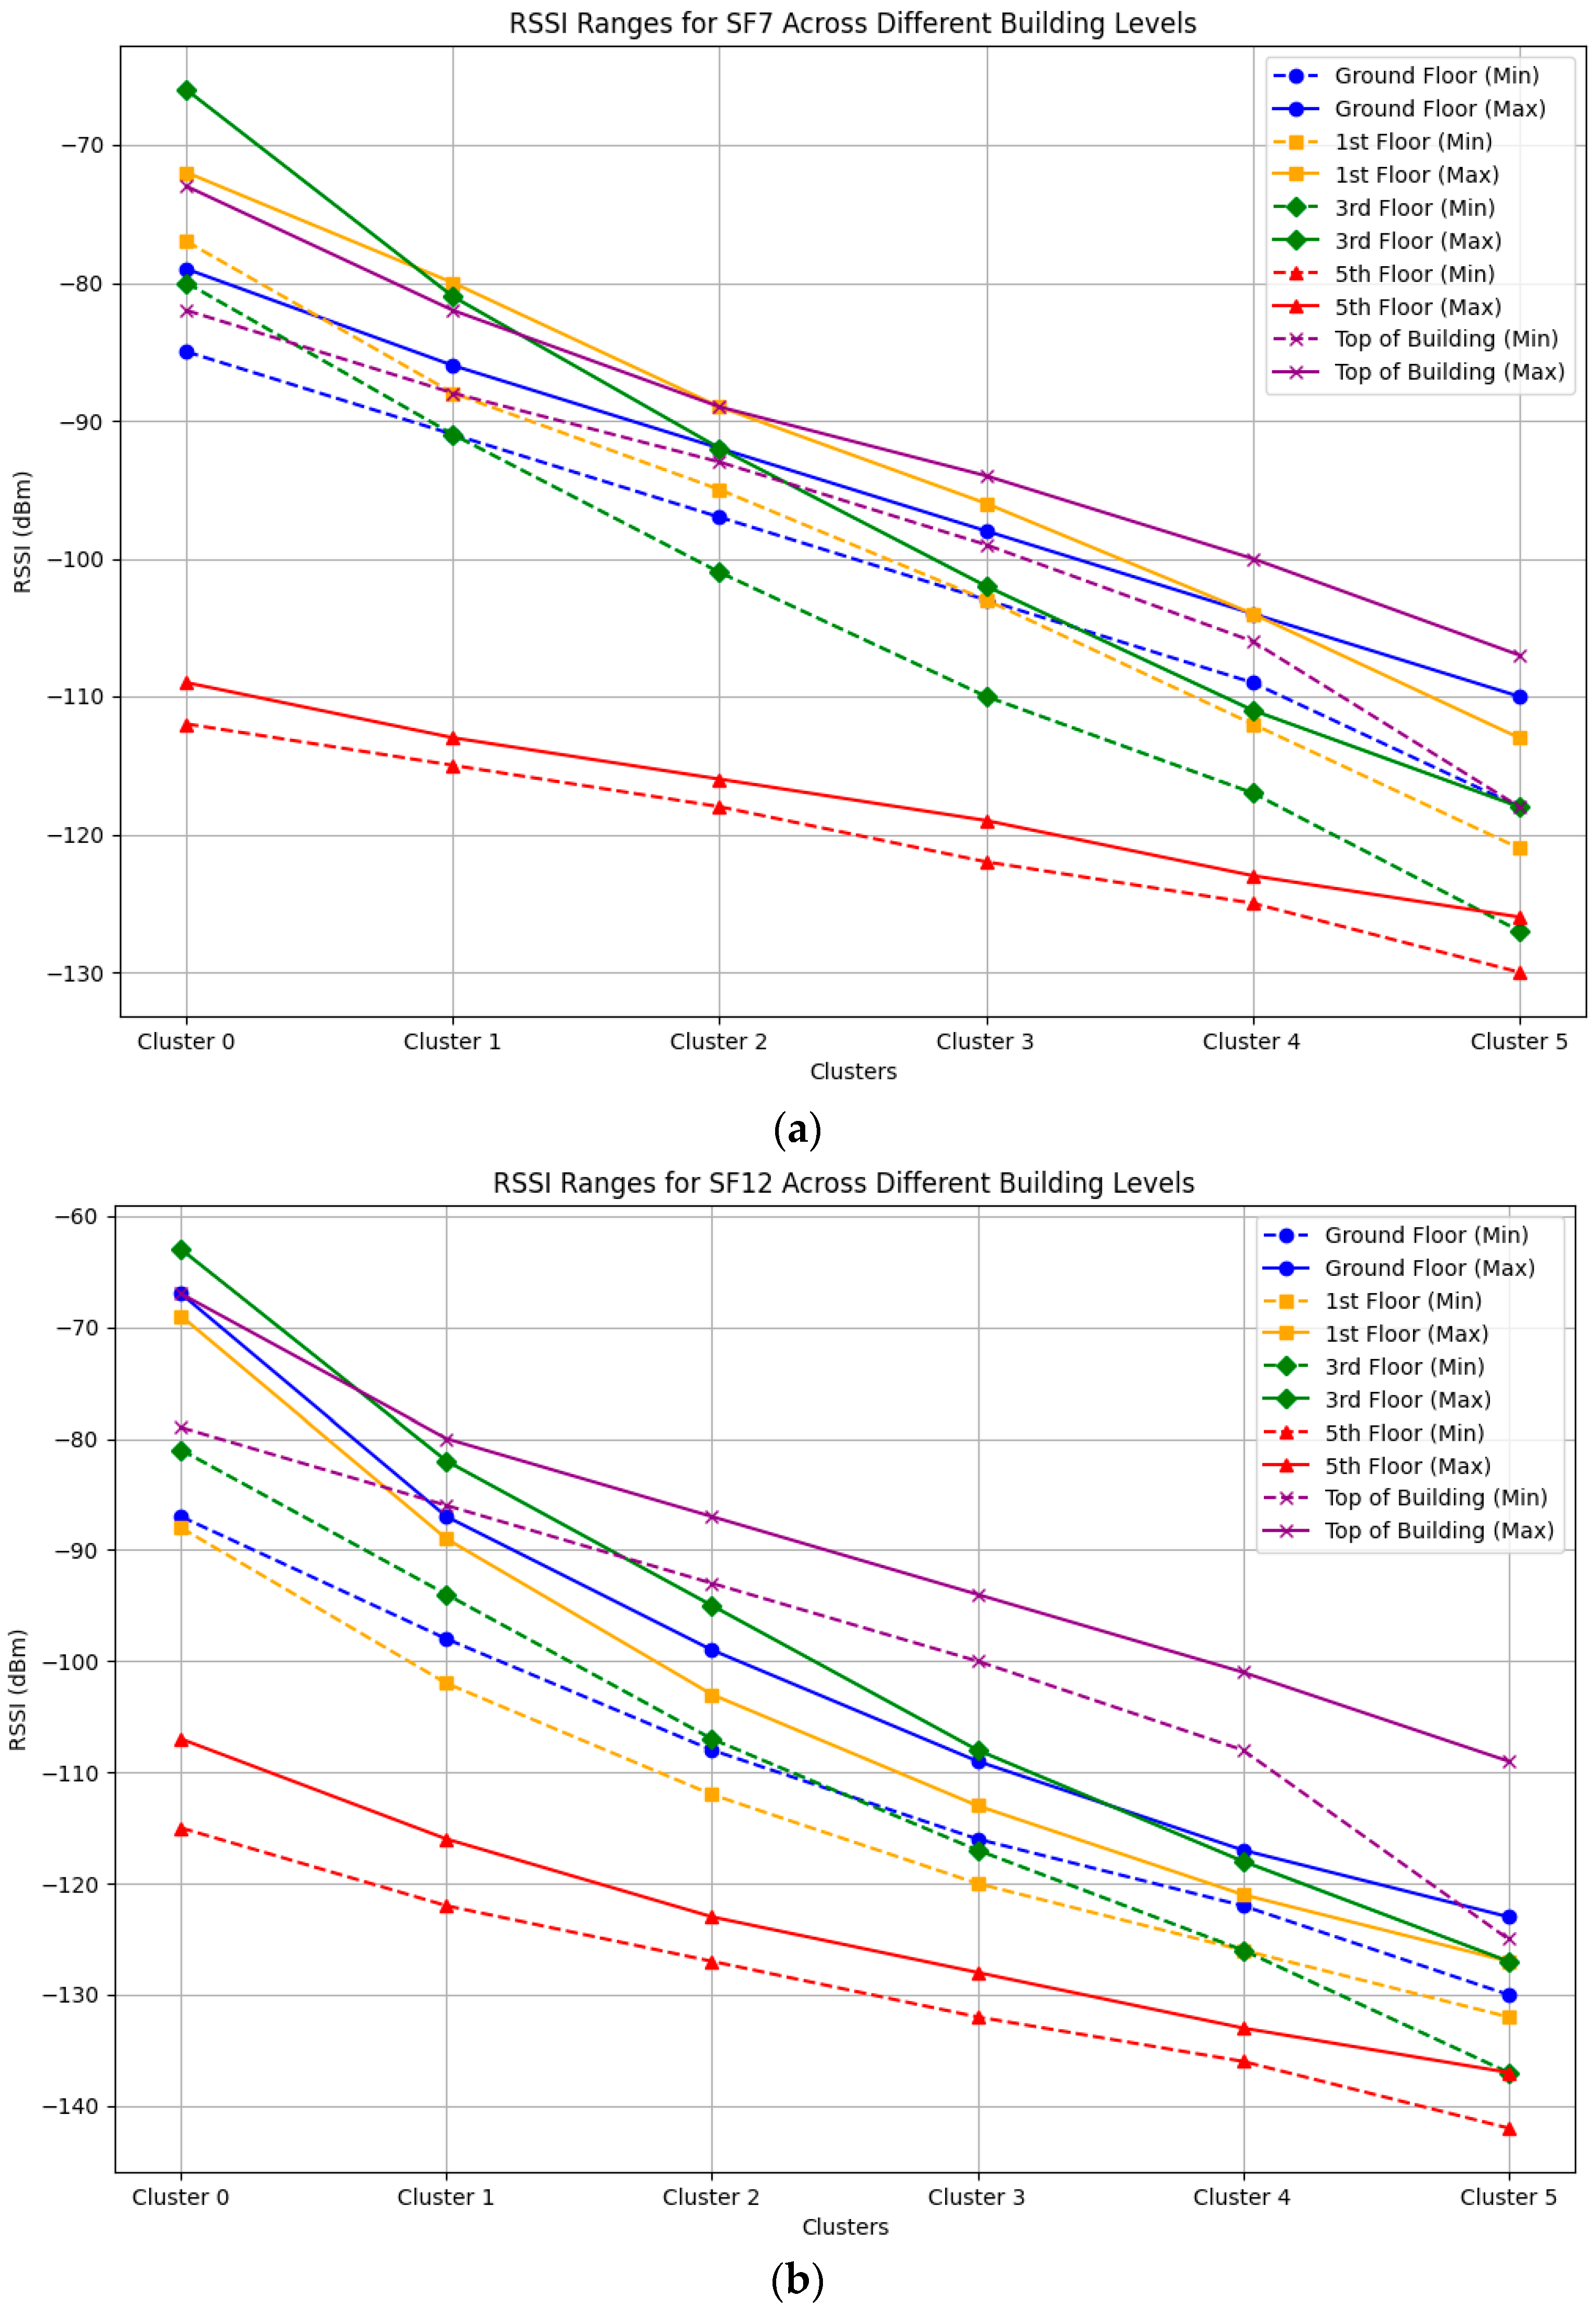
  • The resulting clusters for RSSI and SNR were labelled numerically (e.g., Cluster 0, Cluster 1, etc.), with each cluster representing a different range of signal values.

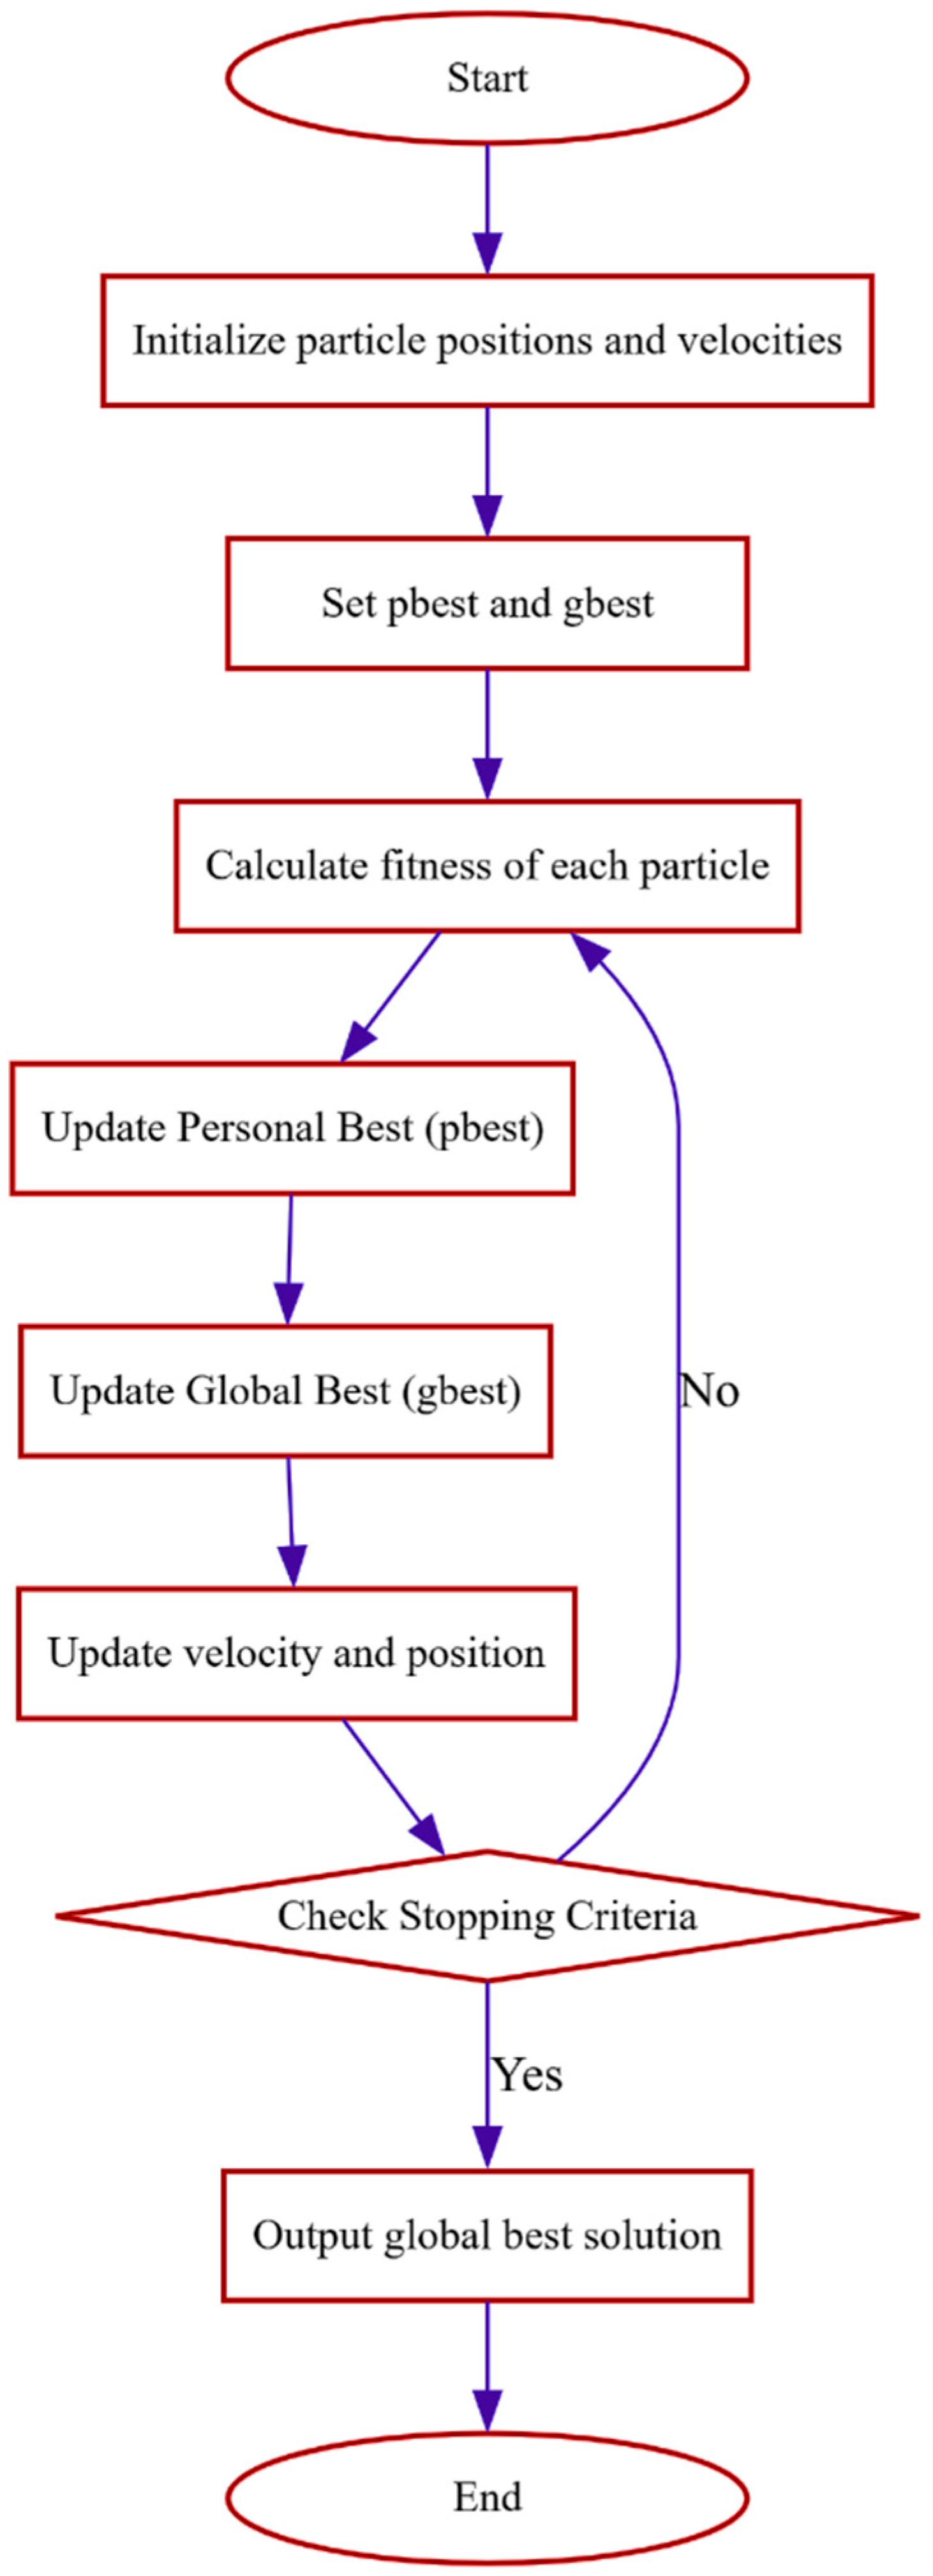
5.3. The Particle Swarm Optimization (PSO) Algorithm

PSO is an effective algorithm for optimizing a wide range of functions, such as engineering design and neural network training, particularly in neural network weight optimization for disease prediction and diagnosis models, exhibiting its adaptability and effectiveness in handling complex optimization problems [45]. The algorithm starts with a swarm of particles, which are initialized with random positions and velocities in the problem space. Each particle evaluates the fitness of its position based on a predefined objective function. Two main values are tracked for each particle, which are pbest, the best position it has found so far, and gbest, the best position found by any particle in the swarm. Figure 9 illustrates the basic steps of the PSO algorithm.

5.4. Differential Evolution (DE) Algorithm

DE is a popular evolutionary algorithm, introduced by Storn and Price [46] and inspired by Darwin’s theory of evolution, and has been studied extensively to solve different areas of optimization and engineering applications since its introduction.
DE performs well in solving problems where other methods, such as those relying on gradient information, might fail. It is significantly noted for its ability to navigate complex, multimodal landscapes effectively, like predictions, industrial control, computational systems, electrical and power systems, feature selection, clustering, image processing, healthcare, and wireless and sensor networks [47]. The core of DE is its iterative evolution process, comprising mutation, crossover, and selection. In mutation, a mutant vector is created by adding the weighted difference between two randomly chosen vectors to a third, introducing variability. Crossover mixes this mutant vector with the target vector using a predetermined probability, enhancing diversity. The process culminates in selection, where the vector with superior fitness is chosen for the next generation, ensuring continual improvement in solution quality [48]. This process repeats until reaching a stopping criterion, like a set number of generations or an optimal fitness level. Figure 10 illustrates the mathematical workflow of the DE algorithm.

5.5. Hybrid PSO-DE (GateOpt PSODE)

In modern communication networks, especially those utilizing LPWAN technologies, such as LoRaWAN, the placement of one or more gateways is crucial for ensuring robust network coverage and performance. Gateway placement directly influences several key network metrics, including the RSSI, SNR, and packet loss rates, which collectively determine the quality and reliability of the network service provided to end devices.
This hybrid approach uses the PSO algorithm [49] and the DE algorithm [50]. GateOpt PSODE is strategic in solving complex optimization problems posed by wireless networks, such as LoRaWAN. It can perform multi-objective optimization operations that are the most appropriate for maximizing RSSI and SNR in conjunction with minimizing packet loss, thereby improving the network performance across the use of GWs placed on several floors of a building. PSO and DE are typically good at exploring and exploiting the solution space, since PSO excels at a global speed search, while DE perfects neighborhood refinements for a local search. More importantly, existing research indicates that it has worked in certain adapted versions in a similar complicated scenario, and, therefore, this approach is also suitable for fast-changing multidimensional affine parameters of the placement of gateways in LoRaWAN networks. GateOpt PSODE also constructs systematic and streamlined optimization for gateway deployments by inputting these algorithms into clusters of RSSI and SNR values calculated for each gateway from a K-means algorithm in the analysis phase. The core equation for evaluating the objective function (or cost function) is Equation (3).
c o s t w e i g h t s = α n o r m r s s i + β n o r m s n r + γ n o r m p a c k e t l o s s
where α, β, and γ represent the weights for RSSI, SNR, and packet loss, respectively.
Equation (3) defines the objective function combining RSSI, SNR, and packet loss through weights (α, β, and γ). The goal is to maximize RSSI and SNR and minimize packet loss, and PSO initially finds near-optimal weights, guiding subsequent refinement. PSO is used as the initial step in the hybrid algorithm to explore the search space and find a near-optimal solution for the weights α, β, and γ.
The process includes the following:
Initialization. Randomly generate a swarm of particles, each representing a possible solution (α, β, and γ).
Velocity update. The velocity of each particle is updated based on personal best (Ƥbest) and global best (ɡbest) positions using Equation (4).
v n e w = ω   ×   v o l d + ϕ p × r a n d ( ) × Ƥ b e s t c u r r e n t   p o s i t i o n + ϕ g × r a n d ( ) × ( g b e s t c u r r e n t   p o s i t i o n )
Position update. The new position of each particle is determined based on its velocity, as in Equation (5).
P o s i o t i o n n e w = P o s i t i o n o l d + v n e w
Objective evaluation. The cost function is evaluated for each particle based on the equation above, aiming to maximize RSSI and SNR while minimizing packet loss.
Convergence. The algorithm iterates until the maximum number of iterations is reached or the best global solution stabilizes.
On the other hand, DE is employed to refine the solution provided by PSO, ensuring further fine-tuning of the weights α, β, and γ. The steps include the following:
Mutation. Mutation is performed by adding the weighted difference between two randomly selected individuals to a third individual, as in Equation (6).
v i = x r 1 + F × ( x r 2 x r 3 )
where v i is the trial vector, F is a mutation factor, and ( x r 1 ,   x r 2 ,   x r 3 ) are randomly selected individuals from the population.
Crossover. After mutation, crossover is applied using Equation (7) to create a new trial vector ( u i ) by combining elements from the mutated vector ( v i ) and the current individual in the population:
u i , j = v i , j i f   r a n d ( ) C r   o r   j = j r a n d x i , j , o t h e r w i s e
where C r is the crossover rate; u i , j is the jth component of the trial vector for the individual ith; v i , j is the jth component of the mutated vector; x i , j is the jth component of the target vector; and r a n d ( ) is a function generating a random number between 0 and 1, j r a n d is a randomly chosen index, ensuring at least one component from v i is included in u i to maintain diversity.
Selection. The offspring is evaluated using the objective function, and if the offspring outperforms its parent, it replaces the parent in the next generation.
Normalization and final score calculation. Once the final weights are determined by DE, they are normalized to ensure their sum equals 1:
t o t a l w e i g h t s = α + β + γ
n o r m a l i z e d a l p h a = α / t o t a l w e i g h t s
n o r m a l i z e d b e t e = β / t o t a l w e i g h t s
n o r m a l i z e d g a m m a = γ / t o t a l w e i g h t s
For each floor, the optimized score is computed as in Equation (12).
o p t i m i z e d s c o r e = ( n o r m a l i z e d a l p h a n o r m r s s i ) + ( n o r m a l i z e d b e t e n o r m s n r ) + ( n o r m a l i z e d g a m m a n o r m p a c k e t l o s s )
In summary, the hybrid PSO-DE approach effectively optimizes weights (α, β, and γ) for RSSI, SNR, and packet loss, ensuring balanced network performance and guiding optimal gateway placements across floors. The proposed algorithm is shown in Algorithm 1.
Algorithm 1: Hybrid Particle Swarm Optimization + Differential Evolution (PSO + DE)
Input:
rssi: Array of RSSI values for each floor
snr: Array of SNR values for each floor
packet_loss: Array of packet loss values for each floor
label: Descriptor (e.g., ‘SF12’ and ‘SF7’)
Output:
Optimized weights (alpha, beta, and gamma)
Optimized scores for each floor
1Normalize the input data:
n o r m r s s i = ( r s s i min r s s i ) / ( max r s s i min r s s i )
n o r m s n r = ( s n r min s n r ) / ( max s n r min s n r )
          n o r m p a c k e t l o s s = 1 ( p a c k e t l o s s min p a c k e t l o s s ) / ( max p a c k e t l o s s min p a c k e t l o s s )
2Optimize using PSO:
best_weights_pso = optimize_with_pso ( n o r m r s s i , n   o r m s n r ,   n o r m p a c k e t l o s s )
Function optimize_with_pso(norm_rssi, norm_snr, norm_packet_loss):
Initialize PSO with specific parameters
For each iteration:
Update positions and velocities of particles
Evaluate cost function:
          c o s t w e i g h t s = 1   ( α n o r m r s s i + β n o r m s n r + γ n o r m p a c k e t l o s s )
Update particle velocities and positions based on personal and global best
Return best weights ( α , β ,   γ ) from PSO
3Fine-tune using DE:
best_weights_de = optimize_with_de(best_weights_pso, n o r m r s s i , n   o r m s n r ,   n o r m p a c k e t l o s s )
Function optimize_with_de(best_weights_pso, n o r m r s s i , n   o r m s n r ,   n o r m p a c k e t l o s s ):
Set bounds for alpha, beta, and gamma
Initialize population around best_weights_pso
For each generation:
Perform mutation, crossover, and selection based on the DE cost function evaluation
Return best weights found by DE
4Calculate and normalize final scores:
final_scores = calculate_scores(floors, rssi, snr, p a c k e t l o s s , best_weights_de)
Function calculate_scores(floors, rssi, snr, p a c k e t l o s s , best_weights):
t o t a l w e i g h t s = α + β + γ
               n o r m a l i z e d a l p h a = α / t o t a l w e i g h t s
               n o r m a l i z e d b e t e = β / t o t a l w e i g h t s
               n o r m a l i z e d g a m m a = γ / t o t a l w e i g h t s
For each floor:
      o p t i m i z e d s c o r e = ( n o r m a l i z e d a l p h a n o r m r s s i ) + ( n o r m a l i z e d b e t a n o r m s n r ) + ( n o r m a l i z e d g a m m a n o r m p a c k e t l o s s )
Store   o p t i m i z e d s c o r e for the floor
Return dictionary or dataframe containing floors and their corresponding optimized scores
5Display results:
Output the best_weights_de and final_scores
Visualize scores on a bar chart with a color map reflecting the score intensity
End Algorithm

5.6. HTZ Simulation Parameters

This section analyzes the coverage of a LoRaWAN network set up with SF7 and SF12, comparing simulation results with experimental data collected in summer conditions with high temperatures (40 °C) and humidity. The simulation was run using the HTZ Communications software, which includes a detailed map of the area that was analyzed, giving a strong basis for comparison. Our goal was to check our test results against the simulated data, showing the trustworthiness and effectiveness of the network in different settings and setups.
Figure 11 illustrates the measurement path points utilized in a comparative analysis with the predictions from the HTZ simulation throughout the university campus area. The markers indicate the specific locations where RSSI and SNR data were systematically collected to assess the performance of the LoRaWAN network. The thoughtful arrangement of these points guarantees extensive spatial coverage and includes a range of urban environments.
Our simulation was conducted via the HTZ Communications software, which provides sophisticated radio network planning and optimization capabilities across a wide range of technologies, from a few kHz to 1 THz. This all-in-one solution oversees the complete radio planning lifecycle [51].
HTZ boasts a robust propagation engine that facilitates the design of outdoor, indoor, and combined outdoor–indoor networks. It includes a library of over 50 empirical, deterministic, and hybrid propagation models, encompassing all ITU-R models, Okumura-Hata, Cost-Hata, the Irregular Terrain Model–Longley Rice, as well as ITU and 3GPP models. We aimed to analyze the performance of LoRaWAN networks across different floors of a building under specific environmental conditions. Below, in Table 4, we outline the configurations for each gateway, along with their corresponding settings, to illustrate the setup comprehensively:

6. Experimental Results and Analysis

6.1. SF7 and SF12 Comparative Analysis

This section is subdivided into two main phases. Initially, we assess the performance of a LoRaWAN network with raw experiment metrics: packet loss, RSSI, and SNR. Afterward, the metric results are used in conjunction with the GateOpt PSODE optimization algorithm to evaluate optimal gateway placement. The analysis starts from a single-gateway perspective, evaluating one floor at a time, and is always conducted under both SF7 and SF12 settings.

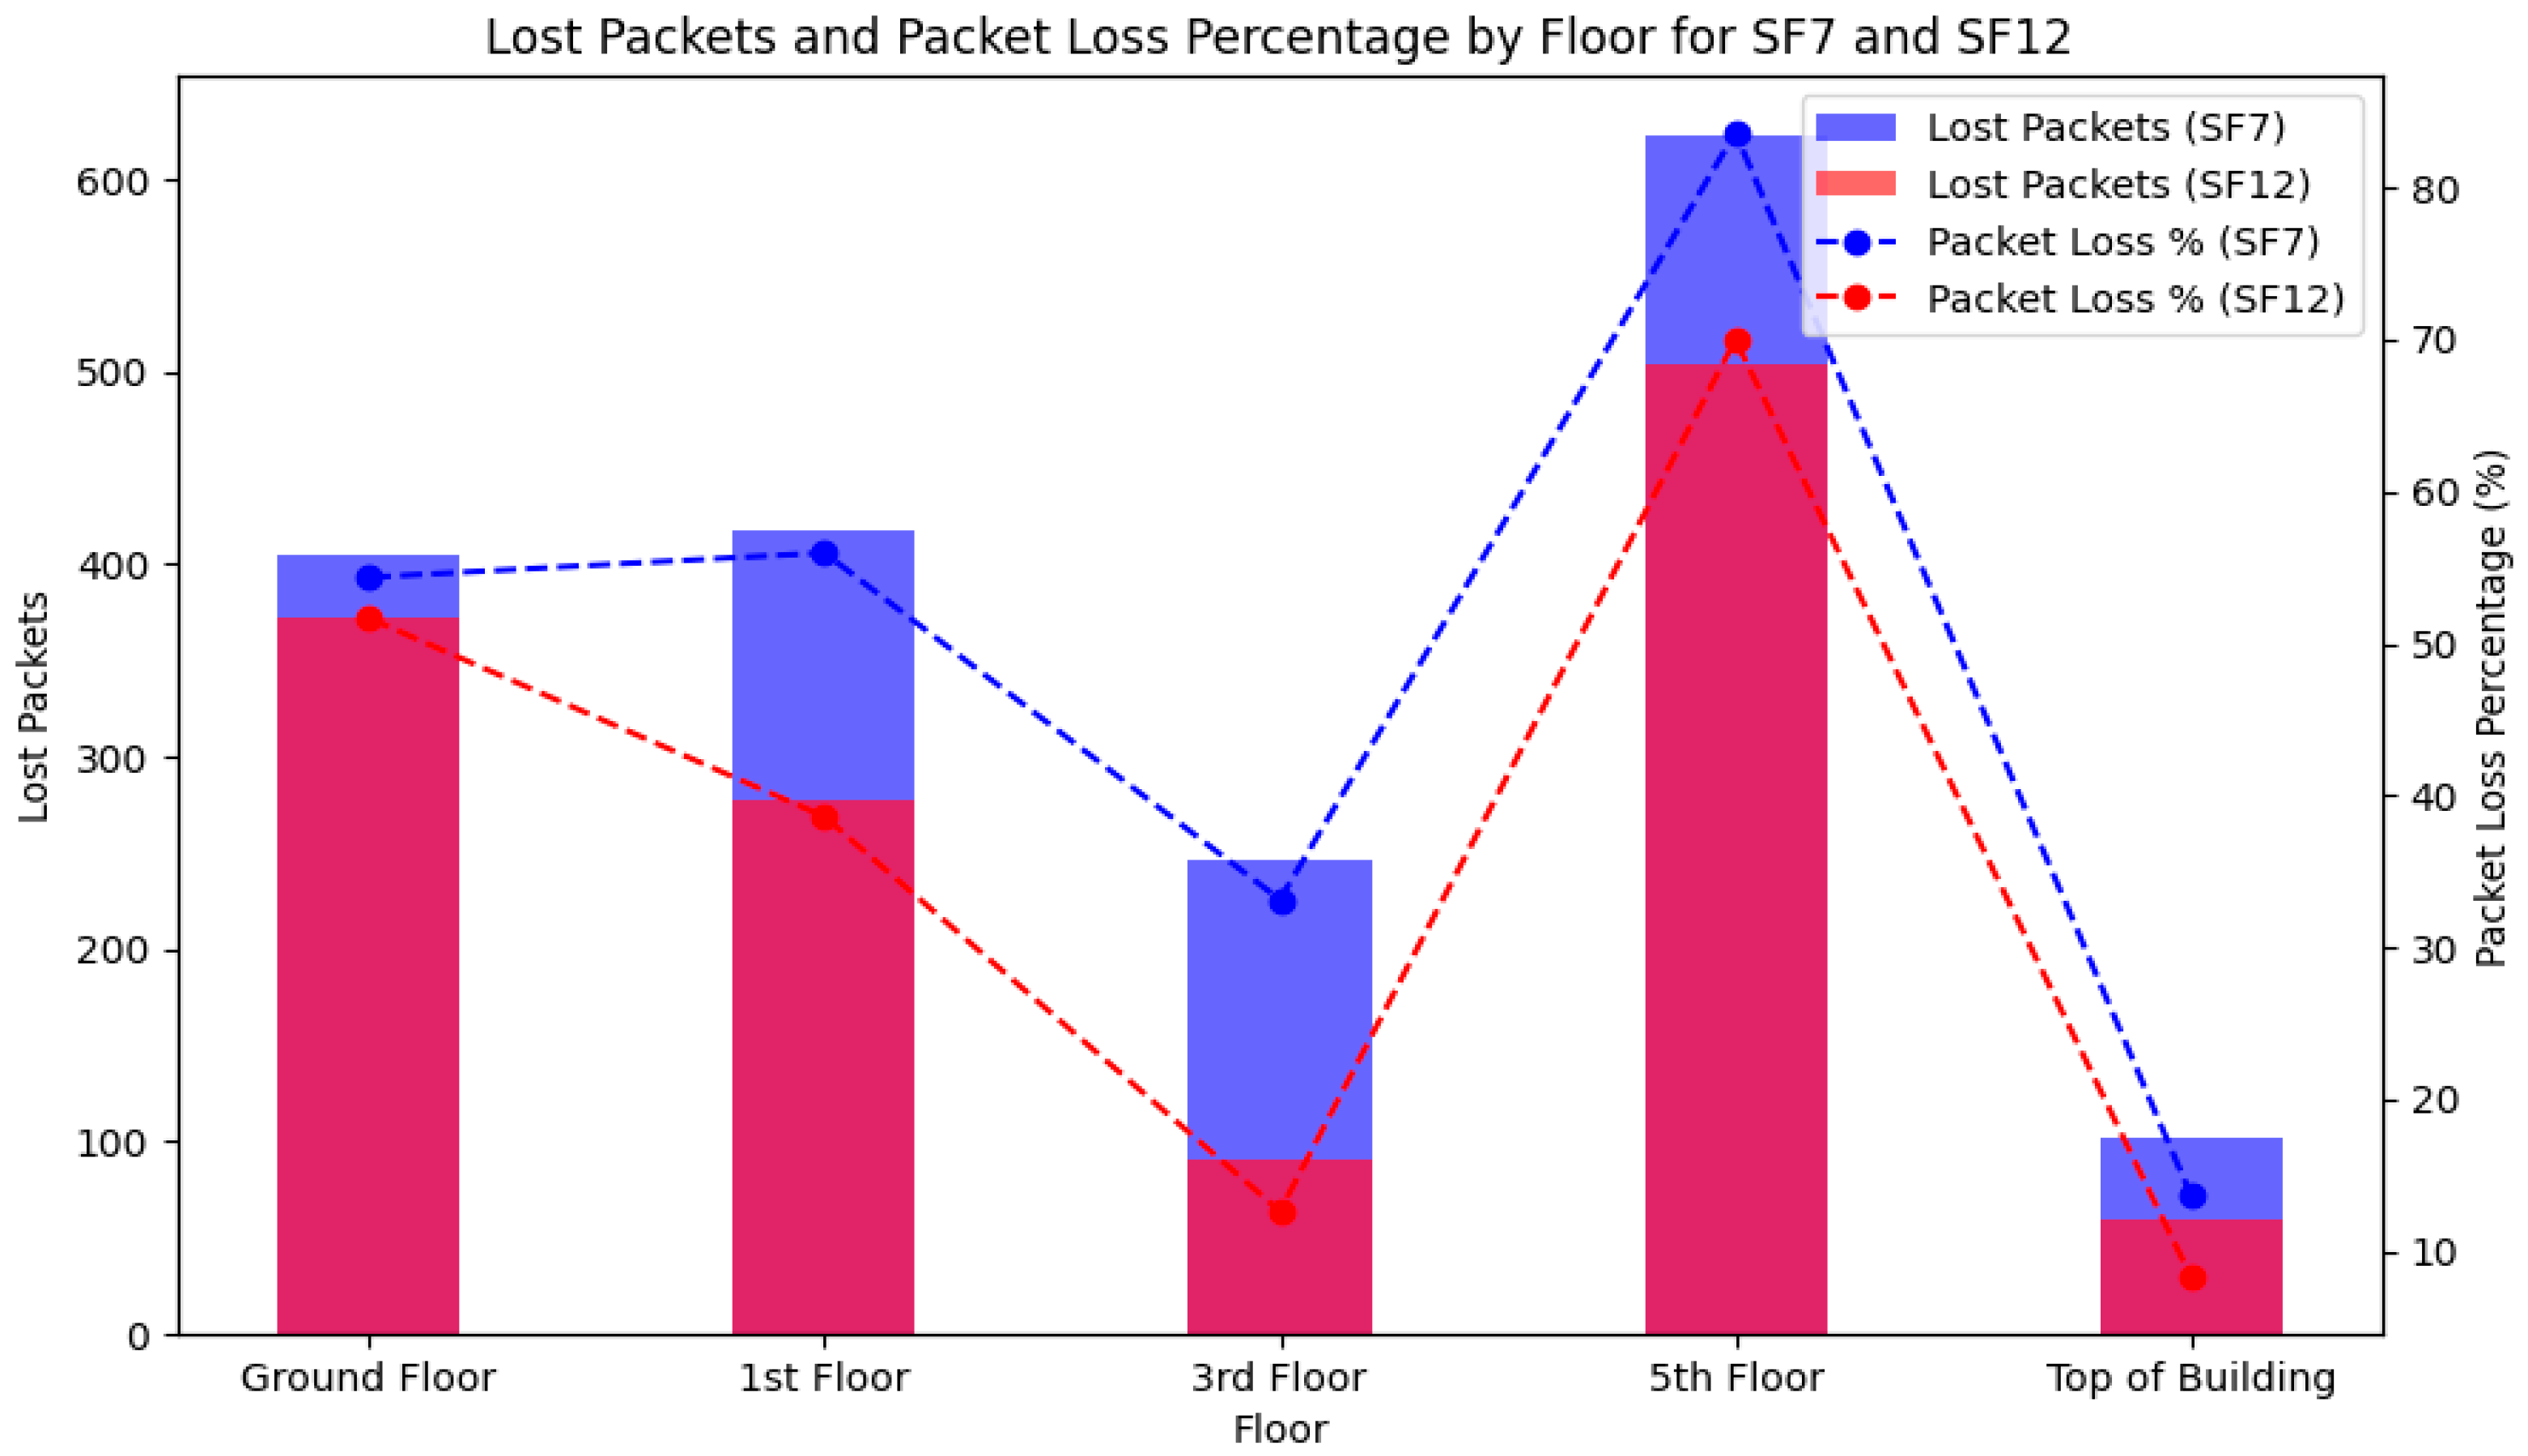
6.1.1. Packet Loss Evaluation

This section examines the packet loss observed during the gateway placement experiment, a crucial metric for evaluating network efficiency and data transmission reliability. By analyzing packet loss rates in correlation with gateway positions for both SF7 and SF12, this study aims at pinpointing optimal gateway locations that minimize data loss and enhance overall network performance. This packet loss analysis serves as the first phase of performance evaluation, prior to investigating signal strength (RSSI) and noise ratio (SNR) and applying the GateOpt PSODE optimization algorithm.
To calculate the percentage of packet loss for each floor and spreading factor, we use the following formula:
P a c k e t   L o s s   P e r c e n t a g e = N u m b e r   o f   p a c k e t s   l o s t T o t a l   p a c k e t   s s e n t × 100
Using the provided data from our collected data and by applying Equation (13), we obtained the results in Table 5, and Figure 12 presents the number of packets lost with the corresponding percentage.
The significantly lower packet loss observed with SF12, compared to SF7 at the same distance, is primarily due to the increased receiver sensitivity at higher spreading factors. This relationship can be explained using the LoRa receiver sensitivity in Equation (14):
S = 174 + 10 log 10 B W + N F + S N R m i n
where
  • S is the receiver sensitivity (dBm);
  • BW is the bandwidth (KHz);
  • NF is the noise figure (dB);
  • SNRmin is the minimum required Signal-To-Noise Ratio for a given spreading factor.
As the spreading factor increases (for example, from SF7 to SF12), the minimum required SNR decreases (from approximately −7.5 dB for SF7 to about −20 dB for SF12). This means that devices configured with SF12 can successfully receive and decode much weaker signals compared to SF7. As a result, even under identical conditions and distances, packets transmitted using SF12 are less likely to be lost due to poor signal quality, resulting in significantly lower packet loss.
Different perspectives of the analysis of packet loss, in the case of placing the GWs on different floors, are provided in relation to network performance. As expected, from a theoretical point of view, the topmost floor turns out to be the best place to position a gateway, with a better communication link in the line of sight and the least number of barriers, which provided the least percentage of packet loss for both SF7 and SF12. On the other hand, the GWs placed on the fifth floor, due to a couple of building peculiarities, performed poorly. It can be observed that it had the highest packet loss percentage and is, therefore, not fit for the placement of a gateway. Reasonable performance was observed for the third floor during the measurement, particularly for SF12, making it a good candidate for a second GW placement. The ground and first floors, on the other hand, had combined moderate performance, which can be understood to be because of obstacles lowering the level. It was reaffirmed that SF12 performs better compared to SF7, as theoretically expected, on all floors, which can only confirm its viability in the provision of services in areas where there are more barriers or where long-range communication is required. These findings emphasize the importance of strategic gateway placement to ensure robust and reliable network performance. These packet loss patterns reveal that top-floor deployment offers the most favorable communication conditions. In the next sections, we analyze RSSI and SNR to further understand signal behavior under similar conditions.

6.1.2. RSSI Analysis with Clustering

In LoRaWAN networks, the Received Signal Strength Indicator (RSSI) is one of the primitive metrics used to evaluate signal quality and its propagation. In this part of the study, we analyze variations in RSSI values from five gateways using two different configurations: SF7 and SF12. To understand the wide variance in RSSI values and their corresponding performance, a clustering method, K-means, was applied to the measurements and divided them into six clusters, from Cluster 0 to Cluster 5, which represent very strong to critically weak signal levels.
The clustering algorithm was applied independently for each gateway height and each spreading factor to capture local propagation features. Thus, the specific range of RSSI for each cluster differs regarding the gateway location. Table 6 below describes the range of the defined clusters for SF12 and SF7, respectively:
These cluster boundaries will be used as a base reference for the subsequent performance analysis conducted from floor to floor. On the ground floor, SF7 has an initial yield of RSSI values in Cluster 0 (−85 to −79 dBm) and improves due to its proximity to the gateway. However, the signal quality severely deteriorates with distance, with several values hitting Cluster 5 (−118 to −110 dBm). This rapid degradation yields a 54.4% packet loss, showcasing SF7’s weakness in blocked environments. On the other hand, SF12 displays a more forgiving slope of attenuation, starting at Cluster 0 (−87 to −67 dBm) and ending at Cluster 5 (−130 to −123 dBm), yielding a slightly better 51.7% packet loss.
On the first floor, the SF7 RSSI values start at Cluster 0 (−77 to −72 dBm) and end t Cluster 5 (−121 to −113 dBm), achieving a 56.0 packet loss. SF12 starts at Cluster 0 (−88 to −69 dBm) with a better signal quality but ends at Cluster 5 (−132 to −127 dBm). SF12 suffers a greater packet loss as well, achieving a total of 38.6%, despite many values remaining at Clusters 1–3.
On the third floor, SF7 struggles with Clusters 0 and 5 (−80 to −66 dBm and −127 to −118 dBm, respectively), reaching a 33.2% packet loss rate. SF12 performs significantly better, beginning at Cluster 0 (−81 to −63 dBm) and ending at Cluster 5 (−137 to −127 dBm). Due to the stronger clustering in Clusters 1 and 2, packet loss is only 12.6%.
On the fifth floor, conditions worsen further. SF7 starts at Cluster 0 (−112 to −109 dBm) and ends at Cluster 5 (−130 to −126 dBm), suffering the most from packet loss at 83.6%. SF12 performs slightly better, starting at Cluster 0 (−115 to −107 dBm) and ending at Cluster 5 (−142 to −137 dBm), suffering a 70.0% packet loss on the way. Most values for both SFs are clustered at Clusters 4 and 5, reinforcing the poor conditions observed at this level.
At the top of the building, both SFs exhibit their peak performance. SF7 starts at Cluster 0 (−82 to −73 dBm) and ends at around Cluster 5 (−118 to −107 dBm), with a 13.7% packet loss. SF12 demonstrates the strongest claim signal distribution, starting at Cluster 0 (−79 to −67 dBm) and only slightly degrading to Cluster 5 (−125 to −109 dBm), which is an 8.3% packet loss. These trends are vividly depicted in Figure 13, which contains the RSSI versus distance plots for the top-floor gateway, with K-means clustering added. The spatial segmentation validates the clear dominance of the high-quality signal clusters (0–2) of the SF12 signal strength at this position.
These results further confirm the hypothesis that having higher placed gateways leads to stronger and more stable signal propagation. In addition, the clustering approach offers an interesting perspective on explaining the distribution of RSSI values amidst multi-layered environments. Any dataset utilized in this specific clustering analysis can be provided upon request for replicated or additional studies. Figure 14 illustrates the average RSSI measured on each floor for SF7 and SF12, respectively.

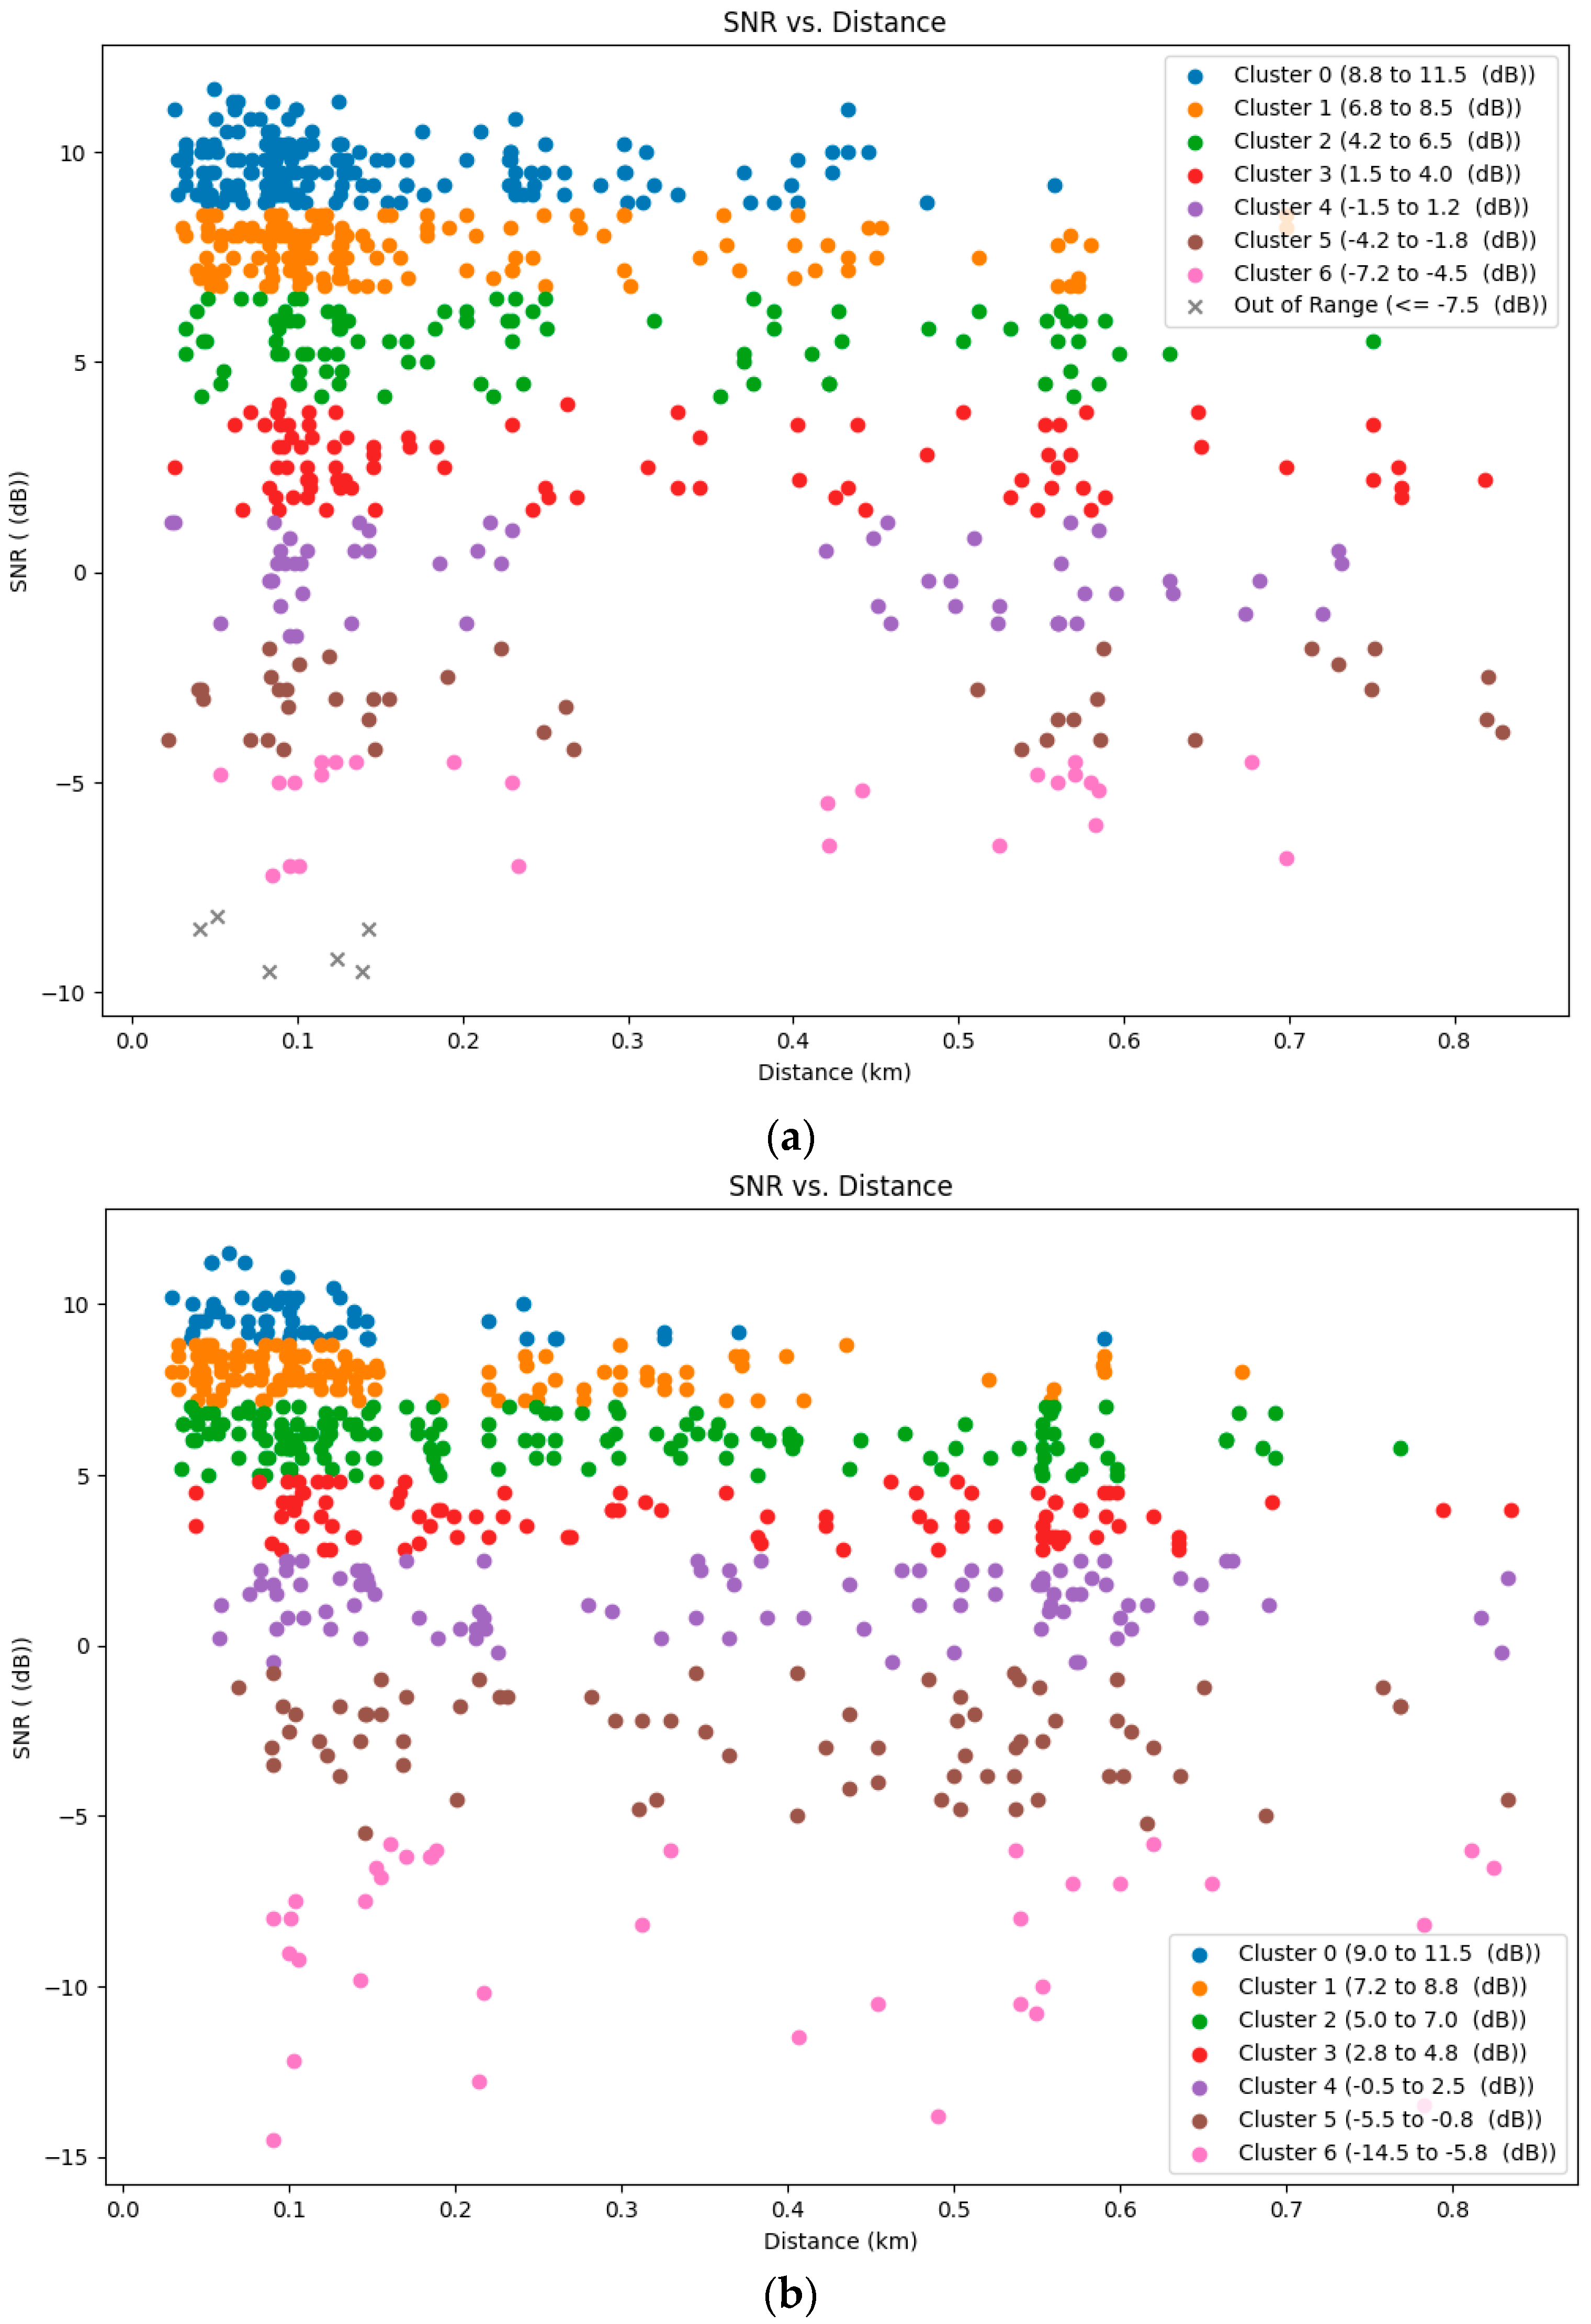
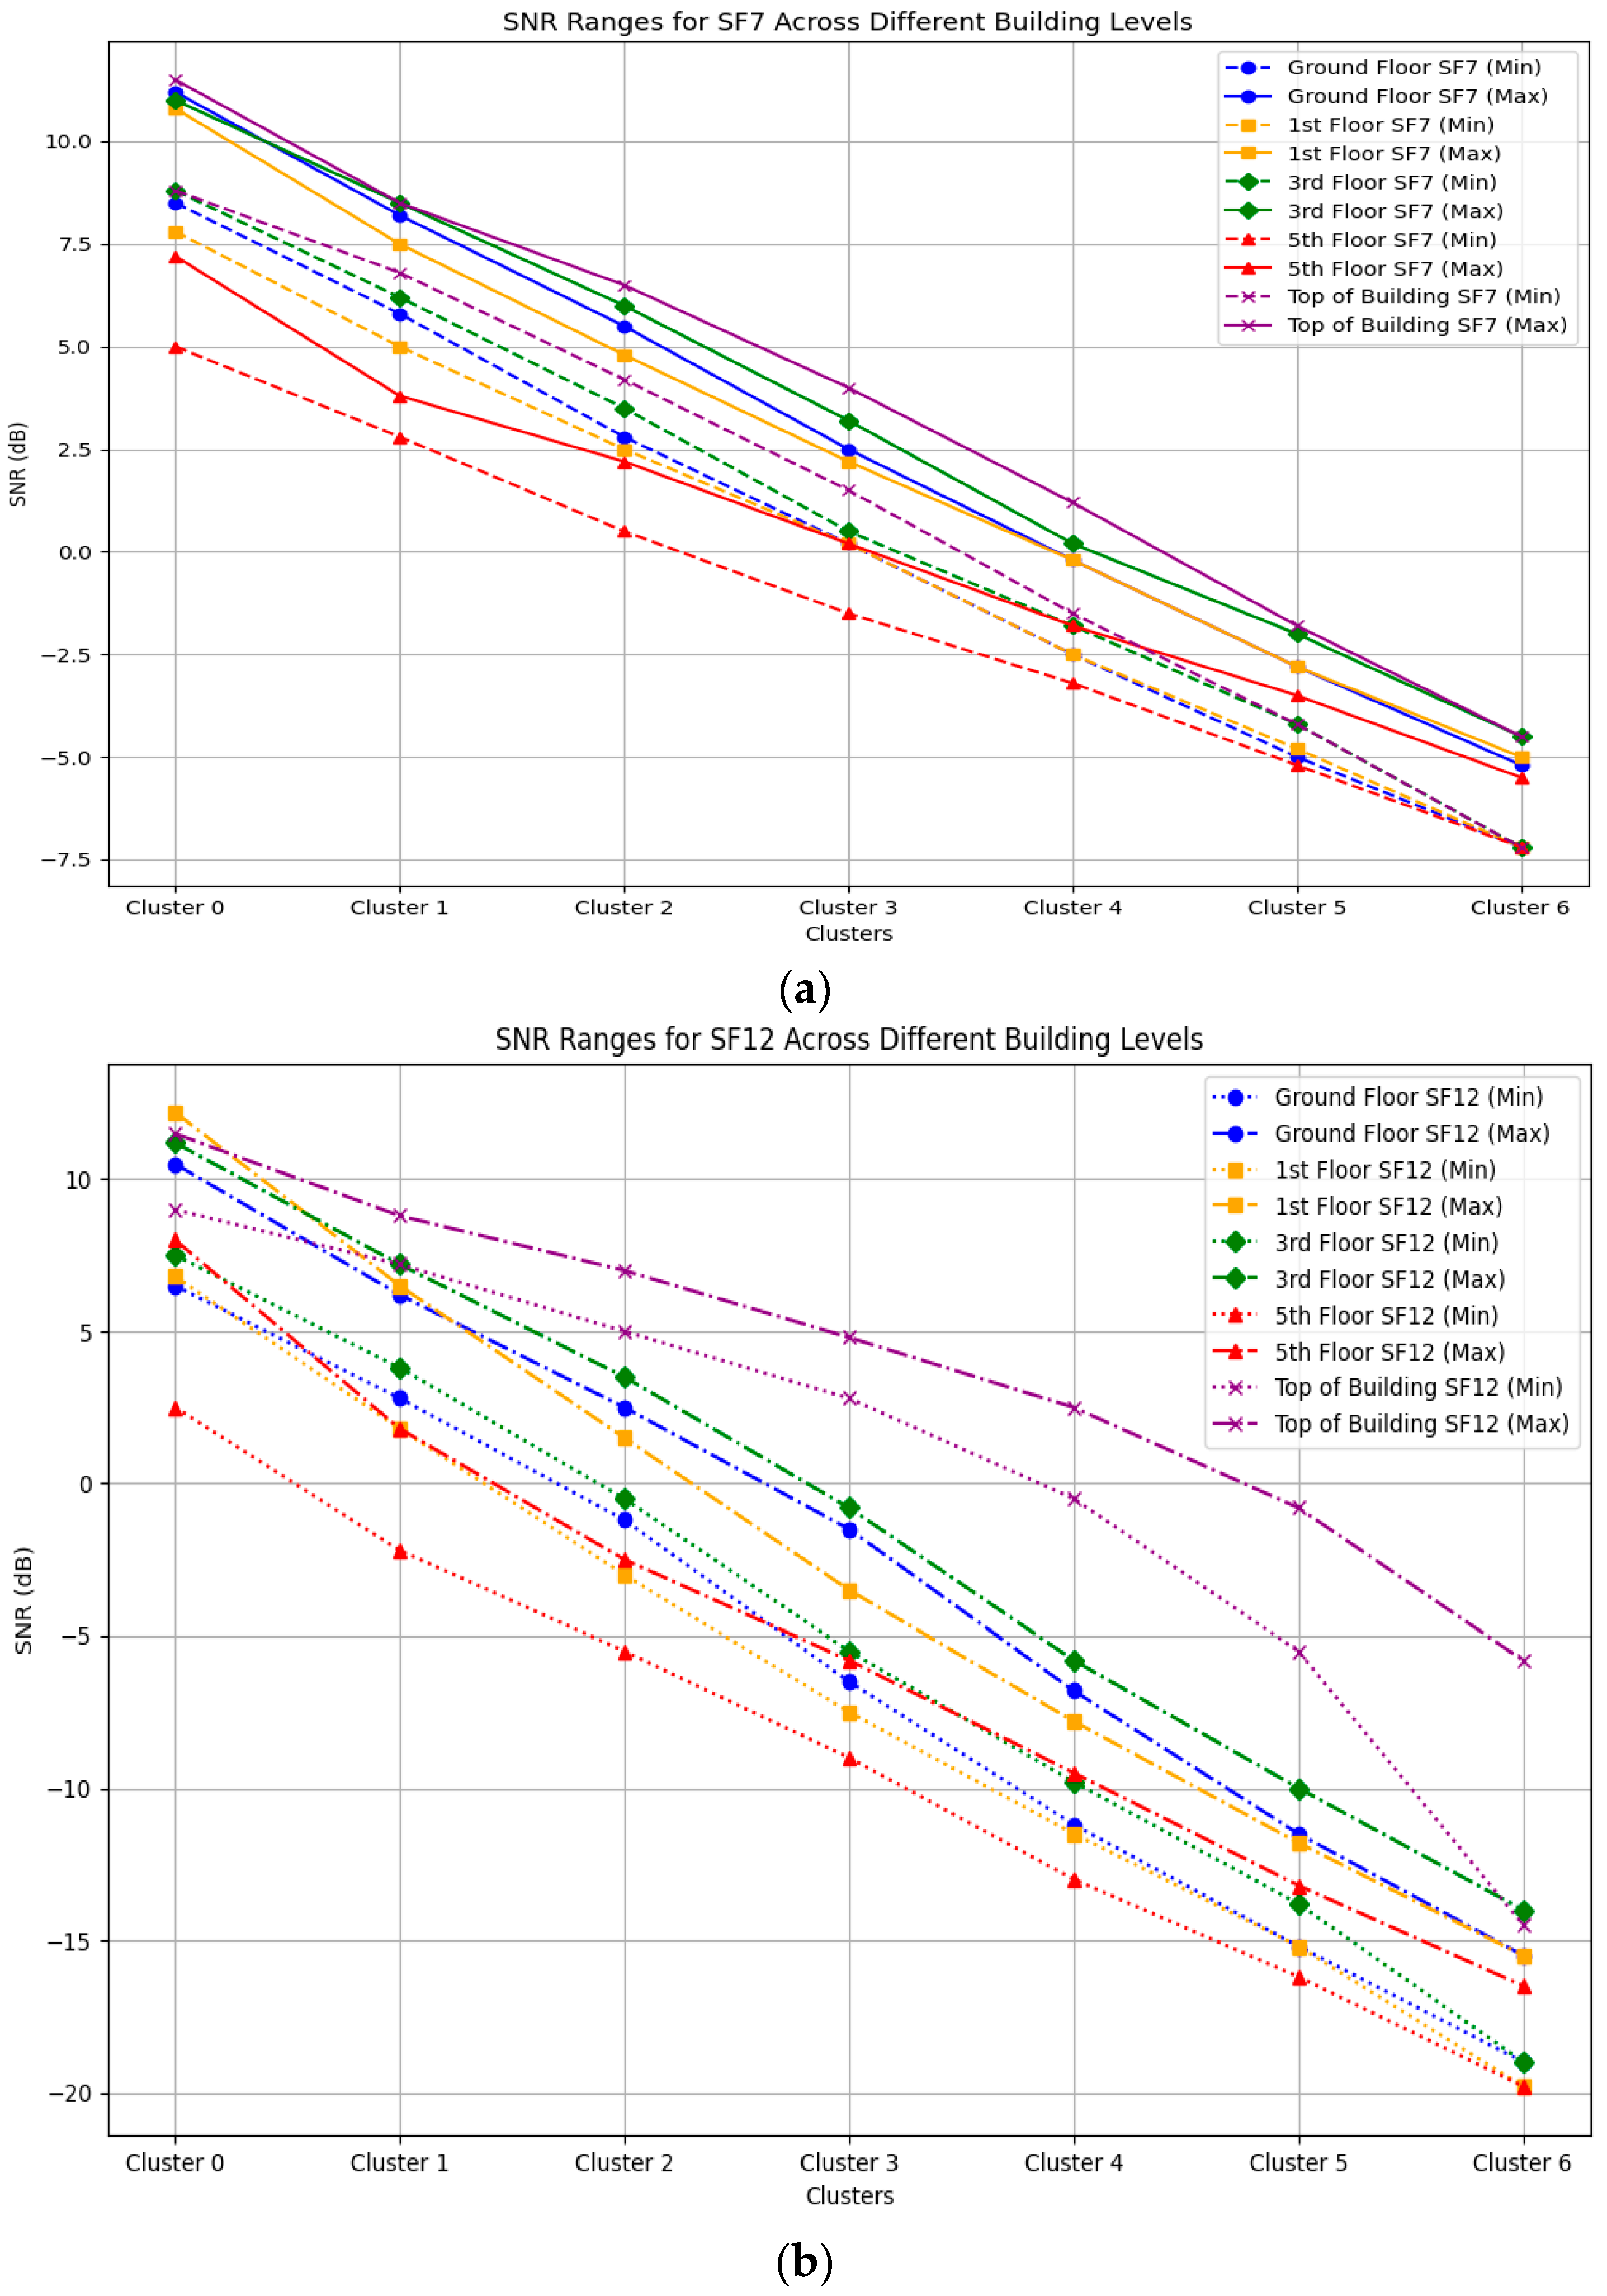
6.1.3. SNR Analysis with Clustering

SNR describes the level of communication quality in a wireless system in terms of useful signal power compared to background noise. SNR impacts the clarity of signal reception, increases the success of demodulation, and decreases the chances of packet loss. In LoRaWAN systems, each spreading factor (SF) has a different SNR sensitivity threshold. For instance, SF7 requires a minimum SNR of approximately −7.5 dB, while SF12 can still decode packets down to −20 dB, enabling robust communication under very noisy or distant conditions.
To structure the performance evaluation, SNR data was processed using K-means clustering for each gateway height and spreading factor individually. The SNR data was valid for clustering and was categorized into seven categories, spanning from excellent to very poor signal conditions (Cluster 0 to Cluster 6). The analysis was limited to successful receptions by excluding packets without valid SNR readings, which were assumed to be due to transmission failure. Table 7 below provides the complete distribution of SNR values for all clusters and gateways levels for SF7 and SF12.
The SNR behavior across all floors exhibits a uniform pattern. Both SF7 and SF12 near the gateway experience high SNR values (Cluster 0 and Cluster 1) that progressively lessen (Clusters 4–6) with increased distance or obstruction interference. SF12 has a broader SNR range than SF7, demonstrating a more expansive range of operational SNR.
Further, obstruction inhibition enhances the line of sight, leading to windows transmitting higher SNR for both spreading factors at the top of the building. SF7 values begin at Cluster 0 (8.8 to 11.5 dB) and decline toward Cluster 6 (−7.2 to −4.5 dB) with increasing distance. SF12 starts at Cluster 0 (9 to 11.5 dB) and stepwise descends into Cluster 6 (−14.5 to −5.8 dB). Though SF12 has better stability, it suffers from a wider span of data points below decoding thresholds.
Figure 15 conveys these findings by plotting the SNR versus distance at the gateway of the top floor for both spreading factors. The clustering boundaries highlight how SF12 maintains strong performance even at longer distances, while SF7 is more susceptible to signal degradation.
The full variation in SNR values across all gateway placements is summarized in Figure 16. Subfigure (a) shows the SNR cluster distribution for SF7, while subfigure (b) depicts the same for SF12. These figures provide a comparative overview of how the signal quality varies floor by floor. It is evident that SF12 maintains broader coverage across the clusters, with a greater proportion of data points in higher SNR categories at each level, confirming its superior robustness under various propagation conditions.

6.1.4. GateOpt PSODE Results—Single Gateway

An investigation of the single gateway situation is crucial for verifying the efficiency of the GateOpt PSODE optimization algorithm. In this confined scenario, an assessment of each floor separately permits both algorithmic and manual decisions based on communication principles, notably on the radio communication’s line-of-sight (LoS) and packet loss ratio. In traditional approaches, gateway placement is often based solely on maximizing height or selecting arbitrary building floors. As a baseline, initial placements are typically on lower floors (such as the ground or first floor) or at fixed heights, without considering real performance metrics. In contrast, our algorithm evaluates each possible placement using empirical data—specifically, the measured RSSI, SNR, and packet loss. The optimization process selects the floor(s) that maximizes network quality based on these combined metrics.
For example, as shown in Table 8, the algorithm assigns an optimized score of 0.466 to the ground floor and only 0.346 to the first floor for SF7, indicating that higher placement alone is not optimal. The best-performing placement is consistently identified as the top floor, which achieves the highest score of 1.000 for SF12, highlighting the clear improvement obtained through the data-driven optimization method compared to simple initial placements. Table 8 illustrates the optimized scores obtained by the GateOpt PSODE algorithm for each floor.
These scores indicate the composite network performance of each GW position as they relate to the overall reliability and quality of the signal received, with higher scores indicating better performance. As shown in the previous table, the top floor maintains the highest score for both spreading factors, which are 0.855 for SF7 and 1.000 for SF12.
An optimized score of 1.000 indicates that the location achieves the ideal equilibrium for all three-performance metrics, packet loss, RSSI, and SNR, i.e., where packet loss is low, RSSI is strong, and SNR is high. This theoretical optimum confirms that top-floor deployment provides advantageous propagation conditions, particularly for SF12, which performs better in long-range NLoS conditions.
The third floor also obtains a strong score for SF12 at 0.793, making it a potential secondary candidate. However, the first and ground floors yield only moderate results, while the fifth floor is the weakest performing, on a par with SF12, scoring 0.000 due to extreme packet loss, poor signals, obstructing structures, and interference at that elevation, resulting from signals being blocked by structures and interference from other signals. The results are shown in Figure 17, where optimized scores per floor for SF7 and SF12 are presented. This figure proves that top-floor gateway placement holds the strongest position in link quality and network reliability.
These results validate that the performance of the GateOpt PSODE algorithm is consistent with its theoretical expectations and benchmarking metrics. Single-gateway (SGW) LoRaWAN topology upper-floor placement is confirmed as the optimal LoRaWAN position for multi-story building deployments, though third-floor placement also serves as a reasonable alternative in some scenarios, notably under SF12.

6.2. Multi-Gateway Placement Evaluation

In a multiple-gateway assessment, packet loss is the first to be analyzed, since it reveals the most immediate glimpse into the performance of the network with different gateway locations. Although we know from the prior section that the top floor has the best single-gateway performance, this part investigates an extensive range of strategies, including those with and without the top floor, to determine if other gateways could improve data coverage and reduce data loss. We determine the configured combinations that optimize vertical coverage while minimizing packet losses and reducing the impact of weak GWs (e.g., the 5th floor) on the overall system performance.

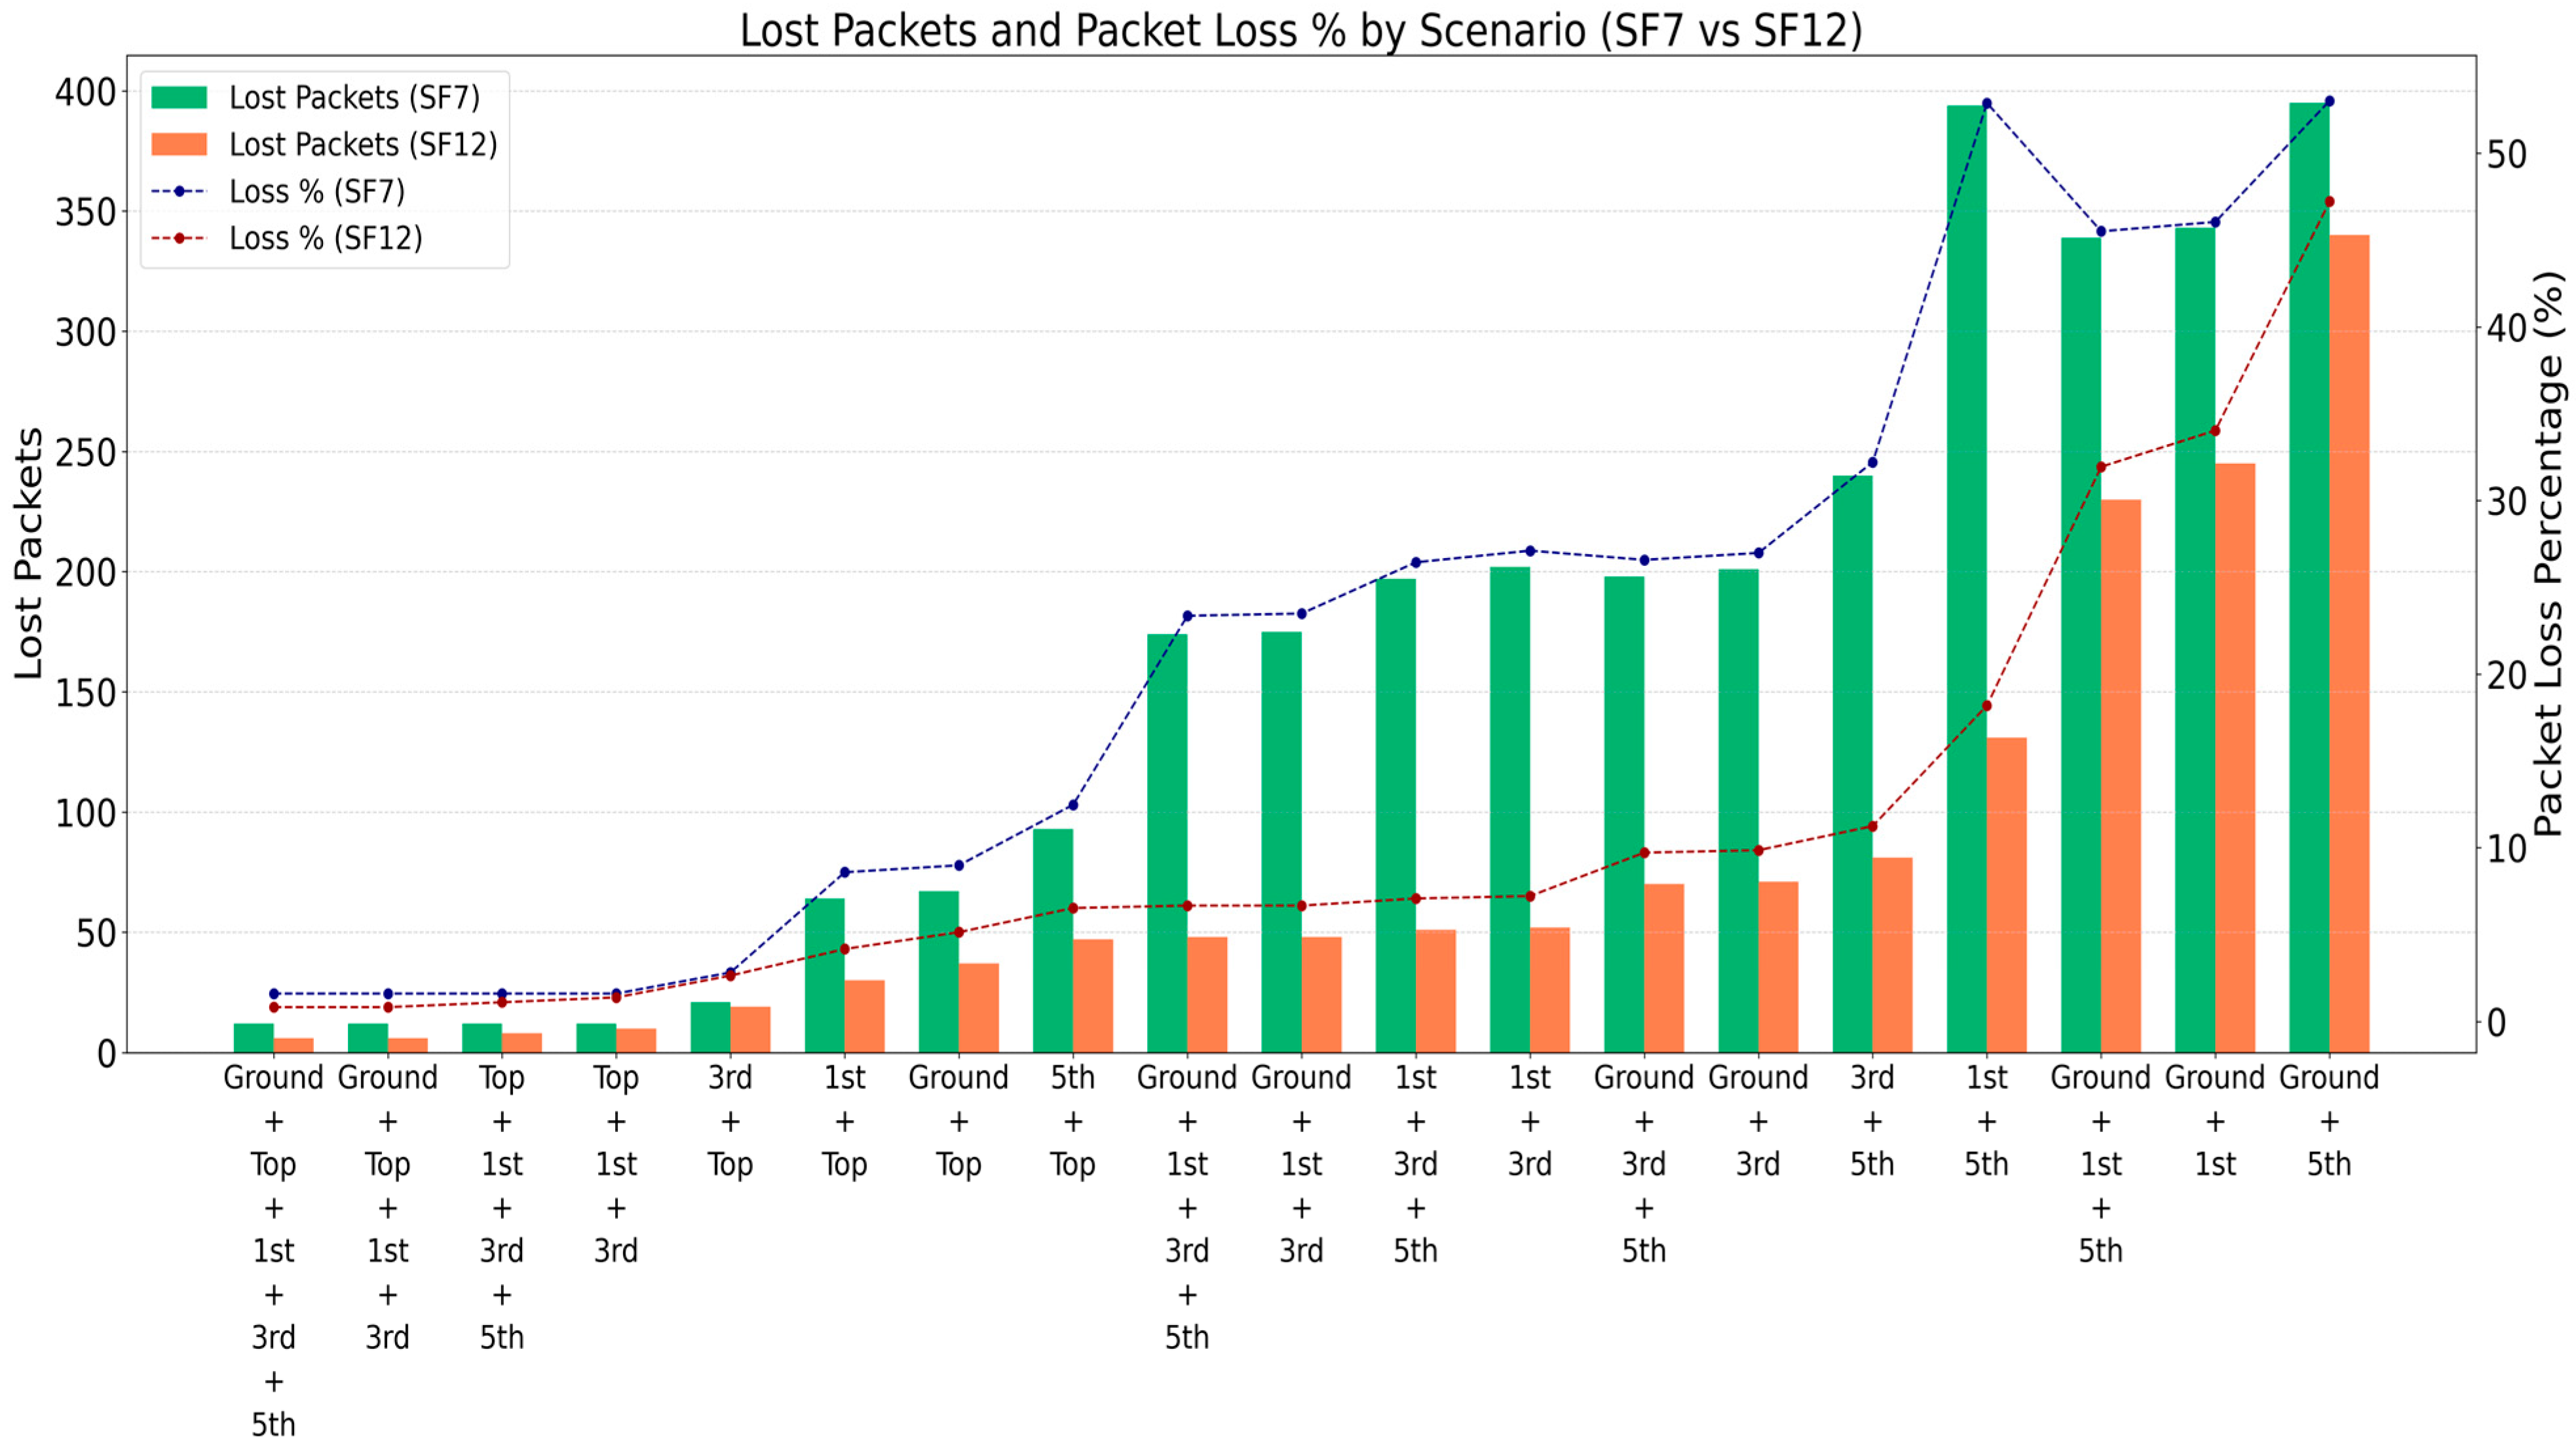
6.2.1. Packet Loss Evaluation Across Scenarios

As shown in Table 9 and illustrated in Figure 18, packet loss results for all scenarios with the SF12 and SF7 configuration are listed. Scenarios that have the top floor as part of the scenario consistently exhibit the lowest proportion of packets loss, which confirms the benefit of placing gateways at elevated positions within the structure. For instance, the combinations (Top + 1st + 3rd) and (Ground + Top + 1st + 3rd) and the complete five-gateway configuration exhibit a very low packet loss of as much as 0.83% in SF12 and 1.61% in SF7, which indicates superb coverage and negligible transmission failures. An exceedingly high packet loss of greater than 30–50% is observed in some of the gateway combinations that exclude the top floor, such as (Ground + 1st + 5th) or (1st + 5th). This is a consequence of drowning in signal obstruction and poor reception abilities in the mid to lower parts of the building. Of interest is the performance degradation inflicted by any arrangement featuring the 5th floor as a solo or joint node. This arises from the ever-growing packet loss attributed to the weak link brought into play regardless of configuration.
These empirical results reinforce a crucial insight: adding more gateways does not always improve reliability, especially when one of the included nodes suffers from poor reception quality. Scenarios like (Top + 1st + 3rd + 5th), while seemingly redundant and well-distributed, exhibit higher packet loss than their three-gateway counterparts due to the underperformance of the 5th floor.

6.2.2. GateOpt PSODE Optimization Results

Following the packet loss evaluation, the GateOpt PSODE optimization algorithm was applied to determine the overall performance scores for each gateway placement scenario by integrating RSSI, SNR, and packet loss into a single estimated score. This score provides a holistic view of signal quality and network reliability for each configuration.
In conventional multi-gateway deployments, the initial approach is often to maximize the number of gateways or distribute them uniformly by height or across different floors, with the assumption that more gateways or vertical diversity always enhances network performance. However, our methodology contrasts with this by leveraging empirical performance data to identify the most effective combinations, regardless of the number of gateways or their heights.
As shown in Table 10 and visualized in Figure 19, the highest optimization scores are consistently observed in scenarios that include the top floor. For example, the dual-gateway (Ground + Top) configuration achieves a score of 0.948 for SF12, while the triple-gateway (Top + 1st + 3rd) configuration attains 0.893. Both scenarios significantly outperform configurations that simply increase the gateway count or include more mid-level floors, such as the four-gateway (Ground + 1st + 3rd + 5th) scenario, which only achieves a score of 0.486 for SF12. This demonstrates that simply adding gateways or distributing them across all floors does not guarantee improved network performance. Conversely, several multi-gateway scenarios that include the poorly performing 5th floor—such as (Top + 1st + 3rd + 5th) and (Ground + 1st + 3rd + 5th)—show reduced optimization scores. The persistent underperformance of the 5th floor lowers the overall network quality, further emphasizing the necessity of data-driven, rather than intuition-driven, gateway selection.
All of these combined results show the effectiveness of GateOpt PSODE in balancing empirical measurements and the metrics of signal quality in a derived framework. Our proposed algorithm achieves optimal deployments not based on the number of gateways but rather on the completeness of gateway selection based on their interdependence in the range of propagation and signal stability. Integrating real RSSI, SNR, and packet loss into one single objective makes it possible to data-drive the placement of gateways in urban areas and minimize redundancy while ensuring coverage. Such selection eliminates waste and enhances coverage, as well as harnessed deployment, irrespective of the height and density of the structures.

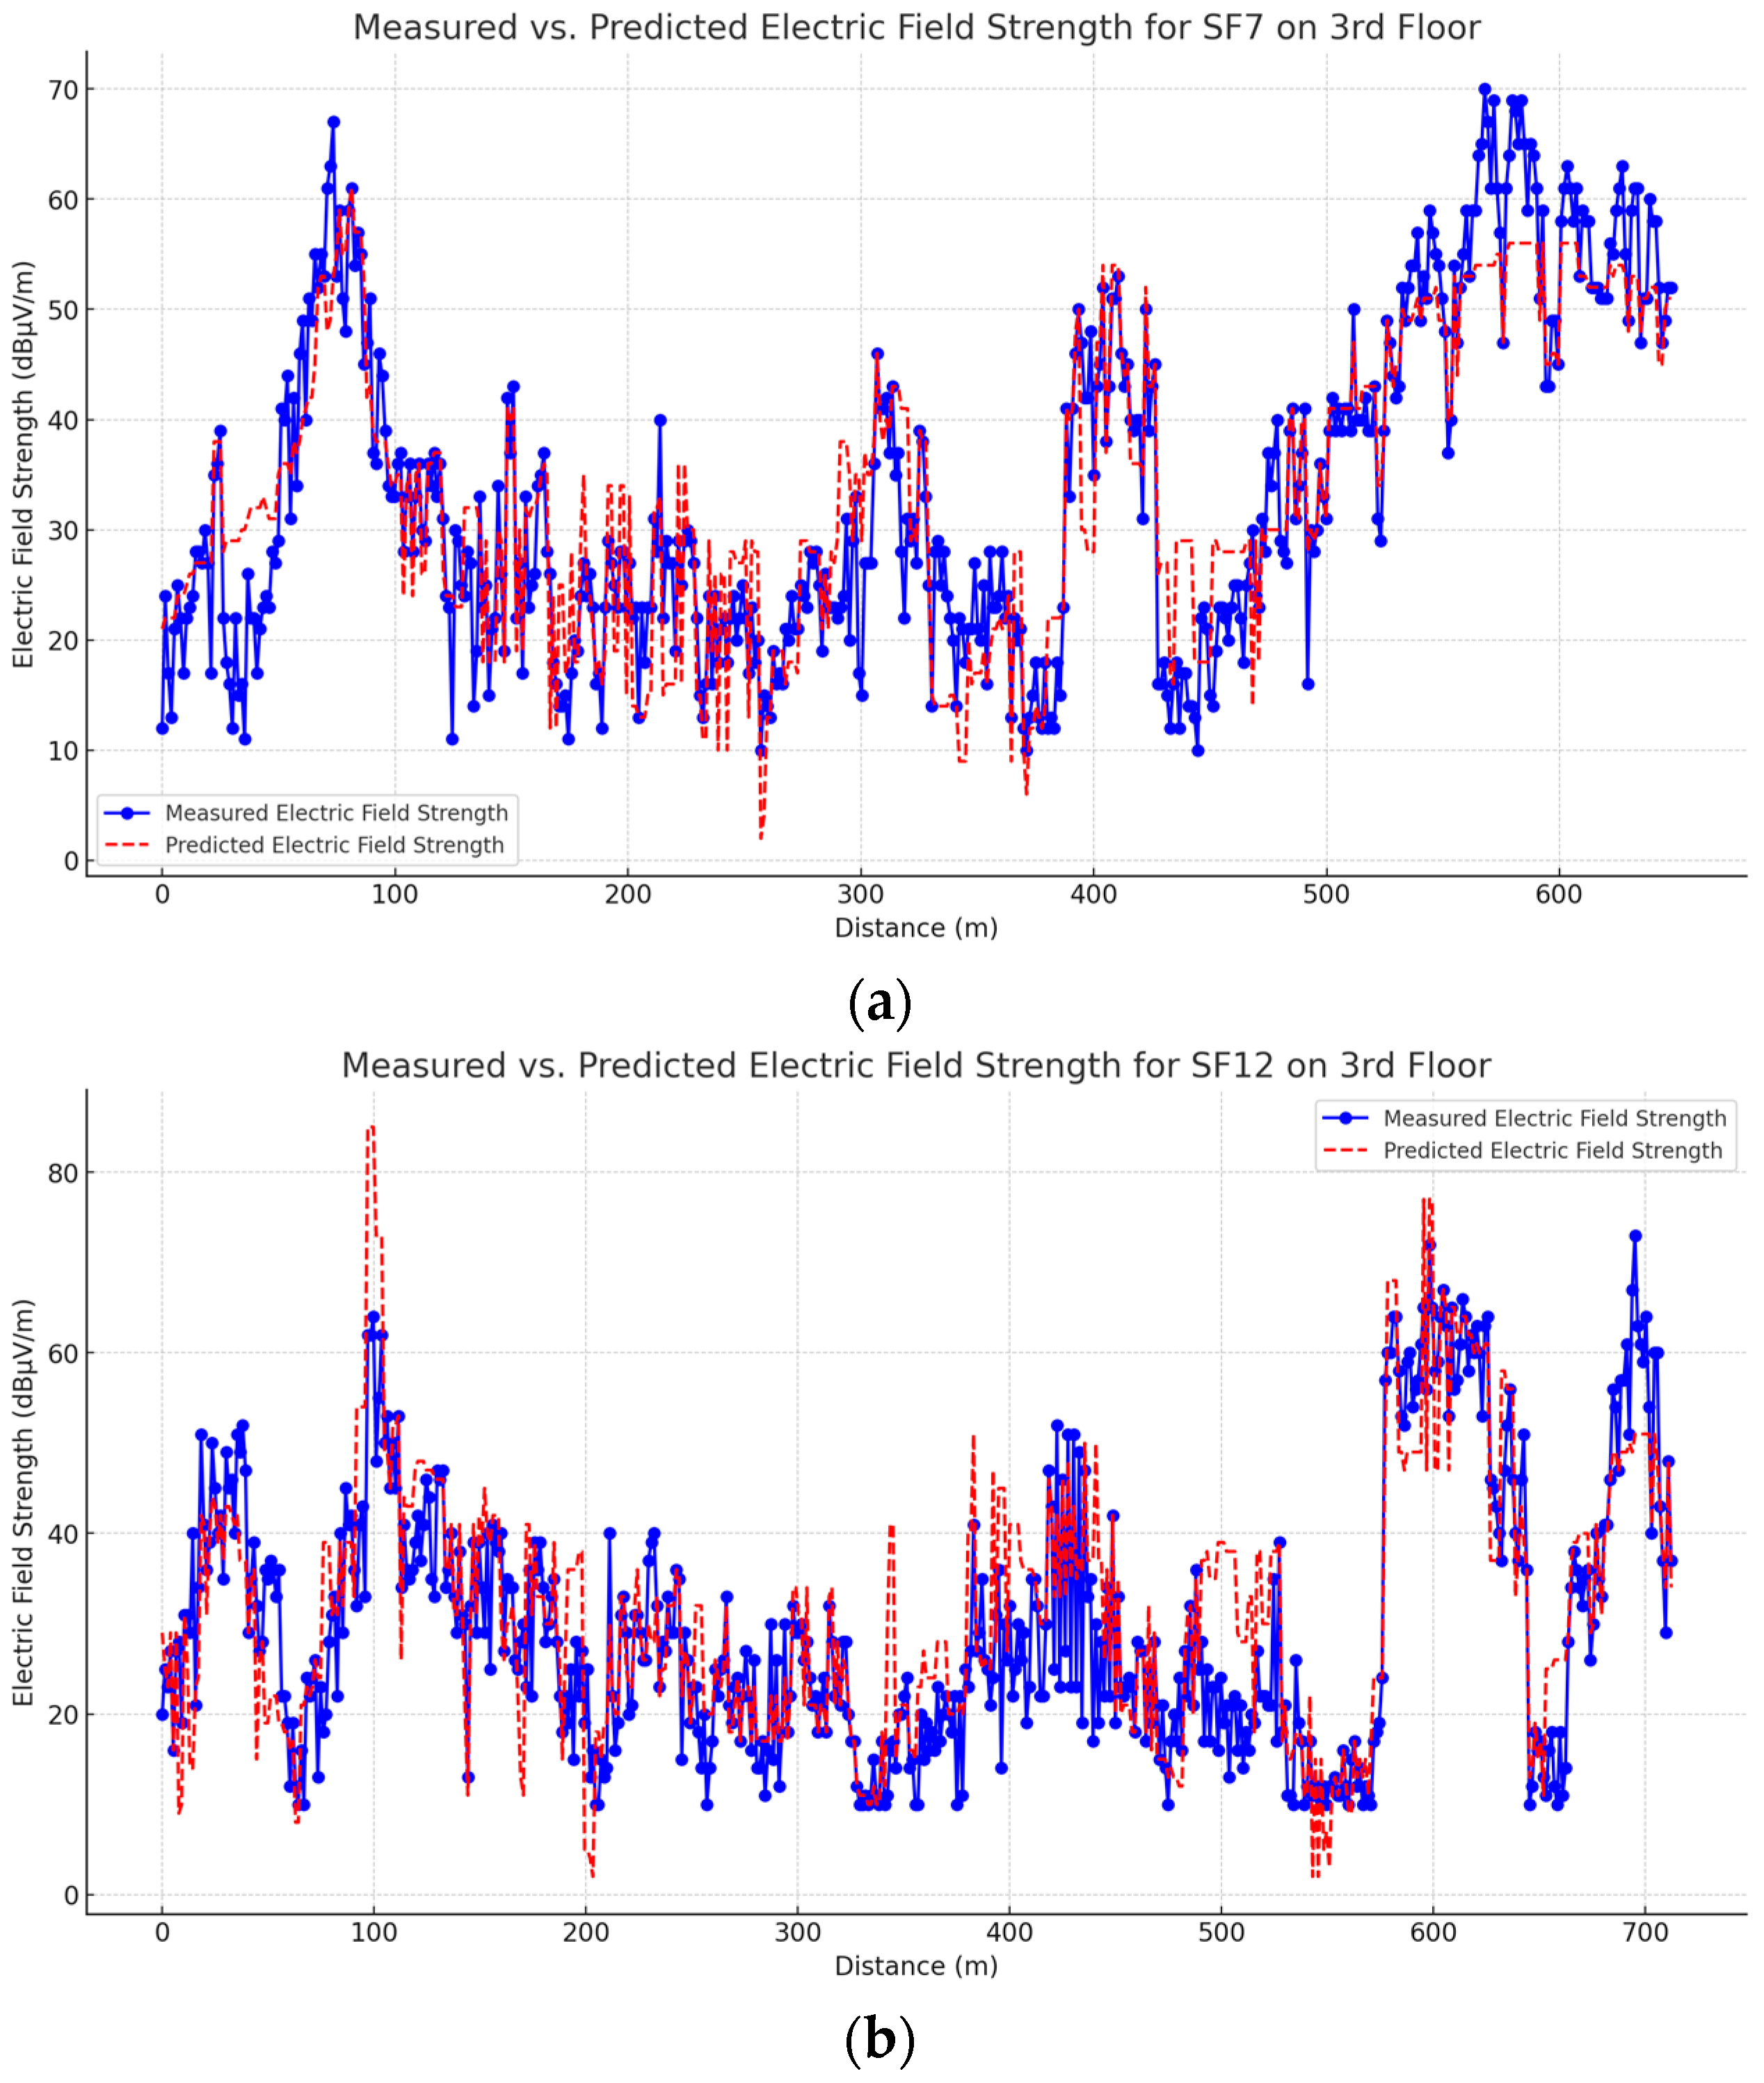
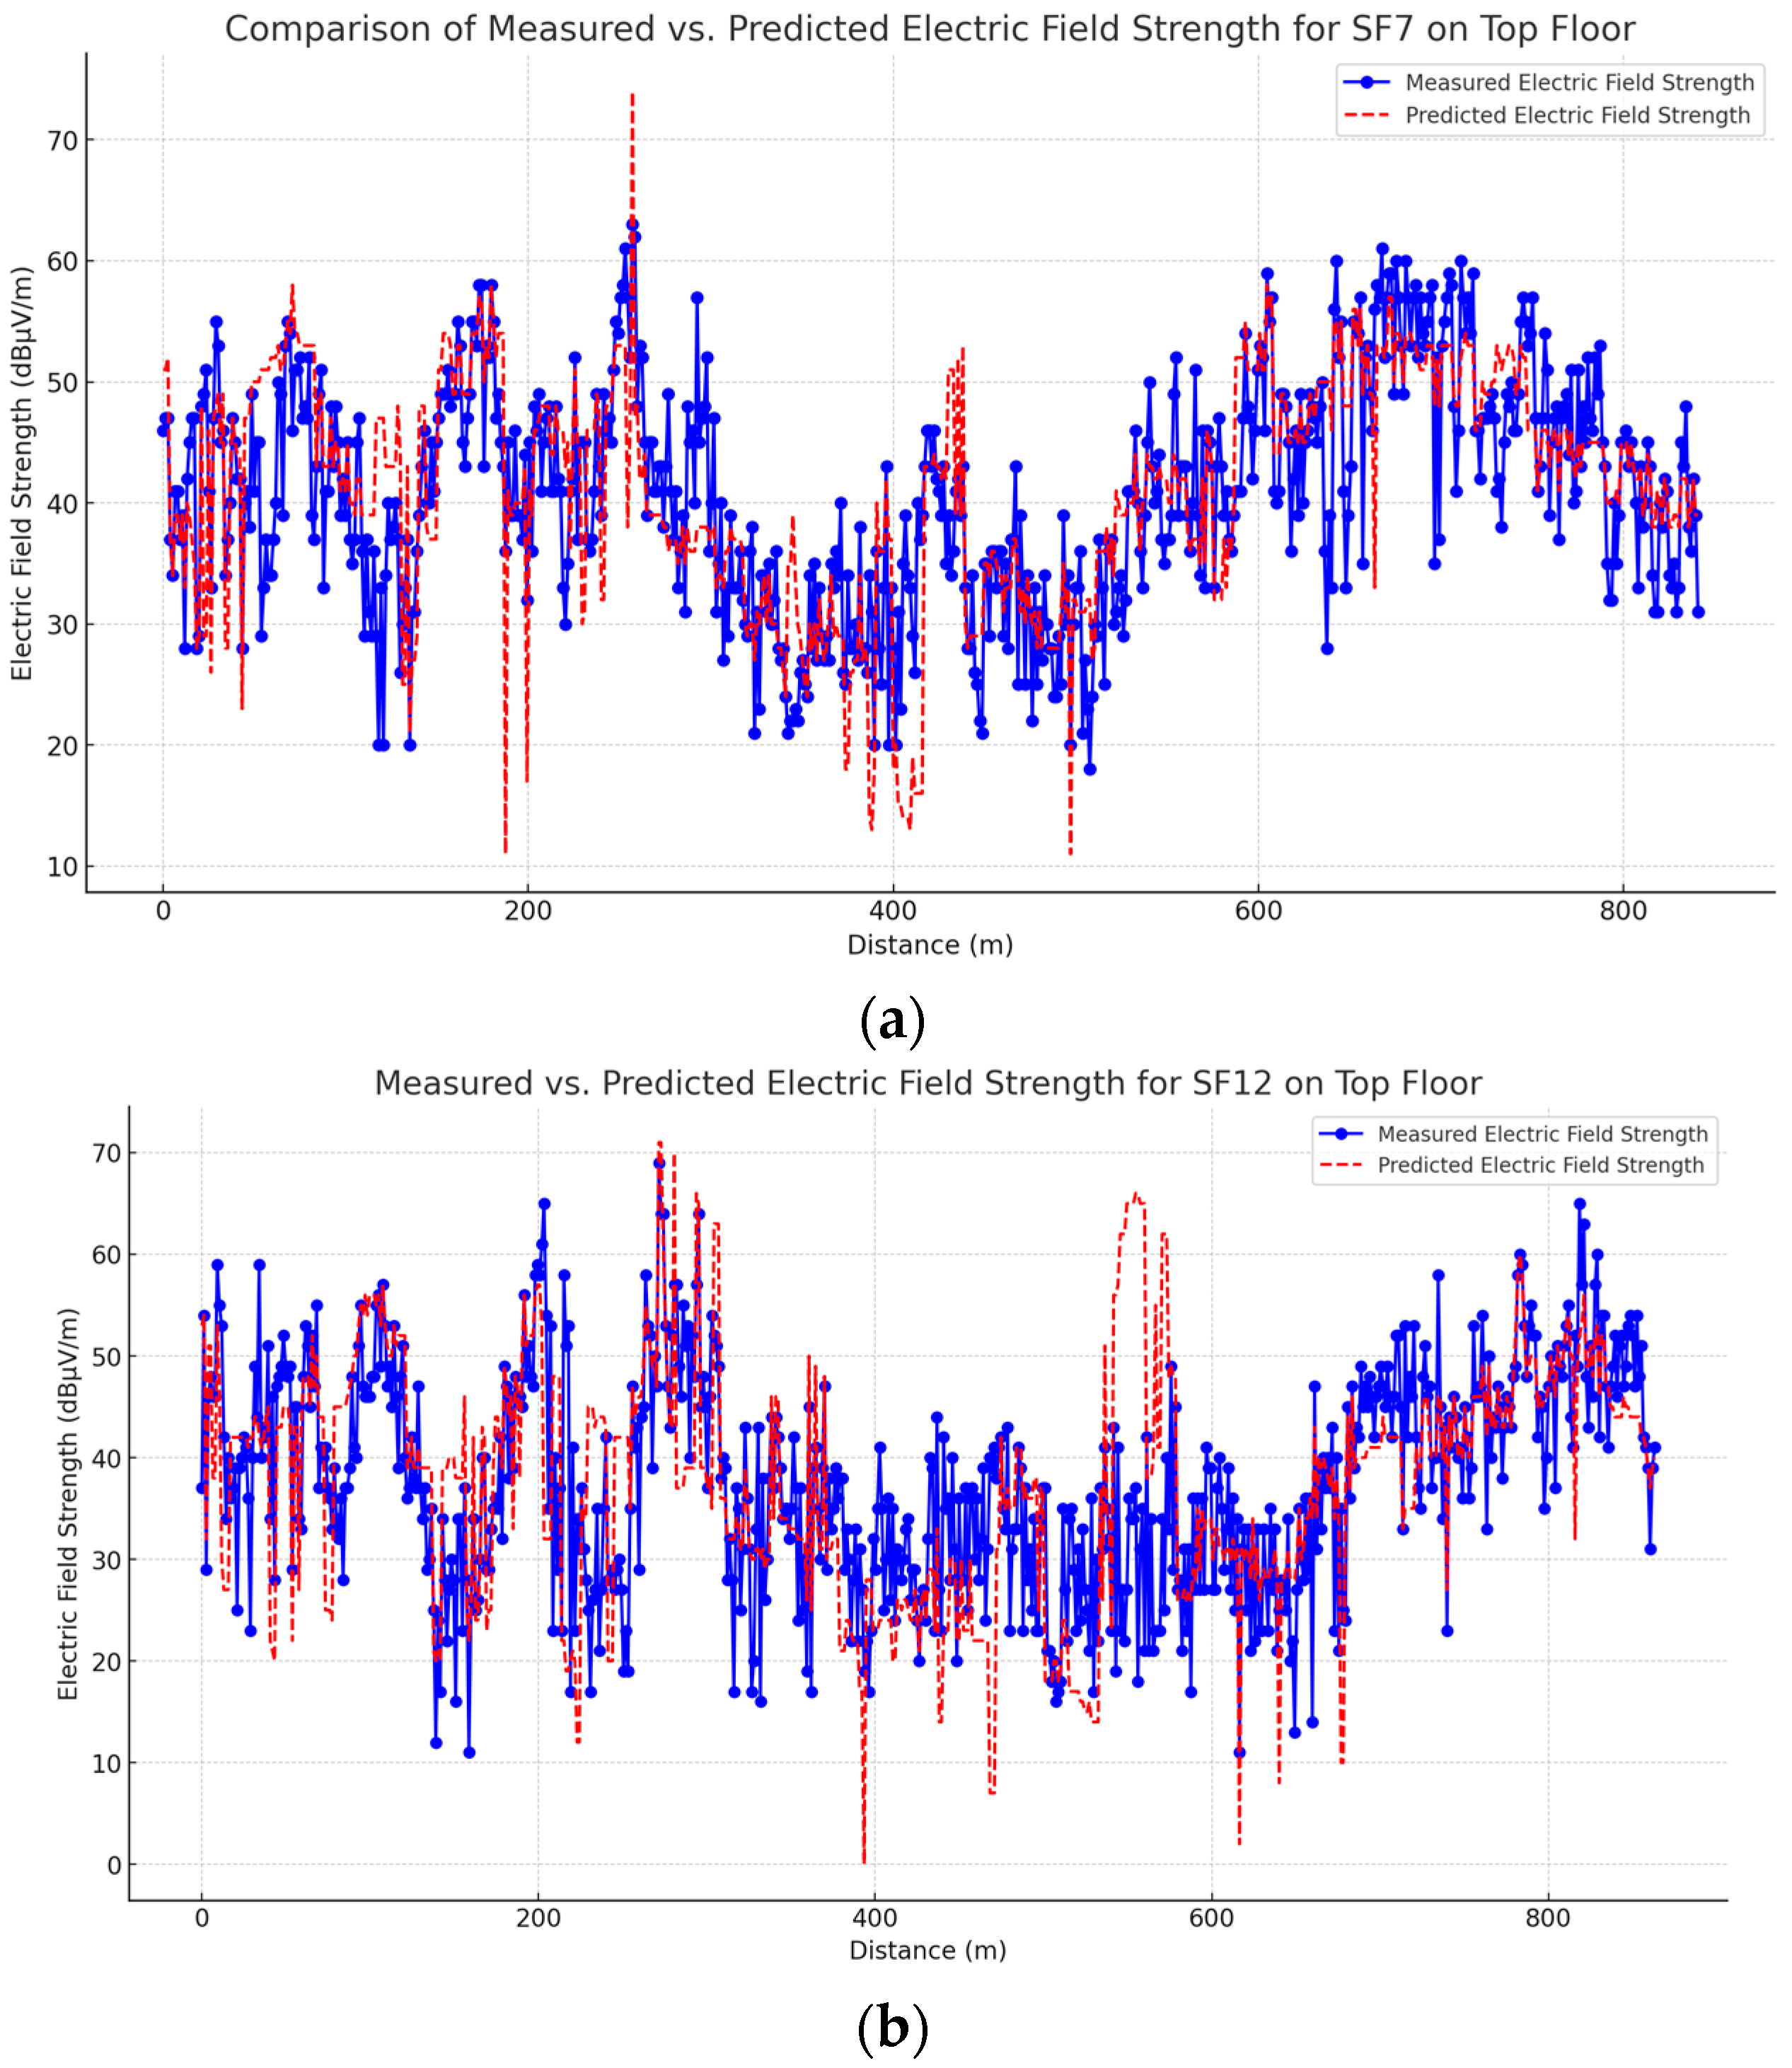
6.3. HTZ Simulation Validation

The analysis of the measured versus predicted electric field strength on the ground floor for both SF7 and SF12 (as shown in Figure 20) offers key insights into their signal behavior under identical conditions. SF7 exhibits a standard deviation of 5.76 dB, indicating a relatively stable signal with moderate deviation from the predicted trend. In contrast, SF12 shows a higher standard deviation of 8.39 dB, reflecting more noticeable fluctuations. This increased variability may be attributed to SF12’s longer airtime, which can make it more exposed to transient environmental effects, such as multipath propagation or brief interference. The plots visually support this, with SF12 exhibiting sharper peaks and larger signal swings compared to the more consistent SF7.
Despite this variability, SF12 achieved a lower average error of 0.33 dB compared to 0.51 dB for SF7, suggesting that the predictive model aligns very well with the measured values in both cases. This indicates that while SF12 may experience more dynamic signal conditions, the prediction algorithm accurately captures these behaviors. Correlation factors further support this conclusion: SF7 yielded a correlation of 0.77, while SF12 achieved a slightly higher value of 0.82, indicating stronger predictive alignment even under more variable conditions. Overall, the results highlight that SF7 offers greater stability and may be preferable in consistent environments. SF12, while more variable, benefits from highly accurate and robust predictions, making it suitable for scenarios where an extended range or coverage is required. The low average errors and strong correlation factors for both spreading factors confirm the effectiveness of the modeling approach. Understanding these dynamics is essential for selecting the appropriate spreading factor based on the specific deployment environment and performance goals in LoRaWAN networks.
The analysis of the measured versus predicted signal strengths for SF7 and SF12 on the third floor (as illustrated in Figure 21) demonstrates key performance metrics: the standard deviation, average error, and correlation factor. On the contrary, SF7 has a standard deviation of 6.48 dB, resulting in moderate variability in signal strength. Higher results can be seen for SF12, with a standard deviation of 8.23 dB, suggesting larger variations in signal strength due to environmental and structural interferences at this level. Such variations are seen in the respective plots of SF12, having greater divergence as compared to the more stable trend observed in SF7. In terms of the average error, SF7 obtained a value of 0.12 dB, indicating that the measured and predicted signal strengths are quite nicely aligned. The average error does not rise very high for the model in SF12, reaching 1.83 dB, despite the higher variability. This does represent the general trend of the signals. Thus, this indicates that the prediction model is well calibrated, especially with SF12, which is naturally more sensitive to propagation woes.
SF7 achieves a correlation factor that is quite high, standing at 0.90, which indicates that the predicted values and measured values are highly correlated. On the other hand, for SF12, the correlation factor is 0.84, which is lower compared to SF7 but still indicates a strong predictive capability. This shows that the model can provide information on dynamic variations in signals from SF12, even in the more challenging third-floor environment. Overall, the analysis shows that SF7 signals display very consistent and stable characteristics and are most preferred for applications that demand predictable performance. SF12 on the other hand, is more unpredictable but has higher prediction accuracy, as the model has been adequately trained to handle its dynamic nature. Moreover, both spreading factors show good correlation coefficients and low average errors, which magnifies the credibility of predictive models.
The analysis of the measured versus predicted signal strengths using SF7 and SF12 on the top of building (as shown in Figure 22) provides the most valuable information for the evaluation of the performance of each spreading factor in terms of the standard deviation, average error, and correlation factor. The standard deviation for SF7 is 6.90 dB, reflecting the fact that this spreading factor shows moderate variation in signal strength on the top floor. In contrast, SF12 is quite a bit higher in its standard deviation, which is 11.01 dB, indicating significant variation in signal strength. These differences show that SF12 is much more responsive to the changing environment and is dependent on the line of sight and other physical conditions, as can be seen in their corresponding plots, where SF12 clearly has bigger variations than SF7.
Regarding the average error, SF7 presents an error of 0.45 dB. This is a very good indication between the measured and predicted values and shows the accuracy of the model. SF12, however, has a slightly higher average error of 0.77 dB, indicating that even though the predictive model for SF12 is quite accurate, the higher signal variability of SF12 teases out its alignment with the measured data. Still, the model fits well with the overall behavior of SF12, which can be seen from the trends of the plots.
The correlation factor again supports the results of the predictions, as in the case of SF7, which lands at 0.73, denoting a high agreement of the measured with the predicted values, whereas SF12 also amounts to a total of 0.58 in the correlation factor. It is lower than SF7, though it still provides a good reach of the predicted values considering the higher signal variability of SF12.
The heatmap in Figure 23 serves as a sample of the HTZ simulations, showing how the LoRaWAN gateway, located on the roof of the building, propagates signals using a spreading factor of 12. The simulation, performed at a frequency of 868.1 MHz, displays signal strengths that range from −135 dBm to −47 dBm across a complex urban environment. The strongest signals are found close to the gateway, with the strength diminishing as the distance increases. The characteristics of SF12, known for its extensive coverage and ability to penetrate urban obstacles, are highlighted by the broad areas of moderate signal strengths (indicated by green to blue regions). This visualization is crucial for understanding the theoretical effects of gateway placement and signal optimization in densely populated areas, showcasing how SF12 enhances coverage by mitigating environmental losses.
Table 11 presents the standard deviation, average error, and correlation factor for both SF7 and SF12 across different locations of the GWs. These metrics offer valuable insights into signal stability, transmission accuracy, and the consistency of the received signal.

7. Conclusions

This study focused on evaluating real-life problems regarding the use of LoRaWAN technology with GWs placed in a multi-story building by analyzing the impact that the spreading factors SF7 and SF12 have on the signal, packet loss, and network reliability. Extensive measurements using Adeunis FTDs and Dragino LG308-EC25 gateways were captured on different floors of the building. As an initial step in the analysis, packet loss was evaluated thoroughly. The packet loss analysis confirmed that a higher gateway elevation on the top floor provides significant advantages for reduced packet loss with both SFs. In contrast, the fifth floor consistently exhibited the poorest performance, negatively impacting scenarios in which it was included, regardless of the number of gateways deployed.
To enhance the understanding of signal propagation patterns at varying gateway locations and SF factors, the SNR and RSSI data was clustered using K-means techniques. Clustering revealed that signal strength and noise resilience degrade more predictably at lower and obstructed levels, especially under SF7, emphasizing the need for informed, data-driven placement. Meanwhile, SF12 showed more robust coverage, with signal values classified in higher-quality clusters across most gateway locations.
To enable intelligent deployment that is scalable and adaptive, we introduced GateOpt PSODE, a PSO and DE hybrid optimization algorithm. This algorithm optimizes gateway selection by calculating varying weights for RSSI, SNR, and packet loss. Network performance did not overly benefit from increased gateways, contrary to traditional beliefs. Increased infrastructure with poor nodes, particularly the fifth floor, reduced the optimization score. GateOpt PSODE effectively attained high-performing combinations, (Top + 1st + 3rd) and (Ground + Top), which were yielded even with fewer gateways.
Integration of real-time data, such as RSSI, SNR, and packet loss, into a single measure of performance allowed for optimizing tiered gateway placement geologically, thus eliminating unnecessary gateways while effectively bolstering dependable coverage for cities. GateOpt PSODE demonstrated robust performance against weak nodes, variable deployment density, and consistent performance in SF7 and SF12.
Furthermore, HTZ Communications simulations using ITU-R 1812-6 and Cost-Hata 231 models were conducted, verifying the results obtained from field measurements. The simulation results align with the field data, strongly validating the interesting results obtained from SF12, where the simulated results were closely aligned with the experimental results from complex urban deployments.
In conclusion, the integration of clustering with actual measurements and hybrid optimization within the scope of this work provides city planners and designers of IoT systems with a validated approach for optimizing gateway placement in LoRaWAN systems within urban multi-story buildings. This approach is reliable, scalable, and cost-efficient for improving network performance in densely populated regions.

Author Contributions

Conceptualization, K.A.A.-S.; methodology, K.A.A.-S.; software, K.A.A.-S.; validation, S.H.A.-G., I.M., C.M. and A.M.; formal analysis, K.A.A.-S., N.A.M.A. and N.A.H.A.-S.; investigation, K.A.A.-S. and S.H.A.-G.; resources, K.A.A.-S., A.-M.C.D. and C.M.; data curation, K.A.A.-S. and S.H.A.-G.; writing—original draft preparation, K.A.A.-S.; writing—review and editing, K.A.A.-S., I.M., A.-M.C.D., A.M. and C.M.; visualization, S.H.A.-G., C.M., A.M. and N.A.M.A.; supervision, I.M.; project administration, A.-M.C.D.; funding acquisition, A.M. All authors have read and agreed to the published version of the manuscript.

Funding

This research received no external funding.

Institutional Review Board Statement

Not applicable.

Informed Consent Statement

Not applicable.

Data Availability Statement

The original contributions presented in this study are included in the article, and further inquiries can be directed at the corresponding author.

Acknowledgments

The research leading to this article was supported by the Vodafone Innovation Hub at the National University of Science and Technology Politehnica Bucharest; by GNAC2023 ARUT, STARTING GRANT-SG SalvAIoT, contract no. 21/09.10.2023, funded by the National University of Science and Technology Politehnica Bucharest; and by the SOLID-B5G project, funded by European Economic Area (EEA) Norway (NO) Grants 2014–2021, under project contract no. 42/2021, RO-NO-2019-0499—“A Massive MIMO Enabled IoT Platform with Networking Slicing for Beyond 5G IoV/V2X and Maritime Services (SOLID-B5G)”.

Conflicts of Interest

The authors declare that this research was conducted in the absence of any commercial or financial relationships that could be construed as a potential conflict of interest.

Abbreviations

ADRAdaptive data rate
CSSChirp Spread Spectrum
DEDifferential Evolution
EIRPEquivalent Isotropically Radiated Power
FTDField Test Device
GBESTGlobal Best Position (in PSO)
GPSGlobal Positioning System
GateOpt PSODEGateway Optimization Particle Swarm Optimization + Differential Evolution (hybrid algorithm)
HTZHTZ Communications (simulation software)
IoTInternet of Things
ISMIndustrial, Scientific, and Medical (band)
LPWANLow-Power Wide-Area Network
MACMedium Access Control
OTAAOver-The-Air Activation
PHYPhysical layer
PSOParticle Swarm Optimization
PDRPacket Delivery Ratio (implied in context)
RFRadio Frequency
RSSIReceived Signal Strength Indicator
SFSpreading factor
SNRSignal-to-Noise Ratio
TTNThe Things Network
UAVUnmanned Aerial Vehicle
WSNWireless Sensor Network

References

  1. Apriantoro, R.; Suharjono, A.; Kurnianingsih, K.; Enriko, I.K.A. Investigation of Coverage and Signal Quality of LoRaWAN Network in Urban Area. In Proceedings of the 2020 International Conference on Computer Engineering, Network, and Intelligent Multimedia (CENIM), Surabaya, Indonesia, 17 November 2020; IEEE: Piscataway, NJ, USA, 2020; pp. 326–331. [Google Scholar]
  2. Majid, M.; Habib, S.; Javed, A.R.; Rizwan, M.; Srivastava, G.; Gadekallu, T.R.; Lin, J.C.-W. Applications of Wireless Sensor Networks and Internet of Things Frameworks in the Industry Revolution 4.0: A Systematic Literature Review. Sensors 2022, 22, 2087. [Google Scholar] [CrossRef] [PubMed]
  3. Narasimha Swamy, S.; Kota, S.R. An Empirical Study on System Level Aspects of Internet of Things (IoT). IEEE Access 2020, 8, 188082–188134. [Google Scholar] [CrossRef]
  4. Maini, J.; Rani, S. Introduction to IoT and WSN. In WSN and IoT; CRC Press: Boca Raton, FL, USA, 2024; pp. 1–34. ISBN 9781003437079. [Google Scholar]
  5. Al-Sammak, K.A.; Al-Gburi, S.H.; Marghescu, C.; Drăgulinescu, A.M.; Suciu, G.; Abdulqader, A.G. A Comprehensive Assessment of LoRaWAN and NB-IoT Performance Metrics under Varied Payload Data Sizes. In Proceedings of the 2024 16th International Conference on Electronics, Computers and Artificial Intelligence (ECAI), Iasi, Romania, 27 June 2024; IEEE: Piscataway, NJ, USA, 2024; pp. 1–5. [Google Scholar]
  6. Ogbodo, E.U.; Abu-Mahfouz, A.; Kurien, A. A Survey on 5G and LPWAN-IoT for Improved Smart Cities and Remote Area Applications: From the Aspect of Architecture and Security. Sensors 2022, 22, 6313. [Google Scholar] [CrossRef] [PubMed]
  7. Janssen, T.; Koppert, A.; Berkvens, R.; Weyn, M. A Survey on IoT Positioning Leveraging LPWAN, GNSS, and LEO-PNT. IEEE Internet Things J. 2023, 10, 11135–11159. [Google Scholar] [CrossRef]
  8. Ouaissa, M.; Ouaissa, M.; Khan, I.U.; Boulouard, Z.; Rashid, J. Low-Power Wide Area Network for Large Scale Internet of Things: Architectures, Communication Protocols and Recent Trends; Ouaissa, M., Khan, I.U., Boulouard, Z., Rashid, J., Eds.; Taylor & Francis: London, UK, 2024; ISBN 9781040005774. [Google Scholar]
  9. Al-Sammak, K.; Al-Gburi, S.; Marghescu, I.; Drãgulinescu, A.M.C.; Marghescu, C.; Martian, A.; Al-Sammak, N.A.H.; Suciu, G.; Alheeti, K. Optimizing IoT Energy Efficiency: Real-Time Adaptive Algorithms for Smart Meters with LoRaWAN and NB-IoT. Energies 2025, 18, 987. [Google Scholar] [CrossRef]
  10. Kwasme, H.; Ekin, S. RSSI-Based Localization Using LoRaWAN Technology. IEEE Access 2019, 7, 99856–99866. [Google Scholar] [CrossRef]
  11. Jeftenic, N.; Simic, M.; Stamenkovic, Z. Impact of Environmental Parameters on SNR and RSS in LoRaWAN. In Proceedings of the 2020 International Conference on Electrical, Communication, and Computer Engineering (ICECCE), Istanbul, Turkey, 12–13 June 2020; IEEE: Piscataway, NJ, USA, 2020. [Google Scholar]
  12. Al-Sammak, K.; AL-Gburi, S.; Marghescu, I. Communications Systems in Smart Metering: A Concise Systematic Literature Review. In Proceedings of the 2022 14th International Conference on Communications (COMM), Bucharest, Romania, 16 June 2022; IEEE: Piscataway, NJ, USA, 2022; pp. 1–9. [Google Scholar]
  13. Yatagan, T.; Oktug, S. Smart Spreading Factor Assignment for LoRaWANs. In Proceedings of the 2019 IEEE Symposium on Computers and Communications (ISCC), Barcelona, Spain, 29 June–3 July 2019; IEEE: Piscataway, NJ, USA, 2019. [Google Scholar]
  14. Turcinovic, F.; Vukovic, J.; Bozo, S.; Sisul, G. Analysis of LoRa Parameters in Real-World Communication. In Proceedings of the 2020 International Symposium ELMAR, Zadar, Croatia, 14–15 September 2020; IEEE: Piscataway, NJ, USA, 2020. [Google Scholar]
  15. Kamal, A.; Muhammad, M.; Mansoor Alam, A.A.B.; Mohd Su’ud, M. Requirements, Deployments, Challenges LoRa Technology: Survey. Comput. Intell. Neurosci. 2023, 2023, 5183062. [Google Scholar] [CrossRef]
  16. Savithi, C.; Kaewta, C. Multi-Objective Optimization Gateway Location Selection Long-Range Wide Area Networks: Tradeoff Analysis between System Costs Bitrate Maximization. J. Sens. Actuator Netw. 2024, 13, 3. [Google Scholar] [CrossRef]
  17. Citoni, B.; Ansari, S.; Abbasi, Q.H.; Imran, M.A.; Hussain, S. Impact of Inter-Gateway Distance on LoRaWAN Performance. Electronics 2021, 10, 2197. [Google Scholar] [CrossRef]
  18. Saban, M.; Aghzout, O.; Medus, L.D.; Rosado, A. Experimental Analysis of IoT Networks Based on LoRa/LoRaWAN under Indoor and Outdoor Environments: Performance and Limitations. IFAC-Pap. 2021, 54, 159–164. [Google Scholar] [CrossRef]
  19. Mikhaylov, K.; Stusek, M.; Masek, P.; Fujdiak, R.; Mozny, R.; Andreev, S.; Hosek, J. On the Performance of Multi-Gateway LoRaWAN Deployments: An Experimental Study. In Proceedings of the 2020 IEEE Wireless Communications and Networking Conference (WCNC), Seoul, Republic of Korea, 25–28 May 2020; IEEE: Piscataway, NJ, USA, 2020. [Google Scholar]
  20. Svertoka, E.; Rusu-Casandra, A.; Burget, R.; Marghescu, I.; Hosek, J.; Ometov, A. LoRaWAN: Lost for Localization? IEEE Sens. J. 2022, 22, 23307–23319. [Google Scholar] [CrossRef]
  21. Dawaliby, S.; Bradai, A.; Pousset, Y. Joint Slice-Based Spreading Factor and Transmission Power Optimization in LoRa Smart City Networks. Internet Things 2021, 14, 100121. [Google Scholar] [CrossRef]
  22. Svertoka, E.; Rusu-Casandra, A.; Burget, R.; Nurmi, J.; Ometov, A. K-NN Empowered LoRaWAN Localization for Surface and Underground Scenarios: Work-in-Progress Report. 2024. Available online: https://researchportal.tuni.fi/en/publications/k-nn-empowered-lorawan-localization-for-surface-and-underground-s (accessed on 21 May 2025).
  23. Cruz, H.A.O.; Ferreira, S.C.B.; Araújo, J.P.L.; Barros, F.J.B.; Farias, F.S.; Neto, M.C.A.; Tostes, M.E.L.; Nascimento, A.A.; Cavalcante, G.P.S. Methodology for LoRa Gateway Placement Based on Bio-Inspired Algorithmsfor a Smart Campus in Wooded Area. Sensors 2022, 22, 6492. [Google Scholar] [CrossRef] [PubMed]
  24. Abubakar, A.K.; Shore, T.; Sastry, N. Constrained Machine Learning for LoRa Gateway Location Optimisation. In Proceedings of the 17th Asian Internet Engineering Conference, Hiroshima, Japan, 19 December 2022; ACM: New York, NY, USA, 2022. [Google Scholar]
  25. Ousat, B.; Ghaderi, M. LoRa Network Planning: Gateway Placement and Device Configuration. In Proceedings of the 2019 IEEE International Congress on Internet of Things (ICIOT), Milan, Italy, 8–13 July 2019; IEEE: Piscataway, NJ, USA, 2019. [Google Scholar]
  26. Mendes, B.; Correia, N.; Passos, D. On the Optimization of LoRaWAN Gateway Placement in Wide Area Monitoring Systems. In Internet of Things. IoT Through a Multi-Disciplinary Perspective; IFIP Advances in Information and Communication Technology; Springer International Publishing: Cham, Switzerland, 2022; pp. 41–51. ISBN 9783031188718. [Google Scholar]
  27. Rezazadeh, A.; Soorki, M.N.; Kavian, Y.S.; Ranjbaran, S.; Nitti, M. Gateway Planning for the Long-Range Wireless Networks in Smart Cities. In Proceedings of the 2024 IEEE 35th International Symposium on Personal, Indoor and Mobile Radio Communications (PIMRC), Valencia, Spain, 2 September 2024; IEEE: Piscataway, NJ, USA, 2024; pp. 1–7. [Google Scholar]
  28. Nyirenda, C.N. On the Efficacy of Particle Swarm Optimization for Gateway Placement in LoRaWAN Networks. In Optimisation Algorithms and Swarm Intelligence; IntechOpen: London, UK, 2022; ISBN 9781839686658. [Google Scholar]
  29. Saheb, T.; Mellal, M.A. Improvement of System Reliability in a Natural Gas Processing Facility by PSO and DE. Int. J. Interact. Des. Manuf. (IJIDeM) 2024, 18, 167–176. [Google Scholar] [CrossRef]
  30. Hosseinzadeh, S.; Göktürkler, G.; Turan-Karaoğlan, S. Inversion of Self-Potential Data by a Hybrid DE/PSO Algorithm. Acta Geod. Geophys. 2023, 58, 241–272. [Google Scholar] [CrossRef]
  31. Wang, C.; Xu, M.; Zhang, Q.; Feng, J.; Jiang, R.; Wei, Y.; Liu, Y. Parameters Identification of Thevenin Model for Lithium-Ion Batteries Using Self-Adaptive Particle Swarm Optimization Differential Evolution Algorithm to Estimate State of Charge. J. Energy Storage 2021, 44, 103244. [Google Scholar] [CrossRef]
  32. Mohammadi, B.; Guan, Y.; Moazenzadeh, R.; Safari, M.J.S. Implementation of Hybrid Particle Swarm Optimization-Differential Evolution Algorithms Coupled with Multi-Layer Perceptron for Suspended Sediment Load Estimation. Catena 2021, 198, 105024. [Google Scholar] [CrossRef]
  33. Iweh, C.D.; Akupan, E.R. Control and Optimization of a Hybrid Solar PV—Hydro Power System for off-Grid Applications Using Particle Swarm Optimization (PSO) and Differential Evolution (DE). Energy Rep. 2023, 10, 4253–4270. [Google Scholar] [CrossRef]
  34. Huang, C.; Zhou, X.; Ran, X.; Wang, J.; Chen, H.; Deng, W. Adaptive Cylinder Vector Particle Swarm Optimization with Differential Evolution for UAV Path Planning. Eng. Appl. Artif. Intell. 2023, 121, 105942. [Google Scholar] [CrossRef]
  35. Boks, R.; Wang, H.; Bäck, T. A Modular Hybridization of Particle Swarm Optimization and Differential Evolution. arXiv 2020, arXiv:2006.11886. [Google Scholar]
  36. Almuhaya, M.A.M.; Jabbar, W.A.; Sulaiman, N.; Abdulmalek, S. A Survey on LoRaWAN Technology: Recent Trends, Opportunities, Simulation Tools and Future Directions. Electronics 2022, 11, 164. [Google Scholar] [CrossRef]
  37. Osorio, A.; Calle, M.; Soto, J.D.; Candelo-Becerra, J.E. Routing in LoRaWAN: Overview and Challenges. IEEE Commun. Mag. 2020, 58, 72–76. [Google Scholar] [CrossRef]
  38. TS001-1.0.4 LoRaWAN® L2 1.0.4 Specification. Available online: https://resources.lora-alliance.org/technical-specifications/ts001-1-0-4-lorawan-l2-1-0-4-specification (accessed on 29 December 2024).
  39. Obiri, N.M.; Van Laerhoven, K. A Survey of LoRaWAN-Integrated Wearable Sensor Networks for Human Activity Recognition: Applications, Challenges and Possible Solutions. IEEE Open J. Commun. Soc. 2024, 5, 6713–6735. [Google Scholar] [CrossRef]
  40. Elbsir, H.E.; Kassab, M.; Bhiri, S.; Bedoui, M.H. Evaluation of LoRaWAN Class B Performances and Its Optimization for Better Support of Actuators. Comput. Commun. 2023, 198, 128–139. [Google Scholar] [CrossRef]
  41. Leonardi, L.; Lo Bello, L.L.; Patti, G.; Pirri, A.; Pirri, M. Combined Use of LoRaWAN Medium Access Control Protocols for IoT Applications. Appl. Sci. 2023, 13, 2341. [Google Scholar] [CrossRef]
  42. Fontana, C. FTD: Network Tester. Available online: https://www.adeunis.com/en/produit/ftd-network-tester/ (accessed on 19 March 2025).
  43. Dragino Download Server./Downloads/LoRa_gateway/LG308-LG301/. Available online: https://www.dragino.com/downloads/index.php?dir=LoRa_Gateway/LG308-LG301/ (accessed on 19 March 2025).
  44. Alkhayyal, M.; Mostafa, A.M. Recent Developments in AI and ML for IoT: A Systematic Literature Review on LoRaWAN Energy Efficiency and Performance Optimization. Sensors 2024, 24, 4482. [Google Scholar] [CrossRef]
  45. Gad, A.G. Particle Swarm Optimization Algorithm and Its Applications: A Systematic Review. Arch. Comput. Methods Eng. 2022, 29, 2531–2561. [Google Scholar] [CrossRef]
  46. Storn, R.; Price, K. Differential Evolution—A Simple and Efficient Heuristic for Global Optimization over Continuous Spaces. J. Glob. Optim. 1997, 11, 341–359. [Google Scholar] [CrossRef]
  47. Ahmad, M.F.; Isa, N.A.M.; Lim, W.H.; Ang, K.M. Differential Evolution: A Recent Review Based on State-of-the-Art Works. Alex. Eng. J. 2022, 61, 3831–3872. [Google Scholar] [CrossRef]
  48. Bilal; Pant, M.; Zaheer, H.; Garcia-Hernandez, L.; Abraham, A. Differential Evolution: A Review of More than Two Decades of Research. Eng. Appl. Artif. Intell. 2020, 90, 103479. [Google Scholar] [CrossRef]
  49. Wang, D.; Tan, D.; Liu, L. Particle Swarm Optimization Algorithm: An Overview. Soft Comput. 2018, 22, 387–408. [Google Scholar] [CrossRef]
  50. Price, K.; Storn, R.M.; Lampinen, J.A. Differential Evolution: A Practical Approach to Global Optimization; Natural Computing; Springer: Berlin/Heidelberg, Germany, 2005; ISBN 9783540313069. [Google Scholar]
  51. HTZ Communications. Available online: https://atdi.com/products-and-solutions/htz-communications/ (accessed on 19 March 2025).
Figure 1. Methodology workflow.
Technologies 13 00256 g001
Figure 2. LoRaWAN experiment area.
Technologies 13 00256 g002
Figure 3. The LoRaWAN protocol.
Technologies 13 00256 g003
Figure 4. (a) Adeunis FTD (end devices) and (b) Dragino LG308-EC25 (gateway).
Technologies 13 00256 g004
Figure 5. A typical LoRaWAN network architecture.
Technologies 13 00256 g005
Figure 6. The decoding process of payload data.
Technologies 13 00256 g006
Figure 7. Structured dataset collected from The Things Network (TTN).
Technologies 13 00256 g007
Figure 8. Data preprocessing.
Technologies 13 00256 g008
Figure 9. A basic outline of the PSO algorithm.
Technologies 13 00256 g009
Figure 10. DE mathematical workflow diagram.
Technologies 13 00256 g010
Figure 11. Experiment measurement points.
Technologies 13 00256 g011
Figure 12. Number and percentage of lost packets by floor for SF7 and SF12.
Technologies 13 00256 g012
Figure 13. (a) RSSI vs. distance of top-of-building gateway, SF 7; (b). RSSI vs. distance of top-of-building gateway, SF 12.
Technologies 13 00256 g013
Figure 14. (a). RSSI ranges for SF7 across different locations of the GWs; (b) RSSI ranges for SF 12 across different locations of the GWs.
Technologies 13 00256 g014
Figure 15. (a) SNR vs. distance of top of building, SF7; (b) SNR vs. distance of top of building, SF12.
Technologies 13 00256 g015
Figure 16. (a) SNR ranges for SF 7 across different locations of the GWs.; (b) SNR ranges for SF 12 across different locations of the GWs.
Technologies 13 00256 g016
Figure 17. Optimized scores across different locations of the GWs for SF7 and SF12.
Technologies 13 00256 g017
Figure 18. Lost packets for SF7 and SF12 across multiple gateway scenarios.
Technologies 13 00256 g018
Figure 19. Comparison of optimized scores for SF12 and SF7 across gateway placement scenarios.
Technologies 13 00256 g019
Figure 20. Comparison of measured vs. predicted field strength on ground floor: (a) SF 7; (b) SF 12.
Technologies 13 00256 g020
Figure 21. Comparison of measured vs. predicted on third floor: (a) SF 7; (b) SF 12.
Technologies 13 00256 g021
Figure 22. Comparison of measured vs. predicted signal strength on the top level of building: (a) SF 7; (b) SF 12.
Technologies 13 00256 g022
Figure 23. HTZ LoRaWAN signal propagation simulation of SF12, top of building.
Technologies 13 00256 g023
Table 1. Comparison of our GateOpt PSODE algorithm with other works.
AspectPresent WorksComparison of GateOpt PSODEAspect
Application diversityReliability optimization [29], parameter estimation [30], SOC estimation [31], and SSL modeling [32].While other algorithms target diverse domains (engineering, hydrology, and battery modeling), GateOpt PSODE focuses on optimizing LoRaWAN gateway placement for communication network performance, addressing a unique and underexplored domain.Application diversity
Multi-objective handlingAI-based PSO and DE [33] balance LCOE and LPSP for renewable energy systems and ACVDEPSO [34] for UAVs.GateOpt PSODE similarly balances RSSI, SNR, and packet loss but applies this balance to communication network metrics, ensuring robust performance in LPWAN environments, a specialized multi-objective approach.Multi-objective handling
ScalabilityModular hybridization [35] demonstrates scalability with 800 hybrid variants.GateOpt PSODE leverages scalability by applying k-means clustering for preprocessing, enabling it to efficiently manage clusters of RSSI and SNR data across multiple gateways in large network setups.Scalability
Algorithm designAlgorithms like SaPSODE [31] and MLP-PSODE [32] integrate advanced features like self-adaptive mutation.GateOpt PSODE integrates advanced hybrid features, combining PSO and DE with a clustering approach, providing a unique mix of exploration and exploitation tailored to network deployment problems.Algorithm design
Performance metricsImproved performance shown for SSL accuracy [32], reduced LCOE [33], and reliable redundancy [29].GateOpt PSODE achieves significant performance improvement in network metrics such as RSSI, SNR, and packet loss, ensuring optimized gateway placement and superior coverage compared to traditional placement strategies.Performance metrics
Field-specific benefitsUAV navigation in 3D [34], renewable energy optimization [33], and hydrological modeling [32].GateOpt PSODE introduces field-specific advantages by addressing real-world LPWAN challenges, like interference, multi-gateway placement, and maintaining connectivity in dynamic building environments, offering a unique solution tailored to LoRaWAN.Field-specific benefits
Application diversityReliability optimization [29], parameter estimation [30], SOC estimation [31], and SSL modeling [32].While other algorithms target diverse domains (engineering, hydrology, and battery modeling), GateOpt PSODE focuses on optimizing LoRaWAN gateway placement for communication network performance, addressing a unique and underexplored domain.Application diversity
Table 2. Specifications of Adeunis FTDs.
SpecificationDetails
Spreading factorsSF7 and SF12
Frequency bandEuropean ISM band (863–870 MHz)
LoRaWAN-supported regionsEU863-870 (experiment conducted in Romania)
Wireless securityAES-128 data encryption (LoRaWAN only)
LoRaWAN classClass A
LoRaWAN featuresOTAA (Over-The-Air Activation)
Adaptive data rate (ADR)Disabled
RF transmission power14 dBm (25 mW)
Sensitivity−140 dBm LoRaWAN EU868 @SF12
Supported protocolsLoRaWAN
GPS supportLatitude/longitude coordinates in degrees, minutes, and seconds
Range Up to 15 km in rural areas and 2 to 5 km in urban areas
Table 3. Dragino LG308-EC25 gateway specifications.
SpecificationDetails
LoRaWAN compatibilityMulti-channel support for EU868 (863–870 MHz)
BackhaulEC25 LTE module for cellular connectivity
SensitivityUp to −142.5 dBm with SX1250 Tx/Rx front-end
Signal rejection70 dB CW interferer rejection at 1 MHz offset
Demodulation capability8 × SF5-SF12, 125/250/500 kHz LoRa, and (G)FSK demodulator
Parallel demodulation paths10 programmable parallel paths
Dynamic data rate (DDR)Supports DDR adaptation for efficient transmission
Antenna diversityTrue antenna diversity for reliable reception
Placement in experimentGround floor, 1st floor, 3rd floor, 5th floor, and 9th floor (top of building)
Table 4. Simulation parameters.
ParameterGround Floor3rd FloorTop of Building
Spread Factor (SF)7 and 127 and 127 and 12
Frequency (MHz)868.100868.100868.100
Bandwidth (kHz)125.00125.00125.00
Nominal Power (dBm)141414
E.I.R.P (dBm)191919
Antenna TypeStandard Standard Standard
Antenna Size (m)0.170.170.17
Crossover Distance between Near and Far Fields (m)0.690.690.69
Tx/Rx ant. Gain (dBi)5.005.005.00
Beamwidth (°)360.00360.00360.00
Antenna Height (m)2.0015.0045.00
Propagation ModelITU-R 1812-6ITU-R 1812-6Cost-Hata 231
Table 5. The overall lost packets by building levels for SF7 and SF12.
GW
Location
SF12
Received
SF12
Total
SF12
Lost
SF12
Loss (%)
SF7
Received
SF7
Total
SF7
Lost
SF7
Loss (%)
Ground34872037251.6734074540554.36
1st44272027838.6132874541755.97
3rd6297209112.6449874524733.15
5th21672050470.0012274562383.62
Top660720608.3364374510213.69
Table 6. Detailed RSSI cluster ranges per gateway (SF7 and SF12).
ClusterGateway LevelSF12 (dBm)No. of PointsSF7 (dBm)No. of Points
Cluster 0Ground Floor−87 to −6746−85 to −7919
1st Floor−88 to −6940−77 to −7210
3rd Floor−81 to −6352−80 to −6653
5th Floor−115 to −10715−112 to −10911
Top of Building−79 to −6727−82 to −7365
Cluster 1Ground Floor−98 to −8749−91 to −8637
1st Floor−102 to −8988−88 to −8020
3rd Floor−94 to −8256−91 to −8174
5th Floor−122 to −11634−115 to −11314
Top of Building−86 to −8064−88 to −8295
Cluster 2Ground Floor−108 to −9983−97 to −9261
1st Floor−112 to −10390−95 to −8944
3rd Floor−107 to −95140−101 to −9281
5th Floor−127 to −12335−118 to −11617
Top of Building−93 to −87134−93 to −89128
Cluster 3Ground Floor−116 to −10974−103 to −9888
1st Floor−120 to −11394−103 to −9692
3rd Floor−117 to −108156−110 to −10294
5th Floor−132 to −12837−122 to −11927
Top of Building−100 to −94154−99 to −94144
Cluster 4Ground Floor−122 to −11758−109 to −10469
1st Floor−126 to −12177−112 to −104105
3rd Floor−126 to −118132−117 to −111113
5th Floor−136 to −13340−125 to −12327
Top of Building−108 to −101152−106 to −100128
Cluster 5Ground Floor−130 to −12338−118 to −11066
1st Floor−132 to −12753−121 to −11357
3rd Floor−137 to −12784−127 to −11883
5th Floor−142 to −13755−130 to −12625
Top of Building−125 to −109129−118 to −10783
Table 7. Detailed SNR cluster ranges per gateway (SF7 and SF12).
ClusterGateway LevelSF12 (dB)No. of PointsSF7 (dB)No. of Points
Cluster 0Ground Floor8.5 to 11.2806.5 to 10.550
1st Floor7.8 to 10.8806.8 to 12.275
3rd Floor8.8 to 111417.5 to 11.2125
5th Floor5 to 7.2142.5 to 812
Top of Building8.8 to 11.5619 to 11.5189
Cluster 1Ground Floor5.8 to 8.2522.8 to 6.270
1st Floor5 to 7.5851.8 to 6.567
3rd Floor6.2 to 8.51373.8 to 7.283
5th Floor2.8 to 3.827−2.2 to 1.814
Top of Building6.8 to 8.51317.2 to 8.8146
Cluster 2Ground Floor2.8 to 5.548−1.2 to 2.557
1st Floor2.5 to 4.879−3 to 1.537
3rd Floor3.5 to 6104−0.5 to 3.555
5th Floor0.5 to 2.229−5.5 to −2.512
Top of Building4.2 to 6.51645 to 795
Cluster 3Ground Floor0.2 to 2.553−6.5 to −1.549
1st Floor0.2 to 2.261−7.5 to −3.534
3rd Floor0.5 to 3.280−5.5 to −0.883
5th Floor−1.5 to 0.228−9 to −5.816
Top of Building1.5 to 4962.8 to 4.889
Cluster 4Ground Floor−2.5 to −0.252−11.2 to −6.828
1st Floor−2.5 to −0.261−11.5 to −7.844
3rd Floor−1.8 to 0.272−9.8 to −5.846
5th Floor−3.2 to −1.836−13 to −9.519
Top of Building−1.5 to 1.296−0.5 to 2.558
Cluster 5Ground Floor−5 to −2.840−15.2 to −11.545
1st Floor−4.8 to −2.852−15.2 to −11.835
3rd Floor−4.2 to −261−13.8 to −1048
5th Floor−5.2 to −3.534−16.2 to −13.222
Top of Building−4.2 to −1.875−5.5 to −0.840
Cluster 6Ground Floor−7.2 to −5.223−19 to −15.531
1st Floor−7.2 to −554−19.8 to −15.536
3rd Floor−7.2 to −4.534−19 to −1458
5th Floor−7.2 to −5.548−19.8 to −16.527
Top of Building−7.2 to −4.537−14.5 to −5.826
Table 8. The optimized scores for each floor.
FloorOptimized Score (SF7)Optimized Score (SF12)
Ground0.4656080.521123
1st0.3456380.593492
3rd0.4929560.792785
5th0.2098770.000000
Top0.8553381.000000
Table 9. Packet loss statistics for each scenario under SF7 and SF12.
CombinationSF12
Received
SF12 TotalSF12 LostSF12 Loss (%)SF7
Received
SF7
Total
SF7 LostSF7 Loss (%)
Ground + 1st47572024534.0340274534346.04
Ground + 3rd649720719.8654474520126.98
Ground + 5th38072034047.2235074539553.02
Ground + Top683720375.14678745678.99
1st + 3rd668720527.2254374520227.11
1st + 5th58972013118.1935174539452.89
1st + Top690720304.17681745648.59
3rd + 5th6397208111.2550574524032.21
3rd + Top701720192.64724745212.82
5th + Top673720476.536527459312.48
Ground + 1st + 3rd672720486.6757074517523.49
Ground + 1st + 5th49072023031.9440674533945.5
Ground + 3rd + 5th650720709.7254774519826.58
1st + 3rd + 5th669720517.0854874519726.44
Top + 1st + 3rd710720101.39733745121.61
Top + 1st + 3rd + 5th71272081.11733745121.61
Ground + Top + 1st + 3rd71472060.83733745121.61
Ground + 1st + 3rd + 5th672720486.6757174517423.36
Ground + Top + 1st + 3rd + 5th71472060.83733745121.61
Table 10. Comparison of gateway deployment scenarios and their implications.
Scenario TypeScore (SF12)Score (SF7)Interpretation
Dual GW
Ground + 1st0.5460.5199Basic coverage for lower levels lacks upper-floor visibility.
Ground + 3rd0.79190.5261Good mid-level performance without rooftop support.
Ground + Top0.94840.8677Strong overall solution: the top floor provides reach, and the ground floor supports local coverage.
1st + 3rd0.82350.5246Focused mid-floor coverage; limited range upwards/downwards.
1st + Top0.90360.872Balanced and effective; the top floor enhances range, and the 1st floor supports indoors.
5th + Top0.48730.4381Weakened by poor 5th-floor results; the top floor provides partial compensation.
3rd + Top0.87840.7871Great performance across upper floors; reliable high-floor access.
3rd + 5th0.43080.2249Weak configuration; suffers due to poor 5th-floor reception.
1st + 5th0.34770.0014Not recommended; fails to deliver meaningful coverage.
Triple GW
Ground + 3rd + 5th0.44910.2857Unbalanced; poor 5th-floor performance that degrades despite ground and mid support.
Ground + 1st + 3rd0.83010.5638Strong lower and mid-level coverage; lacks rooftop visibility.
Ground + 1st + 5th0.1830.0813Very poor configuration; low reliability due to 5th-floor weakness and no top coverage.
Top + 1st + 3rd0.89340.8002Excellent balance from top to mid-floor levels; robust and reliable setup.
1st + 3rd + 5th0.48070.2872Moderate mid-floor coverage, but the 5th floor limits performance without top coverage.
Quad GW
Ground + 1st + 3rd + 5th0.48560.3205Offers extensive mid- and low-floor coverage, but the weak 5th floor and no rooftop coverage reduce reliability.
Ground + Top + 1st + 3rd0.90010.8002Strong overall coverage with top-floor redundancy; reliable across all building levels.
Top + 1st + 3rd + 5th0.55220.5556Balanced configuration, but 5th floor reduces effectiveness, despite top-floor support.
Ground + Top + 1st + 3rd + 5th (5-GW)0.55560.5556Full redundancy, but added 5th floor dilutes performance; not optimal despite coverage depth.
Table 11. Simulation output metrics.
FloorSpreading FactorStandard
Deviation
Average
Error
Correlation Factor
Ground FloorSF75.76 dB0.51 dB0.77
SF128.39 dB0.33 dB0.82
3rd FloorSF76.48 dB0.12 dB0.90
SF128.23 dB1.83 dB0.84
Top of BuildingSF76.90 dB0.45 dB0.73
SF1211.01 dB0.77 dB0.58
Disclaimer/Publisher’s Note: The statements, opinions and data contained in all publications are solely those of the individual author(s) and contributor(s) and not of MDPI and/or the editor(s). MDPI and/or the editor(s) disclaim responsibility for any injury to people or property resulting from any ideas, methods, instructions or products referred to in the content.

