Abstract
Spray cooling efficiency plays a critical role in the heat dissipation process from the external surface of industrial low-carbon cement rotary coolers. This study numerically investigated the thermal performance of high-temperature zones by examining four spray parameters: spray angle, nozzle distance, spray height, and mass flow rate. Multi-objective optimization design (MOD) was subsequently performed using response surface methodology (RSM). RSM reveals spray angle as the most significant parameter affecting heat transfer. With temperature uniformity as a constraint, MOD yields the following optimal parameters: 89° spray angle, 380 mm nozzle distance, and 663.5 mm spray height. This configuration achieves an average surface temperature of 814.33 K and a heat flux of 131,588.3 W/m2. The optimized spray parameters ensure high heat flux and uniform surface temperature while enlarging the heat transfer area and strengthening the synergistic heat transfer between dual nozzles. This approach provides a reliable technical pathway for efficient thermal management in industrial rotary cooler exteriors.
1. Introduction
The clinker cooling stage is critical in cement production, directly determining final product quality and energy efficiency through its requirement for rapid, stable heat removal [1]. In cement clinker cooling, the key challenge remains achieving rapid temperature reduction while maintaining operational stability and water efficiency. Spray cooling achieves efficient heat dissipation through the impact of atomized droplets on high-temperature surfaces, utilizing both latent heat of evaporation and enhanced convective heat transfer [2]. Compared to conventional methods, spray cooling is regarded as a superior solution due to its high heat transfer coefficient and absence of cooling hysteresis [3]. It has been successfully applied in diverse fields such as aerospace thermal management [4], cooling of high-power electronic chips [5,6], medical thermal protection [7], metallurgical quenching [8,9], and automotive manufacturing [10,11]. Owing to its high heat transfer performance, spray cooling has gained increasing attention in metallurgical and building materials industries, with growing industrial adoption [12].
Based on atomization methods, spray cooling is categorized into pressure spray and air-assisted spray. In pressure spray systems, the liquid is delivered by high-pressure pumps to the nozzle, where the upstream pressure atomizes the liquid into fine droplets that are projected onto the heated surface for cooling [13]. Pressure nozzles are commonly employed for high-heat-flux surface cooling due to their superior heat removal capability. The cooling performance of pressure spray is influenced by multiple parameters, including spray height, flow rate, and coolant type. Liu et al. [14] demonstrated that increasing the spray pressure significantly reduces the wall temperature under identical heat flux conditions. However, this effect diminishes when the pressure exceeds an optimal range. Zhao et al. [15] revealed that appropriately increasing the nozzle height while reducing the spray pressure improves surface temperature uniformity. Bao et al. [16] reported that smaller nozzle orifices improve droplet size and velocity. However, under high heat flux, stronger vaporization reduces heat-transferring droplets, potentially restricting cooling effectiveness.
Spray cooling offers numerous advantages, although its heat transfer mechanism is recognized as highly complex and is influenced by multiple factors [17]. Generally, increased flow rates are associated with enhanced droplet velocity and droplet number density, consequently improving cooling efficiency [18]. Chien et al. [19] examined how flow rate, nozzle distance, and configuration affect spray performance, revealing that nozzle orifice design and flow variations significantly impact spray uniformity, while proper flow control helps minimize droplet loss and energy dissipation. Chunkyraj et al. [20] demonstrated that increased Reynolds numbers effectively enhance heat transfer rates, while larger droplet formation at lower Reynolds numbers adversely affects heat exchange efficiency. Yang et al. [21] investigated the effects of spray chamber pressure, spray height, and inclination angle on heat transfer performance. They found that the liquid film thickness on the cooling surface exhibits a W-shaped distribution, with thinner films providing better cooling performance and the minimum surface temperature occurring at a film thickness of 5 µm.
For addressing cooling requirements of large surface areas with high heat flux, small spray angles combined with arrayed nozzles are commonly adopted. Zhang et al. [22] investigated the influence of arrayed nozzle arrangements on spray cooling performance during steel pipe quenching. It was found that parallel inclined sprays and staggered inclined sprays provided the best cooling performance and the most uniform cooling surface. Bandaru et al. [23] experimentally studied the effect of different nozzle inclination angles in a 2 × 3 water spray nozzle array on cooling a nuclear reactor vessel. Results indicated that at an inclination angle of 60°, the uniformity of liquid film coverage was significantly improved and the surface temperature was notably reduced. Xie et al. [24] designed a larger-scale 9 × 6 nozzle matrix to achieve uniform cooling over a large surface area. Their study demonstrated that increasing nozzle pressure and flow rate markedly enhanced surface temperature uniformity and improved heat transfer performance.
Previous research has primarily been conducted on small-scale experimental platforms and tends to favor smaller spray angles to achieve higher local cooling intensity. However, for industrial-scale applications involving large surfaces, a balance must be struck between cooling performance and spray coverage area. Although small spray angles can achieve high cooling efficiency in localized regions, their application to large-scale industrial processes with extensive surfaces would require substantial amounts of water. Therefore, a strategy solely focused on high local cooling efficiency is not suitable for the continuous production engineering of large-scale cooling materials. In contrast, spray cooling with a large spray angle can provide greater coverage area, thereby improving water utilization efficiency while maintaining good cooling performance. In particular, research on industrially scaled large-spray-angle nozzle arrays remains limited for applications such as metallurgical production lines and cement clinker cooling. The kiln shell of a low-carbon cement rotary cooler is generally over 20 m, providing the engineering conditions necessary for installing a cooling section.
Low-carbon cement can significantly reduce carbon emissions while maintaining good performance. After calcination, the high iron content in low-carbon cement leads to oxidation reactions when exposed to air at elevated temperatures, adversely affecting cement performance and product coloration [25]. Consequently, oxygen-free cooling has been identified as a critical process in low-carbon cement production, necessitating indirect cooling methods. In the past, industrial-scale high-temperature material cooling has been predominantly achieved through air cooling or immersion methods. Air cooling is characterized by low efficiency in both radiative and convective heat transfer. Immersion cooling submerges the rotary kiln cylinder in water. However, this method primarily relies on convective heat transfer between the outer wall and water, exhibiting lower efficiency compared to evaporative heat transfer. Therefore, a rapid cooling strategy incorporating spray cooling for industrial rotary coolers is proposed and numerically simulated in this study. This approach provides a viable optimized solution and theoretical foundation for efficient, rapid cooling of low-carbon cement. The investigated industrial rotary cooler features an inlet high-temperature zone of 800 °C. By optimizing the spray cooling parameters, a balance is achieved between temperature uniformity and increased effective heat transfer area, while maintaining a high heat flux. Furthermore, ensuring temperature uniformity thereby prevents localized overheating on the high-temperature external surface of the cylinder.
This study focuses on the thermal management requirements of low-carbon cement rotary coolers. Figure 1 illustrates the operating principle of the spray cooling system for a cement rotary cooler. Rotary coolers with the same operating principle have already been applied in industrial practice [26]. Numerical simulations were employed to examine the effects of spray angle, nozzle distance, spray height, and cooling water mass flow rate on the cooling efficiency. The influence of spray parameters on heat transfer performance is demonstrated through cooling surface heat flux and liquid film thickness. Response surface methodology (RSM) was used to evaluate the effects of key spray parameters and reveal their synergistic enhancement effects. Furthermore, multi-objective optimization design (MOD) based on RSM was conducted, yielding an optimal combination of spray parameters.
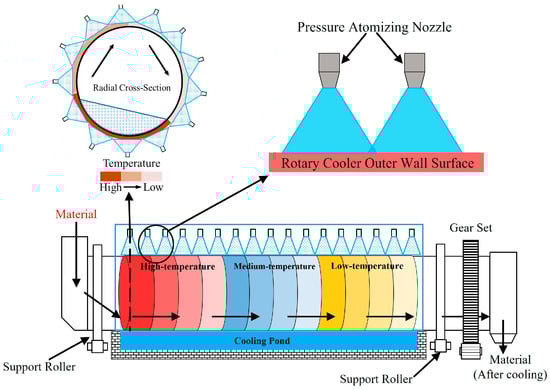
Figure 1.
Schematic Diagram of the Cement Rotary Cooler System.
2. Mathematical Model and Geometric Model
2.1. Mathematical Model
During spray cooling, a large number of fine, low-temperature droplets are generated by the nozzle and impinge on the cooling surface. Heat is rapidly absorbed through the latent heat of droplet evaporation, thereby lowering the surface temperature. Consequently, the mathematical model of spray cooling primarily includes the discrete phase model, continuous phase model, turbulence model, as well as the coupled model between the continuous and discrete phases.
2.1.1. Continuous Phase Model
Spray cooling is conducted under ambient pressure conditions. Within the computational domain, the air, serving as the continuous phase, is assumed to be an incompressible ideal gas. The conservation equations govern the mass, momentum, and energy changes in the air. The component transport equation is employed to model the evaporative heat transfer process of the spray droplets and the resulting liquid film [27].
Mass conservation equation:
Energy conservation equation:
Momentum conservation equation:
Component transport equation:
In the equations, ρ is the density; t is time; is the velocity vector; Sm is the mass source term originating from the evaporation of droplets and the liquid film; T is the temperature; cp is the specific heat capacity of the fluid; keff is the effective thermal conductivity of the fluid; ST is the energy change in the continuous phase caused by droplets; p is the pressure; is the momentum change caused by gravity; is the momentum change in the continuous phase caused by droplets. μ is the dynamic viscosity; Yi is the mass fraction of component i; Si is the source term representing the increase in component i due to evaporation.
2.1.2. Turbulence Model
Throughout the spray cooling process, droplets are injected into the air at high velocity. The air, being disturbed by the droplets, exhibits complex transient turbulent motion. Therefore, the turbulence of the air is simulated using the Realizable k-ε model, which has been validated as suitable for spray atomization conditions and demonstrates relatively good accuracy in predicting spray dispersion and liquid film spreading rates [28,29]. The complete formulation of the Realizable k-ε model is defined as follows:
In the equations, Gk represents the production of turbulent kinetic energy due to mean velocity gradients, while Gb describes the generation caused by buoyancy effects. The influence of fluctuating dilatation on the overall dissipation rate in compressible turbulent flows is represented by YM. In the numerical simulations, the model constants C2, C1ε, and C3ε adopt values of 1.9, 1.44, and 1.0, respectively.
2.1.3. Discrete Phase Model
Within the discrete phase model, the motion equations of spray droplets in the Lagrangian coordinate system are described by Newton’s second law. The thermophoretic effect on spray droplets is disregarded, as the surrounding air phase exhibits minimal temperature variation except in the thin thermal boundary layer adjacent to the hot surface. Additionally, since most spray droplets exceed 1 μm in diameter and are therefore non-submicron particles, the effects of Brownian force and Saffman lift force are disregarded. Only the drag force is considered in the droplet force model, as shown in Equations (7)–(11).
In the equations, ud is the droplet velocity vector and ρd is the droplet density. The drag force per unit mass acting on the droplet is represented by (u − ud)/τr. dd is defined as the diameter of the droplet, and Cd is referred to as the dynamic drag coefficient. Cd,s designates the drag coefficient for a standard spherical droplet, where y is introduced as the shape correction factor of the droplet; y = 1 corresponds to a disk-shaped droplet, and y = 0 to a spherical droplet. Re is designated as the relative Reynolds number.
2.1.4. Wall Film Model
The Lagrangian Wall Film model is employed to simulate the interactions of spray droplets following wall impingement. Four distinct droplet–wall interaction regimes are defined in the model: attachment, spreading, rebound, and splashing. When a spray droplet impacts a wall surface below the boiling temperature, sticking, spreading, or splashing may occur. Conversely, if the wall temperature is above the boiling point, rebound or splashing may take place. The impact energy is expressed as:
where Vpn denotes the particle velocity normal to the wall, ρ represents the liquid density, dp is the droplet diameter, σ indicates the surface tension of the liquid, and h0 corresponds to the film thickness. δbl represents the boundary layer thickness.
2.1.5. Coupling of the Discrete and Continuous Phases
Throughout the spray cooling process, with spray droplets treated as a discrete phase and air as the continuous phase, interactions of mass, momentum, and energy are exchanged between the droplets and the air. To enhance computational accuracy and alignment with physical reality, bidirectional coupling is adopted. The governing equations for both phases are solved iteratively in an alternating manner by the solver until convergence is achieved. The TAB model was applied to simulate the process of droplet breakup.
Mass coupled equation:
Energy coupled equation:
Momentum coupled equation:
In the equations, Δmp is defined as the change in droplet mass within the computational domain over a single time step. ṁp,0 represents the initial mass flow rate of the droplet, and mp,0 refers to the initial mass of the droplet; mPin is defined as the mass of droplets entering the control volume, while mPout is characterized as the mass exiting it. hfg designates the latent heat of vaporization at the current temperature. TPin indicates the temperature of droplets upon inflow to the control volume, and TPout reflects the temperature at outflow; μ expresses the viscosity of the continuous phase, and ρd describes the droplet density. Re represents the Reynolds number, and Fother accounts for the influence of additional external forces.
2.2. Geometric Model and Boundary Conditions
2.2.1. Geometric Model
The physical model in this study is derived from an industrial rotary cooler. The investigation examines a dual-nozzle system arranged on a local section of the outer surface, as shown in Figure 2. The rotary cooler wall has a thickness of 32 mm and an outer diameter of 3.2 m. The dual nozzles are arranged along the axial direction of the outer wall. The width of the computational domain is much smaller than the overall circumference of the cooling rotary cooler. As shown in Table 1, it has been verified that the error between the large-diameter curved plane and the flat plane is within 1%. Meanwhile, existing studies have shown that the temperature gradient difference between the circumferential and axial directions is relatively small during the spray cooling process in large-diameter rotary kilns [30]. Therefore, simplifying the base surface of the computational domain as a plane is justified.
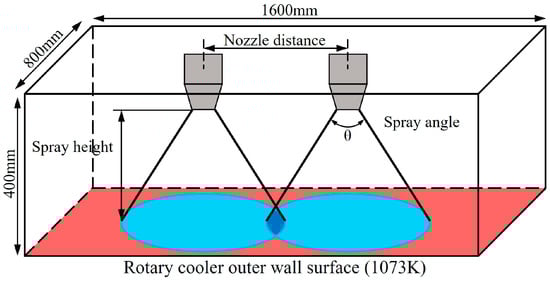
Figure 2.
The simplification of the 3D physical model of spray cooling.

Table 1.
The difference between flat plane and a Large-diameter Curved Plane.
2.2.2. Boundary Conditions
Appropriate boundary conditions are critical for the efficiency and accuracy of numerical solutions. Based on the actual operating conditions in the high-temperature region of the rotary cooler inlet, corresponding boundary and initial conditions are set in this study. The bottom of the computational domain is defined as the outer wall of the rotary cooler, with the initial wall temperature set to 1073 K, matching the cement temperature at the inlet.
The bottom surface of the domain is initially assumed to have a constant temperature for the following reasons. First, particle size analysis reveals that the calcined clay comprises powdered particles averaging 11 μm in diameter, which form a densely packed bed inside the cylinder. This compact structure ensures uniform wall contact and promotes a homogeneous temperature field. Secondly, the inlet section receives a continuous supply of material at 1073 K, while the cylinder rotates slowly at 1–3 rpm, gradually conveying the calcined clay toward the outlet section. Third, the cylinder itself is constructed from high thermal conductivity steel. Therefore, the initial wall temperature is approximated as an isothermal field at 1073 K.
The side boundaries were set as pressure outlets, while the top boundary was defined as a pressure inlet. The turbulent intensity for boundaries was specified as 5%, and the temperature was set to 300 K. The nozzle pressure was 0.6 MPa, with a nozzle diameter of 2 mm. Spray droplets were injected into the computational domain starting from an initial time of 0 s, with the Sheet Constant and Ligament Constant set to 12 and 0.5, respectively. Detailed boundary condition parameters are provided in Table 2. To simulate the behavior of the liquid film formed by spray droplets on the outer wall of the rotary cooler, a wall-film model is applied near the wall surface [31]. All discrete phase boundaries are treated as escape. Key parameters, such as the cooling medium temperature, nozzle diameter, and height, are also specified in the numerical calculations. The pressure-velocity coupling in the governing equations is achieved using the SIMPLE algorithm. Spatial discretization of the pressure, momentum, and energy equations uses a second-order upwind scheme, while the turbulence equations are discretized using a first-order upwind scheme. Time discretization is performed using a first-order implicit scheme. The spray simulation duration is set to 1 s.
Table 2.
Simulation-related parameter settings.
2.3. Mesh Independence Verification and Mathematical Model Validation
2.3.1. Mesh Independence Test
In numerical simulations, both the quantity and quality of the mesh within the computational domain significantly influence the results [32]. In principle, the simulation outcomes can be considered reliable only when they stabilize with increasing cell density and further refinement. In this study, the computational domain was discretized using an unstructured polyhedral mesh, with grid generation performed using Fluent Meshing. Moreover, to ensure mesh quality, grid refinement was implemented specifically on the bottom surface, which corresponds to the cooling surface. The orthogonal quality of the mesh is 0.502, which is greater than 0.25, indicating good mesh quality that is suitable for subsequent research.
To conduct a mesh independence study, four meshes with varying resolutions (909,907, 1,215,364, 1,515,337, 1,966,435) were generated and compared. Table 3 presents the average surface temperature of the cooling surface, peak heat flux, and local liquid film thickness at the spray center point under different mesh counts, along with the corresponding Grid Convergence Index (GCI). When the mesh exceeds 909,907 cells, further refinement results in variations within a 10% margin.
Table 3.
Trend of the surface temperature of the cooling surface varying with the number of grids.
Figure 3 illustrates the temporal variation in average heat flux for meshes containing 909,907 and 1,966,435 cells, respectively. The heat flux profiles are found to exhibit similar trends between the two mesh configurations. Furthermore, all variations in the finer mesh (1,966,435 cells) consistently fall within a ±5% error band relative to the coarser mesh (909,907 cells), which confirms that mesh independence is satisfactorily achieved. Therefore, a mesh comprising 909,907 cells was employed for all subsequent simulations.
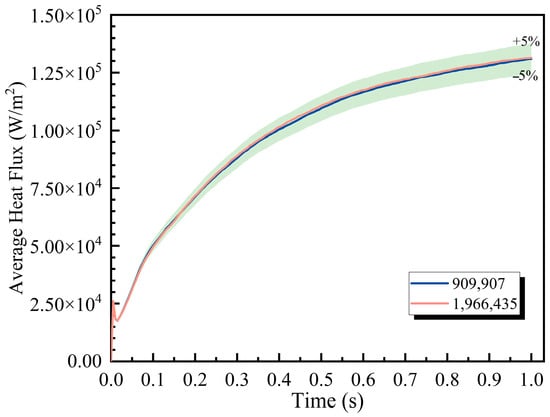
Figure 3.
Average heat flux variation over time under different meshes.
2.3.2. Validation of the Numerical Model
Model validation is critically important in numerical calculation [33,34]. To validate the accuracy of the simulation model, the simulation parameters were set based on the experimental data from Wan et al. [35]. The numerical simulation results for spray cooling were compared with the experimental data, as shown in Table 4 and Figure 4. The deviation between the simulation and experimental results was within ±10%, which demonstrated that the chosen numerical model was reliable and could be used for subsequent simulation studies.
Table 4.
Comparison between simulation results and reference results.
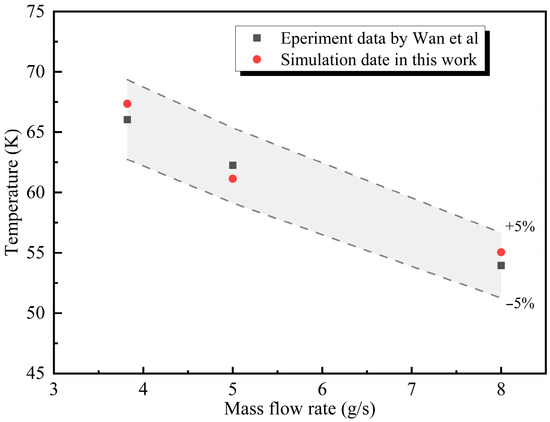
Figure 4.
Comparison of experimental data and simulation results [34].
2.4. Uniformity of Cooling Surface
The uniformity measurement line is defined along the spray centerline on the cooled surface, with its position illustrated in Figure 5a. To evaluate the consistency of the temperature distribution across the entire cooled surface, the average of the standard deviations of the heat flux along the two measurement lines is adopted as the evaluation metric. A value of 116,033 W/m2, calculated from measurements under the spray parameter conditions listed in Table 2, is established as the benchmark for good uniformity. A heat flux standard deviation lower than this benchmark is considered indicative of good uniformity. This criterion is applied primarily because when the uniformity-related parameters exceed this range, localized overheating tends to occur at the edges of the spray coverage area. For instance, as shown in Figure 5b, merely increasing the spray angle to 110° is sufficient to cause a localized temperature rise at the edge of the coverage zone.
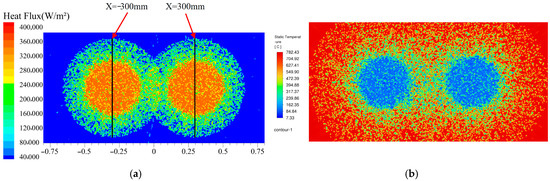
Figure 5.
Temperature uniformity: (a) measurement line and (b) example of poor uniformity.
3. Results
3.1. Analysis of Spray Cooling Process
Figure 6 shows the variation in droplet evaporation rate and wall surface temperature over time under a spray angle of 90° and a nozzle distance of 600 mm. The Droplet evaporation rate represents the instantaneous value during the spray cooling process. It can be observed that between 0.6 and 0.8 s, both the hot surface temperature and the instantaneous droplet evaporation rate remain relatively stable, indicating that the spray system has reached a state of dynamic equilibrium. After 0.8 s, the cooling surface begins to cool further with a slight acceleration, while the droplet’s instantaneous evaporation rate continues to increase. This suggests that the spray system undergoes secondary expansion beyond its initial stable stage after t > 0.8 s. This demonstrates that the spray cooling system has reached a stable state within the 1 s instantaneous simulation time.
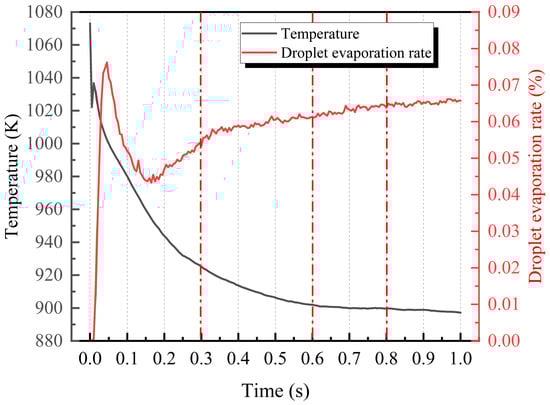
Figure 6.
The time-dependent variation in spray cooling heat transfer performance.
3.2. Effect of Nozzle Distance and Spray Angle
Figure 7 presents a three-dimensional delineation of the influence of nozzle distance and spray angle combinations on heat transfer efficiency in a dual-nozzle system. Analysis shows that the spray angle is the dominant factor, exhibiting a significantly greater influence on cooling performance than nozzle distance. A marked reduction in heat transfer efficiency is observed with overly small spray angles (50–70°), an effect that remains consistent across various spacing configurations. This indicates that an insufficient spray angle is the primary constraint on cooling effectiveness. A clear parametric trend for optimal cooling was identified: superior performance can be achieved by employing a larger spray angle in conjunction with an appropriate nozzle distance. When the spray angle is increased to the 80–100° range, a notable enhancement in heat exchange efficiency is achieved at the cooling surface, and effective heat conduction is maintained across all nozzle distances. However, when the spray angle is further increased beyond 100°, appropriate nozzle distance becomes more critical. The advantages of large spray angles are compromised by insufficient nozzle distance, resulting in reduced heat transfer efficiency. For instance, at a spray angle of 110° with a nozzle distance of 400 mm, the heat flux is measured at 128,198.5 W/m2. When the nozzle distance is increased to 600 mm, the heat flux rises to 132,364.1 W/m2, achieving optimal performance. This finding confirms that even with large spray angles that provide satisfactory cooling effectiveness, properly matched nozzle distance can further improve heat transfer efficiency.
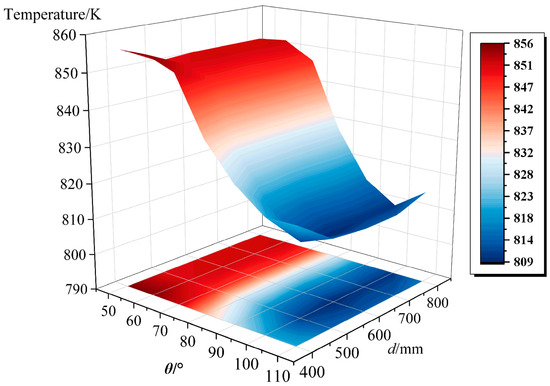
Figure 7.
The effect of nozzle distance and spray angle on nozzle heat transfer performance.
3.2.1. Effect of Nozzle Distance
Figure 8, Figure 9 and Figure 10 present the effects of different nozzle distances (400–800 mm) on the heat flux and cooling effectiveness of the cooling surface at a spray angle of 90°. The results demonstrate that optimal spray cooling performance is achieved at a nozzle distance of 600 mm, with a corresponding heat flux of 131,037.6 W/m2. However, as the nozzle distance is further increased to the 700–800 mm range, the variation in heat flux at the cooling surface becomes gradual reduction. This trend indicates a substantially diminished influence of nozzle distance on cooling performance. This phenomenon is attributed to the reduced overlap of the effective coverage areas between the two nozzles as the nozzle distance increases under the 90° spray angle condition. This reduction eventually results in independent spray coverage patterns. These findings indicate that an appropriate nozzle distance in dual-nozzle configurations is beneficial for enhancing heat transfer efficiency. However, beyond a certain range, the sensitivity of heat flux to nozzle distance variations is significantly reduced.
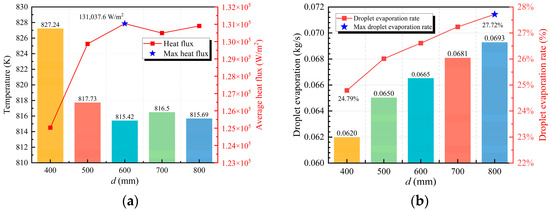
Figure 8.
Cooling efficiency at different nozzle distances: (a) Surface temperature and heat flux; (b) Droplet evaporation rate.
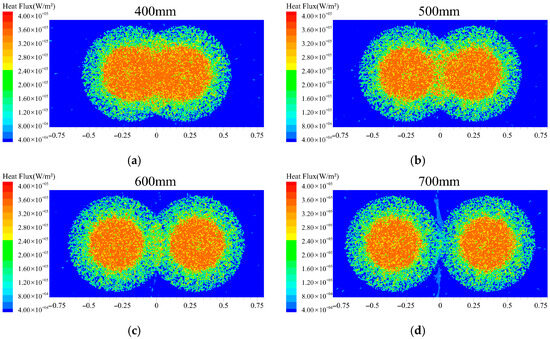
Figure 9.
Surface heat flux at different nozzle distances: (a) nozzle distance = 400 mm; (b) nozzle distance = 500 mm; (c) nozzle distance = 600 mm; (d) nozzle distance = 700 mm.
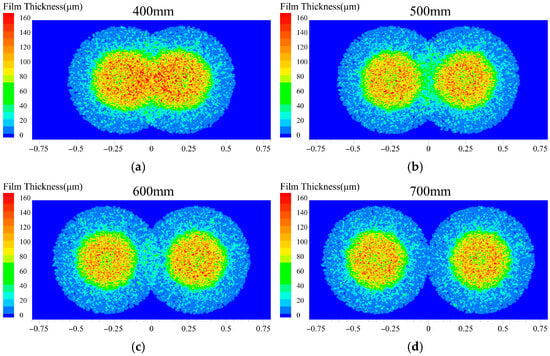
Figure 10.
Surface liquid film thickness at different nozzle distances: (a) nozzle distance = 400 mm; (b) nozzle distance = 500 mm; (c) nozzle distance = 600 mm; (d) nozzle distance = 700 mm.
Figure 9 and Figure 10 present the effects of nozzle distance (400–700 mm) on liquid film thickness distribution and heat flux at a spray angle of 90°. At a nozzle distance of 400 mm, a larger overlapping zone is observed within the dual-nozzle spray coverage area. This accumulation of liquid in both the overlapping and central spray regions results in locally thickened liquid films. Correspondingly, as shown in Figure 9a, the lowest heat flux and poorest cooling performance are recorded at this 400 mm configuration. This phenomenon is attributed to the close correlation between heat transfer efficiency and the actual liquid film coverage area. An insufficient nozzle distance (400 mm) restricts the overall coverage area of the dual sprays. This restriction limits liquid film spreading and reduces the effective heat transfer area between the liquid film and cooling surface. Furthermore, within a unit time period, excessive coolant is accumulated within the limited coverage area, promoting liquid film thickening. The thickened liquid film not only increases thermal resistance but also hinders the detachment of bubbles generated during boiling, thereby suppressing evaporation.
As shown in Figure 8b, the droplet evaporation rate at a nozzle distance of 400 mm is measured at only 24.79%. This confirms that bubble detachment during boiling is significantly hindered by the thickened liquid film, leading to substantially limited cooling efficiency. On the other hand, excessively thin liquid films are disadvantageous for maintaining stable and efficient cooling processes. In the peripheral regions of the spray coverage area, the liquid film thickness is insufficient, and after evaporation, it cannot be adequately replenished by surrounding liquid. This may lead to localized dry-out where the cooling surface becomes exposed, thereby reducing overall heat transfer capacity. Furthermore, excessively thin liquid films reduce the number of active nucleation sites during boiling processes, weakening nucleate boiling intensity and consequently compromising heat transfer efficiency.
Figure 10c presents the cooling performance of the dual-nozzle spray at a nozzle distance of 600 mm. Under this condition, a partially overlapping zone is maintained between the spray coverage areas. The peak heat flux is achieved at this configuration. With further increase in nozzle distance, the heat flux shows a gradual decreasing trend. When the nozzle distance exceeds 700 mm, the dual spray coverage areas tend to become independent of each other. The influence of nozzle distance on heat flux is significantly weakened. At distances of 700–800 mm, the spray coverage areas are completely separated. Nozzle distance no longer demonstrates significant effects on the heat flux of the cooling surface. The results indicate that nozzle distance primarily affects cooling performance through two mechanisms: the effective heat transfer area of the liquid film and its thickness. At appropriate distances, partially overlapping spray regions help form uniform liquid film distribution. This enhances the synergistic heat transfer effect between dual sprays. However, when the distance becomes excessive, the overlapping spray area is reduced. This diminishes the heat transfer enhancement originally provided by the overlapping region on the cooling surface. When the nozzle distance is 700–800 mm, the effective heat transfer area of the liquid film is larger than that at 600 mm, yet the heat flux is lower. This further demonstrates that a moderate overlapping spray region exerts a synergistic enhancement effect on heat transfer.
Figure 11 presents schematic diagrams illustrating the internal flow mechanisms within liquid films on cooling surfaces under different nozzle distances. In Figure 11a, excessive liquid accumulation is observed in the overlapping region due to insufficient nozzle distance, resulting in locally thickened liquid films. This increased film thickness elevates thermal resistance and suppresses bubble detachment, thereby degrading heat transfer capability. Conversely, Figure 11b demonstrates the internal flow patterns under optimal nozzle distance conditions. At an appropriate nozzle distance, two primary liquid film flow patterns are identified: secondary spreading flow and lateral convergence flow between dual spray films. Figure 11c presents the velocity vector field of the liquid film on the cooled surface. The overall flow is characterized by an outward expansion from the spray center toward the periphery, where two distinct flow patterns can be observed: secondary spreading and lateral convergence flow. The secondary spreading flow is formed as continuously impinging droplets merge into the liquid film, driving its radial expansion. The lateral convergence flow within the spray overlap region exhibits two directional components: inward convergence toward the adjacent spray area and outward expansion along the upper and lower directions following impingement. Both the secondary spreading and lateral convergence flow collectively enhance the extension of the liquid film, increase the effective heat transfer area, and improve film uniformity. In particular, the lateral convergence flow between the twin-spray films significantly enhances the uniformity of liquid film distribution. This improvement effectively prevents local dry-out or excessive accumulation, thereby optimizing heat transfer performance.
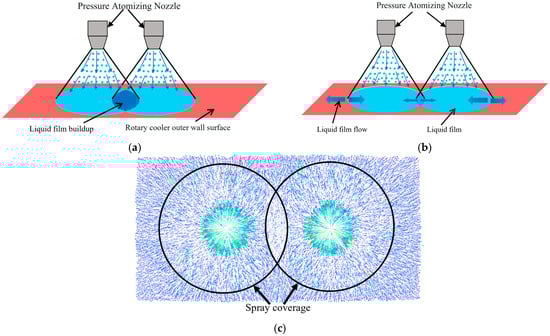
Figure 11.
Liquid film flow behavior as a function of nozzle distance: (a) Excessively small nozzle distance; (b) Appropriate nozzle distance; (c) Velocity vector diagram of appropriate nozzle distance.
3.2.2. Effect of Spray Angle
Figure 12, Figure 13 and Figure 14 present the effects of different spray angles on heat flux and cooling performance at a fixed nozzle distance of 600 mm. The results demonstrate that as the spray angle increases, the heat flux at the cooling surface first increases and then decreases, with optimal cooling performance achieved at 100°. As shown in Figure 13a,b, at spray angles of 60° and 70°, the dual spray coverage areas remain isolated from each other. This isolation results in lower heat flux densities and weaker sensitivity to variations in spray angle. Figure 12b indicates that the droplet evaporation rates are relatively low at these spray angles, and the liquid film is thicker, reaching a maximum average thickness of 32.6 μm at a spray angle of 50°. When the spray angle exceeds 70°, overlapping between the dual spray coverage areas emerges, along with a progressive expansion of the total coverage area. The sensitivity of heat flux to spray angle variations becomes significantly enhanced, and the heat flux increases rapidly. The maximum heat flux is attained at a spray angle of 100°. However, when the spray angle increases beyond 100°, the excessive angle causes deteriorated droplet distribution uniformity in the peripheral spray coverage areas. This degradation results in reduced heat flux. Therefore, the optimal configuration considering both heat flux and film uniformity is the 90° spray angle, achieving 131,037.6 W/m2. These findings confirm that an appropriate overlapping area between spray coverage areas serves as a key mechanism for enhanced heat transfer.
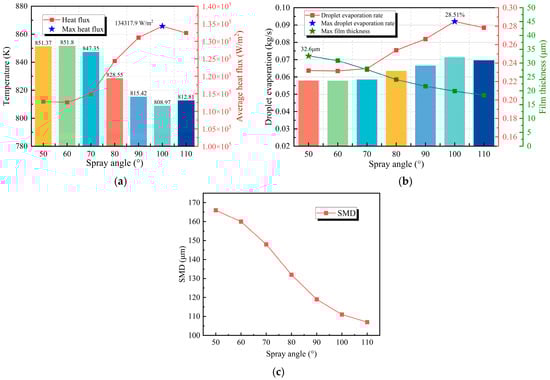
Figure 12.
Cooling efficiency at different spray angles: (a) Surface temperature and heat flux; (b) Droplet evaporation rate and film thickness; (c) SMD.
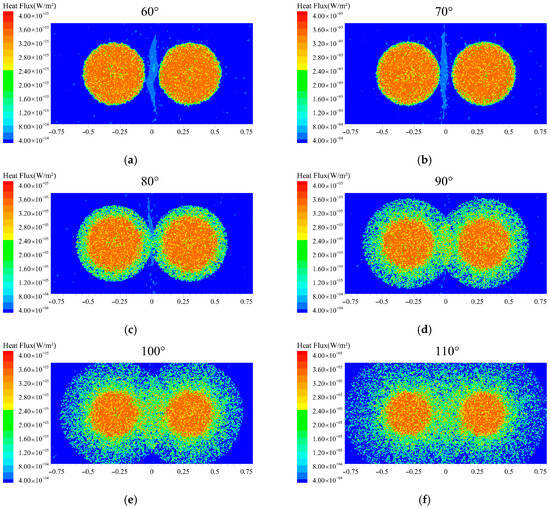
Figure 13.
Surface heat flux at different spray angles: (a) 60°; (b) 70°; (c) 80°; (d) 90°; (e) 100°; (f) 110°.
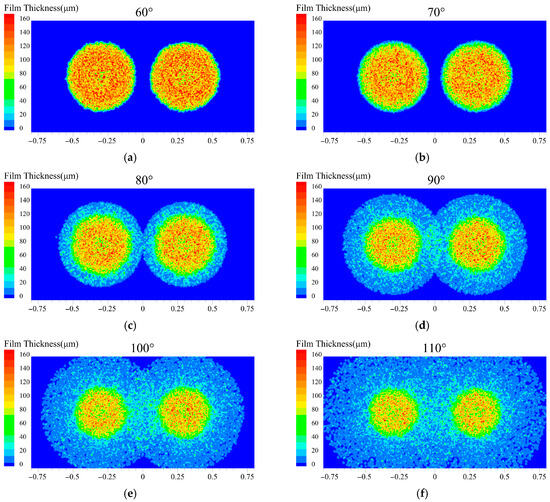
Figure 14.
Surface liquid film thickness at different spray angles: (a) 60°; (b) 70°; (c) 80°; (d) 90°; (e) 100°; (f) 110°.
The Weber number (We) given in Equation (17) reflects the relative importance of inertial forces to surface tension in spray droplet flow [35]. Figure 12c illustrates the variation in Sauter Mean Diameter (SMD) with spray angle. It can be observed that as the spray angle increases, the SMD gradually decreases, indicating enhanced atomization. Since the spray mass flow rate is held constant, the reduction in SMD leads to a corresponding decrease in the We with increasing spray angle. This signifies that the role of inertial forces weakens relative to that of surface tension.
Figure 14 presents the characteristic distribution of liquid film thickness on the cooling surface under different spray angles (60–110°) at a fixed nozzle distance of 600 mm. Under smaller spray angles (<80°), the dual spray coverage areas are isolated from each other, and the central liquid film thickness is significantly lower than that at the peripheral regions. This behavior is due to the transition of the liquid film from the stabilization to the expansion phase within 1 s at small spray angles (<80°). As a result, the liquid film is propelled from the central to the peripheral regions, resulting in localized thickening through liquid accumulation at the periphery. Meanwhile, the actual liquid film coverage area is extended beyond the theoretical spray coverage zone.
When the spray angle exceeds 80°, contact and merging are initiated between the liquid film edges formed by the dual sprays. This interaction significantly improves the coverage uniformity on the cooling surface through the formation of a continuous wetted zone, effectively expanding the heat transfer area. This mechanism therefore explains the rapid enhancement in heat flux observed on the cooling surface after the spray angle surpasses 80°. As the spray angle increases to 90°, the liquid film distribution becomes uniform and stable, and the peak heat flux is achieved. However, when the spray angle exceeds 90°, the excessive coverage area results in a reduction in the average liquid film thickness. In the peripheral regions of the spray coverage, the liquid film becomes excessively thin and cannot be sufficiently replenished following evaporation. This condition leads to localized overheating and consequently degrades the overall cooling performance. As shown in Figure 14b, when the spray angle is increased from 80° to 110°, the average liquid film thickness is gradually reduced. This indicates that a larger spray angle helps expand the spray coverage area, thereby enhancing the droplet evaporation rate, while also making the liquid film thinner overall. Although evaporation rates can be higher at angles above 90°, the non-uniform distribution of the liquid film may lead to localized overheating. At a spray angle of 110°, the insufficient liquid film coverage at the edges presents a risk of local overheating.
Figure 15 shows the velocity vector diagrams following droplet impingement on the cooled surface for spray angles ranging from 70° to 100°. At a spray angle of 70°, the spray droplets predominantly influenced the central area of the coverage zone, and the two spray coverage areas remained independent of each other. As the spray angle increased to 80°, a small overlapping region began to form due to the intersection of the two coverage areas, indicating the onset of interaction between the sprays. When the spray angle was further increased to 90–100°, the overlapping region continued to expand, and the interaction between the sprays became significantly stronger. This enhanced interaction was specifically manifested in the liquid film by the distinct convergence and merging of the films from both sides within the overlap zone.
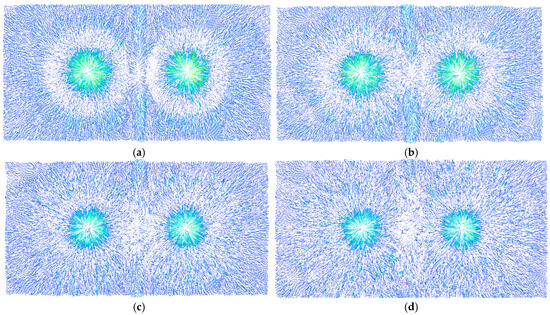
Figure 15.
Velocity vector diagrams of the surface liquid film under different spray angles: (a) 70°; (b) 80°; (c) 90°; (d) 100°.
In dual-nozzle spray systems, heat transfer performance is jointly determined by nozzle distance and spray angle through their influence on the spray coverage area. When these parameters are insufficient, the limited spray coverage directly reduces the effective heat transfer area between the liquid film and the cooling surface. Concurrently, the liquid film is excessively thickened by liquid accumulation in the confined area. This thickening significantly increases thermal resistance and hinders the detachment of bubbles generated during evaporation. Conversely, excessively large nozzle distance and spray angle result in non-uniform liquid film distribution across the substantially expanded spray coverage area. Particularly in peripheral regions, localized overheating is caused by insufficient droplet replenishment, thereby degrading the overall efficiency. Therefore, both liquid film uniformity and heat transfer efficiency must be comprehensively evaluated to determine the optimal combination of nozzle distance and spray angle. This study demonstrates that the optimal spray cooling performance was achieved at a nozzle distance of 600 mm with a 90° spray angle. This configuration maintained an average surface temperature of 815.42 K while reaching a heat flux of 131,037.6 W/m2.
3.3. Effect of Mass Flow Rate
The flow rate of cooling water influences droplet velocity, thereby affecting droplet atomization and evaporation. A single-variable control method was employed to investigate the effect of cooling water mass flow rate on the heat transfer performance of spray cooling. Key spray parameters are summarized in Table 2. Based on typical industrial spray flow rate ranges, the mass flow rate was varied from 0.075 kg/s to 0.2 kg/s (corresponding to 4.5–9 L/min) in increments of 0.025 kg/s (1.5 L/min). Numerical simulations were conducted for each flow condition.
Figure 16a presents the variation in the average temperature and heat flux on the cooling surface with the cooling water mass flow rate. The results show that the average temperature exhibits a negative correlation with increasing mass flow rate, while the heat flux shows a distinct positive correlation. The cooling water flow rate was found to significantly influence the heat transfer efficiency. As shown in Figure 16b, higher mass flow rates provide sufficient droplet supply to sustain the liquid film, resulting in continuous heat flux increase. However, as the mass flow rate increases, the liquid film within the dual-spray coverage area gradually thickens, accompanied by a significant reduction in the droplet evaporation rate. This indicates a decreased proportion of evaporative heat transfer to the total heat exchange and a corresponding increase in the proportion of convective heat transfer. Furthermore, an excessively thick liquid film increases thermal resistance and hinders bubble detachment during boiling. When the mass flow rate reaches 0.2 kg/s, the maximum liquid film thickness of 63.6 µm is achieved. Under these conditions, the high thermal resistance induced by the sufficiently thick liquid film results in a reduction in surface heat flux, with the evaporation rate reaching only 16.6%.
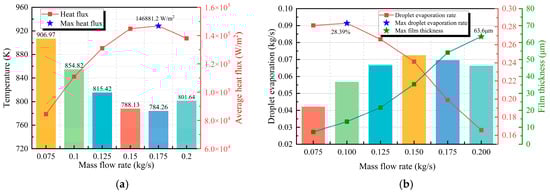
Figure 16.
Cooling efficiency at different mass flow rates: (a) Surface temperature and heat flux; (b) Droplet evaporation rate and film thickness.
Figure 17 illustrates the heat flux distribution across the cooling surface under varying mass flow rates. At low mass flow rates (<0.125 kg/s), the actual effective heat transfer area is substantially smaller than the theoretical spray coverage area. This is evidenced by high heat flux regions being predominantly concentrated in the central spray zone. For instance, at 0.075 kg/s, the effective heat transfer zones of the dual sprays were small and isolated, with lower heat flux at the coverage edges. This phenomenon is attributed to insufficient initial kinetic energy of the droplets when the mass flow rate is too low. As a result, many droplets lack the momentum to reach the peripheral regions, confining effective heat transfer to the central spray area.
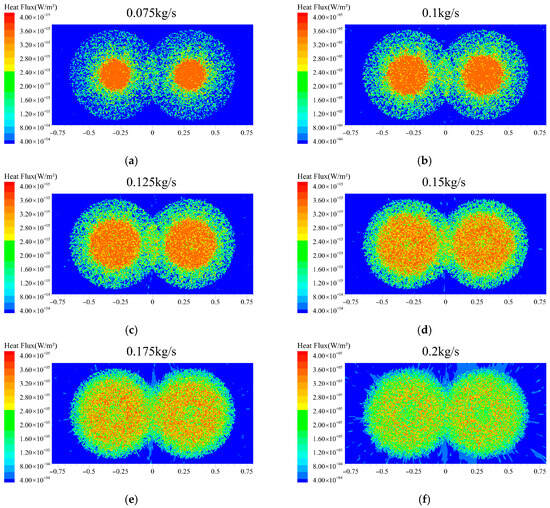
Figure 17.
Surface heat flux at different mass flow rates: (a) 0.075 kg/s; (b) 0.1 kg/s; (c) 0.125 kg/s; (d) 0.15 kg/s; (e) 0.175 kg/s; (f) 0.2 kg/s.
When the mass flow rate is increased to 0.125 kg/s, a relatively uniform heat flux distribution is achieved across the dual-spray coverage area. This uniformity indicates that the droplet kinetic energy is sufficient to cover the entire theoretical spray region. With further increases in mass flow rate, the effective heat transfer area was only slightly expanded, and the surface heat flux continued to rise. This indicates that beyond this stage (>0.125 kg/s), the proportion of convective heat transfer in the total heat exchange of the spray system increases, enhancing convective heat transfer while diminishing the evaporative heat transfer effect. However, when the mass flow rate reaches 0.2 kg/s, the surface heat flux decreases due to the formation of an excessively thick liquid film that impedes heat transfer, thereby reducing the cooling effectiveness of the spray system.
Figure 18 presents the variation in liquid film thickness with mass flow rate, which shows a strong correlation with the heat flux response. The results demonstrate that when the mass flow rate reached 0.125 kg/s, a uniform and stable liquid film distribution was achieved across the dual-spray coverage area. With a further increase in mass flow rate, the liquid film continues to thicken in the central region and expands secondarily toward the edges. At 0.175 kg/s, distinct secondary expansion of the liquid film is observed in the overlapping region of the dual sprays. This behavior is attributed to the increased initial droplet velocity resulting from mass flow rates exceeding 0.125 kg/s. More kinetic energy is absorbed by the liquid film from high-velocity droplet impacts, promoting secondary expansion and increasing the effective heat transfer area. Simultaneously, the enhanced droplet impact intensifies disturbances within the liquid film, facilitating the formation of nucleate boiling sites.
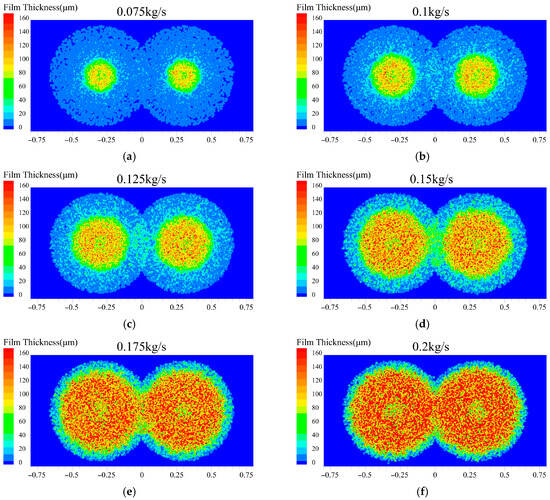
Figure 18.
Surface liquid film thickness at different mass flow rates: (a) 0.075 kg/s; (b) 0.1 kg/s; (c) 0.125 kg/s; (d) 0.15 kg/s; (e) 0.175 kg/s; (f) 0.2 kg/s.
Comprehensive analysis shows that at high mass flow rates (>0.125 kg/s), the heat flux increase is driven mainly by the expanded heat transfer area from liquid film spreading. Based on film uniformity and evaporation rate, a mass flow rate of 0.125 kg/s is optimal, as it ensures stable coverage and a high evaporation rate.
3.4. Effect of Spray Height
The spray height is defined as the distance between the nozzle exit and the cooling surface. To systematically investigate its effect on spray cooling performance, key parameters were specified in Table 2. Numerical simulations were performed for spray heights ranging from 300 mm to 400 mm in 20 mm increments, covering multiple operating conditions.
Figure 19a illustrates the effect of spray height on the heat transfer performance of the cooling surface. The heat flux increases approximately linearly with spray height, reaching a maximum value of 134,314.1 W/m2 at 400 mm. Correspondingly, Figure 19b shows that the droplet evaporation rate also peaks at this height. Conversely, the liquid film thickness on the cooling surface decreases as the spray height increases.
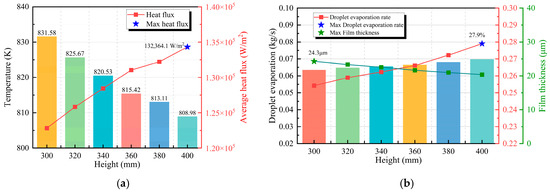
Figure 19.
Cooling efficiency at different spray heights: (a) Surface temperature and heat flux; (b) Droplet evaporation rate and film thickness.
Figure 20 presents the heat flux distribution patterns on the cooling surface under different spray heights. At a spray height of 300 mm, the dual spray coverage areas remain isolated from each other. As the spray height increases, the heat flux shows a significant rising trend. This phenomenon is primarily attributed to the expansion of the theoretical spray coverage area at greater heights. Consequently, the effective heat transfer area of the spray is enlarged, enhancing the heat transfer effectiveness. This finding further confirms that expanding the effective heat transfer area of the spray serves as a critical factor in increasing heat flux.
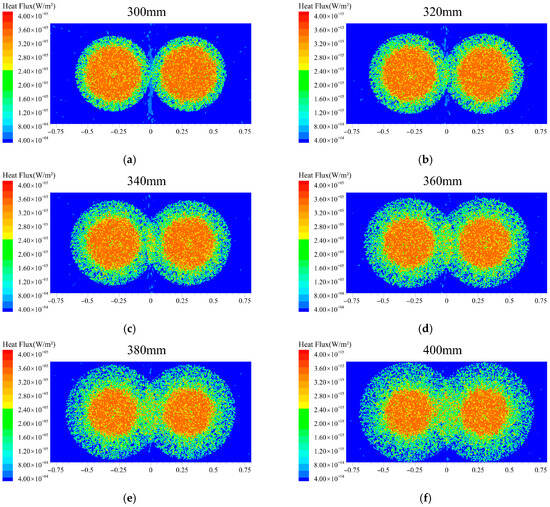
Figure 20.
Surface heat flux at different mass flow rates: (a) 300 mm; (b) 320 mm; (c) 340 mm; (d) 360 mm; (e) 380 mm; (f) 400 mm.
Figure 21 presents the influence of spray height on liquid film thickness distribution. At 300 mm spray height, the maximum liquid film thickness is observed alongside the lowest heat flux. This is attributed to the smaller effective heat transfer area at lower spray heights, which causes coolant accumulation in limited regions. The thickened liquid film increases thermal resistance and suppresses bubble detachment during evaporation, thereby reducing heat transfer efficiency. These results are consistent with the lowest evaporation rate shown in Figure 19b, which collectively confirms the inhibitory effect of excessive liquid film thickness on thermal performance. As the spray height is progressively increased, more uniform liquid film distribution is achieved along with elevated heat flux on the cooling surface. Simultaneously, significantly reduced thickness is observed in both the central region and the peripheral areas of the dual-spray coverage zone. However, when the spray height reaches 380–400 mm, slight non-uniformity in liquid film coverage begins to appear at the periphery, indicating that excessively high spray heights can compromise the uniformity of liquid film distribution.
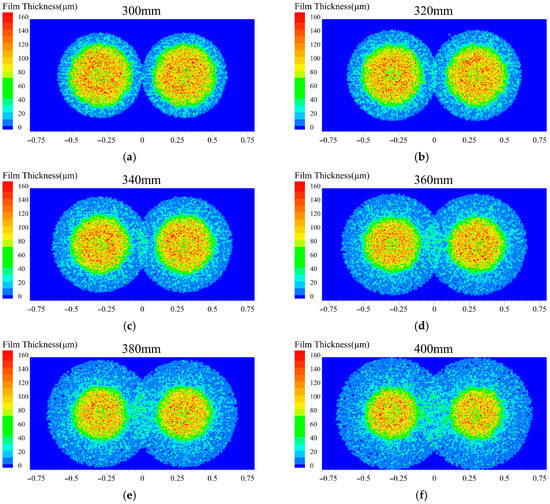
Figure 21.
Surface liquid film thickness at different spray heights: (a) 300 mm; (b) 320 mm; (c) 340 mm; (d) 360 mm; (e) 380 mm; (f) 400 mm.
3.5. Response Surface Method Analysis of the Impact of Multiple Factors
3.5.1. Experimental Design and Predictive Model of Heat Flux
In this study, the Response Surface Methodology (RSM) based on Box–Behnken design was utilized. This approach was employed to evaluate the synergistic effects of spray angle, spray height, and nozzle distance on the heat transfer performance of the cooling surface. The experimental design and data analysis were performed using Design-Expert 13, and the results are presented in Table 5. The heat flux response prediction model is expressed as:
Table 5.
Response surface design and average heat flux results of the cooling surface.
The difference between the predicted values from the RSM model and the actual values is crucial for assessing the model’s predictive accuracy, which is typically illustrated using tools such as the normal probability plot of residuals. Figure 22 presents the normal probability plot of residuals for the heat flux predictive model, along with a comparison between the experimental and predicted values. The results demonstrate that the model’s predictions are in good agreement with the actual measurements.
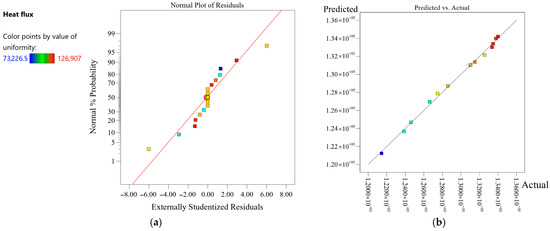
Figure 22.
Validation of Response Surface Prediction Model: (a) Normal plot of residuals; (b) experimental data vs. predicted values.
Analysis of Variance (ANOVA) was employed to compare the significance of each parameter’s influence on the cooling surface heat flux, with the results presented in Table 6. Excellent predictive capability was demonstrated by the established model. This result is confirmed by the high R2 value of 99.91%, which indicates strong correlation between experimental measurements and model prediction. ANOVA indicates that both spray height and nozzle distance have p-values below 0.0001, confirming their statistically significant influence on cooling surface heat flux. According to the F-values, the parameters are ranked by their effect on cooling efficiency as follows: spray angle, spray height, and nozzle distance. Among the two-factor interactions, the combination of spray angle and spray height shows the most significant effect on cooling efficiency. This result demonstrates that parameter synergy plays a critical role in optimizing spray cooling performance. It should be noted that the RSM was based on numerical simulation results. In computational fluid dynamics (CFD) simulations, identical boundary conditions yield a deterministic numerical solution. Consequently, replicate runs in the experimental design produced identical values.
Table 6.
The variance analysis results of the heat flux.
Table 7 presents the statistical data for the predictive model of spray heat flux. An R2 of 0.9966 indicates that the model exhibits an exceptional fit. The Adjusted R2 of 0.9923 further confirms the high quality of the fit, explaining 99.23% of the variability. A Predicted R2 of 0.9462 demonstrates strong predictive capability, meaning the model accounts for 94.62% of the variability in new or unseen data, suggesting excellent generalization [36,37]. The Adeq. Precision value of 51.2610, significantly above the threshold of 4, indicates a robust signal-to-noise ratio and reliable predictive accuracy. Within the statistical data, the mean value is 1.298 × 10⁵, and the standard deviation is 329.87, reflecting the dispersion of the predicted values around the mean. A coefficient of variation (C.V.) of 0.2542% denotes low relative variability, showing that the predicted values are highly consistent around the mean.
Table 7.
The statistical analysis results of the fitted model.
3.5.2. Experimental Design and Predictive Model
Figure 23 presents the synergistic effects of spray angle and nozzle distance on the heat flux of the cooling surface at a fixed spray height of 360 mm. RSM reveals a nonlinear increase in heat flux with the enlargement of both parameters. The optimal spray cooling performance is obtained within the range of 95–100° for the spray angle and 600–700 mm for the nozzle distance. Configurations employing larger spray angles (>90°) and greater nozzle distances (>600 mm) demonstrate significantly superior heat transfer performance compared to those with smaller angles (<90°) and shorter distances (<600 mm). This result further confirms that the effective heat transfer area between the liquid film and the cooling surface is a critical factor governing spray cooling efficiency.
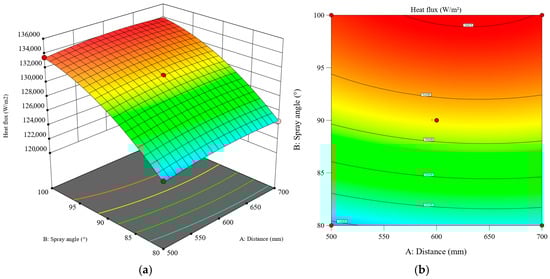
Figure 23.
Response surface of the impact of spray angle and nozzle distance on the average heat flux of the heat transfer surface: (a) 3D surface; (b) contour plot.
The spray angle is identified as the dominant factor influencing heat flux. When a small spray angle (80°) is employed, merely increasing the nozzle distance provides limited enhancement in heat transfer performance. This limitation stems from liquid film accumulation within the confined coverage area, where a thickened film forms and creates substantial thermal resistance. Under these conditions, heat flux initially rises then declines with increasing nozzle distance. However, when nozzle distance is extended beyond the peak heat flux point, the overlapping region between the dual-nozzle coverage areas diminishes. This progression continues until the spray coverage areas become completely separated, resulting in the loss of the synergistic cooling effect and a consequent reduction in heat flux.
3.5.3. Synergistic Effect Between Spray Height and Nozzle Distance
Figure 24 presents the synergistic effects of spray height and nozzle distance on the heat flux of the cooling surface under a fixed spray angle of 90°. RSM shows that heat flux grows nonlinearly with spray height. It is also demonstrated that spray height plays a more critical role in determining heat transfer performance. The optimal nozzle configuration was identified within the parameter ranges of 550–650 mm for nozzle distance and 370–380 mm for spray height. Notably, at lower spray heights (<350 mm), nozzle distance has a limited effect on heat flux enhancement. The poorest performance, with a heat flux of only 127,485.3 W/m2, was observed at 500 mm nozzle distance and 340 mm spray height. This is attributed to the restricted spray coverage at insufficient spray heights, which reduces the effective heat transfer area between the liquid film and the cooling surface.
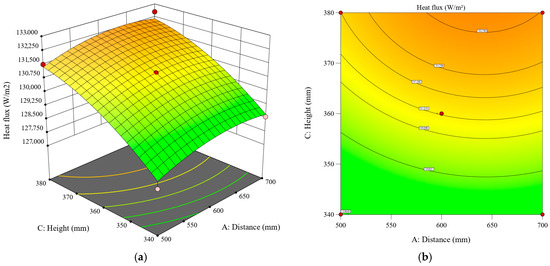
Figure 24.
Response surface of the impact of spray height and nozzle distance on the average heat flux of the heat transfer surface: (a) 3D surface; (b) contour plot.
At higher spray heights (>380 mm), heat flux increases gradually with nozzle distance, primarily due to two mechanisms. First, the expansion of the overlapping coverage area between the dual sprays directly enlarges the effective heat transfer area. Second, the enlarged overlapping coverage area enhances interactions between the liquid films, promoting local flow of the liquid films. However, when nozzle distance exceeds 650 mm, heat flux begins to decline as excessive separation substantially reduces the overlapping area. This reduction weakens the synergistic enhancement effect in the spray overlapping region, leading to reduced overall heat transfer efficiency.
According to the ANOVA results presented in Table 6, the p-value for the interaction term between nozzle distance and spray height is 0.5135, indicating that their synergistic effect on spray cooling is not significant. This observation is primarily associated with the droplet We (Weber number) during the spray cooling process. The adjustment of spray height and nozzle distance did not significantly alter the droplet We. Therefore, their interaction did not exhibit a pronounced impact on the cooling performance.
3.5.4. Synergistic Effect Between Spray Height and Spray Angle
Figure 25 illustrates the synergistic effects of spray height and spray angle on the heat flux of the cooling surface under a fixed nozzle distance of 600 mm. Heat transfer performance is significantly affected by the synergistic interaction of spray angle and spray height. Enhanced heat transfer performance is achieved when larger spray angles (>95°) are combined with higher spray heights (>370 mm). As the spray angle increases, the sensitivity of heat flux to angular variation is reduced. For instance, at a 100° spray angle, sensitivity to spray height is lowest. Conversely, the highest sensitivity to spray height is observed at 80° spray angle, where heat flux increases rapidly with increasing spray height. When spray height is maintained constant, better heat transfer performance is obtained with larger spray angles. Particularly at 340 mm spray height, a significant positive correlation is demonstrated between heat flux and spray angle.
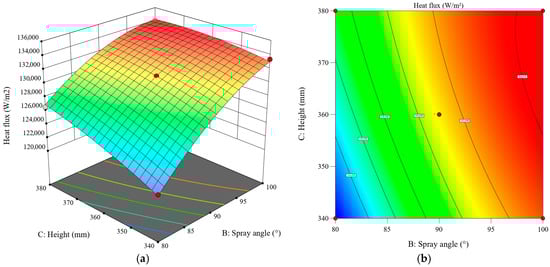
Figure 25.
Response surface of the impact of spray height and spray angle on the average heat flux of the heat transfer surface: (a) 3D surface; (b) contour plot.
Spray angle is identified as the dominant factor governing heat transfer performance through RSM. This predominance is attributed to its superior effectiveness in expanding the actual cooling surface coverage area when compared to spray height variations. Consequently, greater sensitivity to angular adjustments is demonstrated by the spray coverage area. The effective heat transfer area of the liquid film is established as the primary mechanism controlling spray cooling performance, as confirmed by these findings.
3.5.5. Multi-Objective Optimization
To obtain the optimal parameters under multiple objectives, a multi-objective optimization design was employed. The optimization objectives were set to maximize heat flux and minimize temperature, which were assigned weights of “++” and “+”, respectively.
Furthermore, the temperature uniformity index was introduced as a constraint. The benchmark for this uniformity index was defined as the upper limit of 116,033 W/m2, which corresponds to the average heat flux residual measured under the operating conditions presented in Table 2. Values below this threshold are considered to indicate good uniformity; exceeding this benchmark suggests that localized high-temperature areas may appear at the edges of the spray coverage zone.
RSM identifies the optimal heat transfer conditions for the cooling surface as: 89° spray angle, 663.5 mm nozzle distance, and 380 mm spray height. Table 8 compares these optimized results with initial conditions. Numerical simulations under the optimized conditions yielded an average surface temperature of 814.33 K, heat flux of 131,588.3 W/m2, and droplet evaporation rate of 26.91%. This configuration ensures high heat flux and uniform surface temperature while expanding the theoretical spray coverage area by 9.53%.
Table 8.
Comparison between the initial and optimized results.
3.6. Future Work
Future work will begin with pilot-scale experimental validation. A large steel plate will be used to simulate the hot surface, cooled by a twin-nozzle spray setup. The plate will first be heated to the target temperature, after which the spray system will be activated. Key parameters, including the temperature variation in the hot surface and the mass and temperature change in the collected water, will be monitored and recorded during the experiment. Finally, by analyzing data such as the hot surface temperature, water flow rate, and water temperature, the accuracy of the numerical simulation results will be verified.
4. Conclusions
In this work, the Discrete Phase Model (DPM) was employed to simulate the dual-nozzle spray cooling process on the large high-temperature outer wall of a low-carbon cement rotary cooler. The investigated spray parameters included spray angle, nozzle distance, spray height, and mass flow rate. The influence of these parameters was evaluated using Response Surface Methodology (RSM), and a multi-objective optimization design (MOD) was used for spray angle, nozzle distance, and spray height. This study provides guidance on spray cooling performance parameters for large-scale industrial rotary cooler applications. The main conclusions are summarized as follows:
- (1)
- Spray angle is identified as the most significant factor affecting spray cooling performance. The synergistic effect produced by increasing the spray angle combined with appropriate nozzle distance is demonstrated to significantly enhance cooling performance. With a 90° spray angle and 600 mm nozzle distance, the system achieved an average cooling surface temperature of 815.42 K and a heat flux of 131,037.6 W/m2.
- (2)
- The heat flux at the cooling surface exhibits an initial increase followed by a decrease with rising mass flow rate. Although higher flow rates provide some enhancement in cooling intensity, excessive liquid film thickness increases thermal resistance and suppresses bubble detachment during evaporation. At a mass flow rate of 0.2 kg/s, the evaporation rate was reduced to only 16.6%.
- (3)
- Heat flux increases with spray height, which is attributed to the expansion of the effective heat transfer area of the liquid film. However, excessively high spray heights reduce cooling surface uniformity, causing thinner liquid films and poorer performance in the peripheral spray coverage areas.
- (4)
- A predictive model correlating key spray cooling parameters with cooling performance indicators is developed, and MOD is performed with temperature uniformity as a constraint. The optimal configuration was identified as an 89° spray angle, 663.5 mm nozzle distance, and 380 mm spray height. This configuration ensured uniform temperature distribution while achieving a heat flux of 131,588.3 W/m2 and increasing the spray coverage area by 9.53%.
Author Contributions
Conceptualization, Z.C. and F.F.; methodology, F.F.; software, F.F.; validation, Y.M. and F.F.; formal analysis, Y.M. and F.F.; investigation, Z.C., Y.M. and F.F.; resources, Z.C.; data curation, F.F., Y.L. and J.L.; writing—original draft preparation, F.F.; writing—review and editing, Z.C., Y.M. and F.F.; visualization, F.F., Y.L. and J.L.; supervision, Y.M.; project administration, Z.C. and Y.M.; funding acquisition, Z.C. and Y.M. All authors have read and agreed to the published version of the manuscript.
Funding
This research received no external funding.
Data Availability Statement
Data available on request from the corresponding author.
Conflicts of Interest
The authors declare no conflicts of interest.
References
- Okoji, A.I.; Anozie, A.N.; Omoleye, J.A. Evaluating the Thermodynamic Efficiency of the Cement Grate Clinker Cooler Process Using Artificial Neural Networks and ANFIS. Ain Shams Eng. J. 2022, 13, 101704. [Google Scholar] [CrossRef]
- Silk, E.A.; Golliher, E.L.; Paneer Selvam, R. Spray Cooling Heat Transfer: Technology Overview and Assessment of Future Challenges for Micro-Gravity Application. Energy Conv. Manag. 2008, 49, 453–468. [Google Scholar] [CrossRef]
- Riaz Siddiqui, F.; Tso, C.; Qiu, H.; Chao, C.Y.H.; Fu, S. Hybrid Nanofluid Spray Cooling Performance and Its Residue Surface Effects: Toward Thermal Management of High Heat Flux Devices. Appl. Therm. Eng. 2022, 211, 118454. [Google Scholar] [CrossRef]
- Wang, C.; Wang, X.; Ding, H. Boundary Layer of Non-Equilibrium Condensing Steam Flow in a Supersonic Nozzle. Appl. Therm. Eng. 2018, 129, 389–402. [Google Scholar] [CrossRef]
- Zhang, S.; Ma, X.; Zhang, Y.; Yang, X.; Wei, J.; Li, K.; Du, W.; Zhu, Z. High-Efficiency Spray Cooling of Electronics with HFE-7100 on Finned Surfaces. Appl. Therm. Eng. 2025, 279, 127890. [Google Scholar] [CrossRef]
- Hoseinpour, M.; Jamshidi, M.; Ghasemi, F.Z.; Niazmand, H.; Passandideh-Fard, M.; Sardarabadi, M.; Behzadi Moghaddam, A. Experimental Evaluation of Surface Roughness Impact on Thermal Efficiency in Electronic Cooling Systems: A Comparative Study of Jet vs. Spray Cooling Techniques. Int. J. Therm. Sci. 2025, 213, 109795. [Google Scholar] [CrossRef]
- Qenawy, M.; Ali, M.; Chen, Y.; Zhu, Y.; Chen, S.; Tian, J.; Wang, J.; Chen, B.; Guo, H. Coaxial Airflow Modulation for Cryogen Spray Cooling: Towards Heat Transfer Enhancement and Film Control in Laser Dermatology. Int. J. Heat Mass Transf. 2025, 244, 126969. [Google Scholar] [CrossRef]
- Fukuda, H.; Kita, Y.; Ariyoshi, T.; Takata, Y.; Kohno, M. Experimental Investigation of Spray Cooling on Steel Plates with Periodic Micropillar Structures: Two-Stage Quenching Phenomenon. Appl. Therm. Eng. 2025, 275, 126870. [Google Scholar] [CrossRef]
- Cebo-Rudnicka, A.; Malinowski, Z. Identification of Heat Flux and Heat Transfer Coefficient during Water Spray Cooling of Horizontal Copper Plate. Int. J. Therm. Sci. 2019, 145, 106038. [Google Scholar] [CrossRef]
- Prabakaran, R.; Souby, M.M.; Liu, J.; Kim, S.C. Improving Fuel Cell Vehicle Efficiency: Exploring Dynamic Cooling Strategies for Stack Radiators with Intermittent Spray Cooling. eTransportation 2025, 23, 100384. [Google Scholar] [CrossRef]
- Su, C.; Wang, S.; Liu, X.; Tao, Q.; Wang, Y. Experimental and Numerical Investigation on Spray Cooling of Radiator in Fuel Cell Vehicle. Energy Rep. 2022, 8, 1283–1294. [Google Scholar] [CrossRef]
- Ma, S.; Zhang, Y.; Xu, C.; Wang, Y.; Zhou, Z.; Wang, K.; Ma, H. Experimental Study on Heat Transfer Performance of Spray Cooling on High Heat Flux Rail Surface. Therm. Sci. Eng. Prog. 2025, 62, 103685. [Google Scholar] [CrossRef]
- Kim, J. Spray Cooling Heat Transfer: The State of the Art. Int. J. Heat Fluid Flow 2007, 28, 753–767. [Google Scholar] [CrossRef]
- Liu, H.; Cai, C.; Yin, H.; Luo, J.; Jia, M.; Gao, J. Experimental Investigation on Heat Transfer of Spray Cooling with the Mixture of Ethanol and Water. Int. J. Therm. Sci. 2018, 133, 62–68. [Google Scholar] [CrossRef]
- Zhao, X.; Yin, Z.; Zhang, B.; Yang, Z. Experimental Investigation of Surface Temperature Non-Uniformity in Spray Cooling. Int. J. Heat Mass Transf. 2020, 146, 118819. [Google Scholar] [CrossRef]
- Bao, J.; Wang, Y.; Xu, X.; Niu, X.; Liu, J.; Qiu, L. Analysis on the Influences of Atomization Characteristics on Heat Transfer Characteristics of Spray Cooling. Sust. Cities Soc. 2019, 51, 101799. [Google Scholar] [CrossRef]
- Zhou, Z.; Lu, C.; Zhao, C.; Le, G. Numerical Simulations of Water Spray on Flame Deflector during the Four-Engine Rocket Launching. Adv. Space Res. 2020, 65, 1296–1305. [Google Scholar] [CrossRef]
- Zhang, Z.; Li, J.; Jiang, P.-X. Experimental Investigation of Spray Cooling on Flat and Enhanced Surfaces. Appl. Therm. Eng. 2013, 51, 102–111. [Google Scholar] [CrossRef]
- Chien, L.; Xu, J.; Yang, T.; Yan, W. Experimental Study on Water Spray Uniformity in an Evaporative Condenser of a Water Chiller. Case Stud. Therm. Eng. 2019, 15, 100512. [Google Scholar] [CrossRef]
- Khangembam, C.; Singh, D.; Handique, J.; Singh, K. Experimental and Numerical Study of Air-Water Mist Jet Impingement Cooling on a Cylinder. Int. J. Heat Mass Transf. 2020, 150, 119368. [Google Scholar] [CrossRef]
- Yang, W.; Sang, X.; Chen, B.; Li, D. Numerical Investigations of the Cooling Performance of an R410A Closed-Loop Spray Cooling System. Energies 2024, 17, 339. [Google Scholar] [CrossRef]
- Zhang, R.; Li, Z.; Kang, J.; Chen, D.; Yuan, G.; Duan, F. Simulation on the Spray Cooling of a High-Temperature Cylindrical Surface. Int. J. Heat Mass Transf. 2024, 224, 125334. [Google Scholar] [CrossRef]
- Bandaru, S.V.R.; Villanueva, W.; Konovalenko, A.; Komlev, A.; Thakre, S.; Sköld, P.; Bechta, S. Upward-Facing Multi-Nozzle Spray Cooling Experiments for External Cooling of Reactor Pressure Vessels. Int. J. Heat Mass Transf. 2020, 163, 120516. [Google Scholar] [CrossRef]
- Xie, J.L.; Tan, Y.B.; Wong, T.N.; Duan, F.; Toh, K.C.; Choo, K.F.; Chan, P.K.; Chua, Y.S. Multi-Nozzle Array Spray Cooling for Large Area High Power Devices in a Closed Loop System. Int. J. Heat Mass Transf. 2014, 78, 1177–1186. [Google Scholar] [CrossRef]
- Althoey, F.; Ansari, W.S.; Sufian, M.; Deifalla, A.F. Advancements in Low-Carbon Concrete as a Construction Material for the Sustainable Built Environment. Dev. Built Environ. 2023, 16, 100284. [Google Scholar] [CrossRef]
- Xie, Q.; Chen, Z.; Hou, Q.; Yu, A.B.; Yang, R. DEM Investigation of Heat Transfer in a Drum Mixer with Lifters. Powder Technol. 2017, 314, 175–181. [Google Scholar] [CrossRef]
- Tong, C.; Chen, Z.; Chen, X.; Xie, Q. Research and Development of an Industrial Denitration-Used Burner with Multiple Ejectors via Computational Fluid Dynamics Analysis. Mathematics 2023, 11, 3476. [Google Scholar] [CrossRef]
- Yu, S.; Zhou, N.; Tang, G.; Shen, H.; Zhu, H.; Li, J.; Chu, Y.; Li, X.; Ma, J.; Wang, Q. Numerical Simulation Study on Factors Influencing the Heat Transfer Performance of Spray Cooling. Therm. Sci. Eng. Prog. 2025, 64, 103834. [Google Scholar] [CrossRef]
- Liu, H.; Chen, H.; Cai, C.; Jia, M.; Yin, H. Numerical Investigation on the Unsteady Spray Cooling of High Temperature Steel Plate. Int. J. Heat Mass Transf. 2019, 143, 118342. [Google Scholar] [CrossRef]
- Chen, Z.; Xie, Q.; Chen, G.; Yu, Y.; Zhao, Z. Numerical Simulation of Single-Nozzle Large Scale Spray Cooling on Drum Wall. Therm. Sci. 2018, 22, 359–370. [Google Scholar] [CrossRef]
- Zhang, W.; Liu, C.; Yang, T.; Wang, Z. Numerical Investigation on Heat Transfer Enhancement of Spray Cooling by Surface Structure Optimization. Int. J. Heat Mass Transf. 2024, 223, 125220. [Google Scholar] [CrossRef]
- Portela, J.R.D.; Danguillecourt, O.L.; Oliva, V.I.M.; Torres Moreno, E.; Aguilar Jimenez, C.; Hechavarría Difur, L.; Hernandez-Escobedo, Q.; Franco, J.A. The Effect of Airfoil Geometry Variation on the Efficiency of a Small Wind Turbine. Technologies 2025, 13, 328. [Google Scholar] [CrossRef]
- Toh, K.; Liang, Y.; Lau, W.; Fimbres Weihs, G. A Review of CFD Modelling and Performance Metrics for Osmotic Membrane Processes. Membranes 2020, 10, 285. [Google Scholar] [CrossRef] [PubMed]
- Šabacká, P.; Maxa, J.; Bayer, R.; Binar, T.; Bača, P.; Švecová, J.; Talár, J.; Vlkovský, M. An Experimental and Numerical Analysis of the Influence of Surface Roughness on Supersonic Flow in a Nozzle Under Atmospheric and Low-Pressure Conditions. Technologies 2025, 13, 160. [Google Scholar] [CrossRef]
- Wan, H.; Liu, P.; He, G.; Xue, Z.; Qin, F.; Li, W. Experimental and Numerical Studies on the Spray Cooling of Deionized Water in Non-Boiling Regime. Case Stud. Therm. Eng. 2023, 44, 102834. [Google Scholar] [CrossRef]
- Zeinali Heris, S.; Bagheri Khaniani, P.; Mousavi, S.B. Photocatalytic Degradation of Co-Amoxiclav Using Hybrid TiO2/ZnO Nanoparticles: Experimental and Optimization. J. Water Process Eng. 2025, 70, 107040. [Google Scholar] [CrossRef]
- Gholami, A.; Mousavi, S.B.; Heris, S.Z.; Mohammadpourfard, M. Highly Efficient Treatment of Petrochemical Spent Caustic Effluent via Electro-Fenton Process for COD and TOC Removal: Optimization and Experimental. Biomass Convers. Biorefinery 2024, 14, 17481–17497. [Google Scholar] [CrossRef]


Disclaimer/Publisher’s Note: The statements, opinions and data contained in all publications are solely those of the individual author(s) and contributor(s) and not of MDPI and/or the editor(s). MDPI and/or the editor(s) disclaim responsibility for any injury to people or property resulting from any ideas, methods, instructions or products referred to in the content. |
© 2025 by the authors. Licensee MDPI, Basel, Switzerland. This article is an open access article distributed under the terms and conditions of the Creative Commons Attribution (CC BY) license (https://creativecommons.org/licenses/by/4.0/).