Abstract
As a key node of the energy internet, the park-level integrated energy system undertakes the dual functions of improving energy supply reliability and promoting low-carbon development in the transformation of the global energy structure. The need to simultaneously meet terminal energy demand and market regulation requirements constrains operational optimization due to factors such as energy price fluctuations. Future research should focus on supply–demand coordination mechanisms and energy efficiency improvement strategies to advance the high-quality development of such systems. To this end, this study constructs a collaborative optimization framework integrating demand response based on a dual-compensation mechanism and dynamic multi-energy pricing and incorporates it into a Stackelberg game-based low-carbon economic dispatch model. By incorporating a dynamic multi-energy pricing mechanism, the model coordinates and optimizes the interests of the upper-level park integrated energy system operator (PIESO) and the lower-level park users. On the supply side, the model couples a two-stage power-to-gas (P2G) device with a stepwise carbon trading mechanism, forming a low-carbon dispatch system enabling source–grid–load coordination. On the demand side, an integrated demand response mechanism with dual compensation is introduced to enhance the coupling intensity of multi-energy flows and the adjustability of price elasticity. The simulation results show that, compared with traditional models, the proposed optimization framework achieves improvements in three dimensions: carbon emissions, economic benefits, and user costs. Specifically, the carbon emission intensity is reduced by 28.04%, the operating income of the PIESO is increased by 29.53%, and the users’ energy consumption cost is decreased by 13.05%, which verifies the effectiveness and superiority of the proposed model.
1. Introduction
According to in-depth research on integrated energy systems (IESs), the internal subject optimization and external energy interaction elements of the system have become increasingly complex [1]. This poses new challenges to the development of the system in the context of energy marketization [2]. Due to its ability to analyze the strategic interactions and balance the interests of multiple subjects, game theory has been deeply integrated into collaborative decision-making frameworks for IESs. Currently, the international academic community continues to expand its application research, focusing on the design of market transaction mechanisms and the construction of dynamic game scenarios involving multiple subjects, and has achieved initial results. However, with the further development of integrated energy systems, the impact of traditional carbon trading mechanisms and demand response on the low-carbon optimization of system operations has gradually diminished. Therefore, there is an urgent need to introduce a tiered carbon trading mechanism and a comprehensive demand response mechanism under dual incentives. These new mechanisms can more flexibly address system carbon emission issues, helping to further develop integrated energy systems in low-carbon, high-efficiency, and intelligent directions.
The development of IESs often promotes the formation of a multi-energy complementary subsystem structure within a region [3,4]. A peer-to-peer (P2P) direct transaction mechanism is adopted between subsystems, which significantly enhances the adjustability of user-side resources, promotes the local consumption of renewable energy, and reduces the overall operating cost of the system [5]. Reference [6] proposed a P2P energy transaction framework for community microgrids based on a continuous double auction and multi-stage bidding mechanism. While protecting the privacy of prosumers, it optimizes economic benefits and realizes decentralized and efficient energy allocation through differentiated modeling and dynamic bidding strategies. When multiple subjects participate in joint optimization, conflicts of interest among sub-members become more prominent due to the potential differences in their objectives, and privacy protection also requires special attention in multi-subject joint optimization [7]. Reference [8] established a Stackelberg game architecture where the multi-microgrid system serves as the decision-maker and the load aggregator acts as the responder. Reference [9] proposed a new park-level P2P electricity–carbon sharing business model and constructed a utility model for park operators and users considering carbon trading. Reference [10] put forward a distributed energy transaction framework for multi-microgrids based on a Stackelberg game and established a local market energy transaction model, which aims to promote the balance between supply and demand among multiple microgrid systems. In terms of game model solving, traditional Karush–Kuhn–Tucker (KKT) optimization conditions cannot effectively handle discrete decision variables, while heuristic algorithms, although offering greater flexibility in modeling, face the challenge of high computational complexity [11]. This has prompted researchers to explore optimization algorithms that can handle mixed-integer variables while achieving high solution efficiency. Research on collaborative operation mechanisms presents a diversified development trend.
In the operational optimization of IESs, considering the carbon trading mechanism is a key measure to effectively control carbon emissions and improve the economic operation benefits of the system. By introducing a trading mechanism for carbon emission allowances, the carbon emission allowances of power generation entities on the energy supply side can be allocated, thereby optimizing energy production and consumption while controlling carbon emissions. Reference [12] introduced a carbon trading mechanism and constructed an IES operational optimization model based on carbon trading by calculating the quantitative carbon trading cost converted from carbon emissions. With the development of the carbon trading market, the cost no longer solely relies on the traditional fixed-coefficient calculation; therefore, improved carbon trading mechanisms can more effectively incentivize enterprises to reduce carbon emissions by introducing flexible market-oriented means and dynamic pricing [13,14,15]. Reference [16] proposed an optimal operation model for an electricity–gas–heat IES by considering stepwise carbon trading, which effectively improved the economy and low-carbon performance of the system. Reference [17] combined a stepwise carbon trading mechanism with demand response to construct a dispatch optimization model for IES. Reference [18] established a carbon trading volume allocation model for IES using the gray correlation method and proposed a seasonal stepwise carbon trading mechanism based on reward and punishment factors. Reference [19] designed a dynamic carbon trading reward and punishment mechanism based on the supply–demand index and proposed a new IES planning and optimization method using this mechanism.
With the annual increase in energy demand, the diversified demand responses of IESs have become a key dispatchable resource. The integrated demand response (IDR) mechanism significantly improves the flexibility of the power grid by encouraging consumers to adjust their energy usage according to market dynamics [20]. This mechanism can effectively reduce energy load during peak hours and promote energy consumption during off-peak hours, thereby optimizing the energy consumption pattern. Therefore, the IDR mechanism plays a crucial role in modern energy systems. It not only improves the stability and reliability of the energy system but also promotes the efficient utilization of green energy, providing strong support for the construction of a low-carbon and environmentally friendly energy system [21].
Reference [22] incorporated the demand response of user loads into the centralized dispatch model of an electricity–heat IES, treating demand response as an additional balancing resource. Reference [23] established a load elastic demand response mechanism combined with time-of-use electricity price information. Through optimal utilization of this mechanism, the peak–valley difference in the load can be effectively reduced, and the system’s ability to respond to load fluctuations can be improved [24]. Through this mechanism, users can adjust their energy consumption behavior according to the electricity price changes in different time periods, thereby balancing the load demand between peak and off-peak hours [25].
Given the diversity of the entities involved, a single game-theoretic relationship often struggles to accurately capture the complex interest dynamics among multiple agents. Different stakeholders possess distinct objectives, constraints, and interests, making it difficult for a single game model to fully reflect their interactions and trade-offs. Therefore, to optimize the operation of a multi-agent system more precisely, it is necessary to adopt more flexible and sophisticated game models tailored to the specific context or to combine multiple game strategies. Only in this way can conflicts of interest and opportunities for cooperation be effectively managed, thereby maximizing the overall benefits of the system. In summary, to address the difficulty in simultaneously improving the operator’s income, reducing user costs, and cutting carbon emissions in a single-park integrated energy system, this study constructs a two-layer optimization model for the system by considering IDR with dual compensation based on Stackelberg game theory. The model coordinates the interaction between park operators and users by establishing a dynamic multi-energy pricing mechanism.
- On the source side, a two-stage P2G system and a stepwise carbon trading mechanism are introduced to maximize the reduction in carbon emissions.
- On the user side, an IDR mechanism with dual compensation based on economic subsidies is implemented to effectively improve user participation.
- Simulation results indicate that the proposed method can achieve the collaborative optimization of increasing the operator’s income, reducing user costs, and cutting system carbon emissions.
The remainder of this paper is organized as follows: Section 2 presents the park energy transaction framework. Section 3 formulates the two-layer optimization model. Section 4 describes the solution methodology. Section 5 provides case studies and sensitivity analysis. Section 6 concludes the paper.
2. Park Energy Transaction Framework
Under the power market transaction framework, the PIESO and park users, as market entities with independent decision-making power, form a typical two-way interaction relationship. This interaction has the following characteristics: first, there is a temporal and spatial asynchrony in the decision-making behavior of both parties. The PIESO, as the price setter, issues energy pricing strategies, and park users then adjust their energy usage strategies based on price signals. Second, the decision-making process exhibits a two-way influence: the PIESO’s pricing strategy directly affects users’ energy consumption costs, while users’ load response, in turn, impacts the PIESO’s income level. Third, an asymmetric game relationship is formed between the two parties in the process of pursuing their respective maximum interests. These characteristics fully conform to the theoretical framework of a Stackelberg game. The specific energy transaction framework is shown in Figure 1.
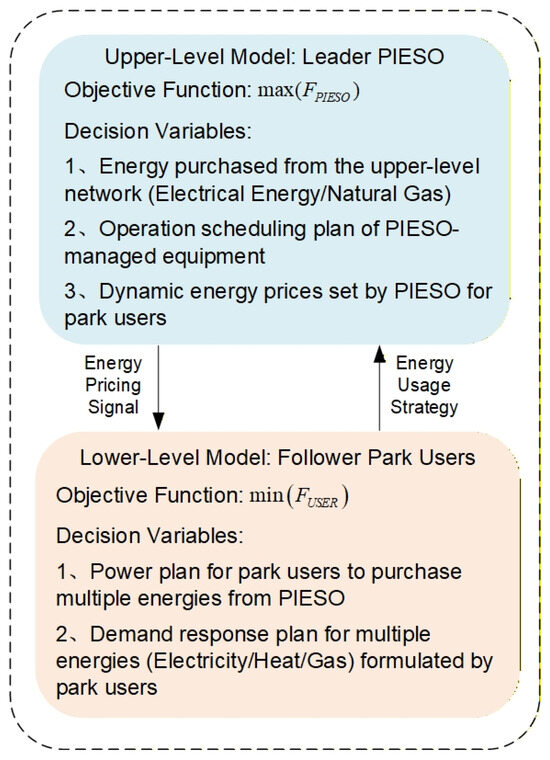
Figure 1.
Energy transaction framework of a park-level integrated energy system.
3. PIES Dual-Layer Optimization Scheduling Model Based on Master–Slave Game Theory
The game sides of the park’s integrated energy system are composed of the PIESO and the park users. The PIESO needs to purchase energy from the superior energy network and realize energy conversion and utilization through energy conversion equipment. The equipment managed by the PIESO mainly includes the equipment mentioned in Section 3, and the user load mainly includes the electrical load, thermal load, and gas load. The multi-energy flow in the park is shown in Figure 2.
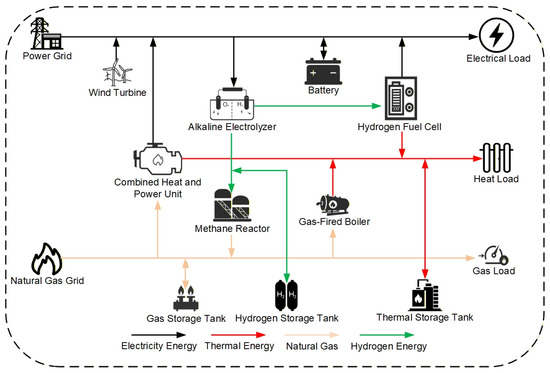
Figure 2.
Energy flow framework of the park-level integrated energy system.
3.1. Park Operator Layer
As the leader of the park’s comprehensive energy system, the PIESO maximizes revenue by optimizing energy purchase and sales strategies. Its objective function is:
where is the total income of the PIESO; is the total energy purchase cost from the superior power grid and natural gas network; is the total energy sales revenue of the PIESO from park users, that is, the energy purchase cost for park users; and is the carbon transaction cost that the PIESO needs to bear.
where is the power purchased by the PIESO from the superior power grid at time t; is the electricity sold by the PIESO to the superior power grid at time t; represents the natural gas volume purchased by the PIESO from the natural gas network; represents the power purchase price paid by the PIESO to the superior power grid; represents the price of electricity paid by the PIESO to the superior power grid; is the price at which the PIESO purchases natural gas from the natural gas network; refers to the upper limit of power purchased by the PIESO from the superior power grid; refers to the upper limit of the electricity sold by the PIESO to the superior power grid; is the electricity purchase ID, and is the electricity sales ID, both of which are 0 and 1 variables; is a large positive number, such as ; and refers to the upper limit of gas purchased by the PIESO from the natural gas network.
The total energy sales revenue of the PIESO from park users is shown as follows:
where denotes the electricity sold by the PIESO to park users; denotes the heat sold by the PIESO to park users; denotes the gas sold by the PIESO to park users; and , , and represent the electricity, heat, and gas prices, respectively, charged by the PIESO to park users.
The calculation method of carbon transaction cost is as follows:
where is the cost coefficient of the traditional carbon trading mechanism; refers to the carbon emission quota trading volume of CIES; and is the stepped carbon transaction cost. Refer to Section 3.1.1 for the detailed process.
3.1.1. Analysis of Carbon Emission Flow and Carbon Trading
Carbon emission flow is defined as a virtual network flow that depends on the active power flow of the grid. It represents the carbon emissions corresponding to the power flowing through a branch [26]. Carbon flow-related variables are introduced as constraints in the PIES optimization research, and the node carbon emission intensity and branch carbon emission intensity are the two core indicators. In the PIES, is also generated from the source side, while the ultimate driving force of carbon emissions is at the load side.
Therefore, the carbon emissions of the PIES can be derived from the energy flow by analogy with the corresponding relationship between each branch flow and carbon emissions in the power grid.
- Carbon emission flow
The carbon emission flow represents the carbon emission corresponding to the energy flow through a node or branch in a unit of time.
- Branch carbon emission intensity
The branch carbon emission intensity represents the energy-side carbon emissions caused by the unit load of branch transmission; that is, the ratio of branch carbon flow to energy flow .
- Node carbon emission intensity
Node carbon emission intensity represents the energy-side carbon emissions caused by node consumption per unit load. The node carbon emission intensity of node i is equal to the weighted average value of the branch carbon emission intensity of all branches flowing into the node relative to the energy flow, as follows:
where is the energy flow of branch j, is the carbon emission intensity of branch j, and is the set of all branches that supply power to node i and are connected to node i.
3.1.2. PIES Carbon Emission Flow Calculation
The inputs of the PIES are electricity and natural gas purchased from the distribution network and natural gas network. According to the definition of carbon emission flow, the carbon emission at the input end is calculated as:
where and are the carbon emission flows corresponding to the power and gas purchases in t period, respectively; and are the carbon emission intensities of the external network input corresponding to the power and gas purchases in t period, respectively; and and are the power and gas purchases in t period, respectively.
The energy coupling devices in the PIES can be divided into single input–single output devices (such as GB) and single input–multiple output devices (such as CHP).
The carbon emission model of GB is calculated as:
where is the amount of CO2 produced by GB at time t; and and are the carbon emission intensities at the input and output of GB at time t, respectively.
The carbon emission model of cogeneration is calculated as:
where is the amount of CO2 produced by CHP at time ; and , , and are the carbon emission intensities at the input end, power supply end, and heat supply end of cogeneration at time t, respectively.
According to the above calculation, the actual carbon emission of the system is:
where is the amount of CO2 absorbed in the process of hydrogen generation at time .
3.1.3. Ladder Carbon Trading Model
Carbon trading is a quantitative method to reduce carbon emissions, based on the principle of quotas and trading. It is assumed that the power purchased by the PIES from the external grid is thermal power. Thus, the carbon emissions considered in this paper mainly fall into three categories: power purchase, gas-fired boiler units, and cogeneration units. The baseline method is used to determine the initial carbon emission quota as follows:
where T is the total dispatching period; is the total carbon emission quota of the system; , , and are the carbon emission quotas of the power purchase, CHP, and GB, respectively; and are the carbon quota coefficients of the power and heat of the generator set, respectively; and is the conversion parameter of power and heat.
Through the carbon trading mechanism, the PIES can reduce carbon emissions by reducing the purchase or sale of carbon emission quotas, thus improving its economy. The traditional carbon trading mechanism only considers the base price of carbon trading and lacks flexibility. Therefore, this study uses the reward and punishment ladder carbon trading model. When the actual carbon emission of the PIES is lower than the initial carbon emission quota, rewards will be given; otherwise, the carbon quota must be filled. To further limit carbon emissions, the larger the total amount of carbon emissions, the higher the cost of carbon trading. The reward and punishment ladder carbon trading model is as follows:
where c is the basic price of carbon trading; and are the reward factor and penalty factor, respectively; and is the length of carbon emission interval.
Therefore, the total carbon emission cost of the system is as follows:
The numerical distribution range in Figure 3 reveals the status of the system’s carbon quota. The positive range indicates that there is a gap in the system’s carbon emission quota, and the corresponding quota must be purchased through the carbon trading market to maintain compliance operations. The negative range indicates that the system holds excess carbon emission quotas and can obtain economic benefits by selling the surplus quotas in the carbon trading market.
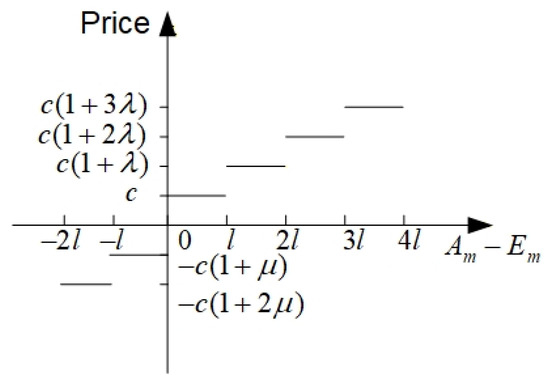
Figure 3.
The relationship between the carbon trading price and carbon emission quota.
3.2. Park User Layer Objective Function
The energy purchase cost for park users is calculated as follows:
where is the power purchased by park users from the PIESO; is the quantity of heat purchased by park users from the PIESO; , , and are the purchase price, heat purchase price, and gas purchase price from the PIESO by park users, respectively; and is the gas volume purchased by park users from the PIESO.
Refer to Section 3.2.1 for details of the compensation for the demand response of park users.
3.2.1. User-Integrated Demand Response Model
In this paper, an incentive electricity–heat–gas comprehensive demand response mechanism is constructed to enhance the willingness of the park to participate in the demand response through the combination of economic incentives and optimal scheduling. The mechanism aims to stimulate the enthusiasm of park users through economic subsidies and to urge them to adjust the power, heat, and gas loads during the peak period of power demand. This optimizes the load distribution of the system, relieves energy pressure, and improves the reliability and efficiency of energy supply.
The power, heat, and gas loads in the demand response can be divided into two categories: one is the transferable load, which can be flexibly transferred in a specific period of time; these loads can be adjusted or transferred to other time periods according to the demand change of the power grid. The other is the reducible load, which is the amount of usage that can be reduced during the demand response period—usually a part of the load that can be reduced promptly without affecting the normal operation of the park. To optimize the dispatch of these loads, we propose a specific mathematical model that aims to quantify the adjustment and reduction effects of various loads and supports the park in participating in demand response activities.
The specific mathematical model is as follows:
where , , and are the electricity, heat, and gas loads after the user demand response (i.e., the energy purchased by users in the park), respectively; , , and are the electricity, heat, and gas loads of the park before the user demand response; , , and respectively represent the electrical, thermal, and gas loads that can be reduced; , , and respectively represent the transferable electrical, thermal, and gas loads; , , and respectively represent the maximum values of the electricity, heat, and gas loads that can be reduced; , , and respectively represent the maximum transferable electrical, thermal, and gas loads; and , , and respectively represent the maximum values of power, heat, and gas purchases by users in the park.
The optimization of energy use strategy not only affects the operating output of the PIES equipment but also directly affects the carbon emission level of the system. Based on the coupling mechanism of electricity, heat, gas, and carbon dioxide, this study introduces the carbon quota compensation mechanism into the demand response scheme. Specifically, based on the transferable and reducible compensation mechanism of the conventional electricity, heat, and gas loads, the dynamic conversion model between load reduction and carbon quota is established to expand the demand-side response energy compensation to the carbon quota compensation based on the benchmark carbon price conversion, thus building a dual-incentive system for energy and carbon emissions [27]. Since the carbon emissions considered in this paper mainly come from three categories—power purchase, gas-fired boiler units, and cogeneration units—only carbon quota compensation for the reduced power and heat loads is considered.
where is the compensation income considering the energy price; is the compensation income of the carbon quota; , , and are the energy compensation coefficients that can reduce the electricity, heat, and gas loads, respectively; , , and are the energy compensation coefficients of transferable electric, thermal, and gas loads, respectively; c is the benchmark carbon price; and and are the quota coefficients of electric and thermal carbon, respectively.
3.2.2. Energy Pricing Constraints and Power Balance Constraints
The time-sharing energy pricing mechanism implemented by park operators has a direct impact on their operating income and the energy consumption behavior of users. Under market-oriented constraints, the comprehensive energy price set by the operator shall meet the following constraints:
where , , and are the maximum values of the average electricity, heat, and gas prices, respectively, in the whole dispatching cycle; and and are the upper and lower limits, respectively, of the dynamic electricity price.
See Section 3.2 for equipment operation constraints in the park. It should be noted that this study does not currently incorporate the current output limitations of the inverter [28], focusing solely on the power balance constraints for electricity, heat, gas, and hydrogen.
3.3. Explanation of the Master–Slave Game Model Based on a Single Park
This section introduces the single-park integrated energy system model based on the master–slave game in detail and explains the process of proving the existence of equilibrium in the master–slave game.
3.3.1. Master–Slave Game Model Based on a Single Park
The game process is composed of the PIESO and the park users, in which the PIESO is the upper leader and the park users are the lower followers. Its internal links are mainly reflected in the energy price information released by the PIESO to users and the optimization results within the park. The PIESO, as a leader, first formulates electricity purchase and sale prices according to market conditions, energy demand, and carbon emission targets and transmits this price information to lower-level park users. Users in the park respond to the demand according to the energy price information provided by the PIESO and then provide feedback on the adjusted energy demand to the PIESO, forming a two-way interaction. This game interaction process constitutes a master–slave game framework. This master–slave game model can be expressed as:
where is the energy demand strategy of park users and refers to the energy price strategy formulated by the PIESO for the energy demand of users in the park.
During the game between the PIESO and park users, when neither the leader nor the follower can obtain greater benefits by changing their own strategies, the game has reached an equilibrium, which is specifically expressed as:
3.3.2. Proof of Game Equilibrium Solution
Before obtaining the equilibrium solution, it is necessary to prove the existence and uniqueness of the equilibrium solution through the following three theorems.
1. Proof of the existence of equilibrium solutions
- The objective function of park operators is a non-empty, continuous function of their policy set.The objective function of the park operator is Equation (1), and the strategy set is its set of energy prices , , and .The objective function must also satisfy Equation (3), so the game strategy set is non-empty and continuous.
- The objective function of park users is a non-empty, continuous function of their policy set.The objective function of the park users is Equation (20), and the strategy set is the energy demand , , and of the users. The objective function must also satisfy Equations (21) and (26), so the game strategy set is non-empty and continuous.
- Park operators propose convex game strategy sets.The second-order partial derivatives of the game strategy sets , , and are calculated for the objective function Equation (1) of the park operator.
Because the second-order partial derivative is 0, the objective function Equation (1) is a linear function of the game strategy set , , and of the park operator; therefore, the objective function is quasi-convex for the game strategy set.
2. Proof of the unique equilibrium solution
- When the follower’s strategy is given, there exists a unique optimal solution for the leader’s utility function.Based on Equations (39)–(41), the objective function Equation (1) is a linear function of the game strategy set , , and ; therefore, there exists a unique optimal solution corresponding to it.
- When a leader’s strategy is given, there exists a unique optimal solution for the utility function of followers.The second-order partial derivatives of the game strategy sets , , and are calculated for the objective function Equation (20) of the park users.
Because the second-order partial derivative is 0, the objective function Equation (20) is a linear function of its game strategy set , , and ; therefore, there exists a unique optimal solution corresponding to it.
4. Game-Solving Method
Two-level linear programming problems often manifest as nonlinear optimization challenges due to hierarchical decision coupling, presenting inherent solution difficulties. The lower-level model typically exhibits continuity, nonlinearity, and differentiability, providing a theoretical foundation for finding extremes via KKT conditions and thereby solving the lower-level model. Considering that the bilinear terms in the objective function exacerbate the problem’s nonlinearity, this study employs the McCormick method. By introducing auxiliary variables and additional constraints, the nonlinear problem is transformed into a solvable linear programming problem [26]. Combining this method with KKT conditions has been validated as effective for similar optimization problems, ensuring the rigor and feasibility of the solution. The flowchart of the proposed optimization scheduling method based on the Stackelberg game is shown in Figure 4.
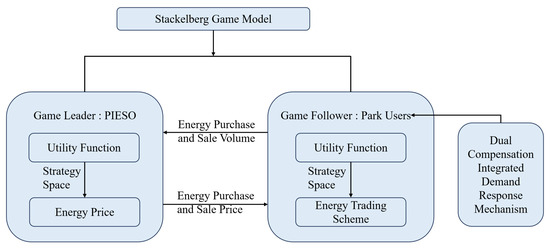
Figure 4.
Flowchart of integrated energy systems based on the master–slave game theory.
4.1. The Derivation Process of McCormick’s Method for Handling Bilinear Terms
In the double-layer model, multiple bilinear terms such as , , and are present, which are the key factors causing the problem’s nonlinearity. The McCormick relaxation method employs the “enveloping nonlinear functions with linear inequalities” approach to transform bilinear terms into linear constraints. The specific steps are elaborated in conjunction with the model presented in this paper.
4.1.1. General Linearization Procedure for Bilinear Terms
For any bilinear term, the core of McCormick relaxation involves achieving linear approximation through variable bounds and auxiliary constraints:
Step 1. Determine variable bounds: First, specify the feasible region boundaries for O and P.
In the formula, and , and and are the upper and lower limits of O and P, respectively.
Step 2. Introduce auxiliary variables: Let Q denote the substitute auxiliary variable for O·P.
Step 3. Construct the linear envelope constraints: By combining the upper and lower bounds of O and P, four linear inequalities are constructed:
The linear inequality represented by Equation (47) forms a polyhedron that “envelops” the original nonlinear function, so the original bivariate product term can be solved through this set of envelope lines.
4.1.2. Specific Treatment of Bilinear Terms in This Model
According to the above steps of the McCormick relaxation method, the detailed processing of the , , and bilinear terms is as follows. Adding the following constraints (48)–(50) to , , and , we obtain:
4.2. Deduction of KKT Condition and Complementary Relaxation Condition
After completing the linearization of the bilinear terms, the “lower-level optimization model” must be transformed into the “constraints for the upper-level model.” This transformation is achieved using the KKT conditions, with the specific steps outlined below.
4.2.1. Objective Function and Constraints of the Lower-Level Model
We define the lower-level objective function and its corresponding constraints as shown below:
To simplify the expression, let , , and , such that Equation (51) simplifies to
Lower-level constraints include variable upper and lower bounds and equilibrium constraints, specifically:
4.2.2. Construction of the Lagrange Function
Based on the KKT conditions, the Lagrange function for the lower-level model must be constructed. For the objective function in Equation (52) and the constraint in Equation (53), the Lagrange function is
4.2.3. KKT Conditions and Complementary Relaxation Conditions
According to the requirements of the KKT conditions, the derivative of the lower-level model must be zero at the extremum point. By taking the derivative of the augmented Lagrangian function mentioned above, the KKT constraint conditions are obtained as follows:
Furthermore, complementary relaxation constraints are obtained, as shown in the following
equation:
Therefore, we use the KKT condition to construct an augmented Lagrangian function for the lower-level park user model. By taking its first-order partial derivative, the lower-level model can be transformed into the constraint conditions of the upper-level model. Transforming the original two-layer optimization problem into a balanced constraint, linear single-layer optimization problem greatly simplifies the optimization process and improves solving efficiency.
5. Case Analysis
For the calculation examples adopted in this paper, the prices of various energy sources are shown in Table 1, the parameters of the equipment are presented in Table 2, and the predicted values of wind power and users’ electricity, heat, and gas loads are shown in Figure 5. and are sourced from official data, namely, the State Grid Corporation of China (SGCC)’s carbon emission statistics and national carbon trading market disclosures.

Table 1.
Prices of various energy sources.
Table 2.
Various park parameters.
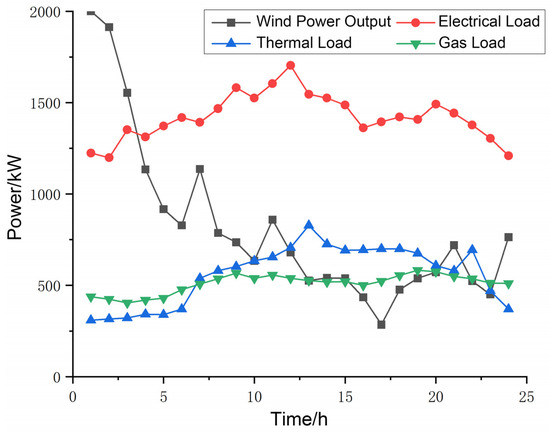
Figure 5.
Predicted values of wind power and users’ electricity, heat, and gas loads.
5.1. Comparative Analysis of Different Solutions
To demonstrate the economic efficiency and low-carbon performance of the multi-agent Stackelberg game optimal scheduling that incorporates integrated demand response and a stepwise carbon trading mechanism, this section describes the following scenarios for comparison:
Scenario 1: Considers dynamic pricing of multiple energy sources and the traditional carbon trading mechanism but excludes demand response.
Scenario 2: Considers dynamic pricing of multiple energy sources and the tiered carbon trading mechanism but excludes demand response.
Scenario 3: Considers dynamic pricing of multiple energy sources, the stepwise carbon trading mechanism, and the demand response mechanism for flexible curtailment loads.
Scenario 4: Considers dynamic pricing of multiple energy sources, the stepwise carbon trading mechanism, and the dual-compensation demand response mechanism.
The operational results under the different scenarios are shown in Table 3.
Table 3.
Operational results under the different scenarios.
Based on the results in Table 3, the Stackelberg game model proposed in this section, which incorporates tiered carbon trading and dual-compensation demand response, can increase the PIESO revenue, reduce users’ costs, and lower both carbon emissions and carbon trading costs.
Compared with Scenario 1, Scenario 2 adopts the stepwise carbon trading mechanism. Compared with the traditional carbon trading mechanism, the stepwise carbon trading mechanism helps the system reduce carbon trading costs, thereby increasing the PIESO revenue and ensuring the system’s low-carbon and economic performance.
Compared with Scenario 2, Scenario 3 includes flexible curtailment loads. After introducing the demand response mechanism, the park users’ energy purchase cost, system carbon emissions, and carbon trading cost all decrease, further improving the system’s economic and low-carbon efficiency.
Compared with Scenario 3, Scenario 4 adopts the dual-compensation demand response. Compared with the scenario that only considers flexible curtailment loads, Scenario 4 achieves the following: the PIESO revenue increases by CNY 1645.16, carbon emissions decrease by 3216.85 kg, carbon trading cost reduces by CNY 1608.42, and users’ energy purchase cost drops by CNY 3388.68. This indicates that integrating the dual-compensation demand response with the stepwise carbon trading mechanism is beneficial for enhancing the system’s low-carbon and economic operation.
Based on the above analysis, the method proposed in this section provides good economic and low-carbon benefits to the park and promotes the park’s economic and green development.
5.2. Analysis of Electricity Price Optimization Results
- Comparative Analysis of Dynamic Pricing Between Scenario 3 and Scenario 4
As shown in the simulation results of Figure 6, the introduction of a dual-compensation, integrated demand response mechanism has fostered stronger synergies between energy price regulation and user load response. Compared to Scenario 3, which only considers load-reduction demand response, Scenario 4 exhibits more pronounced time-of-day differentiation in dynamic energy pricing: during peak load periods, operators moderately increase electricity, heating, and gas prices to curb excessive demand; during off-peak periods, prices are lowered and combined with compensation incentives to guide users in proactively shifting loads. The resulting price signals better align with system operational states, making control strategies more targeted and effective.
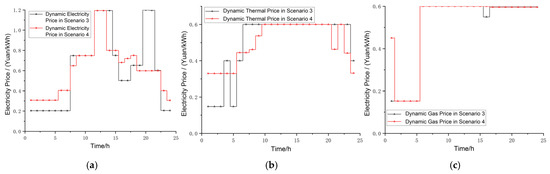
Figure 6.
Comparison of dynamic pricing across different scenarios. (a) Comparison of dynamic electricity prices. (b) Dynamic heat price comparison. (c) Dynamic gas price comparison.
Under the dual-compensation mechanism, user enthusiasm for demand response has significantly increased. Beyond conventional electricity, heat, and gas compensation, carbon quota compensation strengthens users’ willingness to reduce loads during high-carbon emission periods, enhancing peak shaving and load shifting. Compared to Scenario 3, Scenario 4 shows a more pronounced decline in user loads during high-price periods and a further upward shift during low-price periods. The overall load curve becomes smoother, with energy usage behavior better aligned with the system’s low-carbon and economic objectives.
From a system operation perspective, dynamic energy pricing and user response form a continuous two-way feedback loop: operators adjust energy prices based on actual system conditions, users modify load demand in response to price and compensation signals, load changes subsequently impact system energy distribution and operating costs, and the updated system state drives further price strategy adjustments by operators. This iterative process gradually converges the system toward a stable Stackelberg equilibrium, achieving a coordinated alignment of interests across supply and demand sides.
Overall, the introduction of dual-compensation demand response not only optimizes load distribution and reduces peak-hour purchased energy requirements but also alleviates operational pressure on CHP and GB equipment during high-load periods. This enhances overall system energy efficiency and promotes low-carbon operation. Simultaneously, it further lowers users’ energy procurement costs while ensuring operator profitability, achieving concurrent improvements in economic viability and environmental benefits. The results demonstrate that integrated demand response based on the dual-compensation mechanism significantly enhances the dynamic regulation capabilities of multi-energy systems, providing practical strategy references for optimizing the operation of integrated energy systems in industrial parks.
- Analysis of Dynamic Pricing
To further elucidate the impact of dynamic energy pricing on system operational characteristics, this section presents Scenario 4 as a representative case and analyzes it in conjunction with the optimized results for the electricity, heat, and gas prices presented in Figure 7. Scenario 4 incorporates a dual-compensation demand response mechanism on top of dynamic pricing, thereby highlighting the interplay between energy prices and user behavior and enabling a more accurate depiction of the model’s operational mechanisms.
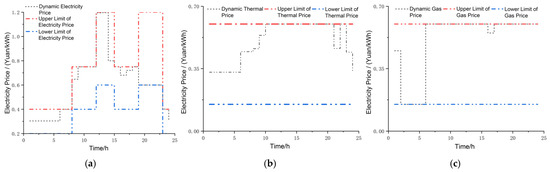
Figure 7.
Dynamic electricity/heat/gas prices formulated by the PIESO. (a) Electricity. (b) Heat. (c) Gas.
As shown in Figure 7a, during periods of high power demand, the operator primarily adjusts prices based on the benchmark rates from the external grid, limiting its pricing flexibility. However, during periods of low demand, the operator can moderately reduce electricity sales prices to encourage users to increase consumption during off-peak hours. This strategy mitigates system load fluctuations and improves the temporal distribution of electricity supply. This differentiated pricing not only heightens demand-side sensitivity to price signals but also enables operators to optimize revenue while meeting user needs. More significantly, load shifting achieved through price adjustments reduces reliance on external power purchases during peak hours, leading to more pronounced improvements in the system’s carbon emissions performance.
As shown in Figure 7b, the pattern of thermal price fluctuations indicates that thermal load variations significantly influence operators’ pricing strategies. During periods of high thermal load, elevated thermal prices help curb unnecessary heat consumption, preventing CHP and GB units from operating in high-load ranges and thereby enhancing overall system energy efficiency. During periods of low thermal load, moderately lowering heat prices increases user utilization of available thermal energy, mitigates energy losses from equipment start–stop cycles, and improves the smoothness of multi-energy flow coordination. Dynamic heat price adjustments further enhance demand response effectiveness, creating a complementary coupling between user thermal behavior changes and adjustments in electricity and gas prices.
As shown in Figure 7c, gas price variations also exhibit highly consistent responsiveness to load conditions. During peak load periods, rising gas prices effectively curb natural gas consumption, mitigating additional carbon emission pressures from CHP systems operating at high loads. Conversely, lower gas prices during off-peak periods encourage increased gas usage, thereby effectively distributing thermal and electrical supply pressures within the multi-energy coupling system. This approach not only optimizes energy flow distribution across different time periods but also enables operators to achieve a better balance between gas procurement and energy conversion efficiency.
Overall, the dynamic multi-energy pricing mechanism based on Scenario 4 reflects the load conditions and operating costs of different energy sources, allowing both supply and demand sides to adjust in tandem, driven by price signals. Operators gain enhanced operational flexibility through the adjustment space created by price differentials, while users proactively participate in load regulation incentivized by compensation mechanisms. This ultimately achieves reduced energy costs and smoother load profiles. The mechanism demonstrates significant advantages in economic efficiency, low-carbon performance, and system stability, showcasing the positive interactions and sustainable operational capabilities of multi-energy coupling systems within a dynamic pricing framework.
5.3. Analysis of Demand Response Results
Under the dual-compensation integrated demand response mechanism, the changes in electricity, heat, and gas loads before and after response are shown in Figure 8. It can be observed that, driven by compensation incentives, the user side exhibits more proactive peak shaving and shifting behaviors, significantly altering the temporal distribution of multi-energy loads. High loads originally concentrated during peak periods are partially reduced or shifted to off-peak periods with lower prices and reduced demand. This process lowers the peak values and raises the trough values of the load curve, resulting in a smoother overall trend. This load redistribution not only improves the energy usage structure but also significantly reduces the system’s energy supply pressure during peak periods.
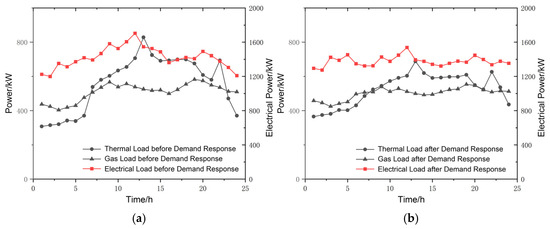
Figure 8.
Load curves before and after demand response. (a) Before. (b) After.
Within the multi-energy coupling framework, synergistic interactions exist between electricity, heat, and gas loads. Adjusting one load category often simultaneously improves the utilization status of other energy sources. Demand response encourages users to reduce electricity consumption during peak periods, thereby lowering purchased electricity requirements and alleviating operational pressure on CHP units during high-load intervals. This approach reduces natural gas consumption and associated carbon emissions. Peak reductions in thermal and gas loads further decrease the frequency of energy conversion equipment operating at full or overloaded capacity. This balances the system’s energy flow and prevents transient stresses caused by cascading load superposition. The synergistic peak-shaving effect across multiple energy loads significantly enhances the system’s overall operational safety margin and energy efficiency.
The dual-compensation mechanism plays a particularly critical role in demand response. Economic compensation provides users with direct benefits for reducing electricity, heat, and gas loads, enhancing participation willingness. Carbon quota compensation further amplifies user motivation to proactively respond to price signals during high-carbon emission periods. This combined effect of energy compensation and carbon compensation ensures that users’ load adjustments are driven not only by economic factors but also align with the system’s low-carbon operation objectives. The load curve following demand response more closely aligns with the system’s low-carbon dispatch requirements, providing more stable external conditions for operators to achieve multi-energy coordination optimization through dynamic energy pricing.
Overall, the dual-compensation integrated demand response mechanism effectively achieves peak shaving and valley filling, alleviates operational pressure on the energy supply side, improves system energy efficiency, and reduces energy consumption during high-carbon emission periods through load timing restructuring. This mechanism demonstrates significant advantages in economic viability, reliability, and low-carbon performance, providing a clear pathway and practical value for the coordinated optimization of integrated energy systems in industrial parks.
5.4. Sensitivity Analysis
To thoroughly investigate the impact of external input parameters on system operation sensitivity, we selected the electricity price parameter—which exerts the most significant influence on the system—for sensitivity analysis. This approach provides an intuitive and representative exploration of the patterns of impact that electricity price fluctuations exert on the system. The results are shown in Figure 9.
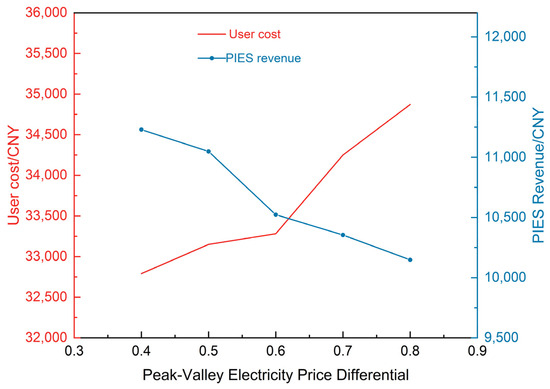
Figure 9.
Sensitivity of electricity prices to user costs and PIES revenue.
As shown in Figure 9, as the peak–off-peak electricity price increases from 0.4 CNY/kWh to 0.8 CNY/kWh, the PIESO’s revenue exhibits a gradual decline. This occurs because the PIESO’s revenue primarily stems from users’ energy purchases: the more energy users buy and the higher the energy price, the greater the PIESO’s revenue becomes. Therefore, when the peak–off-peak price differential increases, users can shift electricity loads to off-peak hours through demand response. Purchasing electricity at off-peak rates reduces procurement costs. Users can also cut electricity loads during peak-rate periods to lower their electricity expenses.
6. Conclusions and Future Prospects
6.1. Conclusions
This study constructed a bilevel optimization framework based on Stackelberg game theory, which includes two main entities: the PIESO and the users. Through iterative game optimization, the two parties achieve profit growth for the operating entity and a reduction in users’ energy procurement costs while ensuring system economy, ultimately reaching an optimal equilibrium of interest coordination.
1. This framework significantly reduces carbon emissions and effectively improves the economy of the PIES by jointly optimizing dynamic supply–demand multi-energy pricing, a tiered carbon trading mechanism, and demand response. The simulation results indicate that compared with traditional models, the proposed optimization framework demonstrates improvements across all three dimensions: carbon emissions, economic benefits, and user costs. Specifically, the carbon emission intensity is reduced by 28.04%, the PIESO operating revenue is increased by 29.53%, and the users’ energy consumption cost is decreased by 13.05%. These results verify the effectiveness and superiority of the proposed model.
2. This study considered a dual-incentive integrated demand response mechanism and reduced the peak–valley difference in loads during periods of high multi-energy load demand by curbing and shifting electrical loads, thermal loads, and natural gas loads. In this way, the load fluctuation of the system becomes more stable, avoiding overload during peak periods, thereby achieving a more stable energy supply and optimized operational efficiency.
3. After balancing the interests of the PIESO and the users, the dynamic supply–demand multi-energy pricing mechanism tends to increase the PIESO’s revenue while reducing the users’ energy procurement costs. This balancing mechanism helps to achieve a mutually beneficial situation between the PIESO and park users, enhancing the economy and sustainable development of the system.
6.2. Prospects
While this study contributes to the optimal low-carbon dispatch of park-level integrated energy systems based on game theory, several limitations warranting further investigation and refinement remain due to the authors’ capacity and time constraints, as follows:
1. Balancing Model Complexity and Practical Applicability: Future research can explore more efficient and stable distributed algorithms or artificial intelligence-assisted optimization methods to enhance the model’s applicability and real-time performance in large-scale, high-dimensional practical scenarios.
2. Refined Characterization of Uncertainties: Future work can introduce more advanced methods, such as robust optimization, distributionally robust optimization, or deep reinforcement learning, to strengthen the adaptability and resilience of dispatch strategies when confronting multiple uncertain factors.
3. Multi-Timescale Coordination and Dynamic Coupling of Multi-Energy Flows: The dispatch model in this study focuses on the day-ahead economic dispatch timescale. Future research can further investigate intraday rolling optimization, real-time balancing, and multi-timescale coordination mechanisms. Additionally, a more detailed characterization of the dynamic characteristics and spatiotemporal coupling relationships of electricity, heat, gas, and other energy flows during transmission, conversion, and storage processes is needed.
Author Contributions
Conceptualization, F.Z. and Z.Z.; Methodology, F.Z. and Z.Z.; Software, F.Z.; Validation, F.Z.; Formal analysis, F.Z.; Investigation, J.Y.; Resources, J.Y.; Data curation, J.Y.; Writing—original draft, J.Y. and Y.L.; Writing—review & editing, Y.L.; Visualization, Y.L.; Supervision, Z.Z.; Project administration, Z.Z. All authors have read and agreed to the published version of the manuscript.
Funding
This research received no external funding.
Institutional Review Board Statement
Not applicable.
Informed Consent Statement
Not applicable.
Data Availability Statement
The original contributions presented in this study are included in the article. Further inquiries can be directed to the corresponding authors.
Conflicts of Interest
The author Fan Zhang was employed by the State Grid Jiangxi Electric Power Company. The remaining authors declare that the research was conducted in the absence of any commercial or financial relationships that could be construed as potential conflicts of interest.
References
- Iris, Ç.; Lam, J.S.L. Optimal energy management and operations planning in seaports with smart grid while harnessing renewable energy under uncertainty. Omega 2021, 103, 102445. [Google Scholar] [CrossRef]
- Zhang, Z.; Kang, C. Challenges and Prospects of Constructing a New Power System Under the Carbon Neutrality Goal. Chin. Soc. Electr. Eng. 2022, 42, 2806–2819. [Google Scholar] [CrossRef]
- Qiao, X.; Yang, Z.; Li, Y.; Lin, F.; Zhong, J.; Zhang, Q. Optimal Cooperative Operation Strategy of Multi-Microgrids Considering Two-Level Carbon Trading and Demand Response. High Volt. Eng. 2022, 48, 2573–2583. [Google Scholar] [CrossRef]
- Gu, X.; Wang, Q.; Hu, Y.; Zhu, Y.; Ge, Z. Distributed Low-Carbon Optimal Operation Strategy of Multi-Microgrid Integrated Energy System Based on Nash Bargaining. Power Syst. Technol. 2022, 46, 1464–1482. [Google Scholar] [CrossRef]
- Fan, W.; Fan, Y.; Yao, X.; Yi, B.; Jiang, D.; Wu, L. Distributed Transaction Optimization Model of Multi-Integrated Energy Systems Based on Nash Negotiation. Renew. Energy 2024, 225, 120196. [Google Scholar] [CrossRef]
- Gao, H.; Zhang, F.; Liu, J.; Liu, Y.; Wang, X.; Yang, Z. Design of P2P Transaction Mechanism for Community Microgrid System Considering Differentiated Characteristics of Multi-Prosumers. Chin. Soc. Electr. Eng. 2022, 42, 1455–1470. [Google Scholar] [CrossRef]
- Mou, C.; Ding, T.; Li, L.; Wang, K.; Chi, F.; Ma, Z. Two-Level Coordinated Optimal Operation Model of Multi-Park Service Providers and Integrated Energy Suppliers Based on Hierarchical Distributed Scheduling. Power Syst. Technol. 2021, 45, 4336–4348. [Google Scholar] [CrossRef]
- Pan, R.; Tang, Z.; Shi, C.; Wei, M.; Li, A.; Dai, W. Optimal Configuration of Multi-Microgrid System with Multi-Subject Investment Based on Stackelberg Game. Chin. Electr. Power 2022, 55, 65–73+127. [Google Scholar]
- Liu, L.; Jiang, K.; Liu, N.; Zhang, Y. Park-Level Multi-Subject Energy-Carbon Quota Sharing Mechanism Based on Stackelberg Game. Chin. Soc. Electr. Eng. 2024, 44, 2119–2131. [Google Scholar] [CrossRef]
- Wu, Q.; Xie, Z.; Li, Q.; Ren, H.; Yang, Y. Economic Optimization Method of Multi-Stakeholder in a Multi-Microgrid System Based on Stackelberg Game Theory. Energy Rep. 2022, 8, 345–351. [Google Scholar] [CrossRef]
- Chen, L.; Zhu, Z.; Wang, K.; Guo, B.; Shuai, W. Optimal Operation of Distribution Network and Multi-Integrated Energy Microgrids Based on Mixed Game. Power Syst. Technol. 2023, 47, 2229–2243. [Google Scholar] [CrossRef]
- Wang, Z.; Zhong, Q. Operational Optimization of Park-Level Integrated Energy System Considering Carbon Trading Cost. Electr. Eng. 2023, 11, 1–6+13. [Google Scholar]
- Boroumandfar, G.; Khajehzadeh, A.; Eslami, M. A Single and Multiobjective Robust Optimization of a Microgrid in Distribution Network Considering Uncertainty Risk. Sci. Rep. 2024, 14, 28195. [Google Scholar] [CrossRef]
- Zhou, Y.; Yu, H.; Li, Z.; Su, J.; Liu, C. Robust Optimization of a Distribution Network Location-Routing Problem Under Carbon Trading Policies. IEEE Access 2020, 8, 46288–46306. [Google Scholar] [CrossRef]
- Ge, L.; Li, J.; Li, C.; Liu, H. Review on Optimal Operation Technology of Integrated Energy System for Zero-Carbon Park. Power Syst. Technol. 2024, 48, 1821–1835. [Google Scholar] [CrossRef]
- Yuan, K.; Zhang, S.; Chang, R.; Chen, Y. Optimal Operation of Electricity-Gas-Heat Integrated Energy System Considering Demand Response Under Stepwise Carbon Trading Mechanism. Electr. Technol. 2024, 25, 8–16. [Google Scholar]
- Sun, H.; Sun, X.; Kou, L.; Zhang, B.; Zhu, X. Optimal Scheduling of Park-Level Integrated Energy System Considering Ladder-Type Carbon Trading Mechanism and Flexible Load. Energy Rep. 2023, 9, 3417–3430. [Google Scholar] [CrossRef]
- Yan, N.; Ma, G.; Li, X.; Li, Y.; Ma, S. Low-Carbon Economic Dispatch of Park-Level Integrated Energy System Based on Seasonal Carbon Trading Mechanism. Chin. Soc. Electr. Eng. 2024, 44, 918–932. [Google Scholar] [CrossRef]
- Tian, H. Research on Planning and Optimization of Integrated Energy System Considering Carbon Trading Cost. Master’s Thesis, North China Electric Power University (Beijing), Beijing, China, 2023. [Google Scholar] [CrossRef]
- Wang, C.; Wang, R.; Yu, H.; Song, Y.; Yu, L.; Li, P. Coordinated Planning Issues and Challenges Under the Evolution of Distribution Network Form. Chin. Soc. Electr. Eng. 2020, 40, 2385–2396. [Google Scholar] [CrossRef]
- Zhang, S.; Wang, D.; Cheng, H.; Song, Y.; Yuan, K.; Du, W. Key Technologies and Challenges of Low-Carbon Integrated Energy System Planning Under Dual Carbon Goals. Autom. Electr. Power Syst. 2022, 46, 189–207. [Google Scholar]
- Shao, C.; Ding, Y.; Wang, J.; Song, Y. Modeling and Integration of Flexible Demand in Heat and Electricity Integrated Energy System. IEEE Trans. Sustain. Energy 2018, 9, 361–370. [Google Scholar] [CrossRef]
- He, X.; Liu, M.; Li, J.; Li, G.; Zhang, J. Low-Carbon Economic Dispatch of Regional Integrated Energy System Based on Demand-Side Response. High Volt. Eng. 2023, 49, 1140–1149. [Google Scholar] [CrossRef]
- Jiang, Y.; Lee, N.; Deng, X.; Yang, Y. A Secure-Sustainable-Fast Charging Strategy for Lithium-ion Batteries based on A Random Forest-Enhanced Electro-Thermal-Degradation Model. IEEE Trans. Power Electron. 2025; early access. [Google Scholar] [CrossRef]
- Jia, X.; Xia, Y.; Yan, Z.; Gao, H.; Qiu, D.; Guerrero, J.M.; Li, Z. Coordinated operation of multi-energy microgrids considering green hydrogen and congestion management via a safe policy learning approach. Appl. Energy 2025, 401, 126611. [Google Scholar] [CrossRef]
- Kang, C.; Zhou, T.; Chen, Q.; Wang, J.; Sun, Y.; Xia, Q.; Yan, H. Carbon Emission Flow from Generation to Demand: A Network-Based Model. IEEE Trans. Smart Grid 2015, 6, 2386–2394. [Google Scholar] [CrossRef]
- Wei, Y.; Liu, J.; Gu, J.; Lu, R. Low-Carbon Optimal Dispatch of Multi-Integrated Energy Systems Considering Dual-Compensation Demand Response and Carbon Trading. Mod. Electron. Technol. 2025; in press. [Google Scholar] [CrossRef]
- Askarov, A.; Radko, P.; Bay, Y.; Gusarov, I.; Kabirov, V.; Ilyushin, P.; Suvorov, A. Overcurrent Limiting Strategy for Grid-Forming Inverters Based on Current-Controlled VSG. Mathematics 2025, 13, 3207. [Google Scholar] [CrossRef]


Disclaimer/Publisher’s Note: The statements, opinions and data contained in all publications are solely those of the individual author(s) and contributor(s) and not of MDPI and/or the editor(s). MDPI and/or the editor(s) disclaim responsibility for any injury to people or property resulting from any ideas, methods, instructions or products referred to in the content. |
© 2025 by the authors. Licensee MDPI, Basel, Switzerland. This article is an open access article distributed under the terms and conditions of the Creative Commons Attribution (CC BY) license (https://creativecommons.org/licenses/by/4.0/).