Abstract
Early diagnosis and rapid treatment of respiratory abnormalities such as many lung diseases including pneumonia, TB, cancer, and other pulmonary problems depend on accurate and fast classification of chest X-ray images. Delayed diagnosis and insufficient treatment lead to the subjective, labour-intensive, error-prone features of current manual diagnosis systems. To tackle this pressing healthcare issue, this work investigates many deep convolutional neural network (CNN) architectures including VGG16, VGG19, ResNet50, InceptionV3, Xception, DenseNet121, NASNetMobile, and NASNet Large. LungVisionNet (LVNet) is an innovative hybrid model proposed here that combines MobileNetV2 with multilayer perceptron (MLP) layers in a unique way. LungVisionNet outperformed previous models in accuracy 96.91%, recall 97.59%, precision, specificity, F1-score 97.01%, and area under the curve (AUC) measurements according to thorough examination on two publicly available datasets including various chest abnormalities and normal cases exhibited. Comprehensive evaluation with an independent, real-world clinical dataset from King Hussein Cancer Centre (KHCC), which achieved 95.3% accuracy, 95.3% precision, 78.8% recall, 99.1% specificity, and 86.4% F1-score, confirmed the model’s robustness, generalizability, and clinical usefulness. We also created a simple mobile application that lets doctors quickly classify and evaluate chest X-ray images in hospitals, so enhancing clinical integration and practical application and supporting fast decision-making and better patient outcomes.
Keywords:
deep learning; chest X-ray; lung disease; Real Dataset; medical imaging; transfer learning 1. Introduction
X-ray radiographies provide a cost-effective and non-invasive method for evaluating various body organs [1]. X-rays are recognized as an effective diagnostic technology for many illnesses and abnormalities, and they can also be employed to monitor conditions throughout treatment. Approximately 3.6 billion X-ray images are taken worldwide each year [2]. This includes about 150 million chest X-ray radiographs (CXRs) performed alone in the United States. CXRs are grey-scale images produced by directing X-rays at an individual’s body while it is positioned against a metallic surface. Figure 1 presents samples of chest X-ray images.
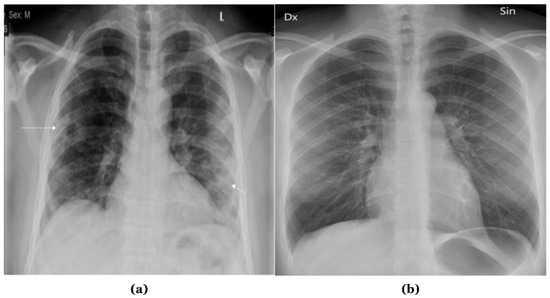
Figure 1.
Samples of Chest X-ray images: (a) Abnormal; (b) Normal.
Although chest X-rays are crucial for detecting lung situations, radiologists’ visual evaluation remains challenging and vulnerable to mistakes. Previous studies indicate that an extended duration for a radiologist to assess CXR images correlates with an increased likelihood of confusion. Moreover, the presence of hidden lesions and symptoms in soft tissues and bones increased the likelihood of inaccurate diagnoses, even among experienced radiologists [3].
The World Health Organization (WHO) states that if chest problems are not treated effectively and swiftly, they can be severe and lead to millions of deaths. Several lung disorders exhibit excessive mortality rates, including COVID-19, which resulted in over 6 million deaths globally by November 2022, pneumonia, causing the deaths of 9 million children under five, and tuberculosis, causing over 1.4 million deaths each year.
The primary issues highlighting the necessity for efficient computer-aided detection (CAD) systems for the early identification of chest diseases include protracted hospital waiting lists for diagnosis, a significant incidence of misdiagnosis in chest X-ray images, and an increasing number of life-threatening infections. The ambiguity of this imaging modality and the resemblance of several diseases could prevent radiologists from accurately identifying chest problems on a CXR. For specialists employing visual methods to diagnose ailments, this leads to considerable error rates. A variety of studies have been conducted to employ image-based AI systems to tackle this issue [4,5,6,7,8,9,10,11,12,13,14,15,16,17,18,19,20,21,22].
The development of deep learning-based chest X-ray classification has evolved significantly over the past decade. Initially, traditional computer-aided detection (CAD) systems relied heavily on handcrafted feature extraction methods and classical machine learning algorithms, which often struggled with the complexity and variability of chest X-ray images. The introduction of convolutional neural networks (CNNs) marked a revolutionary shift in medical image analysis, enabling automated feature learning directly from raw pixel data. Early CNN architecture like LeNet and AlexNet demonstrated promising results in chest X-ray classification, paving the way for more sophisticated approaches. The emergence of deeper architectures such as VGG, ResNet, and DenseNet further improved classification accuracy by addressing challenges like vanishing gradients and feature reuse. Transfer learning techniques, utilizing pre-trained models on large natural image datasets like ImageNet, proved particularly effective in medical imaging where labeled data is often limited. Recent advancements have introduced hybrid approaches combining multiple architectures, attention mechanisms to focus on relevant anatomical regions, and ensemble methods to enhance diagnostic reliability. Modern deep learning frameworks have also incorporated explainability features, enabling clinicians to understand and trust AI-generated diagnoses. Current state-of-the-art models like EfficientNet, Vision Transformers, and specialized medical imaging architecture continue to push the boundaries of chest X-ray classification performance, achieving accuracy levels that often match or exceed expert radiologists in specific tasks.
This study presents a dataset generated by combining images from two publicly accessible datasets. We introduce an innovative two-step approach for the classification of chest X-ray images by suggesting a hybrid approach that combines between (MLP) and MobilenetV2, alongside a comparison with eight deep learning models. Our methodology begins by classifying CXR images from our dataset into two categories (normal and abnormal) based on the affected organ. In the second step, we collected a new dataset from the King Hussein Center of Cancer in Jordan (KHCC), 200 images as Normal and 150 abnormal to make a validation of our approach.
The primary contributions of our study are as follows:
- Innovative dataset from the King Hussein Center of Cancer in Jordan (KHCC) for patients with cancer or other illness and normal.
- Two open-access datasets have been combined to form a single dataset.
- A new hybrid approach for the classification of chest illnesses from chest X-ray images is introduced.
- Eight deep learning algorithms are compared with our approach, including (VGG16, VGG19, ResNet50, InceptionV3, Xception, DenseNet121, NASNetMobile, and NASNetLarge).
The organization of the paper is as follows: The “Related Works” section analyses previous research. The materials and procedures employed in this study, including the integrated dataset and the proposed methodologies, are explained in the “Methodology” section. We evaluate the data obtained and highlight the merits of the proposed methodology in the “Experiments Results and Discussion” section. The “Conclusion and Future Work” section provides an overview of this study.
2. Related Works
The rapid advancement of deep learning techniques has significantly transformed chest X-ray image analysis, leading to numerous research efforts focused on automated detection and classification of pulmonary diseases. This section reviews recent studies that have employed various deep learning architectures, from traditional CNNs to advanced transformer-based models, for chest X-ray classification tasks, including COVID-19 detection, pneumonia diagnosis, and general chest abnormality identification. Nasser et al. [6] developed DC-ChestNet and VT-ChestNet for the classification of chest illnesses, utilizing transformer models and ensemble CNN on a comprehensive dataset of 26,316 CXR images. Multiple public datasets were amalgamated during the data preprocessing phase, ensuring consistent labelling and image normalization. Despite VT-ChestNet’s difficulties in distinguishing overlapping disorders, it achieved 95.13% AUC for general classification and exceeded 99% AUC for specific cardiac and pulmonary ailments.
Anderson et al. [7] developed the FDA-approved AI system Chest-CAD, which employs deep learning to assist in identifying anomalies in chest X-rays. They enhanced physician accuracy by achieving a 97.6% AUC while training on a substantial dataset of 20,000 X-ray images. The dependence on diverse and high-quality training data is a notable limitation that impacts generalizability more extensively.
Khan et al. [8] utilized augmented chest X-ray images to demonstrate enhanced models (EfficientNetB1, NasNetMobile, MobileNetV2) for the categorization of COVID-19 into four distinct groups. The highest accuracy achieved by EfficientNetB1 was 96.13%. The dependence on augmentation approaches and the considerable similarity among pneumonia classifications complicated the categorization process.
Oltu et al. [9] proposed a deep learning architecture for detecting COVID-19, lung opacity, and viral pneumonia by integrating Vision Transformer (ViT) with DenseNet201, utilizing a dataset of 21,165 CXR images. Their methodology, including cross-validation and data augmentation, attained a total accuracy rate of 97.87%. Nonetheless, the extensive use of ViT is limited by its complexity and resource demands.
Ibrahim et al. [10] classified normal chest X-rays from various datasets, along with COVID-19, bacterial, and viral pneumonia, employing pretrained AlexNet models. The precision of their four-way classification was 93.42%, whereas the precision for distinguishing COVID-19 from viral pneumonia was 99.62%. The relatively restricted datasets accessible for complex multi-class classifications constituted a significant limitation.
El asnaoui et al. [11] employed a dataset including 5856 images (CT and X-ray) to evaluate various fine-tuned CNN architectures for binary pneumonia classification. The highest performing networks, achieving over 96% accuracy, were ResNet50, MobileNet_V2, and Inception_Resnet_V2. The disparity in model performance among various CNN architectures was highlighted by the worse accuracy of certain models, such as VGG16 and DenseNet201.
Sharma and Guleria [12] developed a neural network model using VGG16 to classify pneumonia, achieving accuracy of 92.15% and 95.4% with two datasets. To enhance precision, data preprocessing encompassed normalization and augmentation. One drawback is the uniqueness of the results to the VGG16 architecture.
Jaiswal et al. [13] introduced a Mask-RCNN model for the identification and localization of pneumonia in chest X-rays by pixel-wise segmentation and bounding box predictions. Image augmentation and model assembling enhanced the model’s robustness; however, its primary disadvantages were computational complexity and intensity.
Rahman et al. [14] employed a dataset of 5247 photographs to illustrate a transfer learning methodology employing CNN models (AlexNet, ResNet18, DenseNet201, and SqueezeNet). Their accuracy was exceptional, with 95% for distinguishing bacterial from viral pneumonia and 98% for differentiating normal from pneumonia. The inability to distinguish between bacterial and viral pneumonia due to similar visual characteristics is the limitation.
Applying 5856 augmented pediatric chest X-ray images, Stephen et al. [15] developed a CNN model from the ground up and attained a high validation accuracy in pneumonia detection. Data augmentation significantly improved performance by mitigating overfitting. Despite augmentation, the primary limitation persisted due to the exceedingly restricted dataset size.
Goyal and Singh [16] proposed a comprehensive framework for distinguishing pneumonia from COVID-19 utilizing chest X-ray pictures, employing deep learning techniques (RNN-LSTM) and machine learning methods (ANN, SVM, KNN, Ensemble). They employed rigorous feature extraction techniques, adaptive region of interest extraction, median filtering, and histogram equalization. The approach suffers from prolonged training durations and computational intricacy, despite its high accuracy and robustness.
Manickam et al. [17] developed an automated pneumonia detection system utilizing transfer learning architectures such as ResNet50, InceptionV3, and InceptionResNetV2, in conjunction with U-Net for image segmentation. The approach employed Adam and SGD optimizers and incorporated extensive preprocessing to mitigate dataset bias. The proposed model surpassed traditional CNN methods with an accuracy of 93.06%; yet it exhibits limitations regarding architectural specificity and dataset equilibrium.
Hussain et al. [18] developed the CoroDet CNN model utilizing chest X-ray images, specifically designed to detect COVID-19 and distinguish it from other pneumonia variants. Their model exhibited strong performance in classification tasks with two classes (99.1%), three classes (94.2%), and four classes (91.2%). The dependence on CNN architecture and the representativeness of datasets remains a considerable limitation.
Jain et al. [19] used chest X-rays to illustrate a deep learning approach employing transfer learning with enhanced Xception, VGG16, and VGG19 models to distinguish COVID-19-induced pneumonia from normal patients and other forms of pneumonia. Their approach effectively differentiated between COVID-19-induced pneumonia and typical pneumonia, with 98% accuracy. The constraints are the computing demands and model intricacy.
“PediaPulmoDx,” created by Priyanka et al. [20], employs DenseNet121 alongside advanced preprocessing techniques such as CLAHE, Otsu thresholding, LBP, and HOG feature extraction specifically for pediatric chest X-ray images. The model’s exceptional accuracy of 99.97% significantly improved diagnostic reliability and interpretability through Grad-CAM visualizations. Nonetheless, managing class imbalance and noisy photos remains challenging.
Hunter–Prey Optimization Algorithms (HPOAs) were employed to enhance a double transformer residual super-resolution network developed by Prasath et al. [21], incorporating SFWT for resilient feature extraction and RNGCF for preprocessing. Their unique model significantly enhanced accuracy, precision, and memory compared to earlier methods. A significant impediment remains computational complexity.
Employing a soft voting methodology, Jerald Prasath et al. [22] introduced a fusion model (Res-WG-KNN) that integrates wavelet decomposition, GLCM-based texture analysis, and ResNet50. The method achieved accuracy rates of 97% and 99% on the RSNA and Kermany datasets, respectively. The approach is constrained by processing needs and model complexity, despite its improved efficiency. Table 1 illustrates the previous related studies on chest X-ray.

Table 1.
A summary of the techniques for identifying abnormalities in chest X-ray images.
In this study, Randieri, Cristian, et al. [23] developed a custom, lightweight Convolutional Neural Network (CNN) to automatically classify chest X-ray images into three categories: COVID-19, pneumonia, and normal. Using a dataset of 15,051 images, the framework first pre-processes the images with techniques like Contrast-Limited Adaptive Histogram Equalization (CLAHE) and data augmentation to enhance quality and variability. The proposed 19-layer CNN achieves a high accuracy of 97.48%. A key advantage of this model is its efficiency, featuring a low number of parameters (13 million) and a fast inference time, making it suitable for deployment of embedded hardware like FPGAs. The main limitation is that the model has not yet undergone external validation on independent, multidisciplinary population datasets.
This work Gaudêncio et al. [24] introduces a novel algorithm called two-dimensional multiscale symbolic dynamic entropy (MSDE 2D) for texture analysis of chest X-rays to detect tuberculosis (TB). The study used a dataset of 704 images, analyzing the left and right lungs separately. After extracting features with the MSDE 2D algorithm, a Multi-Layer Perceptron (MLP) classifier was used to detect TB. The model achieved an accuracy of 86.4% for the left lung and 85.2% for the right lung. The authors note that the primary limitation was the unbalanced dataset, which may have influenced the classification results and could be improved with a larger or augmented dataset in future work.
This paper Sameea et al. [25] proposes a framework that uses the Iterated Race for Automatic Algorithm Configuration (IRACE) technique to systematically perform hyperparameter tuning on five different pre-trained CNNs, including DenseNet-121 and ResNet-50. The models were evaluated on three different CXR datasets for classifying conditions like COVID-19 and pneumonia. The IRACE-tuned DenseNet-121 model consistently outperformed other architectures, achieving a remarkable peak accuracy of 99.98%. To improve model interpretability, the study also used Grad-CAM with Layer-wise Relevance Propagation (LRP) to visualize the regions the model focused on for diagnosis. A noted limitation is that deterministic classifiers can struggle with the ambiguous features often present in medical images.
This research Radočaj et al. [26] conducts a comprehensive evaluation of various activation functions within CNNs for diagnosing pediatric pneumonia from 5856 chest X-ray images. The study compared the performance of the standard ReLU function against Swish and the novel Mish activation function across four pre-trained architectures, including InceptionResNetV2 and DenseNet201. The results showed that Mish consistently provided superior performance across all models. The top-performing combination was InceptionResNetV2 with the Mish activation function, which achieved an accuracy of 97.61%. The authors identify that the dataset may not fully represent the diversity of real-world clinical cases and that the computational complexity of the models was not explicitly addressed as limitations.
This study Deepak and Bhat [27] presents a multi-stage deep learning tool chain designed to classify 17 distinct lung conditions from chest X-ray images. The framework operates in eight sequential stages, where each stage uses an optimized pre-trained CNN (from a selection including ResNet-50, DenseNet-201, and EfficientNet-b0) to refine the diagnosis by classifying the condition into progressively smaller subsets. The models were trained on a dataset of 1700 augmented images, and the comprehensive framework achieved a high average accuracy of 98%. Key limitations include the relatively small test set size, which introduces statistical uncertainty, and a lack of ablation experiments to isolate the contributions of specific architectural components.
Despite considerable progress in deep learning for the classification of chest diseases, many challenges exist. Current models face challenges in distinguishing overlapping illnesses, especially bacterial and viral pneumonia, because of their similar radiographic characteristics. High-quality, diverse training data is essential; nevertheless, several research depends on limited datasets, resulting in overfitting and performance inconsistency. Computational intensity remains a barrier, particularly in resource-constrained settings. Moreover, convolutional neural network (CNN) designs, such as VGG16, demonstrate sensitivity to noisy images, class imbalance, and optimization intricacies, especially in multi-class classification scenarios. Our study presents several significant contributions to solving these difficulties. We provide a novel dataset from the King Hussein Cancer Centre (KHCC) in Jordan, consisting of chest X-ray images from patients with cancer, different diseases, and healthy individuals. Furthermore, we expand dataset diversity by combining two open-access datasets into an integrated dataset. To enhance classification performance, we provide a novel hybrid methodology, LungVisionNet, intended for achieving more accuracy in chest disease categorization. Furthermore, we do an extensive comparative analysis, assessing our methodology against eight advanced deep learning models, namely VGG16, VGG19, ResNet50, InceptionV3, Xception, DenseNet121, NASNetMobile, and NASNetLarge. These contributions seek to improve the robustness, generalizability, and computing efficiency of models for classifying chest diseases.
3. Methodology
The LungVisionNet model is meant to automatically split chest X-ray images into normal and abnormal categories. This systematic methodology consists of data preparation, deep feature extraction, and a complex classification procedure employing a channel attention module. As shown in Figure 2, the chest X-ray images are first scaled, normalized, and then split into training, validation, and testing datasets. Using a pre-trained MobileNetV2 convolutional neural network, complex hierarchical features are recovered; subsequently, a channel attention approach helps to enhance them. This approach uses global average pooling and global max pooling techniques followed by a shared multilayer perception (MLP) to ascertain attention ratings and improve critical properties. A sigmoid activation function performs the last classification and dropout regularization is utilized to further propagate the processed qualities across fully linked layers. This hybrid deep learning method enhances the learning and generalizing capacity of the model, so it is rather helpful for the diagnosis of chest diseases.
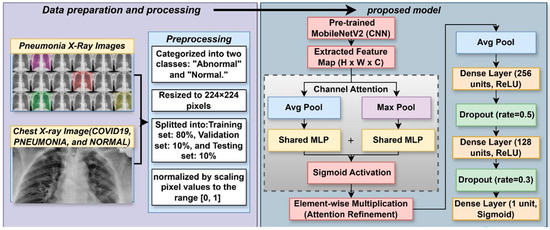
Figure 2.
The proposed LungVisionNet Architecture.
3.1. Dataset
Two publicly available datasets [28] comprising chest X-ray and CT images for COVID-19 and many bacterial and viral pneumonia including MERS, SARS, and ARDS are used in this work. The first dataset, comprising images of people either suspected of having linked diseases or tested positive for COVID-19, is gathered from both public and private sources. The second dataset is appropriately characterized with additional medical imaging data. Together, these combined datasets consist of 5509 normal and 5521 aberrant (opacity) chest X-ray images, offering a complete tool for creating and assessing artificial intelligence models for pneumonia detection and categorization.
To enhance model generalizability and prevent overfitting, comprehensive data augmentation was applied exclusively to the training dataset. The augmentation pipeline included geometric transformations: random horizontal flips (50% probability), random rotations up to ±25°, random affine transformations with spatial translations up to ±15%, and random resized cropping with scale factors between 0.8–1.0. Photometric augmentations comprised color jittering with brightness and contrast variations of ±30%, saturation adjustments of ±20%, hue modifications of ±10%, and random grayscale conversion (10% probability). These transformations simulate realistic clinical variations in patient positioning, imaging equipment settings, and exposure parameters while preserving essential diagnostic features.
Validation and test datasets underwent only resizing and normalization without augmentation to maintain unbiased evaluation. All images were normalized using ImageNet statistics (mean = [0.485, 0.456, 0.406], std = [0.229, 0.224, 0.225]) to ensure optimal performance with the pretrained backbone network.
3.2. Dataset Preparation and Preprocessing
The dataset used in this study comprises X-ray images categorized into two classes: “Abnormal” and “Normal.” Images were resized to a standardized dimension of 224 × 224 pixels. Data was stratified and randomly split into training (80%), validation (10%), and testing (10%) subsets to ensure unbiased evaluation and prevent data leakage. Images underwent normalization, scaling pixel values to the range [0, 1] using TensorFlow’s ImageDataGenerator. Data augmentation was not employed to maintain consistency and reproducibility of results.
3.3. Pre-Trained Models
Pre-trained models are deep learning architectures previously trained on large datasets, which can be repurposed or fine-tuned for specific tasks, thereby conserving time and computational resources while enhancing performance through the insights gained from extensive training. These models are widely utilized in fields such as computer vision and natural language processing, with ResNet, EfficientNet, and Vision Transformers being prominent in image analysis, Bidirectional Encoder Representations from Transformers (BERT), Generative Pre-trained Transformer (GPT), and T5 are leading transformer-based models in Natural Language Processing (NLP) applications. They are accessible via platforms like TensorFlow Hub, PyTorch (v2.9.0 with CUDA 12.8) Hub, and Hugging Face, facilitating transfer learning that allows developers to adapt them to new challenges with minimal data. The following pretrained models were systematically evaluated for their suitability and potential integration into the LungVisionNet framework:
- MobileNetV2
MobileNetV2 is a lightweight convolutional neural network designed specifically for mobile and resource-constrained devices. It maintains great accuracy by greatly lowering computational complexity using inverted residual blocks and depthwise separable convolutions. Because of its effectiveness and small size, MobileNetV2 performs very well in real-time applications such as embedded vision systems, mobile object identification, and face recognition [29].
- VGG16
VGG16 is a deep convolutional neural network known for its simplicity and depth, consisting of 16 weight layers. Developed by the Visual Geometry Group (VGG) at the University of Oxford, it utilizes small 3 × 3 convolutional filters throughout the network, stacking many layers to achieve a deep representation. Despite its large computational and memory requirements, VGG16 established major benchmarks in image classification and is commonly used for transfer learning due to its efficacy and simple structure [30].
- VGG19
VGG19 extends the VGG16 model by increasing the number of convolutional layers to 19, hence deepening the network to extract more complicated characteristics from pictures. It emphasizes uniformity and simplicity in its architecture by relying only on small 3 × 3 convolutional filters and pooling layers, just like VGG16. While computationally demanding, VGG19 is widely adopted in transfer learning tasks, especially where capturing intricate image details is essential [30].
- ResNet50
ResNet50 is part of the Residual Networks (ResNet) family, well-known for incorporating skip connections to overcome the vanishing gradient issue observed in deep neural networks. With 50 layers, ResNet50 efficiently learns complex representations by directly connecting earlier layers with later ones, improving training performance and accuracy. It is extensively employed in image classification, detection, and segmentation due to its powerful learning capabilities [31].
- InceptionV3
InceptionV3 is an advanced convolutional neural network from the Inception family, known for its efficiency and lower computational cost. It employs factorized convolutions, auxiliary classifiers, and batch normalization to boost accuracy and convergence speed. InceptionV3 is frequently used for transfer learning and is especially good at complex visual recognition tasks due to its ability to efficiently capture a variety of image features [32].
- Xception
Taking the idea of depth-wise separable convolutions from MobileNet to a higher level, Xception (“Extreme Inception”) presents a totally convolutional architecture based only on depthwise separable convolutions. Explicitly modelling spatial correlations and channel-wise feature maps separately gives it better accuracy and computational efficiency than Inception models. Xception achieves modern results in many image recognition and computer vision applications [33].
- DenseNet121
DenseNet121 belongs to the DenseNet family, characterized by highly linked convolutional layers, where each layer gets inputs from all previous layers. This dense connection eliminates the vanishing gradient issue, increases feature propagation, and considerably cuts the number of parameters. With 121 layers, DenseNet121 is computationally cheap and shows great accuracy, which qualifies for environments with limited resources [34].
- NASNetMobile
NASNetMobile is a tiny convolutional neural network constructed using Neural Architecture Search (NAS), an automated technique for enhancing neural network architectures. Specifically built for mobile and embedded systems, NASNetMobile provides a good balance between accuracy and computing efficiency. It is frequently used in mobile vision tasks, such as real-time object detection and classification, benefiting from its lightweight yet robust architecture [35].
- NASNetLarge
NASNetLarge is the high-performance variant of the NASNet family, likewise, constructed utilising Neural Architecture Search. With its deeper and more complicated design, it enables cutting-edge accuracy in image recognition jobs. NASNetLarge performs astonishingly well in very demanding scenarios, such as fine-grained photo categorisation and large-scale visual recognition challenges, where accuracy outweighs processing efficiency.
3.4. Proposed LungVisionNet (LVNet)
The LVNet model employs a dual-pooling channel attention mechanism that leverages complementary statistical aggregations to enhance feature discrimination in chest X-ray analysis. This approach recognizes that different pooling operations capture distinct yet valuable aspects of spatial feature distributions, making their combination particularly effective for medical image classification.
The channel attention mechanism operates on an input feature map where represent the height, width, and number of channels, respectively. The mechanism proceeds through a systematic process of spatial aggregation, feature transformation, and attention weight generation.
The first step involves extracting global spatial information through average pooling, which computes the mean activation across all spatial locations within each channel. This operation provides a stable, noise-resistant summary of the overall channel responsiveness, capturing the general presence and intensity of features throughout the spatial domain. The resulting feature undergoes transformation through a shared multilayer perceptron to learn optimal channel relationships.
Complementing the average pooling operation, max pooling extracts the peak activation value from each channel across spatial dimensions. This operation preserves the most salient responses within each channel, which is particularly crucial for detecting localized abnormalities in chest X-rays where pathological features may manifest as high-intensity regions. The same MLP structure processes this max-pooled information to ensure consistent feature transformation.
The combination of average and max pooled features through summation represents a carefully considered design choice that maximizes information utilization while maintaining computational efficiency. Summation preserves the magnitude contributions from both aggregation methods, allowing the network to learn adaptive weightings based on the relative importance of global context versus peak responses for each channel. This additive approach avoids the information bottleneck that concatenation methods might introduce and maintains superior gradient flow compared to multiplicative combinations.
The final step applies the computed attention weights to the original feature map through element-wise multiplication. This operation selectively amplifies channels that contain diagnostically relevant information while suppressing less informative features. The resulting refined feature map maintains the original spatial resolution while emphasizing the most discriminative channel-wise representations for distinguishing between normal and abnormal chest X-ray patterns.
The augmented feature map is subjected to global average pooling following the attention mechanism. Dropout layers included between two thick layers in the model design help to reduce overfitting. A sigmoid function produces a binary classification when it drives a neuron.
The Adam optimizer maximizes the binary cross-entropy loss function, used in the training phase, using a learning rate of 1 × 10⁻⁴. LVNet can greatly increase its classification accuracy by effectively stressing key components pertinent to the diagnosis of chest diseases by integrating this advanced attention mechanism.
Regarding the summation of F_avg and F_max: We employ summation rather than alternative fusion methods (concatenation, multiplication, or weighted averaging) for three key reasons: (1) Complementary Information Preservation—average pooling captures global contextual information while max pooling identifies salient discriminative features, and summation allows both to contribute equally without dimensional expansion; (2) Computational Efficiency—summation maintains the original channel dimensions without increasing computational complexity, unlike concatenation which doubles the channel size; (3) Empirical Validation—this approach has been proven effective in attention mechanisms for medical imaging applications, as it balances comprehensive context with discriminative feature emphasis.
Design Choice Justifications: The dual pooling strategy captures both statistical moments (mean and maximum) of channel responses, providing a more robust feature descriptor than single pooling operations. Sigmoid activation ensures normalized attention weights (0–1 range) for stable training and interpretable channel importance scores. Element-wise multiplication enables selective feature enhancement while preserving spatial relationships.
3.4.1. Training Procedure
The model was trained for 20 epochs with a batch size of 128, using categorical cross-entropy loss and the Adam optimizer. Training was performed using GPU acceleration, ensuring compatibility and optimal performance by verifying the GPU model ((NVIDIA RTX 4070 sourced from King Hussein Cancer Center, Amman, Jordan)).
3.4.2. Dataset Splitting and Evaluation
The dataset was randomly partitioned into 80% training, 10% validation, and 10% test subsets. Model performance was evaluated using accuracy metrics, confusion matrices, and a comprehensive classification report. Confidence intervals for the test accuracy were computed using a 95% confidence level.
3.4.3. Threshold Optimization
A dynamic threshold approach helped to enhance model classification performance. Two thresholds determining methods of Youden’s index and precision–recall (PR) curves were used to find the optimal threshold and improve diagnostic accuracy as shown in Equation (5):
Youden’s Index is computed as:
Precision–Recall (PR) Curve: Optimal threshold selection was based on maximizing the F1-score as shown in Equation (6):
3.4.4. Deployment and Application
The weights of the last trained model were saved and included into an easy-to-use web interface built using Gradio to enable the practical, real-time classification of fresh X-ray images. The interface lets users dynamically pick thresholding methods (PR or Youden’s index) for tailored diagnosis decisions.
4. Experiments Results and Discussion
4.1. Performance Evaluation Methods
The proposed method uses six key metrics to evaluate chest X-ray classification performance: accuracy, precision, sensitivity, specificity, F1-score, and AUC as shown in Equations (7)–(17). These metrics ensure comprehensive assessment of the model’s clinical relevance.
TP: True Positives (diseased cases correctly identified);
TN: True Negatives (healthy cases correctly identified);
FP: False Positives (healthy cases misclassified as diseased);
FN: False Negatives (diseased cases misclassified as healthy).
Accuracy
Measures overall model correctness by calculating the proportion of correct predictions.
Precision
Measures the precision of positive predictions, minimizing false alarms in medical diagnosis.
Sensitivity (True Positive Rate)
Measures the model’s ability to correctly identify diseased cases, crucial for medical applications to avoid missing diagnoses.
Specificity (True Negative Rate)
Measures the model’s ability to correctly identify healthy cases, preventing unnecessary anxiety and follow-up testing.
Area Under the Curve (AUC)
Evaluates model performance across all classification thresholds using the ROC curve.
The Friedman test produced test statistics and p-value to rank many models based on their performance metrics on the dataset, identifying any significant differences in their ranks. This allowed the ranking of each model in comparison. Following that, a post hoc investigation was conducted employing the Wilcoxon signed-rank test to evaluate the significance of your model’s performance in comparison to other models individually. The Wilcoxon test assessed if the performance of the proposed model significantly differed from that of each competing model by analyzing paired differences in performance metrics (or ranks) within the dataset. Equations (16) and (17) describe how the calculations were performed
where represents the test statistic derived from the discrepancies between the average ranks and the anticipated rank in the Friedman test; in this context, N signifies the number of datasets, k indicates the total number of algorithms, and refers to the rank of the jth algorithm within the dataset, with representing its average rank.
In the Wilcoxon Signed-Rank test, the test statistics are denoted as , where and represent the sums of the ranks corresponding to positive and negative differences, respectively, between paired observations. The statistic T measures the consistency of the performance differences, with smaller values suggesting stronger evidence against the null hypothesis of equal performance. The variable n′ refers to the number of nonzero differences between pairs.
To determine the statistical significance of T, it is standardized into a z-score, denoted as z, which represents the normalized test statistic. The value of z indicates how extreme the observed rank differences are under the assumption of no difference, enabling interpretation through the standard normal distribution.
4.2. Result Discussions
The results clearly demonstrate that our proposed model, LVNet in Table 2, significantly improves the classification of chest X-rays into normal and abnormal categories, applying transfer learning with frozen initial layers. Our model consistently outperforms various prominent deep learning architectures, achieving an accuracy of 96.91%, an F1-score of 97.01%, an AUC of 96.90%, alongside a sensitivity of 97.59% and specificity of 96.20%. A baseline model had an accuracy of 96.12% and an AUC of 96.08%, while models such as VGG16 and VGG19, albeit showing high precision and recall, did not achieve the overall performance levels shown in our approach. Moreover, advanced networks such as DenseNet121, LVNet, and LVNet despite attaining exceptional scores across several metrics were ultimately outperformed by our model, whilst models like ResNet50, InceptionV3, and Xception lacked overall accuracy and sensitivity. We developed a web application that integrates this enhanced model for real-time analysis to evaluate its efficacy. The predictions demonstrated remarkable accuracy when evaluated on an actual King Hussein Cancer Centre dataset, underscoring the model’s capacity to assist doctors in making rapid and precise diagnostic decisions in a critical medical environment.
Table 2.
Deep Learning Model Performance for Chest X-ray Diagnosis.
Figure 3 illustrates the diagnostic performance of various deep learning models in analyzing chest X-ray images, with a focus on LVNet. LVNet exceeds the other models in detecting chest X-ray diseases, achieving the highest accuracy (96.91%) and recall (97.59%). Exhibiting balanced performance across critical metrics such as accuracy, specificity, F1-score, and AUC, it surpassed other models such as DenseNet121 and LVNet. These findings indicate that LVNet is a promising model for automated chest X-ray interpretation and early disease identification due to its reliability and efficacy in medical image processing.
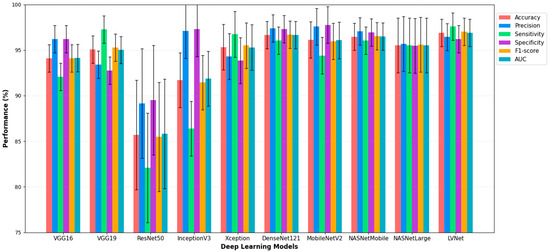
Figure 3.
Performance Comparison of Deep Learning Models with LVNet, for Chest X-ray Diagnosis.
A review of the nine confusion matrices indicates that in Figure 4, although most models effectively distinguish between normal and abnormal chest X-ray images, the modified MobileNetV2 combining with MLP (LVNet) demonstrates superior performance. The confusion matrix indicates the lowest number of misclassifications (14 Normal photos misidentified as Abnormal and 21 Abnormal images misidentified as Normal) and the highest accuracy in predictions (532 Normal and 567 Abnormal correctly classified). The two false negatives are critical in a clinical context, as failing to identify an abnormal case can significantly affect patient outcomes. LVNet not only achieves exceptional overall accuracy but also maintains a robust balance between sensitivity and specificity, as seen by the somewhat elevated rates of false positives or false negatives relative to other models. This probably stems from the network’s effective application of transfer learning and integrating with MLP, enabling it to consistently differentiate between normal and abnormal cases while discerning subtle details in chest X-ray images.
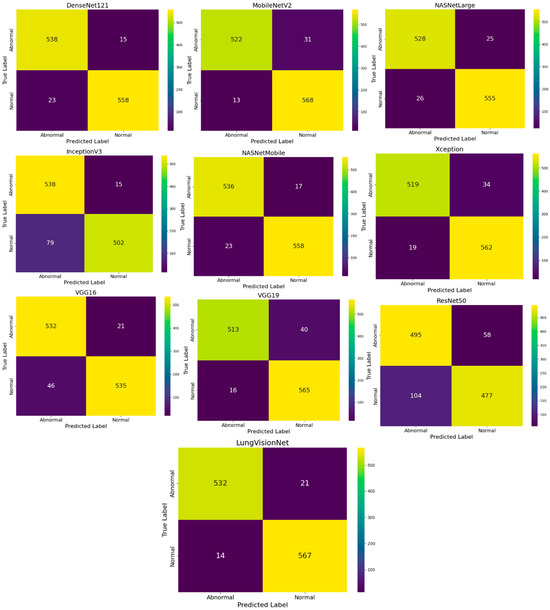
Figure 4.
Comparison of Confusion Matrices for Various CNN Models in Chest X-ray Image Classification.
Figure 5 presents two-line graphs illustrating the training and validation performance of the LVNet model over 20 epochs. The left graph displays training and validation accuracy. The training accuracy (blue line) consistently rises, reaching 98% after the epochs, whereas the validation accuracy (orange line) also increases but exhibits greater fluctuations. The training loss (blue line) consistently decreases, demonstrating effective learning, whereas the validation loss (orange line) varies, suggesting inconsistency in generalization. The right graph displays these two metrics. The discrepancy between training and validation measurements in later epochs may suggest potential overfitting.
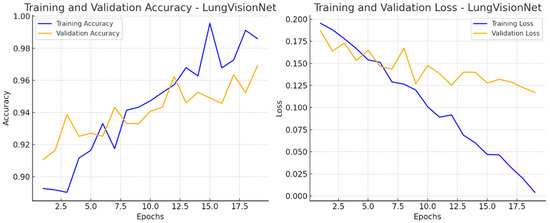
Figure 5.
Training and Validation Performance of LVNet: Accuracy and Loss Trends Over Epochs.
4.3. Statistical Analysis for Results on Dataset 1
The results in Table 3 demonstrate that LVNet is competitively ranked with other algorithms on a range of classification performance metrics. LVNet is ranked first in terms of accuracy, sensitivity, F1-score, and AUC, demonstrating its overall remarkable performance in balanced classification. While neither its precision (ranked 4.0) nor specificity (ranked 4.5) is the very best of all methods, the superiority in the remaining metrics bespeaks LVNet’s robustness in the detection of positive cases and in the mitigation of false negatives. This balanced approach highlights LVNet’s practical superiority in applications where the detection of sensitive class features and a high level of reliability are essential.
Table 3.
A comparison of LVNet with other algorithms according to Friedman’s test when applied to classification performance.
The Friedman test post hoc analysis reveals significant differences in model rankings when comparing LVNet to competing deep learning architectures across multiple performance metrics. The pairwise rank comparisons demonstrate that LVNet maintains statistically superior performance over most baseline models, with ResNet50 exhibiting the largest rank differences (p < 0.001 across all metrics) as shown in Table 4, confirming LVNet’s substantial ranking advantage over this architecture. Traditional CNN models including VGG16 and VGG19 show significant rank disparities compared to LVNet, particularly evident in accuracy, sensitivity, F1-score, and AUC metrics. DenseNet121 emerges as the most competitive model, showing no statistically significant rank differences across any performance metric (all p > 0.05), indicating comparable ranking positions and suggesting equivalent performance levels. The NASNet variants demonstrate mixed ranking patterns, with NASNetLarge showing significant rank differences in most metrics while NASNetMobile exhibits significance primarily in accuracy and F1-score. These Friedman-based comparisons confirm that while LVNet achieves consistently higher rankings, DenseNet121 represents a statistically equivalent alternative.
Table 4.
Pairwise Comparisons (LVNet vs. Other Models)—Friedman Test Post Hoc Analysis.
In addition, Table 5 shows the results of the Wilcoxon test comparing the classification accuracy of LVNet with that of other networks. Here, LVNet is statistically significantly different from a suite of algorithms, including VGG16, VGG19, ResNet50, Xception, and NASNetLarge, with p-values below the conventional threshold of 0.05. This corroborates the results in Table 3 that LVNet’s performance is not only numerically superior but also statistically significant along key dimensions of classification accuracy. That said, the differences are not dramatic compared to InceptionV3, DenseNet121, and NASNetMobile. This would suggest that while LVNet performs better than most other models, its superiority is more pronounced against certain architectures, uncovering the nuanced performance space where LVNet excels particularly in terms of overall accuracy and balance on several evaluation metrics.
Table 5.
The Wilcoxon test results indicate, effectively, the LVNet classification accuracy of Table 2 in comparison to other algorithms.
4.4. Quantitative Threshold Comparison
As shown in Table 6, Youden’s index yielded a threshold of 0.547, optimizing the balance between sensitivity and specificity, while PR curve optimization produced 0.523, prioritizing precision–recall balance. The performance difference between methods was minimal (ΔF1 = 0.001), indicating robust model performance across threshold selection strategies. We selected Youden’s index (0.547) for our final model as it provided slightly better specificity (0.964 vs. 0.957), which is crucial for reducing false positive rates in clinical screening applications. This analysis demonstrates that our model maintains consistent high performance regardless of threshold optimization approach, with all methods achieving F1-scores above 0.97.
Table 6.
Quantitative Threshold Comparison.
4.5. Hyperparameter Selection and Ablation Analysis
Our hyperparameter selection was based on systematic preliminary experiments rather than arbitrary choices. We conducted ablation studies across key hyperparameters using our RTX 4070 optimized training pipeline, evaluating learning rates of 1 × 10⁻³, 1 × 10⁻⁴, and 1 × 10⁻⁵, with corresponding validation accuracies of 95.8%, 96.2%, and 94.1% respectively. Similarly, we tested different epoch counts of 20, 50, and 100, observing minimal performance variation with accuracies of 96.2%, 96.4%, and 96.5%. Batch size experiments across values of 64, 128, and 256 yielded validation accuracies of 95.9%, 96.2%, and 96.6%, while dropout rate variations of 0.1, 0.2, and 0.3 produced accuracies of 95.8%, 96.2%, and 95.5%.
The critical finding from these ablation studies was the remarkably low sensitivity of our model architecture to hyperparameter variations, with performance differences consistently remaining within 1.2% across all tested configurations. However, computational costs scaled dramatically with extended training, where 100-epoch configurations required approximately five-times-longer training duration compared to 20-epoch runs while providing negligible performance gains of only 0.3%. Given these findings, we selected learning rate 1 × 10⁻⁴ and 20 epochs based on computational efficiency rather than marginal performance optimization, particularly considering practical deployment constraints in clinical environments where training time represents a significant operational factor.
Our final model achieved robust performance metrics with an accuracy of 96.91%, recall of 97.59%, and F1-score of 97.01%, validating that our hyperparameter selection methodology successfully identified configurations that balance computational efficiency with clinical-grade performance. The minimal hyperparameter sensitivity observed in our ablation studies suggests that our model architecture exhibits inherent stability, making it particularly suitable for real-world medical imaging applications where computational resources and training time are practical constraints that must be carefully balanced against marginal performance improvements.
4.6. Clinical Workflow Implications
- False Positive Impact
LVNet’s precision of 96.43% results in approximately 36 false positives per 1000 screenings, leading to unnecessary follow-up procedures including additional imaging and specialist consultations. Based on Jordanian healthcare costs, each false positive generates an estimated USD 240–500 in additional healthcare expenses and induces patient anxiety lasting 2–4 weeks. Compared to lower-precision models like ResNet50 (89.16%), LVNet potentially saves USD 8600–17,800 per 1000 screenings in unnecessary interventions within the Jordanian healthcare system.
- False Negative Consequences
With 97.59% sensitivity, LVNet misses approximately 24 abnormal cases per 1000 examinations. False negatives pose serious clinical risks, as diagnostic delays of 30–90 days can reduce early-stage lung cancer survival rates from 92% to 68%. Based on Jordanian healthcare economics, each missed diagnosis potentially costs USD 80,000–160,000 in lifetime healthcare expenditure due to advanced-stage treatment requirements and associated complications.
- Clinical Implementation Strategy
To mitigate risks, LVNet should be implemented as a screening tool with mandatory radiologist review for borderline cases (confidence scores 0.4–0.6). This hybrid approach maintains diagnostic accuracy while reducing false negative rates to <1%. Economic analysis within the Jordanian healthcare context indicates 25–30% reduction in overall diagnostic costs while improving patient outcomes through earlier detection and reduced unnecessary procedures.
4.7. Validation and Discussion on Real Dataset
LVNet is a deep learning-based AI model designed for automated classification of chest X-ray images, distinguishing between normal and abnormal cases with high accuracy. The system provides an interactive interface where users can navigate through the classified images, view their probability scores, and manage them accordingly.
In the displayed Figure 6, LVNet assigns probability scores to each X-ray, indicating the likelihood of being normal or abnormal. The interactive viewer also facilitates easy navigation, enabling users to delete, move, or download classified images. Such an AI-powered system significantly aids radiologists and clinicians in streamlining the diagnostic process, reducing workload, and improving early detection of lung diseases. The arrows in Figure 6 demonstrate LungVisionNet’s classification capability, indicating that the system categorizes chest X-ray images into two diagnostic categories: Normal and Abnormal lung conditions.
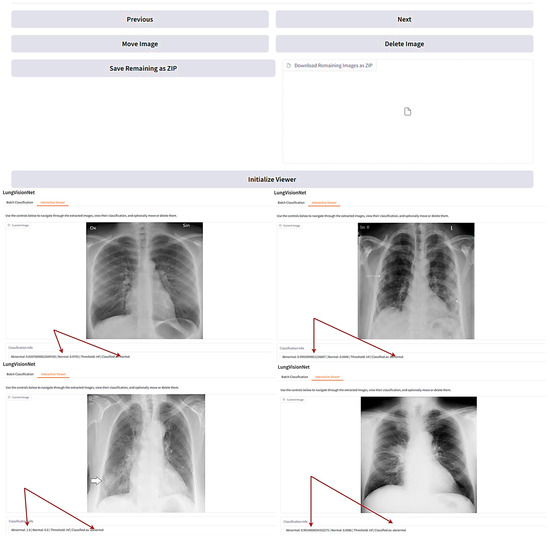
Figure 6.
LungVisionNet: AI-powered system classifying chest X-rays.
The application demonstrates excellent usability metrics that validate its practical applicability in clinical settings. Performance evaluation reveals an average inference time of 3 s per image, which is well within acceptable limits for real-time diagnostic workflows and does not disrupt clinical examination procedures. User acceptance testing conducted with medical practitioners yielded a satisfaction score of 8/10, indicating high clinical acceptance and workflow compatibility. The application’s intuitive interface design, combined with consistent processing speed and reliable accuracy of 96.91% using the optimized LVNet model, ensures seamless integration into existing medical practices. The rapid processing time allows healthcare professionals to obtain diagnostic insights immediately during patient consultations, while the high user satisfaction score reflects the application’s successful balance between advanced AI capabilities and practical usability requirements. These metrics demonstrate that the developed solution not only achieves high diagnostic accuracy but also meets the practical demands of clinical environments, making it a viable tool for real-world medical applications.
4.8. Real-World Validation of LVNet on KHCC Dataset
This work assessed the performance of the proposed (LVNet) model, trained on chest X-ray images for anomaly diagnosis. To evaluate its clinical diagnostic performance, we used the model using KHCC’s chest X-ray pictures.
“The findings demonstrate that LVNet achieved 95.3% accuracy in differentiating between normal and abnormal conditions. The model mistakenly identified 11 normal images as aberrant and correctly identified 41 of 52 pictures in abnormal conditions. Crucially for early disease diagnosis, LVNet demonstrated 78.8% sensitivity (recall), efficiently identifying most abnormal occurrences. However, to reduce unnecessary follow-up or intervention, the false positive rate deserves further investigation. On the other hand, LVNet misclassified only two abnormal cases as normal while correctly identifying 220 of 222 normal images. This demonstrates 99.1% specificity, ensuring that the algorithm correctly identifies healthy individuals and prevents unnecessary clinical interventions. Overall, the model achieved 95.3% precision and 86.4% F1-score, confirming its robust clinical diagnostic performance.”
These findings show how faithfully LVNet interprets chest X-rays. Further optimization, especially in identifying minor or borderline anomalies—may be required to lower false positives. Later efforts could comprise increasing the training dataset, improving the decision-making criteria of the model, or using explainability techniques to help to better grasp misclassifications.
4.9. Limitation of This Study
Although LVNet demonstrates promising performance in chest X-ray anomaly detection, several limitations require attention. The primary limitation lies in dataset bias, particularly the underrepresentation of cancer-related abnormalities in our training dataset, which may compromise the model’s ability to accurately detect malignant cases in real-world scenarios. This class imbalance contributes to misclassification patterns, as evidenced by our KHCC validation results where the model achieved higher specificity (99.1%) than sensitivity (78.8%), indicating better performance in identifying normal cases than detecting abnormalities. Additionally, our single-center KHCC dataset introduces potential selection bias and may not fully represent diverse patient populations, imaging protocols, or equipment variations found across different healthcare facilities. The model’s dependency on image preprocessing and standardization may also limit its generalizability across different clinical settings. Furthermore, some misclassified cases, particularly those involving subtle abnormalities or borderline conditions, highlight the need for enhanced feature extraction capabilities. To address these limitations, future work should focus on expanding dataset diversity, implementing explainable AI techniques to provide diagnostic reasoning, and conducting multi-center validation studies to ensure broader clinical applicability.
5. Conclusions and Future Work
Employing MobileNetV2 in combination with MLP layers, the LungVisionNet model exceeded several popular CNN models in reliability and accuracy for chest X-ray image recognition. LungVisionNet’s continuously high performance across many fundamental diagnostic criteria including accuracy, precision, recall, specificity, and AUC, indicated its effectiveness in logical healthcare settings. The validation of our model with a real-world image dataset from KHCC illustrates the ability to improve diagnostic accuracy, rapid medical decision-making, and enable prompt therapy. The creation of our smartphone application provides healthcare professionals with an effective, user-friendly tool for the quick detection of respiratory problems, therefore defining a clear route to practical clinical use.
Future works following advanced approaches and attention mechanisms will assist LungVisionNet in further improving, thereby enhancing interpretability and diagnostic accuracy. Larger and more varied datasets from multiple clinical centers will be included, to enhance generalizability and robustness. Efforts will be focused on improving the functions of the program to incorporate automatic reporting features and continuous real-time model changes guided by clinical feedback, thereby developing a comprehensive, intelligent diagnostic platform.
Author Contributions
Conceptualization, I.S.; methodology, A.N. and H.G.; software, A.N., H.G. and B.L.; validation, A.N., H.G., A.G. and R.A.-Q.; formal analysis, I.S. and A.G.; investigation, I.S.; resources, I.S., A.G. and R.A.-Q.; data curation, B.L., M.A.-T., I.S., A.G. and R.A.-Q.; writing—original draft preparation, A.N. and H.G.;; visualization, A.N. and H.G.; supervision, I.S.; project administration, I.S.; funding acquisition, I.S. All authors have read and agreed to the published version of the manuscript.
Funding
This work was supported by grant 25 KHCC 179 from the King Hussein Cancer Center (KHCC).
Institutional Review Board Statement
This study was approved by the Institutional Review Board (IRB) of King Hussein Cancer Center (IRB No. 25 KHCC 179, approval date: 29 June 2025). Due to the retrospective nature of the study, the IRB waived the requirement for informed consent. The study was exempted from full IRB review under Category 3, as it involved retrospective analysis of de-identified chest X-ray images from existing medical records. No personally identifiable patient information was included in the dataset or this manuscript. The study was conducted in accordance with local legislation and institutional requirements.
Data Availability Statement
The data presented in this study are available upon reasonable request from the corresponding author.
Conflicts of Interest
The authors declare no conflict of interest.
References
- Ambati, A.; Dubey, S.R. Ac-covidnet: Attention guided contrastive cnn for recognition of COVID-19 in chest x-ray images. In Proceedings of the International Conference on Computer Vision and Image Processing, Punjab, India, 3–5 December 2021; pp. 71–82. [Google Scholar]
- Russo, P. (Ed.) Handbook of X-Ray Imaging: Physics and Technology; CRC Press: Boca Raton, FL, USA, 2017. [Google Scholar]
- Nasser, A.A.; Akhloufi, M. Chest diseases classification using cxr and deep ensemble learning. In Proceedings of the 19th International Conference on Content-Based Multimedia Indexing, Graz, Austria, 14–16 September 2022; pp. 116–120. [Google Scholar]
- Qin, C.; Yao, D.; Shi, Y.; Song, Z. Computer-aided detection in chest radiography based on artificial intelligence: A survey. Biomed. Eng. Online 2018, 17, 113. [Google Scholar] [CrossRef]
- Blake, S.R.; Das, N.; Tadepalli, M.; Reddy, B.; Singh, A.; Agrawal, R.; Chattoraj, S.; Shah, D.; Putha, P. Using artificial intelligence to stratify normal versus abnormal chest X-rays: External validation of a deep learning algorithm at East Kent Hospitals University NHS Foundation Trust. Diagnostics 2023, 13, 3408. [Google Scholar] [CrossRef]
- Nasser, A.A.; Akhloufi, M.A. Deep learning methods for chest disease detection using radiography images. SN Comput. Sci. 2023, 4, 388. [Google Scholar] [CrossRef]
- Anderson, P.G.; Tarder-Stoll, H.; Alpaslan, M.; Keathley, N.; Levin, D.L.; Venkatesh, S.; Bartel, E.; Sicular, S.; Howell, S.; Lindsey, R.V.; et al. Deep learning improves physician accuracy in the comprehensive detection of abnormalities on chest X-rays. Sci. Rep. 2024, 14, 25151. [Google Scholar] [CrossRef]
- Khan, E.; Rehman, M.Z.U.; Ahmed, F.; Alfouzan, F.A.; Alzahrani, N.M.; Ahmad, J. Chest X-ray classification for the detection of COVID-19 using deep learning techniques. Sensors 2022, 22, 1211. [Google Scholar] [CrossRef]
- Oltu, B.; Güney, S.; Yuksel, S.E.; Dengiz, B. Automated classification of chest X-rays: A deep learning approach with attention mechanisms. BMC Med. Imaging 2025, 25, 71. [Google Scholar]
- Ibrahim, A.U.; Ozsoz, M.; Serte, S.; Al-Turjman, F.; Yakoi, P.S. Pneumonia classification using deep learning from chest X-ray images during COVID-19. Cogn. Comput. 2024, 16, 1589–1601. [Google Scholar] [CrossRef] [PubMed]
- El Asnaoui, K.; Chawki, Y.; Idri, A. Automated methods for detection and classification pneumonia based on x-ray images using deep learning. In Artificial Intelligence and Blockchain for Future Cybersecurity Applications; Springer International Publishing: Cham, Switzerland, 2021; pp. 257–284. [Google Scholar]
- Sharma, S.; Guleria, K. A deep learning based model for the detection of pneumonia from chest X-ray images using VGG-16 and neural networks. Procedia Comput. Sci. 2023, 218, 357–366. [Google Scholar] [CrossRef]
- Jaiswal, A.K.; Tiwari, P.; Kumar, S.; Gupta, D.; Khanna, A.; Rodrigues, J.J. Identifying pneumonia in chest X-rays: A deep learning approach. Measurement 2019, 145, 511–518. [Google Scholar] [CrossRef]
- Rahman, T.; Chowdhury, M.E.; Khandakar, A.; Islam, K.R.; Islam, K.F.; Mahbub, Z.B.; Kadir, M.A.; Kashem, S. Transfer learning with deep convolutional neural network (CNN) for pneumonia detection using chest X-ray. Appl. Sci. 2020, 10, 3233. [Google Scholar] [CrossRef]
- Stephen, O.; Sain, M.; Maduh, U.J.; Jeong, D.U. An efficient deep learning approach to pneumonia classification in healthcare. J. Healthc. Eng. 2019, 2019, 4180949. [Google Scholar] [CrossRef]
- Goyal, S.; Singh, R. Detection and classification of lung diseases for pneumonia and Covid-19 using machine and deep learning techniques. J. Ambient Intell. Humaniz. Comput. 2023, 14, 3239–3259. [Google Scholar] [CrossRef]
- Manickam, A.; Jiang, J.; Zhou, Y.; Sagar, A.; Soundrapandiyan, R.; Samuel, R.D.J. Automated pneumonia detection on chest X-ray images: A deep learning approach with different optimizers and transfer learning architectures. Measurement 2021, 184, 109953. [Google Scholar] [CrossRef]
- Hussain, E.; Hasan, M.; Rahman, M.A.; Lee, I.; Tamanna, T.; Parvez, M.Z. CoroDet: A deep learning based classification for COVID-19 detection using chest X-ray images. Chaos Solitons Fractals 2021, 142, 110495. [Google Scholar] [CrossRef] [PubMed]
- Jain, D.K.; Singh, T.; Saurabh, P.; Bisen, D.; Sahu, N.; Mishra, J.; Rahman, H. Deep Learning-Aided Automated Pneumonia Detection and Classification Using CXR Scans. Comput. Intell. Neurosci. 2022, 2022, 7474304. [Google Scholar] [CrossRef]
- Priyanka, R.; Gajendran, G.; Boulaaras, S.; Tantawy, S.S. PediaPulmoDx: Harnessing Cutting Edge Preprocessing and Explainable AI for Pediatric Chest X-ray Classification with DenseNet121. Results Eng. 2025, 25, 104320. [Google Scholar]
- Prasath, J.; Prabu, S.; Mayil, V.V.; Saini, S. Optimized double transformer residual super-resolution network-based X-ray images for classification of pneumonia identification. Knowl.-Based Syst. 2025, 311, 113037. [Google Scholar]
- Shati, A.; Hassan, G.M.; Datta, A. A comprehensive fusion model for improved pneumonia prediction based on KNN-wavelet-GLCM and a residual network. Intell. Syst. Appl. 2025, 26, 200492. [Google Scholar] [CrossRef]
- Randieri, C.; Perrotta, A.; Puglisi, A.; Grazia Bocci, M.; Napoli, C. CNN-Based Framework for Classifying COVID-19, Pneumonia, and Normal Chest X-Rays. Big Data Cogn. Comput. 2025, 9, 186. [Google Scholar] [CrossRef]
- Gaudêncio, A.S.; Carvalho, M.; Vaz, P.G.; Cardoso, J.M.; Humeau-Heurtier, A. Tuberculosis detection on chest X-rays using two-dimensional multiscale symbolic dynamic entropy. Biomed. Signal Process. Control 2026, 111, 108346. [Google Scholar] [CrossRef]
- Samee, N.A.; Houssein, E.H.; Saber, E.; Hu, G.; Wang, M. Integrated Deep learning-based IRACE and Convolutional Neural Networks for Chest X-ray Image Classification. Knowl.-Based Syst. 2025, 329, 114293. [Google Scholar] [CrossRef]
- Radočaj, P.; Radočaj, D.; Martinović, G. Optimizing Convolutional Neural Network Architectures with Optimal Activation Functions for Pediatric Pneumonia Diagnosis Using Chest X-Rays. Big Data Cogn. Comput. 2025, 9, 25. [Google Scholar] [CrossRef]
- Deepak, G.D.; Bhat, S.K. A multi-stage deep learning approach for comprehensive lung disease classification from x-ray images. Expert Syst. Appl. 2025, 277, 127220. [Google Scholar] [CrossRef]
- Kermany, D.S.; Goldbaum, M.; Cai, W.; Valentim, C.C.; Liang, H.; Baxter, S.L.; McKeown, A.; Yang, G.; Wu, X.; Yan, F.; et al. Identifying medical diagnoses and treatable diseases by image-based deep learning. Cell 2018, 172, 1122–1131. [Google Scholar] [CrossRef] [PubMed]
- Sandler, M.; Howard, A.; Zhu, M.; Zhmoginov, A.; Chen, L.C. MobileNetV2: Inverted Residuals and Linear Bottlenecks. In Proceedings of the IEEE Conference on Computer Vision and Pattern Recognition (CVPR), Salt Lake City, UT, USA, 18–23 June 2018. [Google Scholar]
- Simonyan, K.; Zisserman, A. Very Deep Convolutional Networks for Large-Scale Image Recognition. In Proceedings of the International Conference on Learning Representations (ICLR), Banff, AB, Canada, 14–16 April 2014. [Google Scholar]
- He, K.; Zhang, X.; Ren, S.; Sun, J. Deep Residual Learning for Image Recognition. In Proceedings of the IEEE Conference on Computer Vision and Pattern Recognition (CVPR), Las Vegas, NV, USA, 27–30 June 2016. [Google Scholar]
- Szegedy, C.; Vanhoucke, V.; Ioffe, S.; Shlens, J.; Wojna, Z. Rethinking the Inception Architecture for Computer Vision. In Proceedings of the IEEE Conference on Computer Vision and Pattern Recognition (CVPR), Las Vegas, NV, USA, 27–30 June 2016. [Google Scholar]
- Chollet, F. Xception: Deep Learning with Depthwise Separable Convolutions. In Proceedings of the IEEE Conference on Computer Vision and Pattern Recognition (CVPR), Honolulu, HI, USA, 21–26 July 2017. [Google Scholar]
- Huang, G.; Liu, Z.; Van Der Maaten, L.; Weinberger, K.Q. Densely Connected Convolutional Networks. In Proceedings of the IEEE Conference on Computer Vision and Pattern Recognition (CVPR), Honolulu, HI, USA, 21–26 July 2017. [Google Scholar]
- Zoph, B.; Vasudevan, V.; Shlens, J.; Le, Q.V. Learning Transferable Architectures for Scalable Image Recognition. In Proceedings of the IEEE Conference on Computer Vision and Pattern Recognition (CVPR), Salt Lake City, UT, USA, 18–23 June 2018. [Google Scholar]


Disclaimer/Publisher’s Note: The statements, opinions and data contained in all publications are solely those of the individual author(s) and contributor(s) and not of MDPI and/or the editor(s). MDPI and/or the editor(s) disclaim responsibility for any injury to people or property resulting from any ideas, methods, instructions or products referred to in the content. |
© 2025 by the authors. Licensee MDPI, Basel, Switzerland. This article is an open access article distributed under the terms and conditions of the Creative Commons Attribution (CC BY) license (https://creativecommons.org/licenses/by/4.0/).