Abstract
Distributed acoustic sensing (DAS) systems enable real-time monitoring of physical events across extended areas using optical fiber that detects vibrations through changes in backscattered light patterns. In perimeter security applications, these systems must accurately distinguish between legitimate activities and potential security threats by analyzing complex spatio-temporal data patterns. However, the high dimensionality and noise content of raw DAS data presents significant challenges for effective feature extraction and event classification, particularly when computational efficiency is required for real-time deployment. Traditional approaches or current machine learning methods often struggle with the balance between information preservation and computational complexity. This study addresses the critical need for efficient and accurate feature extraction methods that can identify informative signal components while maintaining real-time processing capabilities in DAS-based security systems. Here we show that wavelet packet decomposition (WPD) combined with a cascaded machine learning approach achieves 98% classification accuracy while reducing computational load through intelligent channel selection and preliminary filtering. Our modified peak signal-to-noise ratio metric successfully identifies the most informative frequency bands, which we validate through comprehensive neural network experiments across all possible WPD channels. The integration of principal component analysis with logistic regression as a preprocessing filter eliminates a substantial portion of non-target events while maintaining high recall level, significantly improving upon methods that processed all available data. These findings establish WPD as a powerful preprocessing technique for distributed sensing applications, with immediate applications in critical infrastructure protection. The demonstrated gains in computational efficiency and accuracy improvements suggest broad applicability to other pattern recognition challenges in large-scale sensor networks, seismic monitoring, and structural health monitoring systems, where real-time processing of high-dimensional acoustic data is essential.
1. Introduction
Recent perimeter security for critical infrastructure requires reliable, real-time detection and classification of events over long distances. Fiber-optic distributed acoustic sensing (DAS) is well suited to this task because a single optical fiber acts as a dense array of sensors, allowing continuous monitoring with high sensitivity, dense spatial resolution, and robustness to environmental conditions [1]. The operating principle of DAS relies on Rayleigh backscattering from microscopic refractive-index fluctuations along an optical fiber [2]. External perturbations such as strain or vibration modulate the fiber’s optical path length, imprinting phase and amplitude changes in the backscattered field. By coherently demodulating the amplitude and phase relative to the launched pulse, a spatially resolved backscatter profile along the fiber is reconstructed, enabling the detection, localization, and classification of events occurring along the fiber. In addition to perimeter security, DAS technology has found extensive application in various other domains [3], such as seismology [4] and structural health monitoring [5,6].
Extracting informative features from raw DAS data is a critical step in the processing pipeline to discriminate between event types such as human movement, vehicle activity, and attempted unauthorized actions near the sensor. Reflectograms captured by these systems contain detailed spatio-temporal information that characterizes the observed events. However, robust feature extraction is challenged by nonstationary and environmental noise [7], variability in signal propagation conditions, and the wide diversity of event signatures [8]. Several approaches have been proposed to suppress noise in DAS measurements. Frequency-domain methods based on Fourier transform decompose signals into task-specific spectral bands guided by the underlying physics and application requirements [9]. Another common strategy for reducing the noise in raw data is to apply machine learning models, including convolutional and recurrent neural networks and support vector machines [8,10,11]. These models effectively learn complex characteristic features from raw data, suppressing noise in the resulting representation and enhancing event classification accuracy. Previously, we showed that semi-supervised learning can substantially improve classification performance in limited datasets when using Fourier-derived features [12].
As an alternative signal processing method, the wavelet transform has significant potential due to its adaptive time-frequency localization and multi-resolution analysis capabilities [13]. Similarly to the Fourier transform, wavelet analysis enables the decomposition of the original signal into frequency-localized components corresponding to different frequency bands. Furthermore, this method achieves substantially reduced temporal resolution compared to the original reflectograms, facilitating a more efficient data representation [14]. Wavelet analysis is a powerful tool for multilevel signal and image processing, providing precise localization of features in both the time and frequency domains. Its application to reflectogram analysis can greatly enhance the quality of feature extraction and increase robustness against noise and variability in event-related signals.
The wavelet transform has been widely used to process data acquired from distributed acoustic sensors. The study [15] investigates the application of one- and two-dimensional wavelet transforms for efficient compression of DAS data. In [16], a complex wavelet transform-based approach was developed to enhance the signal-to-noise ratio while preserving information throughout the full frequency range of the original DAS signals. The works [17,18] explore methods for coherent noise attenuation in seismic datasets using the continuous wavelet transform. Furthermore, ref. [19] propose a hybrid technique that combines wavelet transforms with convolutional neural networks for adaptive noise prediction and suppression tailored to DAS data.
In this study, we propose a novel approach for extracting informative features from distributed acoustic sensor reflectograms using wavelet packet decomposition (WPD) to support event classification in perimeter security applications for critical infrastructure. The methodology decomposes the original reflectogram into multiple spectral channels corresponding to distinct frequency bands, from which only those containing the most relevant information are selected. Although conceptually related to Fourier analysis, WPD offers several advantages, including potentially lower computational complexity, an essential factor for real-time processing under hardware limitations, and greater flexibility in tuning filtering parameters such as the wavelet function and decomposition level. Despite its promise, the application of WPD to DAS signal processing remains underexplored, possessing both significant scientific and practical potential.
To validate the informational value of the selected wavelet channels, we implemented a convolutional neural network for binary classification trained exhaustively on all channels to confirm their relevance using a large experimental dataset from real perimeter security systems. Beyond identifying informative channels, we extract high-level features from the resulting wavelet images that enable the clustering of reflectograms by event class. Using these features, we develop a prefiltering mechanism based on principal component analysis, which effectively highlights key data characteristics, combined with a logistic regression classifier known for its efficiency and interpretability. This cascade approach reduces computational load and improves the overall accuracy of event classification.
2. Methods
2.1. Wavelet Packet Decomposition
Wavelet transforms are well suited to analyzing non-stationary processes [20] and have been widely applied to periodic signal analysis, DAS data processing [14], signal filtering [13], and data compression [21]. In digital signal processing, the discrete wavelet transform implements a two-channel filter bank that splits a signal into low- and high-frequency components, each downsampled by a factor of two relative to the original signal [22].
Wavelet packet decomposition extends the discrete wavelet transform by iteratively applying the two-channel filter bank to both approximation and detail branches. At the decomposition level L, the signal is partitioned into sub-bands, each representing a specific frequency interval within the range from 0 to the Nyquist frequency of the original signal. Due to downsampling at each stage, the sampling rate within each sub-band is reduced by a factor of relative to the original. A schematic example for with an input sampling rate Hz is shown in Figure 1. In this notation, the symbol “a” represents approximation coefficients, while “d” indicates detail coefficients within the wavelet packet tree structure.
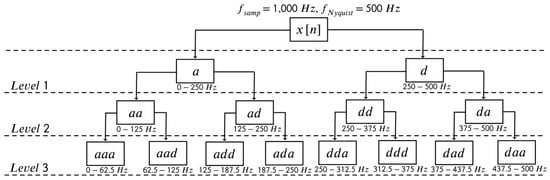
Figure 1.
Decomposition of the discrete signal sampled at Hz into wavelet-packet sub-bands at level . In the diagram, “a” denotes approximation coefficients and “d” denotes detail coefficients.
Since WPD decomposes the original signal into spectral sub-bands or channels with subsequent temporal downsampling, it is well suited for extracting informative features from raw reflectograms. The feature-extraction pipeline applies WPD to the reflectogram, then selects only those sub-bands that carry the most salient information about the recorded event. A detailed description of this procedure follows in the subsequent sections. Although conceptually related to the short-time Fourier transform, WPD offers advantages that are critical for minimizing computational resources required for signal filtering and subsequent processing in real-time operation. In particular, once informative wavelet channels are identified, a reflectogram can be decomposed only along those channels of interest, avoiding a full decomposition into all possible sub-bands.
2.2. PSNR-Based Wavelet Channel Selection
After applying WPD to the raw reflectograms, the next step is to identify the most informative wavelet channels among all the resulting wavelet sub-bands for the subsequent classification task. To quantify channel informativity of the image associated with a given wavelet sub-band, a single-image modification of the peak signal-to-noise ratio (PSNR) is used, a metric widely adopted for image quality and noise assessment [23,24]. Specifically,
where X denotes the image corresponding to a given wavelet channel, and are its maximum and minimum pixel values, and is the sample variance of the pixel intensities. This modified PSNR metric is measured in decibels (dB) and can take values from approximately 6 dB to . The lower bound of the modified PSNR corresponds to an image in which half of the pixels have maximum intensity and the other half of the pixels have minimum intensity. Hereinafter in the study, by the PSNR metric we will mean this modified single-image variant.
If an image X corresponds to an informative wavelet channel, its PSNR value should be markedly higher than that of a non-informative, noisy channel. Informative images tend to contain regions with pixel intensities that are extreme relative to the background, reflecting the presence of a significant event. In other words, for an informative image X, the range substantially exceeds the standard deviation of the pixel values , resulting in a high PSNR(X). In contrast, images from non-informative channels are expected to lack extreme values, with pixel distributions resembling Gaussian noise, and thus exhibit considerably lower PSNR than informative channels.
2.3. Convolutional Neural Network Classifier
To empirically validate the hypothesis of informative channels, a convolutional neural network (CNN) based on the ResNet architecture [25] was employed for binary classification of events. Residual networks are well established for the robust learning of image representation and have demonstrated strong performance in a range of classification tasks [26]. This approach was chosen due to its combination of architectural simplicity and a relatively modest parameter count, which supports stable training and reduces the risk of overfitting compared to more complex or deeper alternatives. Using this model, all wavelet channels were systematically evaluated to identify those that yielded the highest classification accuracy. The input of the neural network comprises images generated by applying WPD to the raw reflectograms. The CNN architecture is presented in Figure A1 and is described in detail in Appendix A.
CNN was implemented using the open-source PyTorch framework (ver. 2.1.0), trained with the Adam optimizer and the binary cross-entropy (BCE) loss function, and supported by the learning-rate scheduler that reduced the learning rate following plateaus in validation loss. To further protect against overfitting, a pruning strategy based on performance on the validation set was employed. Training was conducted for 80 epochs on a GIGABYTE GeForce RTX 4090 WINDFORCE GPU. The model had a total of 2095 trainable parameters. The tuned hyperparameters are summarized in Table A1.
2.4. Prefiltering Pipeline
In this work, we demonstrate that WPD not only facilitates the extraction of informative features from raw reflectograms, but also enables effective clustering of distinct event types based on characteristic wavelet image features. Leveraging these features, we developed a reflectogram filtering method that preemptively discards samples classified as non-target events before processing by the neural network. This preliminary filtering significantly reduces the computational burden on the classifier and contributes to improved overall event classification accuracy. The following subsections provide a detailed description of the data prefiltering methodology applied prior to neural network input for the event classes considered in this study.
2.4.1. Standard Deviation Analysis of Pixel Intensities in Wavelet Channel Images
The methodology outlined in Section 2.2 enables the separation of wavelet channels according to their informativity, facilitating the identification of those channels that capture the core signal structure associated with relevant events. The subsequent analysis focuses on extracting quantitative features from these informative wavelet channels to enable robust classification of specific event types. In this study, our objective is to identify feature representations that best discriminate reflectograms assigned to target class 1 (human_digging = True) from those assigned to non-target class 0 (human_digging = False).
To develop a data filtering strategy tailored to specific event types, it is essential to identify which characteristics of the wavelet channel images effectively distinguish representatives of the target class from those of the non-target class. In this work, the filtering algorithm was designed based on the standard deviation (STD) of pixel intensities within the wavelet channel images, as this quantity reflects the energy deviation from the mean and serves as a discriminative statistical feature [14,27]. Given that wavelet images from different event classes correspond to distinct physical interactions with the DAS, the energy distributions captured by these images are expected to vary accordingly. To illustrate these differences, Figure 2 depicts histograms of the standard deviation of pixel intensities for several wavelet channels, computed across the entire training dataset and shown separately for the two considered classes. Quantitative comparison of class-specific distributions was performed using the Jensen-Shannon Divergence (JSD) metric [28], which ranges from 0 to 1 and increases with the dissimilarity between distributions. As shown in Figure 2, some wavelet channels exhibit pronounced differences in standard deviation distributions between the two classes, whereas other channels show less differentiation.
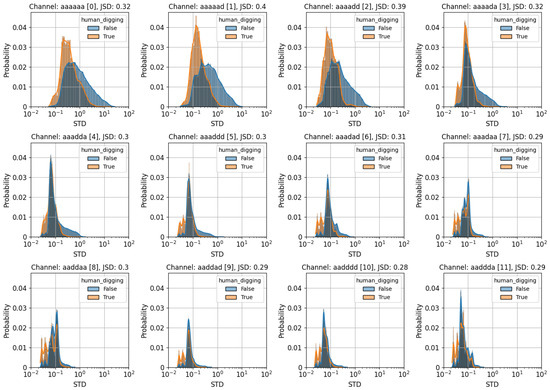
Figure 2.
Histograms of pixel intensity standard deviation for selected wavelet channels, computed separately for classes 0 and 1. JSD metric quantifies the difference between the two class distributions.
2.4.2. Principal Component Analysis and Logistic Regression
Principal component analysis (PCA) is a widely used data preprocessing technique that identifies the main directions of variability within multivariate datasets, allowing dimensionality reduction, noise suppression, and the discovery of intrinsic data structures. These enhancements often lead to improved performance of subsequent machine learning models [29,30]. Using the significant dimensionality reduction afforded by PCA, we employed a logistic regression model to perform binary classification of events [31]. Logistic regression, a fundamental statistical method for predicting binary outcomes, is widely used in various domains such as medicine [32] and marketing [33] due to its simplicity and interpretability. The logistic regression model is mathematically expressed as follows:
where is the predicted pseudoprobability of the target class (human_digging), ranging from 0 to 1, are input features derived from the reflectogram, are the model parameters, and denotes the sigmoid function.
2.4.3. Overall Classification Workflow
To implement the preliminary reflectogram filtering algorithm, PCA was integrated with logistic regression to form an effective classification pipeline. This overall workflow, which combines PCA-based dimensionality reduction with subsequent binary classification via logistic regression, is illustrated in Figure 3 and is shown as a sequential list below.
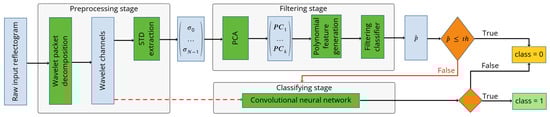
Figure 3.
Event classification workflow with preliminary filtering prior to neural network input. —standard deviation of pixel intensities for wavelet channel i, —j-th principal component extracted from the standard deviation features, Filtering classifier—logistic regression-based classifier producing prediction , —probability threshold, class—predicted binary class of the input reflectogram.
- Application of WPDThe input reflectogram is decomposed using WPD to generate multiple wavelet channels representing different frequency sub-bands.
- Selection of input features for PCAThe standard deviations of pixel intensities are extracted as a feature vector () from N wavelet channels.
- Application of PCAPCA is applied to reduce the dimensionality of the N-dimensional feature vector into a set of k principal components () with k varied between 1 and to optimize the representational fidelity.
- Polynomial feature generationPolynomial features up to degree m are generated based on the principal components. The degree m is a variable value. For example, with and , the feature set includes .
- Classification via logistic regressionThe polynomial features form the input to the logistic regression-based filtering classifier, which outputs a pseudoprobability .
- Preliminary filtering using thresholdReflectograms with the classifier output , where is a predefined threshold, are classified as non-target (class 0) and filtered out, bypassing further processing. This step rapidly excludes a portion of the events, reducing computational demand on the subsequent CNN classifier.
- Final classification using CNNReflectograms with undergo further analysis by CNN described previously, which produces the final classification decision.
During the training of the logistic regression model, a class weighting parameter w was introduced to balance the influence of the target class relative to the non-target class within the loss function. This weight was incorporated into the computation of the BCE loss, effectively penalizing misclassifications of the minority class more heavily. Adjusting w enables the optimization of the prefiltering classifier to achieve a high recall for the target events while maintaining effective rejection of non-target samples. In this study, w was tuned over a wide range, spanning ratios from 1:1 to 800:1, to identify the optimal balance that preserves sensitivity to target events without excessive false positives.
2.4.4. Performance Metrics for Preliminary Filtering
The performance of the preliminary filtering stage was primarily evaluated using the Recall metric, which quantifies the proportion of correctly identified target-class events relative to the total number of target-class events. In the context of perimeter security systems, a high Recall is critical, as it ensures that the vast majority of potentially hazardous human-digging events near the protected perimeter are detected, minimizing missed detections (false negatives). This is particularly important given that the cost associated with false negatives greatly exceeds that of false positives in such applications. Mathematically, Recall is defined as:
where True Positive denotes the number of target-class events correctly classified, and Total Positive represents the total number of actual target-class events in the dataset. The Recall metric ranges from 0 to 1.
Additionally, the DropRate metric was used during classifier training to assess the proportion of events discarded at the preliminary filtering stage. DropRate is calculated as the ratio of events classified as non-target (class 0) to the total number of events in the dataset. It also ranges between 0 and 1, with higher values indicating a greater data reduction achieved before more computationally intensive processing.
2.4.5. Hyperparameter Optimization
Using the Recall and DropRate metrics, the hyperparameter tuning of the filtering classifier was formulated as an optimization problem: the objective is to maximize the DropRate while constraining Recall to a fixed, acceptable level. This strategy aims to discard the maximum number of non-target events before forwarding data to the neural network, without significantly compromising the retention of target-class events.
The hyperparameters under consideration include the number of principal components k, the degree of polynomial feature expansion m, and the target class weight w. For fixed values of k, m, and w, the classification threshold is varied within the interval . For each , the corresponding DropRate and Recall metrics of the trained classifier are computed, enabling the construction of a DropRate-Recall curve.
Introducing the DropRate-Recall Area Under the Curve (DRR AUC) metric, defined as the area under the DropRate-Recall curve, allows reformulating the optimization problem of maximizing DropRate at a fixed Recall as the maximization of the DRR AUC metric within a fixed Recall range. In this study, the hyperparameters of the filtering classifier were optimized by maximizing the DRR AUC. Using this integral metric enables a more comprehensive and precise selection of hyperparameters, improving the overall filtering performance of the model.
3. Experimental Setup
3.1. Interrogator Description
The dataset was collected from four independent operational perimeter security systems located in different regions using the distributed acoustic sensor “Dunay”, developed by T8 LLC. A schematic of the experimental setup is shown in Figure 4 and is described in detail in [34], which outlines the signal acquisition system and the phase-based analysis of dynamic deformation along the optical fiber. In the DAS system, probe pulses are generated from the continuous-wave output of a narrow-linewidth, single-frequency laser operating at a wavelength of 1550 nm using an optical modulator. These pulses are subsequently amplified by an erbium-doped fiber amplifier (EDFA) booster. The pulse repetition rate was 1 kHz, and the pulse duration was 200 ns, resulting in an effective spatial resolution of approximately 20 m, considering the correlation between adjacent measurements. The DAS utilizes a fiber line made of standard single-mode fiber, supporting sensor lengths of up to 60 km. The backscattered optical signal is routed through an optical circulator to the input of an EDFA preamplifier for additional signal amplification. After amplification, the optical signal passes through an optical filter and is directed into a coherent receiver, where it is detected by photodetectors connected to analog-to-digital converters. The resulting digital signal is then processed by a field-programmable gate array (FPGA) within the digital signal processing unit. The raw signal acquired from the device consists of waveforms recorded with a spatial sampling step of 1.6 m along the fiber at the FPGA output.
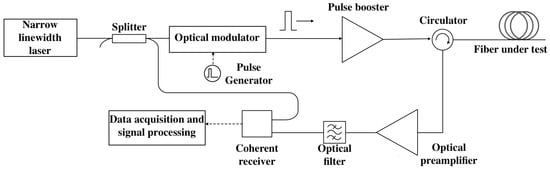
Figure 4.
Scheme of the experimental setup.
3.2. Dataset Overview
The raw reflectograms are stored as two-dimensional arrays of size 6400 × 128 pixels, where 128 represents the number of virtual sensors along the fiber (204.8 m), and 6400 corresponds to the number of temporal samples recorded by each sensor. The sampling frequency is 1000 Hz, resulting in a total recording duration of 6.4 s. Figure 5 presents two example fragments of a reflectogram represented as 300 × 128 pixel images (bottom), together with the complete reflectogram of size 6400 × 128 pixels (top). For model development and evaluation, the entire dataset was partitioned into training, validation and test subsets containing 126,014, 25,278, and 13,095 reflectograms, respectively.
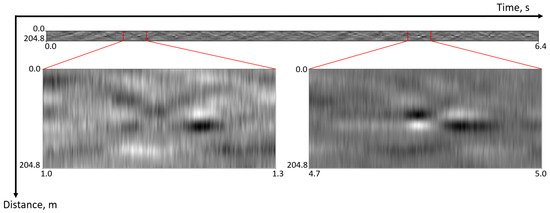
Figure 5.
Fragments of the raw reflectogram with a size of 300 × 128 pixels (bottom) and the complete raw reflectogram with a size of 6400 × 128 pixels (top).
The events represented in the raw reflectograms were assigned to one of three classes: human_digging, human_step, and noise. In this study, the task is formulated as a binary classification problem, with the human_digging class defined as the target. Thus, the objective for each reflectogram is to determine whether the recorded event corresponds to human_digging or not. The training, validation, and test subsets exhibit an approximate target-to-non-target sample ratio of 1:9, corresponding to a target class proportion of 10% in each subset.
3.3. Dataset Preprocessing Using WPD
The WPD with a decomposition level of was applied independently to all raw reflectogram images, using the Daubechies wavelet db12 as the basis function [20,35]. The transform was performed separately on each sensor’s time series of length 6400 samples. The choice of decomposition level was determined empirically to balance the reduction in dimensionality with the retention of informative features after compression, thus providing a detailed representation of the events analyzed in this study, such as human steps and digging. The db12 wavelet was selected for its broad applicability in signal and image processing [36], as well as for the high smoothness of its scaling function, which enhances its suitability for the analysis of complex non-stationary signals.
Applying the WPD to a single reflectogram of size 6400 × 128 pixels results in a three-dimensional data array of size 64 × 122 × 128, where denotes the number of wavelet channels at the chosen decomposition level, 122 represents the length of the time series for a single sensor after transformation, and 128 is the total number of sensors along the fiber, unchanged from the original data. For clarity, the WPD procedure with db12 basis wavelet is illustrated in Figure 6. Note that the length of the time series in each channel does not reduce exactly by a factor of 64 due to symmetric padding applied during filtering.
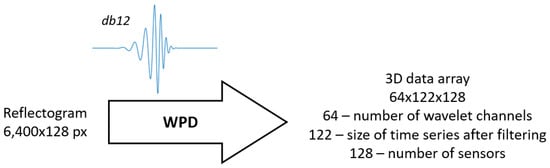
Figure 6.
Scheme of WPD application with the db12 basis wavelet to the raw data.
For illustration, Figure 7 demonstrates images corresponding to wavelet channels within the 19.5–43.0 Hz frequency band, shown separately for representative samples of each event class.
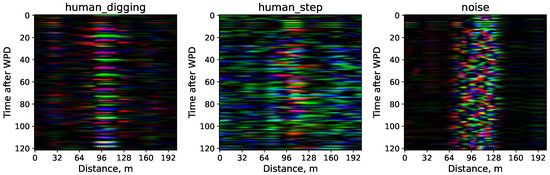
Figure 7.
Images of reflectograms from different event classes corresponding to wavelet channels within the frequency range of 19.5–43.0 Hz. Each image size is pixels. The noise class reflects static noise without significant event activity.
4. Results
4.1. Wavelet Channel Informativity Analysis
To quantitatively assess and rank the informativity of individual wavelet channels, we used the modified peak signal-to-noise ratio metric introduced in Section 2.2 in the Methods section. This metric was calculated for all 126,014 reflectograms in the training dataset, evaluating each of the 64 wavelet channels obtained from the WPD preprocessing. The PSNR values, averaged over the entire training set, are presented in Figure 8, with separate averages calculated for each of the two classes. The horizontal axis of the plot represents the indices of the 64 wavelet channels ordered by their increasing central frequencies, while the vertical axis denotes the corresponding PSNR values. To illustrate variability, the plot also indicates the standard deviation of these values in the dataset.
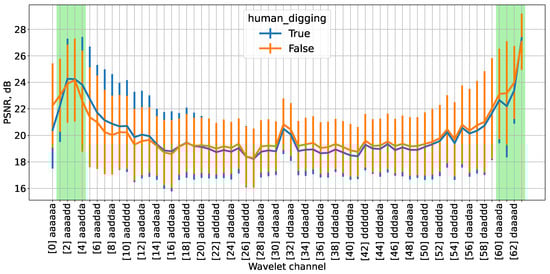
Figure 8.
PSNR metric for reflectograms in the training dataset across 64 wavelet channels. The x-axis indicates the wavelet channel indices ordered by increasing central frequency. Notation: “a”—approximation coefficient, “d”—detail coefficient, “True”—target class, “False”—non-target class. Channels identified as potentially informative according to the proposed methodology are highlighted in green.
The central frequencies of the wavelet channels are distributed as follows: the lowest-frequency channel, denoted as “”, corresponds to approximately 3.9 Hz, followed by the “” channel at 11.7 Hz. Subsequently, the central frequency increases in steps of roughly 7.8 Hz between adjacent channels. This step size corresponds to half of the sampling frequency of the signal after WPD, reflecting the downsampling inherent in the process. The highest-frequency channel, denoted as “”, has a central frequency near 496.1 Hz, consistent with the Nyquist frequency of 500 Hz given the system sampling rate.
Based on the obtained results, the wavelet channels identified as potentially informative according to our proposed hypothesis, those for which the PSNR metric reaches the highest values, are highlighted in green in Figure 8. These correspond primarily to the low-frequency channels indexed 1 through 4 and the high-frequency channels indexed 60 through 63. From a physical perspective, the key information related to the events studied (human steps and digging) is expected to reside in the low-frequency range, which is confirmed by the elevated PSNR values observed for these channels. In contrast, high-frequency bands are typically dominated by noise-like signals and are not expected to provide substantial event-related information. However, the elevated PSNR values in high-frequency channels, as shown in Figure 8, appear to contradict this expectation. Upon further investigation, we determined that this phenomenon arises from the characteristics of finite impulse response digital filters—specifically, the wavelet filters employed in this study—and is attributable to their non-ideal frequency response. A comprehensive explanation of this effect is provided in Appendix B. In accordance with physical principles high-frequency channels exhibiting anomalously high PSNR values were excluded from subsequent analyzes, focusing instead on the low-frequency wavelet channels.
4.2. Effect of Wavelet Channel Selection on CNN Classification
Building on the architecture of the convolutional neural network classifier described in the Methods section (Section 2.3), we initially trained the CNN for event classification using a single wavelet channel. In this configuration, the network input comprised images derived from a fixed number of wavelet channels (see Figure A1). Consistent with previous channel selection criteria, high-frequency wavelet channels were excluded, restricting the evaluation to the first 32 channels. The performance of the model was quantitatively assessed using classification accuracy in both validation and test datasets. The single-channel training results are presented in Figure 9, where the wavelet channel indices from 0 to 31 correspond to increasing central frequencies. The analysis reveals that channels indexed 1 through 6 yield the highest classification accuracy, corroborating the channel informativity rankings based on the PSNR metric.
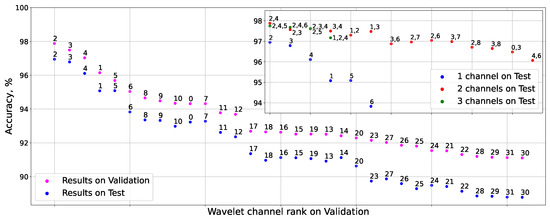
Figure 9.
Classification accuracy of the neural network on the validation and test sets when trained using a single wavelet channel. The inset (upper right corner) depicts the improvement in test set accuracy as the number of input wavelet channels increases from one to three. Data points correspond to wavelet channels indexed by increasing central frequency.
Subsequently, the neural network was trained using two and three wavelet channels. The inset in Figure 9 illustrates the corresponding increase in classification accuracy on the test set as the number of input channels increases from one to three. The results demonstrate a substantial improvement in binary classification accuracy when expanding from one to two wavelet channels, followed by a comparatively modest gain when increasing from two to three channels. Notably, the highest test set accuracy of 97.88% was achieved using wavelet channels (2, 4), as depicted in Figure 9, indicating that informative content from additional channels may be partially redundant or less relevant to the classification task. These results further validate the informativity of the wavelet channels identified through the PSNR-based analysis.
Based on our experiments, we anticipate that including more than three channels would lead to only minor variations in classification accuracy, typically within the margin of error for the model. Furthermore, increasing the number of input channels complicates the model training process, especially if the new features do not contain additional information. In such cases, adding uninformative features can lead to a deterioration in model quality or maintain it at the same level. Additionally, features without meaningful information increase the risk of retaining noisy and uninformative data, which negatively impacts the model’s generalization ability. In practical terms, we advise careful selection and limitation to only the most informative channels to optimize both performance and computational efficiency.
4.3. Prefiltering Effectiveness
As discussed within Section 2.4, this study aims to demonstrate that WPD not only facilitates the extraction of highly informative features from raw reflectograms, but also enables the effective clustering of distinct event types based on the characteristic patterns in the resulting wavelet image representations. Using these discriminative wavelet image features, we implemented a reflectogram filtering mechanism designed to preemptively exclude samples identified as non-target events prior to their processing by the CNN classifier. This hierarchical approach substantially alleviates the computational burden imposed on the classification model, thereby improving operational efficiency without compromising detection sensitivity. Furthermore, the integration of this preliminary filtering step contributes to the improved overall accuracy of event classification. This subsection details the experimental evaluation and quantitative analysis of the applied data filtering process performed before neural network classification for the specific event classes investigated in this study.
The preliminary filtering classifier was successfully trained and validated on the available dataset. The degree m ranges from 1 to 5 with k between 1 and 9. To illustrate its performance, Figure 10a presents the result of the filtering on the test set after training, where the number of principal components was set at and the degree of polynomial features at . The highlighted region in the plot corresponds to the area classified as belonging to the target class 1. The model demonstrates robust clustering of the two classes, achieving a DropRate of 0.207 along with an exceptionally high Recall value of 0.998, indicating that nearly all target events were correctly identified. Furthermore, Figure 10b shows the distribution of the test data in the four different recording stations. Notably, data from Stations 3 and 4 form a clearly separated cluster relative to those from Stations 1 and 2. This separation is attributable to the differing environmental conditions at Stations 3 and 4, despite the overall cluster shapes maintaining similar characteristics across all stations.
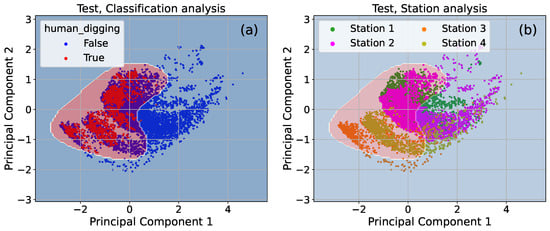
Figure 10.
Operation of the prefiltering mechanism applied to the test set with the number of components and the polynomial feature degree . The plot highlights the region classified as the target class human_digging. Performance metrics for this configuration are , . (a) Clustering of events using the preliminary filtering mechanism for the test set. (b) Data distribution across the four recording stations for the test set.
During the training of the filtering classifier, the optimal hyperparameter configuration was identified as principal components, polynomial feature degree , and a target class weight ratio of . Detailed descriptions of the training procedure, along with a presentation of the results and the DRR AUC metric values corresponding to various hyperparameter settings, are provided in Appendix C.
The cascade model, which integrates a preliminary filtering stage followed by a CNN classifier (see Figure 3), was effectively applied to the binary classification task. Table 1 provides a comparative overview of the classification accuracies achieved by the baseline model without prefiltering and the proposed cascade model across both validation and test datasets utilizing two selected wavelet channels. The introduction of the prefiltering stage consistently enhances predictive accuracy, with improvements reaching up to 0.68% depending on the specific wavelet channels employed. In particular, the greatest gains are observed in channels that initially exhibited lower classification performance. The combination of wavelet channels (2, 4) continues to yield the highest test accuracy of 98.03%, representing an incremental improvement of 0.15% relative to the baseline approach. Additionally, Table 1 gives an overview of the values of other common classification metrics for the cascade model on the test set. As can be seen, the combination of channels (2, 4) demonstrates the highest values for almost all the presented metrics, especially for the Recall score which is crucial for the perimeter security problem. These results substantiate the efficiency of the prefiltering mechanism in reducing computational complexity while simultaneously increasing the robustness of classification.

Table 1.
Improvement of binary classification accuracy on two selected wavelet channels when using the cascade model compared to the baseline model on the validation set and other binary classification metrics for the cascade model on the test set. The best values for each metric are highlighted in bold.
As demonstrated in Figure 10b, the data from different stations display distinct clustering patterns in the PCA space, reflecting variations in signal characteristics likely due to environmental and operational factors. Although the current study focuses on establishing the wavelet channel selection method and the overall classification framework, systematic domain adaptation techniques could further uniform feature distributions across nonuniform stations. A promising future direction is to explore transformations such as per-channel scaling or normalization in the wavelet or PCA feature space to align distributions across sites, thereby enhancing model robustness and generalizability.
4.4. Computational Efficiency Improvements
To evaluate improvements in computational efficiency, we performed additional benchmarking experiments to quantitatively assess the impact of pre-filtering on inference performance using practical metrics. Through these experiments, we measured the throughput of the baseline CNN-based approach and our proposed cascade model in terms of frames per second (FPS) across a range of batch sizes, utilizing the entire training dataset. All benchmarks were performed under controlled conditions on an Intel Core i5-12600K CPU (10 cores, 16 threads, maximum frequency 4.9 GHz), with careful CPU warm-up and cache reset procedures prior to measurement. As illustrated in Figure 11, the cascade model consistently achieves a significant throughput advantage compared to the baseline, with an average speedup factor of approximately 1.6. This demonstrates a clear reduction in computational load and inference time per sample due to early event rejection in the prefiltering stage, without compromising classification accuracy.
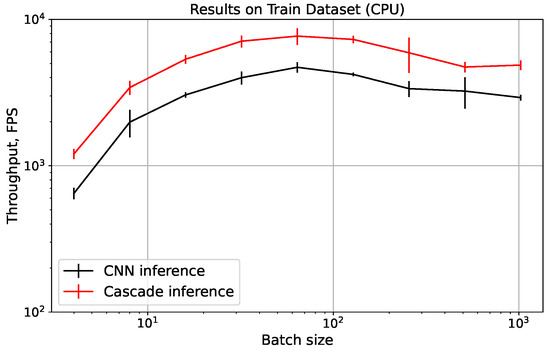
Figure 11.
The improvement in throughput achieved by the cascade model compared to the CNN model on the training dataset. The variation in values corresponds to three standard deviations within a set of 10 measurements.
5. Discussion
Regarding physical interpretation, as noted in Section 4.1, the dominance of low-frequency channels in the WPD is physically consistent with the characteristic frequency content of key events such as human footsteps and digging, which generate predominantly low-frequency vibrations detectable by the distributed acoustic sensor. High-frequency channels exhibit elevated PSNR values due to non-ideal filter responses inherent in wavelet filter banks, resulting in artifacts that do not correspond to meaningful event-related information. These filter-induced high-frequency deviations underscore the importance of careful channel selection to mitigate the influence of spurious spectral components. Employing enhanced metrics that incorporate underlying physical models or applying more sophisticated modifications to the PSNR calculation could further attenuate such artifacts, thereby refining the distinction between informative and non-informative channels. This consideration is critical to accurately capture event-relevant information.
From a practical standpoint, the selective decomposition of DAS reflectograms along informative wavelet channels gives significant advantages under real-time processing constraints common in perimeter security applications. By restricting computational efforts to a subset of channels containing pertinent event information, the proposed method substantially reduces processing latency and resource consumption. This selective WPD approach addresses the challenges of limited hardware resources, enabling deployment in operational environments that require prompt and reliable event detection. Importantly, the practicability of performing partial WPD without exhaustively computing the entire channel set offers a direct way to scalable real-time implementations. These efficiencies are crucial for maintaining high-throughput monitoring over extended fiber optic sensor arrays.
It should be recognized that the variability in environmental and operational conditions between the four recording stations manifested in clustering differences, reflecting the influence of site-specific factors on the characteristics of the DAS signal. Such station-to-station variability poses challenges to model generalization and may necessitate adaptive calibration or transfer learning for robust cross-site applicability. Furthermore, the inherent class imbalance present in the dataset (favoring non-target events) requires careful tuning of classification thresholds and weighting during model training to prioritize event recall. The trained models demonstrated high recall, but may still face difficulty in generalizing to entirely novel sensing locations or event types absent from the training data. Future robustness evaluations should include expanded datasets over diverse geographic and seasonal conditions.
While our current framework is developed and validated for binary classification tasks, we acknowledge that real-world DAS applications often require multi-class classification to distinguish among multiple event types with potentially overlapping frequency characteristics. To address this, we propose a strategy that decomposes the multi-class problem into multiple binary classification tasks, treating each target class independently against all other classes. This approach enables the identification of class-specific informative wavelet channels and facilitates training dedicated neural network models optimized for each event type. Subsequently, predictions from these specialized models can be aggregated to deliver a final multi-class decision regarding the detected event. This modular framework offers scalability and flexibility in handling diverse and overlapping spectral features across events.
Regarding possible future research, to further enhance classification performance, fine-tuning the convolutional neural network on datasets preprocessed via the proposed preliminary filtering method offers a promising avenue for improved feature refinement. Investigating ensemble frameworks where the preliminary classifier and neural network operate concurrently rather than sequentially may yield synergistic accuracy gains. Additionally, advanced data augmentation strategies informed by the physical characteristics of DAS signals can enhance model robustness and reduce overfitting [37,38,39]. Another area of perspective lies in detailed reflectogram clustering based on station-specific signal variabilities, including exploring transformations that map data distributions between sites to facilitate higher-level feature extraction and dataset expansion. Such approaches may contribute to enhanced detection capabilities and broader operational adaptability in large-scale distributed sensing networks.
6. Conclusions
This work demonstrates the efficiency of wavelet packet decomposition as a preprocessing technique for distributed acoustic sensing in perimeter security applications. The proposed methodologies, including novel reflectogram WPD-based processing strategies, modified peak signal-to-noise ratio channel selection, and a convolutional neural network classifier, collectively achieve substantial dimensionality reduction while retaining the most significant features for robust event recognition. The CNN-based model yielded a classification accuracy of up to 97.88% on the experimental dataset from four operational perimeter security systems, effectively validating the informativity rankings obtained via the PSNR metric for wavelet channels.
Another key contribution of this study is the introduction of a multi-stage data filtering approach. By constructing high-level features using statistical properties of the wavelet-domain representations and implementing a prefiltering step using principal component analysis and logistic regression, a portion of non-discriminative samples was excluded prior to computationally intensive neural network inference. This led to measurable improvements in classification performance, especially for more challenging wavelet channel combinations, with the highest recorded test accuracy reaching 98.03%. These findings confirm that the incorporation of targeted wavelet prefiltering and feature engineering can intensify both accuracy and efficiency in large-scale DAS deployments.
Author Contributions
Conceptualization, A.K., P.B. and A.R.; methodology, A.K., P.B. and A.R.; software, A.K. and P.B.; validation, A.K., P.B. and A.R.; investigation, A.K., P.B. and A.R.; data curation, O.K., S.G. and A.C.; writing–original draft preparation, A.K., P.B. and A.R.; writing–review and editing, A.R., O.K.; visualization, A.K. and P.B.; supervision, A.R.; funding acquisition, A.R. All authors have read and agreed to the published version of the manuscript.
Funding
This work was supported by a grant for research centers, provided by the Ministry of Economic Development of the Russian Federation in accordance with the subsidy agreement with the Novosibirsk State University dated 17 April 2025 No. 139-15-2025-006: IGK 000000C313925P3S0002.
Institutional Review Board Statement
Not applicable.
Informed Consent Statement
Not applicable.
Data Availability Statement
The data presented in this study are available on request from the corresponding author. The data are not publicly available due to privacy.
Conflicts of Interest
Authors Alexey Chernenko, Sergei Gostilovich and Oleg Kalashev were employed by the company T8 LLC. The remaining authors declare that the research was conducted in the absence of any commercial or financial relationships that could be construed as a potential conflict of interest.
Appendix A. Convolutional Neural Network Architecture
The architecture of the convolutional neural network, as presented in Section 2.3 and illustrated in Figure A1, consists of two principal components: an Encoder and a Classifier. The model accepts input images of size , where n represents the number of selected wavelet channels, and denotes the dimensions of the feature image for each channel obtained after applying WPD to the original data. For all experiments in this study, n was set to 1, 2 or 3.

Figure A1.
Architecture of the convolutional neural network used for binary classification of reflectogram images.
Figure A1.
Architecture of the convolutional neural network used for binary classification of reflectogram images.

The Encoder is implemented as a series of 10 blocks, each containing two convolutional layers with a residual connection. This block structure enables the network to extract high-level, non-trivial features from the input and to encode them into a compact latent representation. The final output of the Encoder is a tensor of size . The Classifier block follows the Encoder, consisting of two additional convolutional layers and three fully connected layers. Its primary function is to perform binary classification on the feature representation produced by the Encoder. The output of the Classifier is a single value in the range , interpreted as the pseudoprobability that the input image corresponds to the target class human_digging.
Key tunable hyperparameters of the CNN include selection of wavelet channel indices for input, batch size, initial learning rate, and learning rate scheduler settings. Hyperparameter optimization was performed with the open-source Optuna library. The complete set of hyperparameters explored during tuning is listed in Table A1.
Table A1.
Tunable hyperparameters of the convolutional neural network.
Table A1.
Tunable hyperparameters of the convolutional neural network.
| Hyperparameter | Range |
|---|---|
| wavelet channel indices | 0 ÷ 31 |
| batch size | 64 ÷ 4096 |
| learning rate (LR) | ÷ 1 |
| LR scheduler reduction factor | 0.1 ÷ 0.9 |
| LR scheduler patience (epochs) | 2 ÷ 7 |
Appendix B. Analysis of High-Frequency Wavelet Channels
To explain the high PSNR values observed in high-frequency wavelet channels, a detailed examination of the digital signal filtering process is necessary. In the frequency domain, filtering operation corresponds to multiplying the spectrum of the signal by the frequency response of the filter. However, the frequency response of digital wavelet filters notably deviates from an ideal characteristic because of their finite impulse response nature and limited coefficient length. Consequently, when a low-frequency wavelet filter is applied, the high-frequency components are attenuated by several orders of magnitude but are not completely eliminated. Similarly, high-frequency filters do not completely suppress low-frequency components. These non-ideal filter responses introduce spectral leakage and artifacts, resulting in the observed anomalously high PSNR values in wavelet bands that theoretically should exhibit low signal content.
This phenomenon is illustrated by a reflectogram from the target class human_digging, which contains three distinct digging events separated by an approximate interval of 1.6 s. In Figure A2a, representative segments of the reflectogram corresponding to digging events occurring within time windows of 1-2, 3-4, and 5-6 s are depicted. Each digging event manifests as a prominent white spike located near the central sensor. Figure A2b and Figure A2c illustrate the wavelet-channel images indexed at 4 and 60, respectively, generated from the wavelet packet decomposition of the segments shown in Figure A2a. These channels correspond to the low- and high-frequency bands previously identified as potentially informative in Figure 8. Notably, both wavelet channel images exhibit three distinct, equidistant stripes that temporally correspond to the three digging events present in the original reflectogram signal.

Figure A2.
Application of the WPD method to the original reflectogram belonging to the target class human_digging. (a) Segments of a single reflectogram corresponding to digging events. (b) Signal for the wavelet channel with a central frequency of approximately Hz. (c) Signal for the wavelet channel with a central frequency of approximately Hz.

Subsequently, the signal reconstruction was performed using wavelet channels with indices 4 and 60, while setting the coefficients of all remaining channels to zero during the reconstruction process. As illustrated in Figure A3, a comparison between the original signal and the reconstructed signals reveals notable differences. Reconstruction from the low-frequency wavelet channel (channel 4) produces a signal that closely approximates the original, with the digging event segment clearly depicted, and a markedly reduced noise floor compared to the original signal. In contrast, reconstruction using the high-frequency wavelet channel (channel 60) results in a largely uniform output that retains little meaningful structural information related to the original reflectogram.

Figure A3.
Comparison of the original reconstructed signals using wavelet channels 4 and 60.
Figure A3.
Comparison of the original reconstructed signals using wavelet channels 4 and 60.

The preceding analysis indicates that the high PSNR values observed in the high-frequency wavelet channels, as shown in Figure 8, are artifacts arising from the intrinsic non-idealities of the employed wavelet filters combined with the spectral characteristics of the DAS signals under study. These artifacts do not reflect meaningful event-specific information, and thus have limited utility for feature extraction and classification. Accordingly, this study excludes high-frequency wavelet channels from further analysis, instead concentrating on the low-frequency portion of the wavelet spectrum where signal content is physically and statistically more informative for event discrimination.
Appendix C. Results of the Prefiltering Training
The training results of the preliminary filtering mechanism on the validation dataset are presented in Figure A4. Optimal performance was achieved at principal components and polynomial feature degree , with a value of approximately 0.0042 within the Recall range of . The corresponding evaluation on the test set for the same hyperparameter configuration yielded a of 0.0040. The DRR AUC metric was calculated with a threshold step size of . Throughout classifier training, a class weight parameter w favoring the target class was set at 800:1 to mitigate class imbalance and optimize recall.

Figure A4.
Value of the DRR AUC metric on the validation set for and with Recall metric in the range .
Figure A4.
Value of the DRR AUC metric on the validation set for and with Recall metric in the range .

For a more detailed analysis, Figure A5 presents the relationship between DropRate and Recall across the training, validation, and test datasets, focusing on the interval for the hyperparameter settings and . For comparison, the plot also includes the Random baseline, corresponding to random event classification, which follows the identity . The optimal operating point on the test set, achieved by tuning the decision threshold , corresponds to DropRate of 0.436 for Recall of 0.991, indicating that approximately 43.6% of non-target reflectograms were effectively excluded during the preliminary filtering stage.

Figure A5.
DropRate dependence on Recall for hyperparameter values and in the range . The Random line follows the law .
Figure A5.
DropRate dependence on Recall for hyperparameter values and in the range . The Random line follows the law .

References
- Ružička, M.; Münster, P.; Dejdar, P.; Jablončík, L. Distributed optical fiber acoustic sensing system for perimeter security. Secur. Future 2021, 5, 150–152. [Google Scholar]
- He, Z.; Liu, Q. Optical fiber distributed acoustic sensors: A review. J. Light. Technol. 2021, 39, 3671–3686. [Google Scholar] [CrossRef]
- Gorshkov, B.G.; Yüksel, K.; Fotiadi, A.A.; Wuilpart, M.; Korobko, D.A.; Zhirnov, A.A.; Stepanov, K.V.; Turov, A.T.; Konstantinov, Y.A.; Lobach, I.A. Scientific applications of distributed acoustic sensing: State-of-the-art review and perspective. Sensors 2022, 22, 1033. [Google Scholar] [CrossRef] [PubMed]
- Fernández-Ruiz, M.R.; Martins, H.F.; Williams, E.F.; Becerril, C.; Magalhães, R.; Costa, L.; Martin-Lopez, S.; Jia, Z.; Zhan, Z.; González-Herráez, M. Seismic monitoring with distributed acoustic sensing from the near-surface to the deep oceans. J. Light. Technol. 2022, 40, 1453–1463. [Google Scholar] [CrossRef]
- Xu, L.; Shi, S.; Yan, F.; Huang, Y.; Bao, Y. Experimental study on combined effect of mechanical loads and corrosion using tube-packaged long-gauge fiber Bragg grating sensors. Struct. Health Monit. 2023, 22, 3985–4004. [Google Scholar] [CrossRef]
- Rahman, M.A.; Taheri, H.; Kim, J. Deep learning model for railroad structural health monitoring via distributed acoustic sensing. In Proceedings of the 2023 26th ACIS International Winter Conference on Software Engineering, Artificial Intelligence, Networking and Parallel/Distributed Computing (SNPD-Winter), Taiyuan, China, 5–7 July 2023; IEEE: Piscataway, NJ, USA, 2023; pp. 274–281. [Google Scholar]
- Hernández, P.D.; Ramírez, J.A.; Soto, M.A. Deep-learning-based earthquake detection for fiber-optic distributed acoustic sensing. J. Light. Technol. 2021, 40, 2639–2650. [Google Scholar] [CrossRef]
- Li, J.; Wang, Y.; Wang, P.; Bai, Q.; Gao, Y.; Zhang, H.; Jin, B. Pattern recognition for distributed optical fiber vibration sensing: A review. IEEE Sensors J. 2021, 21, 11983–11998. [Google Scholar] [CrossRef]
- Turov, A.T.; Konstantinov, Y.A.; Barkov, F.L.; Korobko, D.A.; Zolotovskii, I.O.; Lopez-Mercado, C.A.; Fotiadi, A.A. Enhancing the distributed acoustic sensors’(das) performance by the simple noise reduction algorithms sequential application. Algorithms 2023, 16, 217. [Google Scholar] [CrossRef]
- Shang, Y.; Sun, M.; Wang, C.; Yang, J.; Du, Y.; Yi, J.; Zhao, W.; Wang, Y.; Zhao, Y.; Ni, J. Research progress in distributed acoustic sensing techniques. Sensors 2022, 22, 6060. [Google Scholar] [CrossRef] [PubMed]
- Lapins, S.; Butcher, A.; Kendall, J.M.; Hudson, T.S.; Stork, A.L.; Werner, M.J.; Gunning, J.; Brisbourne, A.M. DAS-N2N: Machine learning distributed acoustic sensing (DAS) signal denoising without clean data. Geophys. J. Int. 2024, 236, 1026–1041. [Google Scholar] [CrossRef]
- Kozmin, A.; Kalashev, O.; Chernenko, A.; Redyuk, A. Semi-Supervised Learned Autoencoder for Classification of Events in Distributed Fibre Acoustic Sensors. Sensors 2025, 25, 3730. [Google Scholar] [CrossRef] [PubMed]
- Shao, L.; Zhang, J.; Chen, X.; Xu, D.; Gu, H.; Mu, Q.; Yu, F.; Liu, S.; Shi, X.; Sun, J.; et al. Artificial intelligence-driven distributed acoustic sensing technology and engineering application. PhotoniX 2025, 6, 4. [Google Scholar] [CrossRef]
- Shi, J.; Cui, K.; Wang, H.; Ren, Z.; Zhu, R. An interferometric optical fiber perimeter security system based on multi-domain feature fusion and SVM. IEEE Sensors J. 2021, 21, 9194–9202. [Google Scholar] [CrossRef]
- Issah, H.; Martin, E. Wavelet decomposition for passive data compression and processing. Accessed Mar. 2024, 3, 2024. [Google Scholar]
- Yu, Z.; Liu, Z.; Zhan, G.; Cheng, P.; Wang, B.; Fei, W. DAS noise attenuation using wavelet stack. In SEG Technical Program Expanded Abstracts 2022; Society of Exploration Geophysicists: Houston, TX, USA, 2022; pp. 592–596. [Google Scholar]
- Padhi, A.; Willis, M.E. Wavelet Transform-Based Coherent Noise Reduction in Distributed Acoustic Sensing. US Patent 11,194,070, 7 December 2021. [Google Scholar]
- Chen, J.; Chen, W.; Wang, X.; Zhou, Y.; Shi, Z.; Zhang, G. DAS coupling noise suppression using wavelet and DCT dictionary based on sparse optimization. In SEG Technical Program Expanded Abstracts 2018; Society of Exploration Geophysicists: Houston, TX, USA, 2018; pp. 4938–4942. [Google Scholar]
- Yu, Y.; Liu, Y.; Wu, N.; Li, Y.; Tian, Y. Adaptive DAS data refining under multiple noise levels based on wavelet inspired invertible network. J. Appl. Geophys. 2025, 233, 105640. [Google Scholar] [CrossRef]
- Guo, T.; Zhang, T.; Lim, E.; Lopez-Benitez, M.; Ma, F.; Yu, L. A review of wavelet analysis and its applications: Challenges and opportunities. IEEE Access 2022, 10, 58869–58903. [Google Scholar] [CrossRef]
- Othman, G.; Zeebaree, D.Q. The applications of discrete wavelet transform in image processing: A review. J. Soft Comput. Data Min. 2020, 1, 31–43. [Google Scholar]
- Edwards, T. Discrete wavelet transforms: Theory and implementation. Univ. de 1991, 1991, 28–35. [Google Scholar]
- Fan, L.; Zhang, F.; Fan, H.; Zhang, C. Brief review of image denoising techniques. Vis. Comput. Ind. Biomed. Art 2019, 2, 7. [Google Scholar] [CrossRef]
- Baig, M.A.; Moinuddin, A.A.; Khan, E. PSNR of highest distortion region: An effective image quality assessment method. In Proceedings of the 2019 International Conference on Electrical, Electronics and Computer Engineering (UPCON), Aligarh, India, 8–10 November 2019; IEEE: Piscataway, NJ, USA, 2019; pp. 1–4. [Google Scholar]
- He, K.; Zhang, X.; Ren, S.; Sun, J. Deep residual learning for image recognition. In Proceedings of the IEEE Conference on Computer Vision and Pattern Recognition, Las Vegas, NV, USA, 27–30 June 2016; pp. 770–778. [Google Scholar]
- Liang, J. Image classification based on RESNET. J. Physics: Conf. Ser. 2020, 1634, 012110. [Google Scholar] [CrossRef]
- Rihaczek, A. Signal energy distribution in time and frequency. IEEE Trans. Inf. Theory 1968, 14, 369–374. [Google Scholar] [CrossRef]
- Menéndez, M.L.; Pardo, J.A.; Pardo, L.; Pardo, M.d.C. The Jensen-Shannon divergence. J. Frankl. Inst. 1997, 334, 307–318. [Google Scholar] [CrossRef]
- Swathi, P.; Pothuganti, K. Overview on principal component analysis algorithm in machine learning. Int. Res. J. Mod. Eng. Technol. Sci. 2020, 2, 241–246. [Google Scholar]
- Kherif, F.; Latypova, A. Principal component analysis. In Machine Learning; Elsevier: Amsterdam, The Netherlands, 2020; pp. 209–225. [Google Scholar]
- Hosmer, D.W., Jr.; Lemeshow, S.; Sturdivant, R.X. Applied Logistic Regression; John Wiley & Sons: Hoboken, NJ, USA, 2013. [Google Scholar]
- Boateng, E.Y.; Abaye, D.A. A review of the logistic regression model with emphasis on medical research. J. Data Anal. Inf. Process. 2019, 7, 190. [Google Scholar] [CrossRef]
- Constantin, C. Using the Logistic Regression model in supporting decisions of establishing marketing strategies. In Bulletin of the Transilvania University of Brasov. Series V: Economic Sciences; Transilvania University Press: Brașov, Romania, 2015; pp. 43–50. [Google Scholar]
- Treshchikov, V.N.; Odintsov, V.A.; Gorbulenko, V.V.; Ragimov, T.I.O.; Kozlov, A.N. Device for Monitoring Vibroacoustic Characteristics of Power Cables and Wires. RU2816676C1. 2024. Available online: https://patents.google.com/patent/RU2816676C1 (accessed on 9 November 2025).
- Rowe, A.C.; Abbott, P.C. Daubechies wavelets and mathematica. Comput. Phys. 1995, 9, 635–648. [Google Scholar] [CrossRef]
- Soni, E.; Mahajan, R. MRI image compression using asymmetric wavelet analysis. In Proceedings of the Advanced Informatics for Computing Research: Third International Conference, ICAICR 2019, Shimla, India, 15–16 June 2019; Revised Selected Papers, Part I 3. Springer: Berlin/Heidelberg, Germany, 2019; pp. 260–270. [Google Scholar]
- Zhao, Y.; Li, Y.; Wu, N. Data augmentation and its application in distributed acoustic sensing data denoising. Geophys. J. Int. 2022, 228, 119–133. [Google Scholar] [CrossRef]
- Hu, L.; Ni, W.; Li, Y.; Yu, K.; Qin, Y. Enhancing φ-OTDR classification performance through event augmentation. Opt. Commun. 2024, 569, 130818. [Google Scholar] [CrossRef]
- Shi, Q.; Denolle, M.A.; Ni, Y.; Williams, E.F.; You, N. Denoising offshore distributed acoustic sensing using masked auto-encoders to enhance earthquake detection. J. Geophys. Res. Solid Earth 2025, 130, e2024JB029728. [Google Scholar] [CrossRef]


Disclaimer/Publisher’s Note: The statements, opinions and data contained in all publications are solely those of the individual author(s) and contributor(s) and not of MDPI and/or the editor(s). MDPI and/or the editor(s) disclaim responsibility for any injury to people or property resulting from any ideas, methods, instructions or products referred to in the content. |
© 2025 by the authors. Licensee MDPI, Basel, Switzerland. This article is an open access article distributed under the terms and conditions of the Creative Commons Attribution (CC BY) license (https://creativecommons.org/licenses/by/4.0/).