Abstract
This study examines the simultaneous relationships among oil prices, oil volatility, and two sub-sectors within alternative energy stocks: renewable energy equipment (REE) and alternative fuels (AF). The results confirm the existence of a bidirectional relationship. While most alternative energy stocks with a long history on the stock exchange exhibit a bidirectional positive correlation with oil prices, they demonstrate a bidirectional negative correlation with oil volatility. In particular, a majority of REEs, as opposed to a minority of AFs, demonstrate a bidirectional positive correlation with oil prices. Conversely, the majority of REEs, contrasted with a minority of AFs, exhibit a bidirectional negative correlation with oil volatility. Notably, newly listed alternative energy stocks show no significant relationship with either oil prices or oil volatility. This suggests that these emerging entities may be influenced by factors beyond traditional energy market dynamics, such as technological innovation, regulatory frameworks, or investor sentiment. Furthermore, the findings highlight that REEs tend to have a more substantial relationship with both oil prices and oil volatility compared to AFs. Recognizing the distinct sensitivities and market behaviours of these sub-sectors can enable more informed decision-making and resource allocation.
Keywords:
alternative energy stocks; renewable energy equipment stocks; alternative fuels stocks; oil prices; oil volatility; stock market JEL Classification:
G10; Q4
1. Introduction
The global energy landscape is undergoing a profound transformation, marked by a growing emphasis on sustainability and the pursuit of alternative energy sources. In this context, the interplay between traditional energy markets, particularly oil prices, and the burgeoning alternative energy sector has emerged as a topic of increasing interest and importance. Understanding the complex dynamics between these variables is not only crucial for investors seeking to navigate the evolving energy market but also for policymakers tasked with fostering a sustainable and resilient energy future.
Alternative energy (or green energy), also known as low-carbon energy, includes renewable energy, electrified vehicles and heating, hydrogen, and sustainable materials. Renewable energy, including wind, solar, and biofuels, is the sector with the largest investment. In 2022, the renewable energy sector achieved a record of $495 billion in investment, an increase of 17% compared to the previous year, while $466 billion was spent on electrified transport, including electric vehicles and associated infrastructure, representing a 54% increase year-on-year. The hydrogen sector received the least financial commitment—just $1.1 billion (BloobergNEF, 2023). The growing alternative energy sector is the best way to address climate change and move to a sustainable energy supply.
A wide range of policy instruments therefore support the transition to alternative energy, e.g., green taxes on harmful environmental activities, loans and grants for green investments, renewable energy businesses, and so on. These policy instruments aim to foster alternative energy development over the long term, enabling the implementation of long-run policy objectives.
The relationship between oil prices and alternative energy stock returns is significant because these markets often interact in ways that provide valuable insights for investors and businesses. The cost of traditional energy (like oil) is increasing, making alternative energy sources relatively more cost-effective. As a result, when oil prices rise, alternative energy becomes more attractive, driving up the demand for and stock prices of companies in this sector due to their role as substitutes for crude oil (Bondia et al., 2016; Dutta, 2017; Xia et al., 2019). For instance, Bondia et al. (2016) showed that increasing energy prices encourage investors to shift towards green energy companies as the incentives for making this transition become more attractive. This inverse relationship helps with portfolio diversification and risk management, as alternative energy stocks can counterbalance the volatility of traditional energy investments. Dutta et al. (2020) mentioned that incorporating oil volatility into the portfolio can help to reduce risks associated with clean energy stocks, and Dutta et al. (2018) oil volatility seems to be a suitable instrument for hedging downside risks associated with clean energy stock prices.
Additionally, oil prices serve as economic indicators, influencing market sentiment and investor behavior, with rising prices often prompting shifts towards sustainable energy solutions. Understanding this dynamic, therefore, not only offers insights into sector performance and long-term growth opportunities but also helps anticipate the effects of environmental policies and the broader transition towards renewable energy, making it a crucial factor in strategic planning and investment decisions.
The alternative energy sector is divided into two sub-sectors, REE and AF, which are categorized on the Euronext stock exchange1. Analysis of the relationship between the traditional energy market and the alternative energy sub-sector has prompted a deeper investigation into the traditional oil market and alternative energy sectors.
What is the contemporaneous relationship between oil prices, oil volatility, and alternative energy stocks, particularly within the sub-sectors of REE and AF? The study aims to investigate the contemporaneous relationship between oil prices, oil prices volatility, and the performance of alternative energy stocks. The focus is particularly on how these relationships manifest within the REE and AF sub-sectors.
By addressing these aspects in detail, this study aims to contribute to a more nuanced understanding of the interconnectedness between traditional oil markets and emerging alternative energy markets, along with the practical implications for investors, policymakers, and industry players. This research highlights the complexity and dynamism within the relationship between traditional energy markets and specific segments of the alternative energy sector. By examining the distinct sensitivities and market behaviors of the REE and AF sub-sectors, this study contributes to a more nuanced understanding that can inform decision-making and resource allocation in these rapidly evolving markets.
The main empirical results suggest that while most alternative energy stocks2 exhibit a bidirectional positive correlation with oil prices, they demonstrate a bidirectional negative correlation with oil volatility. Specifically, a majority of REEs, as opposed to a minority of AFs, demonstrate a bidirectional positive correlation with oil prices. Conversely, the majority of REEs, contrasted with a minority of AFs, exhibit a bidirectional negative correlation with oil volatility. The positive relationship, where both oil prices and alternative energy stock returns rise together, can occur due to various factors, such as overall economic growth or increased investment in the energy sector. Rising oil prices can lead to higher alternative energy stock returns due to increased overall energy demand, investment, and supportive government policies. Higher oil prices often prompt subsidies and regulations for alternative energy, while also signaling potential future energy shortages, which boosts interest in alternative solutions. This illustrates the complex interplay between economic trends, technological advancements, and policy changes in energy markets.
Moreover, in this study, newly listed alternative energy stocks3 show no significant relationship with either oil prices or oil volatility. This trend shows that they move independently with traditional energy markets; this may result from various factors, such as technological advancements making renewable energy more competitive, regulatory frameworks providing protection through policies or subsidies, and investors focusing on future potential rather than current market conditions. Technological innovations have significantly reduced the costs of renewable energy technologies, making them more competitive with fossil fuels. For instance, the European Commission reported that in 2022, despite rising energy and material costs, the cost of clean energy technologies remained highly competitive, leading to a 50% increase in the deployment of wind and solar power across the EU compared to the previous year (European Comission, 2023).
The findings also highlight that REEs tend to have a more substantial relationship with both oil prices and oil volatility compared to AFs. The disparities between REEs and AFs underscore the need for tailored approaches in portfolio management and policy formulation.
The contributions of this study are significant and multifaceted. Firstly, these findings provide sector-specific insights. The strong bidirectional positive correlation between REEs and oil prices and the bidirectional negative correlation with oil volatility highlight this sub-sector’s sensitivity to traditional energy market fluctuations. In contrast, a weaker correlation of AFs with oil prices and volatility points to potential stability in this sub-sector, suggesting different investment and policy strategies compared to REEs. Secondly, these insights have significant implications for investors in terms of investment strategies and risk management. Investors can tailor their portfolios by balancing investments between REEs and AFs based on their sensitivity to oil market dynamics; understanding the negative correlation with oil volatility can help investors manage risk, especially during periods of high oil market instability. Thirdly, these insights have important implications for policy formulation. Policymakers can design more effective regulations and support mechanisms by recognizing the distinct behaviors of REE and AF sectors. The lack of significant correlation for newly listed alternative energy stocks suggests that these companies might benefit from targeted policies that support innovation and early-stage development, allowing them to thrive independently with traditional energy markets. Fourthly, in terms of contributions to the existing literature, this study adds to the existing body of knowledge by providing empirical evidence of the specific relationship between oil prices, oil volatility, and alternative energy sub-sectors. Fifthly, the study can serve as guidance for corporate strategy. Companies within the alternative energy sector can use these findings to inform their strategic planning, particularly in terms of how they position themselves relative to traditional energy markets; firms can better anticipate market movements and position their products and services to take advantage of periods when oil prices are high or volatility is low. Lastly, the findings encourage sustainable investments by highlighting the economic interplay between oil and alternative energy. This study can encourage more sustainable investment practices, aligning financial incentives with environmental goals (i.e., promotion of green investments). The insights gained can help facilitate the transition to a greener economy by providing a clearer understanding of how alternative energy sectors interact with traditional energy markets (i.e., support for transition). In conclusion, the study makes substantial contributions by enhancing the understanding of the interplay between oil prices, oil volatility, and alternative energy sub-sectors. It offers valuable insights for investors, policymakers, academics, and corporate strategies, ultimately supporting more informed decision-making and promoting the transition to sustainable energy solutions.
The paper is structured as follows. The next section reviews previous studies and then a detailed explanation of the data, variables, and methodology is provided. This is followed by a presentation of tests conducted on the variables and regression analysis. The subsequent section provides the empirical results, followed by the section including the discussion and implications. Finally, the paper concludes with a summary and conclusions.
2. Literature Review
The relationship between oil prices, volatility, and alternative energy stock returns has been widely studied. However, the findings of previous studies do not show a consensus. In addition, they focused on alternative energy sectors, but little attention has been given to sub-sector-specific dynamics, particularly with regard to renewable energy equipment and alternative fuels. This review synthesizes the existing research and identifies the gaps that motivate the present study.
Prior research on the relationship between oil prices and green energy has yielded varying results. Some studies suggested a negative relationship (e.g., Dutta et al., 2020), while others indicated a positive relationship (He et al., 2021; Managi & Okimoto, 2013). Additionally, several studies highlighted a dynamic relationship (Bondia et al., 2016; Geng et al., 2021; Kumar et al., 2012; Maghyereh et al., 2019; Nunes & Catalão-Lopes, 2020; Pham, 2019; Reboredo et al., 2017; Troster et al., 2018; Zhang et al., 2020). On the other hand, some research found little to no relationship between clean energy stocks and oil prices (Dutta et al., 2020; Henriques & Sadorsky, 2008; Sadorsky, 2012).
Previous research has predominantly focused on the entire alternative energy sector and little attention has been given to the alternative energy sub-sector. Various scholars have explored different aspects within this field. Research by Dutta et al. (2020) examined the effect of energy sector volatility on clean energy by using the Markov regime switching process. Their findings indicated a negative relationship between volatility and clean energy stock returns. Research by Managi and Okimoto (2013) investigated the relationship between oil, clean energy stock prices, and technology stock prices by applying Markov-switching vector autoregressive models. They found a positive relationship between oil prices and clean energy prices. A study by He et al. (2021) applied a quantile autoregressive distributed lag approach to investigate the link between clean energy stocks, oil price, and financial stress. They found that oil prices positively impact clean energy stocks in higher and extremely higher quantiles. Studies by Nunes and Catalão-Lopes (2020) and Reboredo et al. (2017) focused on the relationship between oil and renewable energy stock prices, while Pham (2019) used a VAR approach to investigate the heterogeneity in the relationship between oil prices and clean energy sub-sector stock indices. Results from Pham (2019) indicated a dynamic relationship between oil prices and clean energy stocks sub-sector including solar, wind, geothermal, fuel cell, geothermal, and others. The relationship between them varies over time and across different clean energy sub-sectors. Geng et al. (2021) examined changes in oil prices impacting the stock returns of clean energy companies by employing a connectedness network method. Their results suggested a dynamic relationship between them. Research by Zhang et al. (2020) employed the wavelet-based quantile-on-quantile and Granger causality-in-quantiles methods to investigate the effect of oil price shocks on clean energy stocks. They found that the impact of oil prices on clean energy stocks differs depending on the quantiles and investment time horizons. Bondia et al. (2016) focused on the relationship between the stock prices of alternative energy companies and oil prices by applying a cointegration methodology. Their findings suggested that, in the short term, oil prices affect alternative energy stock prices; however, there is no causal relationship between them. A study by Troster et al. (2018) emphasized the relationship between renewable energy consumption, oil prices, and economic activity, and applied Granger-causality in quantiles analysis to examine the relationship. They found evidence of a lower-tail dependence between oil prices and renewable energy consumption. Maghyereh et al. (2019) studied the co-movement between oil and clean energy stocks by applying multivariate GARCH and wavelets. They highlight, in long run, the importance of certainty in oil and technology markets for the development of clean energy. Research by Kumar et al. (2012) applied VAR to explore the relationship between the stock prices of clean energy firms and oil and carbon markets. They suggested that oil prices affect clean energy stocks. Gordo et al. (2024) applied a VAR approach to analyze the relationship between renewable energy and monetary policy using EU data. They found that monetary policy has a limited effect or no effect on renewable energy stock prices. Lv et al. (2021) investigated the relationship between oil and stock prices in the Chinese clean energy sub-sector. Essa and Giouvris (2020) applied OLS and VAR to find the relationship between oil prices, oil volatility, and stock returns. Their results from both methods indicated a negative relationship between oil volatility and stock returns but a positive relationship between oil prices and stock returns. Dinh (2023) also employed OLS and VAR to test the causal and contemporaneous relationship between climate and low-carbon stocks, oil prices, and energy stocks. The results suggested that oil prices and returns on the green stock index have a bidirectional positive contemporaneous relationship. Li et al. (2023) studied the influence between traditional energy markets, metal markets, and clean energy sub-sectors. They found that clean energy efficiency plays a key role in influencing risk dynamics among traditional energy, metal, and clean energy sub-sectors, while traditional energy and metal markets primarily absorb these risks. Nasir and He (2023) examined whether investments in the overall clean energy market and its various sub-sectors can serve as a hedge against China’s economic policy uncertainty (EPU). Their results revealed that clean energy indices show strong, time-varying connections with China’s economic policy uncertainty, especially during market turmoil, and that certain sub-sectors, like fuel cells, green IT, and energy management, consistently hedge against policy uncertainty. Zhu et al. (2019) explored how fluctuations in oil prices influence China’s new energy industry at the firm level. Specifically, it examined the contemporaneous, asymmetric, and lagged effect of oil price changes on the stocks of the new energy industry. They found that the short-term lagged effect of oil prices on most new energy firms is stronger than the long-term impact. Additionally, they identified a significant asymmetric influence of oil prices on these firms.
Previous research has primarily concentrated on the alternative energy sector as a whole, with little to no attention afforded to the contemporaneous relationship between traditional energy markets and alternative sub-sectors; this research seeks to fill that gap. It examines the contemporaneous relationship between oil prices, oil volatility, and alternative energy stocks, with a specific emphasis on two key sub-sectors: renewable energy equipment and alternative fuels.
3. Data, Variables, and Methodology
3.1. Data
In this study, I gathered daily prices for all alternative energy stocks listed on the Euronext stock exchange as of 17 March 20234. This dataset comprises numerous stocks, which are then filtered to select those with more than 50 observations. This filtering process results in a dataset of 29 stocks. The chosen stocks are subsequently categorized into two distinct groups based on their classifications on the stock market: 18 stocks fall under renewable energy equipment5 and 11 under alternative fuels6.
I also collected the Brent-Europe oil prices proxy for oil prices and the CBOE crude oil volatility index (OVXCLS) proxy for oil volatility from FRED. The dataset can be found here7.
All the datasets contain data collected until 17 March 2023.
3.2. Variables
Variables are computed as below:
Alternative energy stock returns: REE and AF
where subscripts are stock i and time at daily intervals. is the return of stock i at time t. is the stock price at time t, and is the stock price at a previous time.
Oil prices and oil volatility:
Oil prices and oil volatility are defined as the natural log of difference between today and the previous day of oil prices and oil volatility indices, respectively.
where is the change in oil price, is the oil price at time t, and is the oil price at a previous time.
where denotes the changes in the oil volatility index, is the oil volatility index at time t, and is oil volatility index at a previous time.
3.3. Methodology
This research focuses on the contemporaneous relationship between oil prices, oil volatility and returns on sub-sectors of alternative energy stocks: REE and AF. Following research by Zhu et al. (2019) and Dinh (2023), I use the ordinary least squares (OLS) method to examine the contemporaneous relationship. In addition, Essa and Giouvris (2020) suggested that both the OLS and VAR methods yield consistent results in his research on the relationship between oil prices, oil volatility, and stock returns.
The OLS models are presented below:
- System of regressions of REE stocks
- (1)
- (2)
- (3)
- denotes returns on REE stocks, calculated as Formula (1).
- System of regressions of AF stocks
- (1)
- (2)
- (3)
- denotes returns on AF stocks, calculated as Formula (1).
where
- is the intercept of the regression line or the constant term in the regression equation. It represents the expected value of the dependent variable (Y) when the independent variables () are zero.
- is the slope of the regression line or the coefficient that indicates the strength and direction of the relationship between X and Y. It shows the relationship between the independent variable (X) and the dependent variable (Y). The models in this research are double-log functional forms, which are non-linear in variables.
- is the residual or error term in the regression model. It represents the part of the dependent variables that are not explained by the independent variables in the regression.
This research examines the contemporaneous relationship between oil prices, oil volatility, and returns on sub-sectors of alternative energy stocks. By applying three regression analyses treating oil prices, oil volatility, and alternative energy stock returns as the dependent variables, a separate function is used to examine the distinct relationships and potential effects among the variables. This approach allows for a systematic examination of the relationship among the three variables. It will provide a better understanding of the relationship between oil prices, oil volatility, and alternative energy stock returns.
Each alternative energy stock has three regressions, as shown in the OLS models. There are thus 87 regressions in total for both sub-sectors: 54 for REE, and 33 for AF.
Descriptive statistics of REE stocks, oil prices, and oil volatility are presented in Table 1 and Table 2; descriptive statistics of AF stocks, oil prices, and oil volatility are presented in Table 3. In these tables, N stands for the number of observations; Mean is the average value of the variable across all observations; St.Dev. is standard deviation measuring the spread or variability of the data (a higher standard deviation indicates greater variability); Min (or minimum) is the smallest value observed in the dataset; Pctl(25) (or 25th percentile) is the value below which 25% of the data falls (first quartile); Pctl (75) (or 75th percentile) is the value below which 75% of the data falls (third quartile); and Max (or maximum) is the largest value observed in the dataset. For instance, in Table 2, in regression 12, the statistics information on MAGNORA can be explained as follows. The returns for this stock show a slight negative average (Mean = ) with relatively low variability (St.Dev. = 0.05). The range of return is from to .

Table 1.
Descriptive statistics of regressions: REE stocks, oil price, and oil volatility (Models 1–11).
Table 2.
Descriptive statistics of regressions: REE stocks, oil price, and oil volatility (Models 12–18).
Table 3.
Descriptive statistics of regressions: AF stocks, oil price, and oil volatility (Models 1–11).
All the datasets are collected until 17 March 2023. However, the number of observations for each regression varies depending on the listing duration of each stock on the exchange.
4. Testing Variables and Regressions
The certain tests below were conducted to solidify the results of all regressions. Firstly, I tested the correlation between REE stocks, oil prices, and oil volatility, as well as the correlation between AF stocks, oil prices, and oil volatility. This assessment helps to mitigate issues of multicollinearity. I then verified the stationarity of all variables, which is essential to prevent spurious relationships. Lastly, I tested each regression for serial correlation and heteroskedasticity of residuals.
4.1. Correlation Between Variables
The results of the testing correlation between the variables, shown in Table 4 and Table 5, indicate that the variables have very low correlation. That is, the REE and AF regressions have no problem with multicollinearity.
Table 4.
Correlation between REE stocks, oil price, and oil volatility.
Table 5.
Correlation between AF stocks, oil price, and oil volatility.
4.2. Testing Stationary Variables
All variables, including REE stocks, AF stocks, oil prices, and oil volatility, were tested for stationarity based on the augmented Dickey–Fuller test. The tests suggest that all variables are stationary at the significance level of 1%. That is, the relationships between variables are not spurious. The results of the tests are presented in Table 6.
Table 6.
Stationary variable test.
4.3. Testing Serial Correlation
After running each regression, I tested whether the regression has a serial correlation problem based on the Durbin–Watson (DW) test. All serial correlation tests suggest that all regressions have no problem with serial correlation at the significance level of 5%, as shown in Table 7, Table 8 and Table 9.
Table 7.
Systems of regression: REE stocks, oil price and oil volatility. DW test for autocorrelation of residuals. Null hypothesis (H0), ; alternative hypothesis (H1), .
Table 8.
Systems of regression: REE stocks, oil price, and oil volatility. DW test for autocorrelation of residuals. Null hypothesis (H0), ; alternative hypothesis (H1), .
Table 9.
Systems of regression: AF stocks, oil price, and oil volatility. DW test for autocorrelation of residuals. Null hypothesis (H0), ; alternative hypothesis (H1), .
4.4. Heteroskedasticity Test
In this paper, heteroskedasticity tests for each regression were also conducted using the Breusch–Pagan (BP) test. The test assesses whether an external shock or a change in circumstances has increased or decreased uncertainty about dependent variables. The results of the tests are shown in Table 10, Table 11 and Table 12. The results suggest that some regressions have the heteroskedasticity problem, which can affect the regression estimates. Therefore, estimating robust standard errors for the regressions with the heteroskedasticity problem is performed to enhance the reliability and validity of the regression results.
Table 10.
Systems of regression: REE stocks, oil price, and oil volatility. BP test for heteroskedasticity of residuals. Null hypothesis (H0), homoskedasticity (constant variance of error term); alternative hypothesis (H1), heteroskedasticity (non-constant variance of error terms).
Table 11.
Systems of regression: REE stocks, oil price, and oil volatility. BP test for heteroskedasticity of residuals. Null hypothesis (H0), homoskedasticity (constant variance of error term); alternative hypothesis (H1), heteroskedasticity (non-constant variance of error terms).
Table 12.
Systems of regression: AF stocks, oil price, and oil volatility. BP test for heteroskedasticity of residuals. Null hypothesis (H0), homoskedasticity (constant variance of error term); alternative hypothesis (H1), heteroskedasticity (non-constant variance of error terms).
5. Empirical Results
5.1. Regressions of Renewable Energy Equipment (REE)
In this section, I investigate the relationship between oil prices, oil volatility, and 18 REE stocks by employing the OLS method. For each REE stock, there is a system of three regressions, as shown in the methodology section. There are thus 54 regressions in this stage. As suggested in the testing stage, all these regressions have no problem with serial correlation at the significance level of 5%, but some have a problem with heteroskedasticity. Therefore, estimating robust standard errors for the regressions with the heteroskedasticity problem is performed.
Table 13.
Systems of regression: REE stocks, oil price, and oil volatility.
Table 14.
Systems of regression: REE stocks, oil price, and oil volatility.
Table 15.
Systems of regression: REE stocks, oil price, and oil volatility.
In these tables, each regression system has three Equations, (1)–(3), with different dependent variables; e.g., the system of regression 1 has three Equations, (1)–(3), with the dependent variables: R_AGRIPOWER, Oilprice and OilVol, respectively.
The results in Table 14 and Table 15 indicate that seven REE stocks—MAGNORA, MCPHY, NEL, NHOA, SCATEC, SIF, and VERGNET—have a significant bidirectional positive relationship with oil prices (see Equations (1) and (2)) because the p values of NHOA and VERGNET and the p values of the others . In Table 13, CHARWOOD () has a significant bidirectional negative relationship with oil prices.
Nine REE stocks have a significant bidirectional negative relationship with oil volatility: AGRIPOWER, BOOSTHEAT, CHARWOOD, ENERTIME, MAGNORA, MCPHY, NEL, SCATEC, and SIF. This is because the p values of AGRIPOWER, BOOSTHEAT, ENERTIME, and CHARWOOD (the p values of ENERTIME and for Equations (1) and (3), respectively), and the p values of the others (see Equations (1) and (3) in Table 13, Table 14 and Table 15). Most of these stocks have been listed around ten years or more on the Euronext stock exchange.
There are seven stocks with no significant relationship with oil prices and oil volatility: BLUE, BW, CCORREE, ENOGIA, ENTECH, HYDROGENPRO, and JSA. Most of them are newly listed stocks with short historical data; some have been listed for over one year, while others have been listed for just over than two years.
In conclusion, the results reveal that the REE stocks with long historical data have a substantially contemporaneous relationship with oil prices and oil volatility, while the newly listed REE stocks do not.
5.2. Regressions of Alternative Fuels (AF)
In this section, I investigate the relationship between oil prices, oil volatility, and 11 AF stocks by running 33 regressions. As suggested in the testing stage, all these regressions have no problem with serial correlation at the significance level of 5%, but some have a problem with heteroskedasticity. Therefore, estimating robust standard errors for the regressions with heteroskedasticity problem is performed.
Table 16.
Systems of regression: AF stocks, oil price, and oil volatility.
Table 17.
Systems of regression: AF stocks, oil price, and oil volatility.
The results in Table 16 indicate that only one AF stock (EO2) has a significant bidirectional positive relationship with oil prices at the significance level of 1% (p value of EO2 ) (see Equations (1) and (2)). EO2 has been listed on the stock exchange for more than ten years.
Additionally, EVERFUEL, GLOBAL, and HYDROGEN_REF show a bidirectional negative relationship with oil volatility (p value of GLOBAL , and p values of the others ) (see Equations (1) and (3)), but GLOBAL and HYDROGEN_REF do not have a statistically significant relationship with oil prices.
In Table 17, no AF stocks have a statistically significant relationship with oil prices and oil volatility. They have short historical data on the stock exchange, and have been listed for up to a few months, one year, or just more than two years. This finding suggests that the newly listed AF stocks are independent of the traditional energy market.
In conclusion, the results in Table 16 and Table 17 indicate that AF stocks have a weak contemporaneous relationship with oil prices and oil volatility.
In short, the empirical results of this research showing in Table 13, Table 14, Table 15, Table 16 and Table 17 suggest that most alternative energy stocks, which have been listed for around ten years or more, have a bidirectional positive relationship with oil prices but a bidirectional negative relationship with oil volatility.
The positive relationship, where both oil prices and alternative energy stock returns rise together, can occur due to various factors, such as overall economic growth that boosts energy demand across the board, or increased investment in the energy sector as a whole when oil prices are high. Policymakers also play a crucial role in this dynamic; rising oil prices often prompt governments to implement or strengthen policies that support alternative energy, such as subsidies, tax incentives, or stricter environmental regulations. These policies can simultaneously drive up alternative energy stock returns even as oil prices rise. Additionally, rising oil prices may signal future energy scarcity or environmental concerns, leading to heightened interest in alternative energy solutions as part of a longer-term strategy, thereby driving up their stock prices simultaneously. This positive correlation underscores the complexity of energy markets, where broader economic trends, technological advancements, and policy shifts driven by policymakers can influence both oil and alternative energy sectors in similar directions.
In addition, most newly listed REE and AF stocks8, which have only short historical data and had been listed on the exchange for up to a few months, one year, or just more than two years as of 17 March 2023, have no significant relationship with oil prices and oil volatility. This could be due to several reasons, such as technological advancements, regulatory frameworks, and investor sentiment. Technological advancements are an important factor in the alternative energy sector; they have fundamentally transformed the sector, making it more competitive and less sensitive to oil price movements. This shift not only underscores the importance of innovation in driving the growth of alternative energy but also highlights a growing decoupling of the alternative sector from the traditional energy market. Regarding benefits from regulatory frameworks, these companies could be benefiting from specific policies or subsidies that protect them from traditional energy market trends. As for investor sentiment, new market entrants might attract investments based on future potential and innovation rather than current market conditions.
The findings also highlight that the REE stocks tend to have a more substantial relationship with both oil prices and oil volatility compared to the AF stocks9. The disparities between REEs and AFs underscore the need for tailored approaches in portfolio management and policy formulation.
This study confirms a simultaneous relationship between stock returns in the two sub-sectors of alternative energy and both oil prices and oil volatility. This finding is consistent with previous research suggesting an interplay between oil prices and green stock returns.
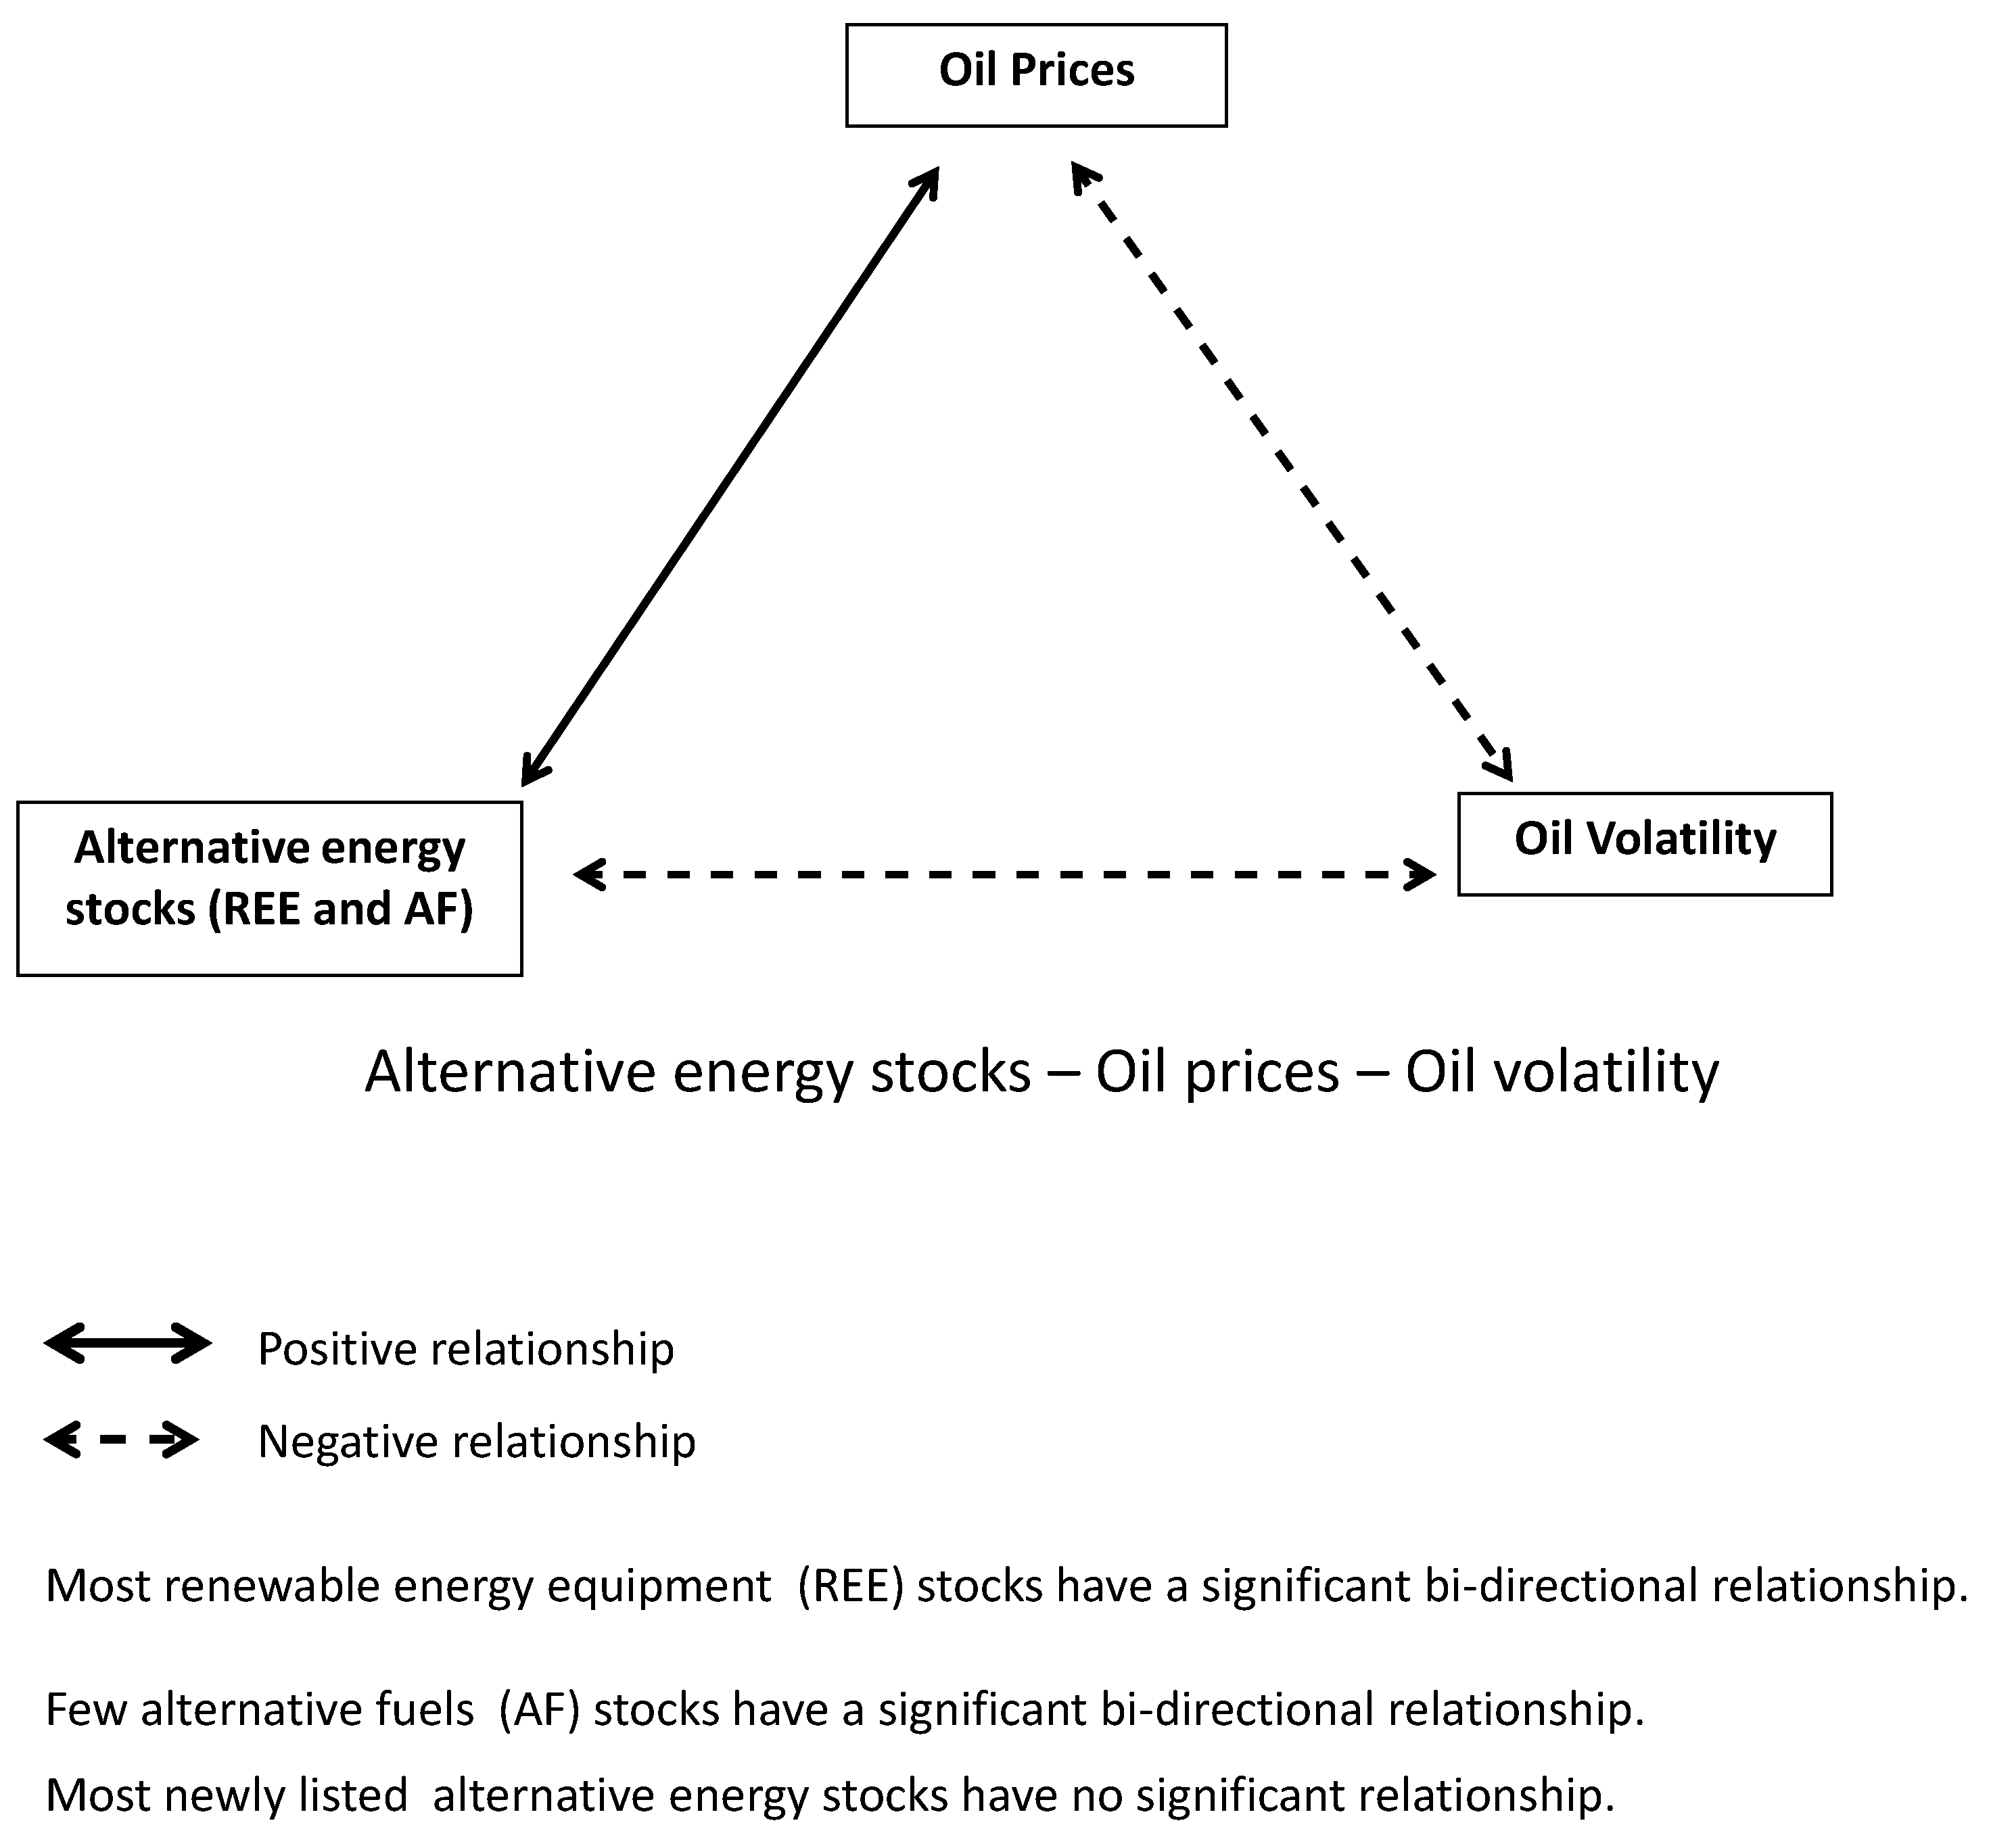
The main empirical results can also be seen in Figure 1.
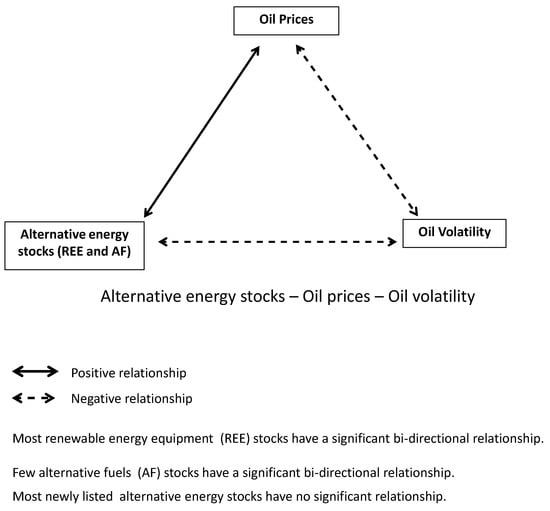
Figure 1.
Relationship between oil prices, oil volatility, and alternative energy stocks.
6. Discussion and Implications
The findings of this research indicate that the majority of alternative energy stock returns, which have long historical data on the stock exchange, exhibit a positive correlation with oil prices but a negative correlation with oil volatility. Specifically, there is a notable prevalence of significant relationships among REEs compared to AFs. Moreover, newly listed alternative energy stocks tend to lack significant relationships with both oil prices and oil volatility. These insights hold significant implications for both investors and policymakers alike.
For newly listed stocks exhibiting no contemporaneous relationship with oil prices and oil volatility, investors might consider using oil as a hedge for their alternative energy investment (Kuang, 2023). This strategy aims to mitigate the overall volatility of the alternative energy portfolio, since fluctuations in oil prices do not correspond to changes in these particular stock prices, and vice versa (Reboredo et al., 2017). Moreover, if one expects alternative energy products to be independent of crude oil, this could confirm that incentive policies are functioning well.
In light of increasing environmental consciousness and the urgent need to pivot towards eco-friendly energy sources, there is a reasonable expectation of lasting growth in the demand for alternative energy products. This trend persists despite any upward or downward movements in oil prices. This points to an overriding transition towards renewable energy solutions, driven by wider socio-economic and environmental necessities. This transition reinforces the resilience of the alternative energy market against the volatility of traditional energy price fluctuations.
The discovery that alternative energy stocks show a contemporaneous positive correlation with oil prices, and a contemporaneous negative correlation with oil volatility, implies that the demand for alternative energy products aligns with oil price changes but moves inversely to oil volatility. Put simply, when oil prices rise, the demand for alternative energy products also escalates, and vice versa. In the context of a low-carbon economy where the demand for carbon products is anticipated to fall, the demand for alternative energy products correspondingly increases. When oil prices rise, the cost of traditional energy sources increases, leading alternative energy sources to be more attractive if their prices reduce or are much lower than oil prices. As a result, investors might consider shifting their investments towards alternative energy stocks. A decline in oil prices may occur, probably due to a reduction in the demand for carbon products, while the demand for alternative energy products increases due to the transition towards alternative energy. This means that the returns on alternative energy stocks should have a negative relationship with oil prices as they decrease.
Oil price volatility can affect investor sentiment and risk preference. High oil volatility might lead investors to seek more stable investments, such as alternative energy stocks, which could potentially increase their stock prices. One could thus expect that returns on alternative energy stocks would have a positive relationship with oil volatility.
However, findings show that while the majority of alternative energy stock returns exhibit a positive correlation with oil prices, they show a negative correlation with oil volatility. This might need more support from policymakers, given the findings by Gordo et al. (2024), which suggest that monetary policy has a limited effect or no effect on renewable energy stock prices. Moreover, REEs appear to be sensitive to both oil prices and oil volatility, indicating a more pronounced correlation with traditional energy market trends. Furthermore, the differing impacts observed between these two alternative energy groups (REE and AF) underscore the importance of sector-specific considerations in understanding market behavior and formulating investment strategies.
The findings in this research carry manifold implications. For investors, they offer invaluable insights into crafting risk mitigation strategies and identifying opportunities for diversification within the alternative energy sector. Investors in the alternative energy sector should consider the distinct sensitivities of the REE and AF sub-sectors to oil prices and volatility. Recognizing that REEs are more closely tied to oil price movements and volatility can help investors make more informed decisions regarding portfolio diversification and risk management. Policymakers can utilize these insights to formulate targeted interventions and support mechanisms, thereby nurturing the sustainable expansion of renewable energy industries. Policymakers should be aware of the differentiated impacts of oil market dynamics on various alternative energy sub-sectors. Policies that support technological innovation and stability in the renewable energy market can mitigate the adverse effects of volatility in oil prices and improve the sector’s competitiveness. Regulators should recognize the role of supportive policies in stabilizing the alternative energy market. Effective regulatory frameworks can protect the sector from the adverse effects of oil price volatility and encourage sustainable growth. In terms of technological innovation, the lack of a significant relationship between newly listed alternative energy stocks and traditional energy market dynamics underscores the importance of technological advancements. Investing in and fostering innovation in the alternative energy sector can lead to greater independence from traditional energy market fluctuations.
7. Summary and Conclusions
The burgeoning alternative energy sector offers fresh avenues for investment and can be delineated into two principal sub-sectors: renewable energy equipment (REE), and alternative fuels (AF). Given the pivotal role of oil prices in shaping the broader economy, they emerge as a critical determinant influencing investment decisions within the alternative energy domain. Understanding the intricate dynamics between stocks in these sub-sectors and oil prices, alongside oil volatility, holds paramount significance for investors, aiding in strategic investment positioning and robust risk management practices.
This study delves into the concurrent interplay among oil prices, oil volatility, and two specific sub-sectors within alternative energy stocks (REE and AF). A dataset comprising 29 alternative energy stocks are collected: 18 for REE, and 11 for AF. The ordinary least squares method is employed as the analytical tool to investigate the simultaneous relationship between these variables.
The analysis reveals an interplay among these factors; alternative energy stocks, which have a long history on the stock exchange, demonstrate a bidirectional positive relationship with oil prices but a bidirectional negative relationship with oil volatility. Notably, REEs show a stronger relationship with both oil prices and oil volatility compared to AFs. REEs emerge as particularly sensitive to both oil prices and oil volatility, indicating a higher degree of interdependence with traditional energy market dynamics. Moreover, the differential impact observed between REEs and AFs underscores the importance of sector-specific considerations in understanding market behavior and formulating investment strategies. Furthermore, newly listed alternative energy stocks exhibit no significant relationship with either oil prices or oil volatility, suggesting influences beyond traditional energy market dynamics. This suggests that these emerging entities may be influenced by factors beyond traditional energy market dynamics, such as technological innovation, regulatory frameworks, or investor sentiment. The findings in this research contribute to the findings of Pham (2019), suggesting that the relationship between them varies over time and across different clean energy sub-sectors.
Further research could explore the specific factors driving the behavior of these emerging players and assess their potential impact on the wider energy investment landscape.
The findings in this research have implications for investors, in terms of risk management and investment decisions, and for policymakers, in terms of supporting policies to achieve a low-carbon economy. Policymakers might consider appropriate key policies, e.g., tax credits and cash grants, to support the development of both sub-sectors of alternative energy businesses in the long run.
The findings of this research can also serve as a foundation for future studies, e.g., how technological advancements, regulatory changes, and market conditions impact the alternative energy sector.
Funding
This research received no external funding.
Data Availability Statement
The link to the data is provided in the paper in note 7.
Acknowledgments
I would like to thank three anonymous referees for their insightful comments and suggestions.
Conflicts of Interest
The author declares no conflicts of interest.
Notes
| 1 | Renewable energy equipment is defined as ‘solar panels and wind turbines and their apparatus permanently installed on [your] premises used for the generation, transmission, or utilization of mechanical or electrical power’ (Lawinsider, 2023). The AF sub-sector consists of energy derived from sources other than petroleum: ethanol is produced from corn and other crops; electricity is produced from different sources such as coal; natural gas; nuclear power; renewable biodiesel is diesel derived from vegetable oils and animal fats; natural gas and propane produce fewer air pollutants and GHGs than gasoline; and hydrogen produced from coal, nuclear power, and hydropower emit no harmful air pollutants (Energy, 2023). |
| 2 | The stocks have been listed around ten years or more on the Euronext stock exchange. |
| 3 | The stocks have been listed within few months, more than one year or just more than two years on the Euronext stock exchange. |
| 4 | The dataset was collected with maximum of historical data until 17 March. The data collection ended on 17 March 2023, because it was the predefined end date for the study as outlined in the research plan. For example, stock NEL with a total of 3732 observations has a dataset covering the period from 10 September 2004 to 17 March 2023. |
| 5 | REE stocks include AGRIPOWER, BLUE SHARK POWER, BOOSTHEAT, BW IDEOL, CHARWOOD ENERGY, CORRE ENERGY B.V., ENERTIME, ENOGIA, ENTECH, HYDROGENPRO, JSA TECHNOLOGY, MAGNORA, MCPHY ENERGY, NEL, NHOA, SCATEC, SIF HOLDING, VERGNET. |
| 6 | AF stocks include ENERGEIA, EO2, EVERFUEL, GLOBAL BIOENERGIES, HYDROGEN REFUELING, HYNION, HYON, LHYFE, TECO 2030, WAGA ENERGY, WEYA. |
| 7 | Alternative energy stocks: https://live.euronext.com/en, accessed on 18 March 2023; Brent-Europe Oil prices: https://fred.stlouisfed.org/series/DCOILBRENTEU, accessed on 18 March 2023; CBOE Crude Oil ETF Volatility Index: https://fred.stlouisfed.org/series/OVXCLS, accessed on 18 March 2023. |
| 8 | REE stocks: BLU, BW, CCORRE, ENOGIA, ENTECH, HYDROGENPRO, and JSA; AF stocks: HYNION, HYON, LHYFE, TECO, WAGA, and WEYA. |
| 9 | More REEs than AFs have a significant relationship with oil prices and oil volatility. |
References
- BloobergNEF. (2023). Global low-carbon energy technology investment surges past $1 trillion for the first time. Available online: https://about.bnef.com/blog/global-low-carbon-energy-technology-investment-surges-past-1-trillion-for-the-first-time/ (accessed on 4 April 2023).
- Bondia, R., Ghosh, S., & Kanjilal, K. (2016). International crude oil prices and the stock prices of clean energy and technology companies: Evidence from non-linear cointegration tests with unknown structural breaks. Energy, 101, 558–565. [Google Scholar] [CrossRef]
- Dinh, M. T. H. (2023). Do climate and low carbon stocks react to oil prices and energy stocks during oil crisis? Implications for sustainable development [Working paper]. Available online: https://papers.ssrn.com/sol3/papers.cfm?abstract_id=4065403 (accessed on 1 January 2025).
- Dutta, A. (2017). Oil price uncertainty and clean energy stock returns: New evidence from crude oil volatility index. Journal of Cleaner Production, 164, 1157–1166. [Google Scholar] [CrossRef]
- Dutta, A., Bouri, E., & Noor, M. H. (2018). Return and volatility linkages between CO2 emission and clean energy stock prices. Energy, 164, 803–810. [Google Scholar] [CrossRef]
- Dutta, A., Bouri, E., Saeed, T., & Vo, X. V. (2020). Impact of energy sector volatility on clean energy assets. Energy, 212, 118657. [Google Scholar] [CrossRef]
- Dutta, A., Jana, R., & Das, D. (2020). Do green investments react to oil price shocks? Implications for sustainable development. Journal of Cleaner Production, 266, 121956. [Google Scholar] [CrossRef]
- Energy. (2023). Alternative fuels. Available online: https://www.fueleconomy.gov/feg/current.shtml (accessed on 4 April 2023).
- Essa, M. S., & Giouvris, E. (2020). Oil price, oil price implied volatility (OVX) and illiquidity premiums in the US: (A)symmetry and the impact of macroeconomic factors. Journal of Risk and Financial Management, 13(4), 70. [Google Scholar] [CrossRef]
- European Comission. (2023). Clean energy competitiveness. Available online: https://energy.ec.europa.eu/topics/research-and-technology/clean-energy-competitiveness_en (accessed on 1 February 2025).
- Geng, J.-B., Liu, C., Ji, Q., & Zhang, D. (2021). Do oil price changes really matter for clean energy returns? Renewable and Sustainable Energy Reviews, 150, 111429. [Google Scholar] [CrossRef]
- Gordo, N., Hunt, A., & Morley, B. (2024). Alternative monetary policies and renewable energy stock returns. Energy Economics, 136, 107740. [Google Scholar] [CrossRef]
- He, X., Mishra, S., Aman, A., Shahbaz, M., Razzaq, A., & Sharif, A. (2021). The linkage between clean energy stocks and the fluctuations in oil price and financial stress in the US and Europe? Evidence from QARDL approach. Resources Policy, 72, 102021. [Google Scholar] [CrossRef]
- Henriques, I., & Sadorsky, P. (2008). Oil prices and the stock prices of alternative energy companies. Energy Economics, 30(3), 998–1010. [Google Scholar] [CrossRef]
- Kuang, W. (2023). The equity-oil hedge: A comparison between volatility and alternative risk frameworks. Energy, 271, 127045. [Google Scholar] [CrossRef]
- Kumar, S., Managi, S., & Matsuda, A. (2012). Stock prices of clean energy firms, oil and carbon markets: A vector autoregressive analysis. Energy Economics, 34(1), 215–226. [Google Scholar] [CrossRef]
- Lawinsider. (2023). Renewable energy equipment definition. Available online: https://www.lawinsider.com/dictionary/renewable-energy-equipment (accessed on 4 April 2023).
- Li, H., Li, Y., & Zhang, H. (2023). The spillover effects among the traditional energy markets, metal markets and sub-sector clean energy markets. Energy, 275, 127384. [Google Scholar] [CrossRef]
- Lv, X., Dong, X., & Dong, W. (2021). Oil prices and stock prices of clean energy: New evidence from Chinese subsectoral data. Emerging Markets Finance and Trade, 57(4), 1088–1102. [Google Scholar] [CrossRef]
- Maghyereh, A. I., Awartani, B., & Abdoh, H. (2019). The co-movement between oil and clean energy stocks: A wavelet-based analysis of horizon associations. Energy, 169, 895–913. [Google Scholar] [CrossRef]
- Managi, S., & Okimoto, T. (2013). Does the price of oil interact with clean energy prices in the stock market? Japan and the World Economy, 27, 1–9. [Google Scholar] [CrossRef]
- Nasir, R. M., & He, F. (2023). Do clean energy stocks and sub-sectors hedge China economic policy uncertainty: New evidence from wavelet analysis. Journal of Cleaner Production, 429, 139385. [Google Scholar] [CrossRef]
- Nunes, I. C., & Catalão-Lopes, M. (2020). The impact of oil shocks on innovation for alternative sources of energy: Is there an asymmetric response when oil prices go up or down? Journal of Commodity Markets, 19, 100108. [Google Scholar] [CrossRef]
- Pham, L. (2019). Do all clean energy stocks respond homogeneously to oil price? Energy Economics, 81, 355–379. [Google Scholar] [CrossRef]
- Reboredo, J. C., Rivera-Castro, M. A., & Ugolini, A. (2017). Wavelet-based test of co-movement and causality between oil and renewable energy stock prices. Energy Economics, 61, 241–252. [Google Scholar] [CrossRef]
- Sadorsky, P. (2012). Correlations and volatility spillovers between oil prices and the stock prices of clean energy and technology companies. Energy Economics, 34(1), 248–255. [Google Scholar] [CrossRef]
- Troster, V., Shahbaz, M., & Uddin, G. S. (2018). Renewable energy, oil prices, and economic activity: A Granger-causality in quantiles analysis. Energy Economics, 70, 440–452. [Google Scholar] [CrossRef]
- Xia, T., Ji, Q., Zhang, D., & Han, J. (2019). Asymmetric and extreme influence of energy price changes on renewable energy stock performance. Journal of Cleaner Production, 241, 118338. [Google Scholar] [CrossRef]
- Zhang, H., Cai, G., & Yang, D. (2020). The impact of oil price shocks on clean energy stocks: Fresh evidence from multi-scale perspective. Energy, 196, 117099. [Google Scholar] [CrossRef]
- Zhu, F., Jin, F., Wu, H., & Wen, F. (2019). The impact of oil price changes on stock returns of new energy industry in China: A firm-level analysis. Physica A: Statistical Mechanics and Its Applications, 532, 121878. [Google Scholar] [CrossRef]
Disclaimer/Publisher’s Note: The statements, opinions and data contained in all publications are solely those of the individual author(s) and contributor(s) and not of MDPI and/or the editor(s). MDPI and/or the editor(s) disclaim responsibility for any injury to people or property resulting from any ideas, methods, instructions or products referred to in the content. |
© 2025 by the author. Licensee MDPI, Basel, Switzerland. This article is an open access article distributed under the terms and conditions of the Creative Commons Attribution (CC BY) license (https://creativecommons.org/licenses/by/4.0/).