Article

Spectrum of Corona Discharges and Electric Arcs in Air under Aeronautical Pressure Conditions

Electrical Engineering Department, Universitat Politècnica de Catalunya, Rambla Sant Nebridi 22, 08222 Terrassa, Spain
Aerospace 2022, 9(9), 524; https://doi.org/10.3390/aerospace9090524
Submission received: 20 July 2022 / Revised: 14 September 2022 / Accepted: 15 September 2022 / Published: 18 September 2022

Abstract

:
Due to the increase in electrical power demand, future more electric and all-electric aircraft designs will operate at higher voltage levels compared to current aircraft. Due to higher voltage levels and reduced operating pressure, insulation systems will be at risk. Air is the main insulating medium, and it is well known that its dielectric strength decreases considerably with operating pressure. Although electrical discharges can be detected by different techniques, optical methods are very attractive due to their sensitivity and immunity to acoustic and electromagnetic noise typical of aeronautical environments. This work analyzes the UV-visible spectrum of corona discharges and electric arcs in the 10–100 kPa pressure range, which covers most of the aeronautical applications, due to the lack of experimental data for this pressure range. The data presented in this work are important to select the most suitable optical sensors to detect electrical discharges at an early stage, before significant damage occurs. This approach will help implement preventive maintenance plans and increase aircraft safety. The results presented in this paper can also be applied to other areas, such as monitoring of discharges in power lines, particularly those located in high-altitude regions.

1. Introduction

Due to the increasing demand of electric power in more electric aircrafts (MEA) and all electric aircrafts (AEA), distribution voltage levels are increasing [1,2] owing to weight limitations. Thus, the risks of premature damage to insulation systems [3] include, in order of increasing severity, surface discharges, arc tracking, arcing, and arcs [4]. In the initial stage, such phenomena manifest as partial discharges (PDs) and corona discharges [5]. While PDs form in solid and liquid insulation materials, corona manifests in gaseous insulation systems. Corona is a luminous and localized discharge generated in gaseous media in the presence of very non-uniform electric fields [6], when the strength of the electric field in the vicinity of an electrode exceeds a critical value [7]. Instead, electric arcs are luminous discharges that completely bridge the insulation between the two electrodes [8]. Under non-uniform gaps, the corona inception voltage is lower than the voltage required for complete air breakdown [9].
Persistent PDs tend to damage organic insulation materials due to chemical modifications induced by the flow of electrons at the discharge sites [10], which can generate a conductive path, thus favoring the circulation of an electric current, and a temperature rise that promotes arcing or complete breakdown [11]. Arcing often occurs between electrical wires insulated by a solid material once it chars. In general, at a very early stage, these discharges appear in the form of corona, which occurs in the region with the highest electric field intensity [8,12]. Thus, corona discharges generate failures in insulation materials, especially in low pressure environments representative of aircraft systems [13], since it is known that the development of electrical discharges depends largely on the density of air. According to Paschen’s curves [14], that were obtained for uniform field gaps, for a given air gap length, the minimum voltage to produce complete breakdown reduces with pressure. Since the dielectric strength of atmospheric air reduces with pressure, for a given voltage value, flashovers are more likely to occur when operating at a lower pressure. This is the case for jet aircrafts, private jets, or military aircrafts, which have cruising altitudes of 10–13 km range, up to 15 km, and above 15 km, respectively. Therefore, the pressure range to consider in aircraft systems is approximately between 100% and 10% of atmospheric pressure at sea level.
Future MEA and AEA designs will operate at voltages greater than 1 kV [13,15], even as high as 1.5–4.5 kV, higher dv/dt transient stress levels [16], higher power densities and higher ratios of compactness. Such conditions greatly increase the risk of electric discharge appearance [17], in the form of PDs, corona, arcing and arc tracking activity. Therefore, electric and electronic circuits found in unpressurized areas of the aircrafts are more prone to PD and corona occurrence [18], which present significantly lower inception voltages compared to those found at sea level. Therefore, insulation systems must be designed so that they are PD free for a wide range of pressures limited by those found in take-off/landing and cruise [19].
To comply with the strict aeronautic regulations, it is compulsory to minimize the risk of PDs, corona and arcing occurrence, which allows increasing the reliability of aircraft power systems, while minimizing failure incidence, enabling the application of predictive maintenance approaches [20], and increasing aircraft safety. Due to the stringent requirements related to the lightness and compactness of aircraft power systems, this is a demanding task for wiring and power system designers [21]. Strategies such as online or continuous monitoring of corona discharges facilitate the application of predictive maintenance strategies, which enable corrective actions to be applied before major failures develop [22], thus avoiding catastrophic failures. Today’s wide-body airliners incorporate hundreds of kilometers of cables and wires and hundreds of thousands of components for electrical wiring interconnecting systems (EWIS), such as terminations, clamps, connectors or splices. However, wires, harnesses, and most of the aforementioned components are placed inside ducts, troughs or conduits [23]. This makes it difficult to apply maintenance approaches because the problems related to discharges remain hidden, and especially in the early stage due to their low activity, so they go unnoticed by the electrical protections on board, although their uninterrupted effect eventually damages insulation systems [24] until a major failure occurs [25]. Although arcing and arc tracking are among the major electrical problems to be solved [26,27], often manifesting as corona discharges, their impact on future MEAs and AEAs is still poorly understood [28], for which it deserves thorough research. In addition, ducts, troughs or conduits in which harnesses and cabling systems are placed in aircrafts, are environments with very high levels of electromagnetic pollution. In such applications, optical sensors are attractive due to their immunity to electromagnetic and acoustic noise.
Corona activity produces different effects, including ultraviolet (UV), visible and infrared light [29,30], radio interference voltage, electromagnetic radiation, acoustic noise or generation of chemicals such as ozone or NOx, and even temperature changes [25]. Most strategies to detect the discharges are based on measuring some of these effects [31]. PDs and corona discharges are often detected by different methods, including acoustic, optical or electrical methods. In general, however, such methods do not allow the direct location of discharge points, or they require the use of multiple sensors and complex signal processing. Optical methods are appealing over other alternatives, due to their inherent immunity to electromagnetic and acoustic noise characteristics of aircraft environments. In [32] it was shown using conventional partial discharge detectors and image sensors, that the intensity of the discharges is related to the number of photons generated, while other works have shown that the energy of the light emitted by the discharges is related to the energy of discharges [33,34]. The use of image sensors is advantageous, since they allow to locate the discharge sites and to quantify the intensity of the discharges. Recent developments of low-cost, small-size, and high-resolution UV-visible image sensors [12,35] facilitate this task. This is a very interesting approach to analyze the evolution of the discharges and predict the end of life of the insulation, which can very useful for predictive maintenance, a hot topic that in this field which is totally open, requiring research and extensive experimental plans.
This work studies the UV-visible spectrum of corona discharges and electric arcs in the 10–100 kPa pressure range, which is typical of aircraft applications. To the authors’ knowledge, there is a lack of experimental data for this pressure range typical of aircraft applications, i.e., at variable pressure, so this paper contributes in this area. The information obtained in this paper is important in order to select the most suitable sensors to enable the detection of discharges in their initial phase, long before major damage occurs, while complementing the current on board protections, which act once faults have developed. In this way, it is possible to prevent the development of major insulation faults, apply preventive maintenance approaches and increase aircraft safety. This is an important research topic, due to the implications in next generations of aircrafts and also due to the lack of experimental work in this area. The results presented in this paper can also be applied to other areas, such as to monitor discharges in power lines, especially those located in high-altitude regions.
The rest of the article is organized as follows. Section 2 reviews previous studies focused on the characterization of corona discharges and electric arcs in atmospheric air. Section 3 details how the raw spectral data provided by the spectrometer was processed. Section 4 details the experimental setup used in the experimental part, including the high-voltage source, the analyzed electrodes, the electrical instrumentation used and the spectrometer. Section 5 presents and discussed the experimental results, and finally, Section 6 concludes this experimental paper.

2. Previous Studies

This section reviews previous studies on the emission spectra of corona discharges and electric arcs in air, and in other gases. The emission spectrum of chemical compounds or elements originates from the photons emitted by the excited electrons that transit from a high-energy state to a lower-energy state, so that the energy of the photons emitted is equal to the energy difference between the initial and final energy states. Since many electron transitions are possible for a given chemical element, each transition has a characteristic energy change, so that adding all the different transitions provides the emission spectrum. For a given molecule, vibrational, rotational, combined vibrational and electronic transitions are possible, often leading to closely spaced spectral bands. Emission spectra often include a spectral continuum made up of unresolved bands.
In an earlier work [36], the optical emission spectra of corona discharges in SF6 gas and in atmospheric air were studied, showing evident differences, although it was stated that no difference was observed for different pressures of SF6 gas in the range of 100–500 kPa. In [37] the emission spectra of corona discharges in different gases, including air, He and N2 at a pressure of 3 atm. were analyzed, showing evident differences for the different gases. In [38] it was concluded that the emission spectrum of H2 is mainly in the visible region, although a smaller part is in the IR, while the emission spectrum of SF6 gas is in the UV and within the blue-green region of the visible. The emission spectrum of transformer oil is mainly in the 350–700 nm, but it depends on the composition of the oil, as transformer oil is predominantly composed of hydrogen and hydrocarbons. Therefore, the emission spectrum depends on the nature of the gas, since the characteristic bands are related to the chemical components of the gas. In [39], the spectral emissions of corona discharges under a positive impulse voltage in air at atmospheric pressure were measured in the UV-visible region, concluding that strong radiation and a clear band sequence structure is found in the 300–450 nm near-UV region, but in the visible region the radiation is much weaker and the spectrum is more complex. In [29], the electromagnetic spectra of electric arcs were measured within the 200–1100 nm range by applying voltages of 50 Hz up to 80 kV, where important emissions within the UV region were measured. In [30,40] the optical spectra of arc discharges at different supply frequencies in the ranges of 13.5–100 kHz and 5–130 kHz were presented, showing similar spectral responses regardless of the supply frequency, although under DC supply a different response was reported.
According to [38], the light spectrum of the discharges depends on their intensity and the nature of the insulation medium (solid, liquid or gas), as well as weather factors such as pressure or temperature. In [38], it was stated that N2 governs the optical emission spectrum of electrical discharges in atmospheric air, where about 90% of the total optical energy emitted is in the UV region, mainly in the 280–405 nm spectral range. The results presented in [38] were corroborated in a recent work, [41], where it was shown that the characteristic spectrum of corona in atmospheric air is composed of near-UV spectral bands due to energy level transitions of N2 molecules, while the number of photons emitted by air corona increases with the amplitude and frequency of the applied voltage. The characteristic bands were shown to be located 316, 337, 357, 375, 380, 393, 399 and 405 nm. In [42], the optical emission spectrum of point-plane positive corona discharges in air was studied, corroborating the presence of spectral bands in characteristic bands of transitions in N2 with lines at 316, 337, 357 and 380 nm. In the case of negative corona, according to [42], the main emission lines are located at 316, 337, 357, 375, 380, 393, 399 and 405 nm. Therefore, it is concluded that positive and negative coronas in air present similar emission spectra. After a careful review of the literature, it is concluded that studies of corona discharges and electric arcs in air at low pressure conditions typical of aircraft environments are lacking.

3. Spectra Processing

The raw spectral information acquired by the mini CCD spectrometer used in this work contains background and internal noise, which can be partially reduced by applying two strategies. On the one hand, the average value of 100 scans was calculated for each spectral acquisition. On the other hand, to minimize the effect of the background light, the spectrum obtained with total darkness was subtracted from the spectrum of each discharge condition, and finally, the spectra were normalized to facilitate their comparison, as detailed in Figure 1.

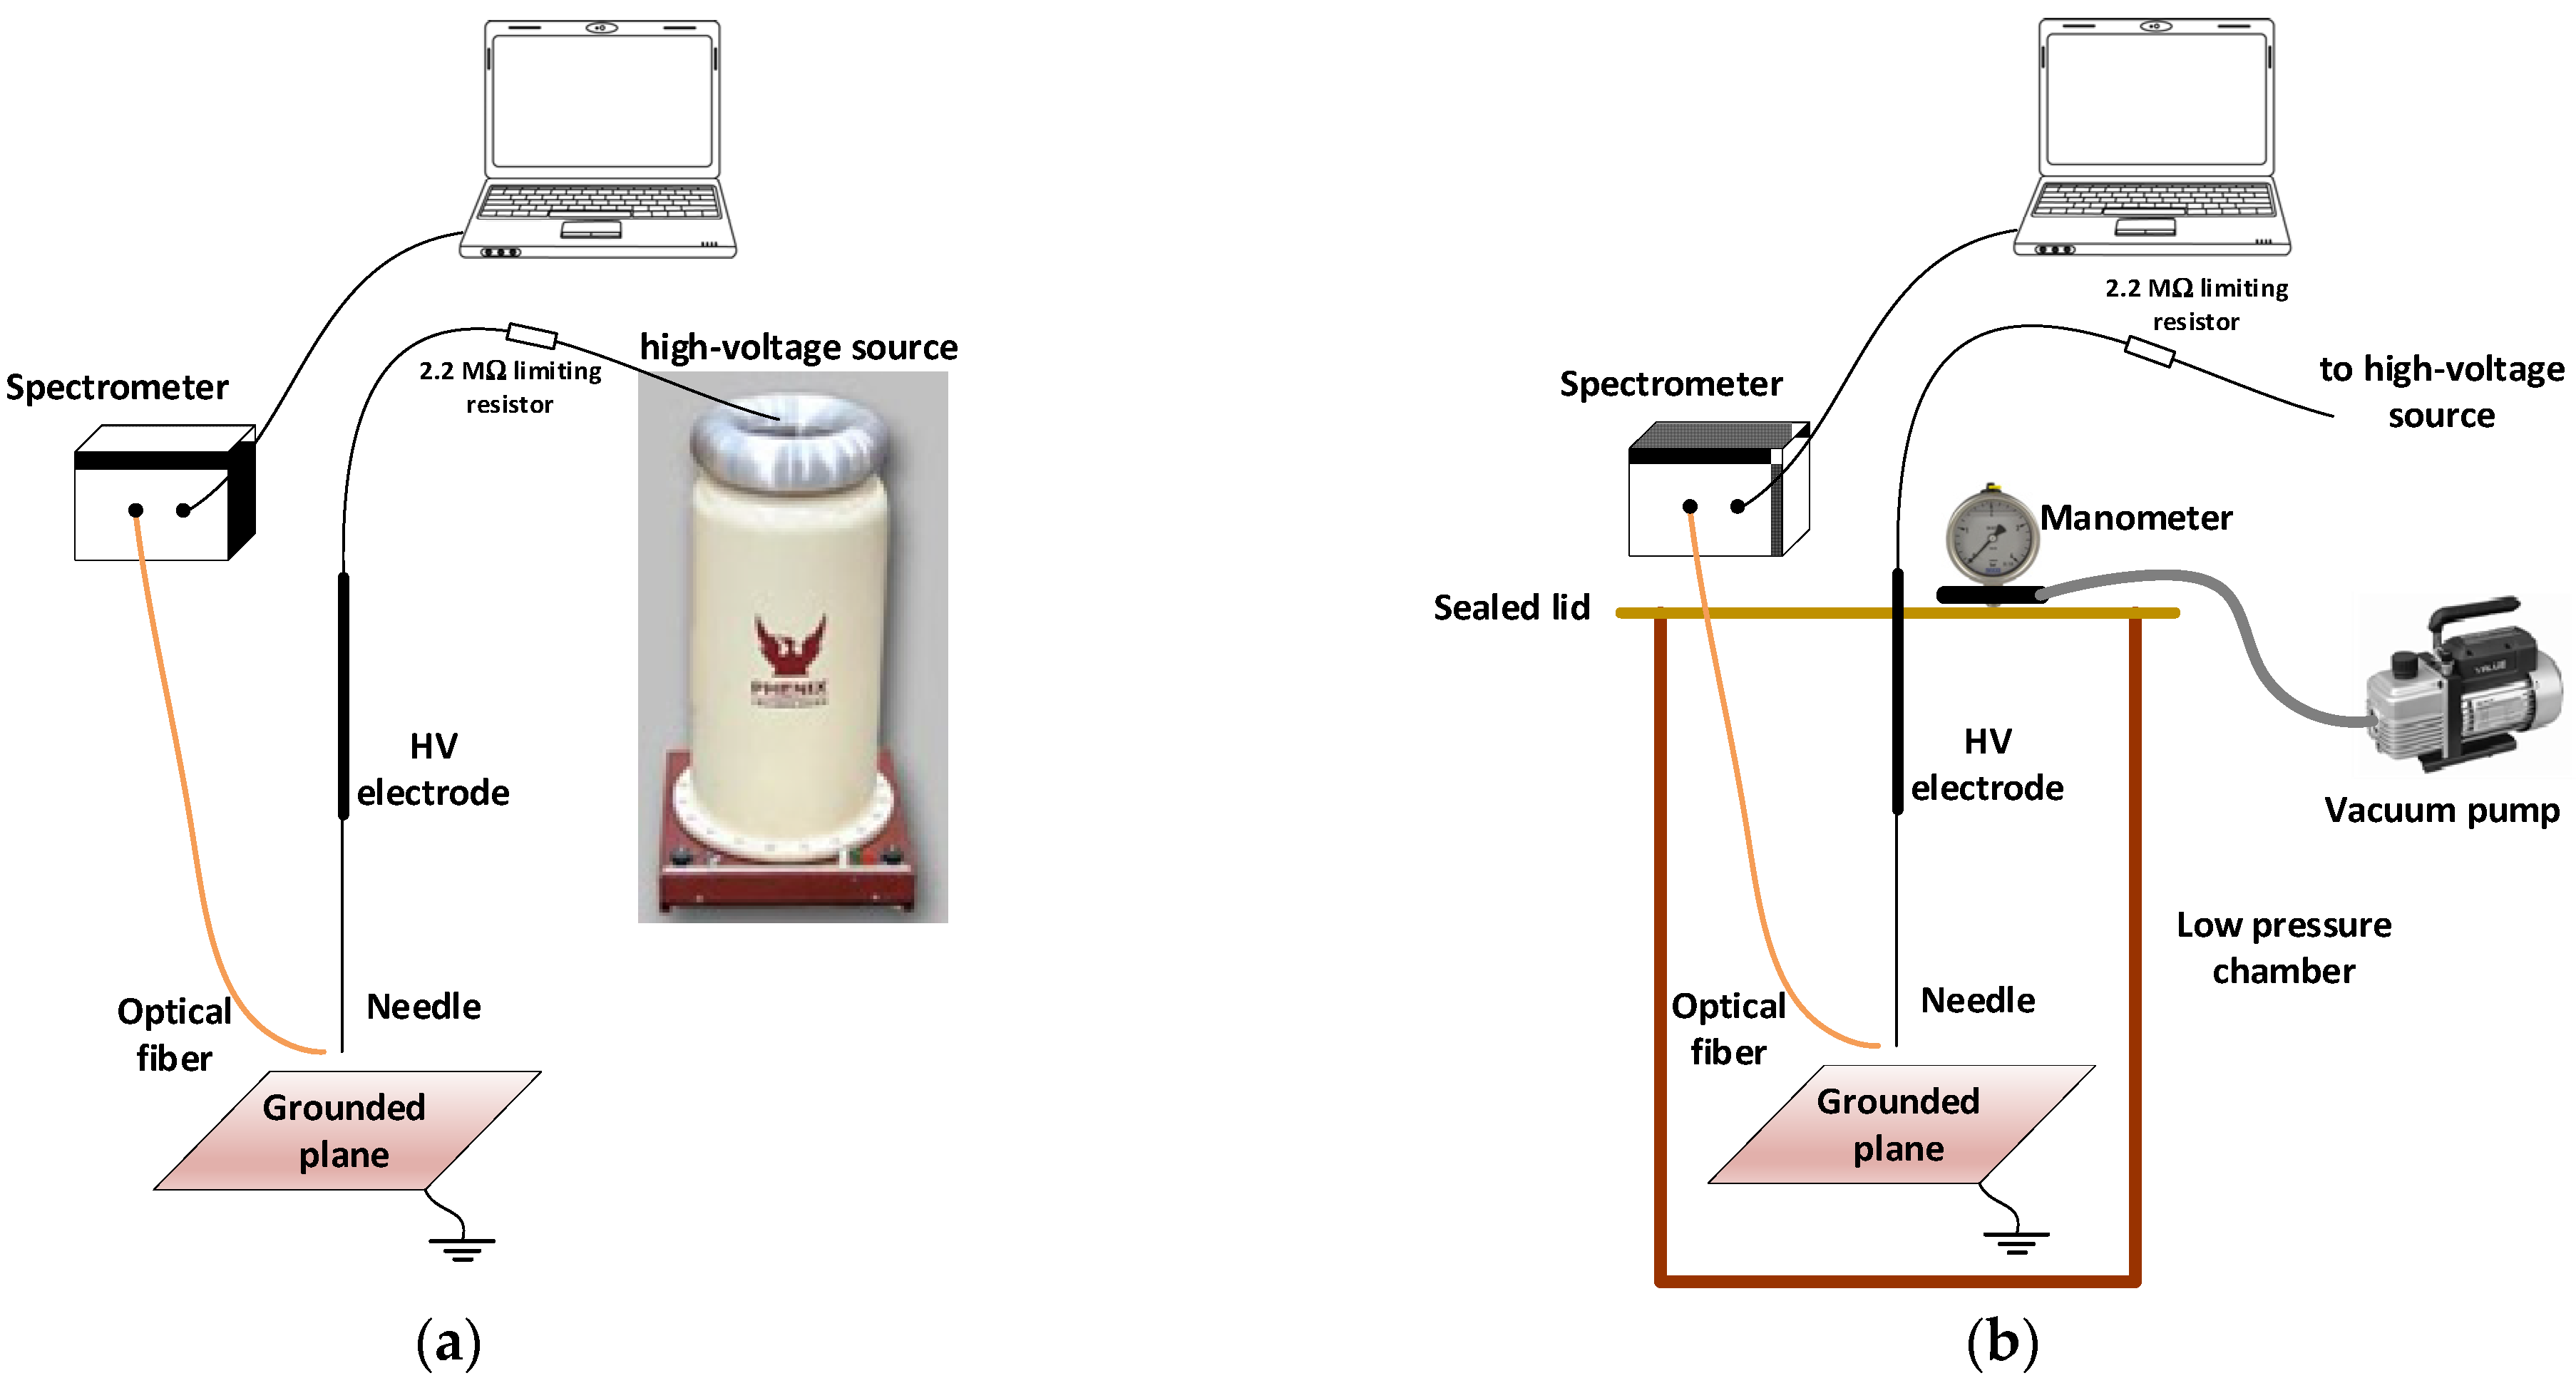
4. Experimental Setup

The UV-visible spectra were acquired with a high-sensitivity mini-spectrometer (C10082CAH, CCD type, spectral response in the 200–800 nm range, 4 nm resolution, Hamamatsu, Hamamatsu City, Japan). To minimize the effect of noise, each spectrum was obtained by averaging 100 acquisitions. An A15362-01 optical fiber with a core diameter of 600 μm and a length of 1.5 m was used to conduct the light emitted by the discharges to the spectrometer. Spectra were acquired with an integration time of 100 ms.
The experiments were carried out in two phases. In the first phase, discharges were generated at standard atmospheric conditions in the AMBER high-voltage laboratory of the Universitat Politècnica de Catalunya using calibrated 130 kV alternating current (50 Hz) hipot (BK-130, variable output voltage 0–130 kV, Phenix Technologies, Campbell, CA, USA). The second phase was carried out inside a low pressure chamber (internal diameter 260 mm, height 375 mm), connected to a vacuum pump, which allows changing the pressure from 100 kPa to less than 10 kPa. Pressure changes were applied in steps of 10 kPa. In this case, the 50 Hz alternating current voltage was generated by means of a programmable source (SP300VAC600W, 0–300 V, 15–1000 Hz, 0.1 V resolution, APM Technologies, Dongguan, China) connected to a single-phase instrument transformer (VKPE-36, 36 kV, turns ratio 1:100, Laboratorio Electrotécnico, Cornellà de Llobregat, Spain). Voltage was measured with a high-voltage probe (CT4028, 0-27 kVRMS, division ratio 1000:1, accuracy < 3%, CalTest Electronics, Yorba Linda, CA, USA), which was connected to a true RMS voltmeter (Fluke 289, Fluke, Everett, Washington, DC, USA).
Tests in a conventional unpressured high-voltage laboratory were carried out to ensure consistency with published data and to determine possible spectral differences between corona discharges and electric arcs. The second tests were performed using a low pressure chamber to obtain data at variable pressure. Figure 2 shows the schematics of the layout used in the high-voltage laboratory and in the low pressure chamber.

5. Results

This section summarizes the experimental results conducted first in a standard high-voltage laboratory at atmospheric pressure, and then inside a low pressure chamber. Both tests used a needle-plane geometry in air. While the first tests were carried out to ensure consistency with published data and to determine the spectral differences between corona discharges and electric arcs, the second ones were performed at variable pressure.

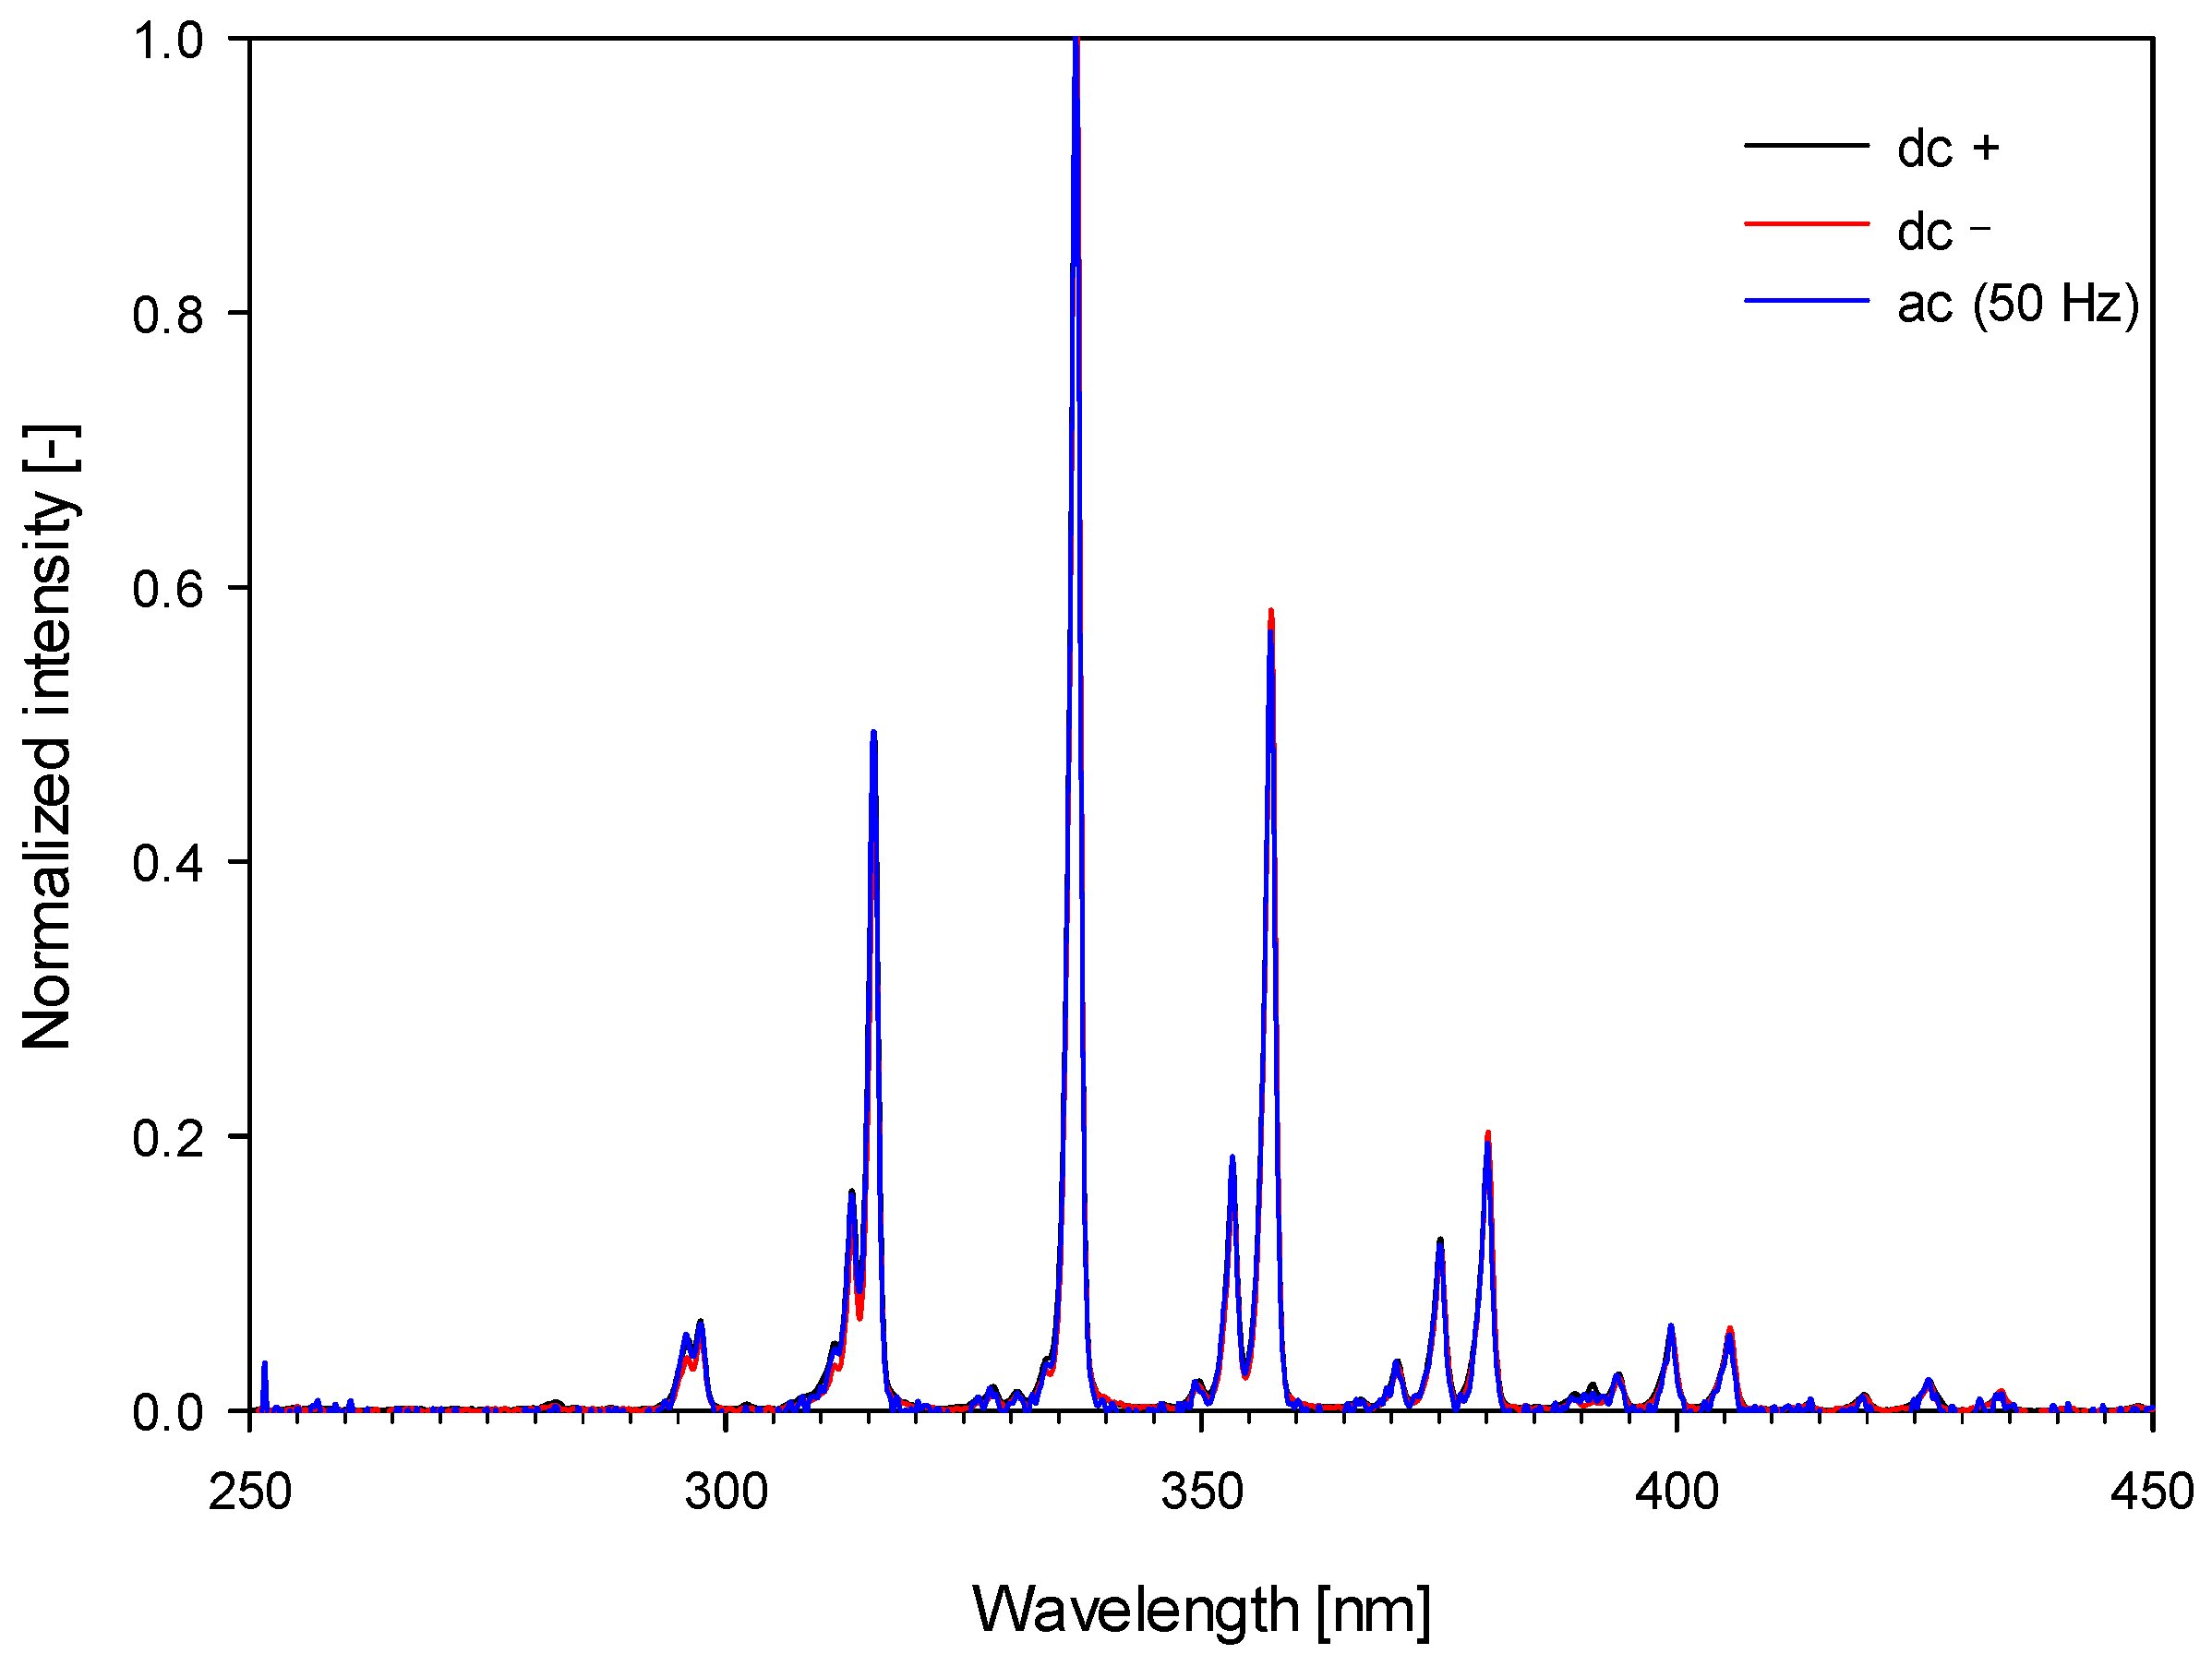
5.1. Corona Discharges at Standard Pressure with ac (50 Hz) and dc Supply of Both Polarities

This section compares the corona spectra with 50 Hz ac supply and dc supply of positive and negative polarities at standard air pressure. The results obtained are summarized in Figure 3.
Results presented in Figure 3 show that most of the corona activity is in the near-UV region and the violet region of the visible wavelengths, mainly between 295 and 405 nm. They also show a great similitude between the emission spectra under ac and dc supply, even when comparing the emission spectra with positive and negative dc supplies. These results are compatible with previous studies found in the literature at standard pressure [38,41,42,43], since the central wavelengths of the main spectral bands are found at 295, 316, 337, 357, 380, 393, 399, 405 and 427 nm.
Table 1 shows the relative intensities of the different spectral bands and their relative intensities.

5.2. Electric Arcs at Standard Pressure with ac (50 Hz) and dc Supply of Both Polarities

This section compares the spectra of electric arcs with ac and positive and negative dc supplies at standard air pressure.
The electric arcs were generated without air replacement with 50 Hz ac supply, as shown in Figure 4. It is seen that, as in the case of ac and dc corona discharges, the central wavelengths of the main spectral bands are at 295, 316, 337, 357, 380, 393, 399, 405 and 427 nm.
The air in the discharge region was then replaced by forced ventilation using a fan. The results obtained are summarized in Figure 5.
As shown in Figure 5, the spectra of electric arcs with forced ventilation are more complex, having more components in the visible region compared to the spectra of corona discharges. According to [37,43] the emission spectra of excited molecules (N2*), ions (N2+*) and atomic radicals (N*, O*) also contain many bands within the entire visible and near-IR wavelength range. Emission spectra in the visible and near-IR regions are due to energy level transitions of outer electronics and the vibrations of chemical bonds of nitrogen molecules excited by the intense electric field [41]. In the case of electric arcs with forced ventilation, due to the pureness of the air suffering the ionization, this excitation could be more effective, thus producing more activity in the visible region.

5.3. Corona Discharges in the 100–20 kPa Pressure Range with ac Supply

This section compares the corona spectra with ac supply at different pressures characteristic of aircraft environments. The results obtained are summarized in Figure 6.
Results presented in Figure 6 show that most of the corona activity is in the near-UV region and the violet region of the visible wavelengths, mainly between 295 and 405 nm. They also show a high similarity between the emission spectra with ac and dc supply, and when comparing the emission spectra under positive and negative dc supply. These results are compatible with previous studies found in the literature at standard pressure [38,41,42], since the central wavelengths of the main spectral bands are found at 295, 316, 337, 357, 380, 393, 399, 405 and 427 nm.
Table 2 shows the different spectral bands and their relative intensities.

5.4. Electric Arcs in the 100–10 kPa Pressure Range with ac Supply

This section compares the spectra of electric arcs with ac supply in the 100–10 kPa pressure range inside the low pressure chamber without forced ventilation during the discharge. Due to the closed environment of the low pressure chamber, this condition emulates the possible discharges occurring in aircraft environments such as ducts, troughs or conduits, containing wires and harnesses.
Results presented in Figure 7 show that the central wavelengths of the main spectral bands are the same as those found in the case of corona discharges, being located at 295, 316, 337, 357, 380, 393, 399, 405 and 427 nm.
Table 3 shows the different spectral bands and their relative intensities.

6. Applicability of the Results

Results presented in this paper suggest that, regardless of the amplitude of the applied voltage (Section 4 presents results between 1 and 80 kV), the normalized spectra of the discharges are almost unaltered, which facilitates the process of detecting the discharges. It allows dealing with different air gap geometry, which greatly influences the discharge inception voltage. These results also show that in closed environments, regardless of the pressure and the type of voltage (ac or dc positive and negative), the main spectral bands of the emission spectra of corona discharges and electric arcs are placed in similar locations, mainly in the near-UV and violet regions of the spectrum. This behavior is probably due to leading role of the composition of the gas, since the emission spectrum is due to the photons emitted by the excited electrons that transit from a high-energy state to a lower-energy state.
The characteristic spectrum of corona discharges in air has been shown to be primarily restricted to the 290–420 nm range, thus consisting essentially of near-UV (290–380 nm) and violet (380–420 nm) regions of the spectrum. The light emitted by the discharges is essentially due to the energy level transitions of the N2 molecules, as nitrogen is by far the main component of air, while the number of photons emitted in the discharge process is directly related to the intensity of the discharge [44].
These results allow selecting the most suitable sensors for each application. Therefore, to detect corona discharges and electric arcs, such sensors must be sensitive at least in the range of 290–420 nm. For applications that require detecting discharges at a very early stage, very sensitive sensors are required, such as gas-filled sensors or optical sensors using image intensifiers or photomultipliers [45]. However, the sensitivity of sensors intended to detect electric arcs is less restrictive. Finally, if there is a need to accurately locate the discharge sites, CMOS or CCD image sensors are a good choice, as they offer good sensitivity and the ability to quantify the intensity of the discharges.
Finally, surface discharges occurring in air in close vicinity to a solid dielectric surface also generate light, due to the ionization of air, so they are similar to corona. However, internal discharges in opaque materials cannot be sensed using optical methods.

7. Conclusions

This paper has measured the UV-visible spectra of corona discharges and electric arcs in air in the pressure range of 10–100 kPa, which is representative of most aircraft environments. The results presented here are of particular interest for future aircraft designs, which will operate at higher voltage levels compared to current aircrafts. In addition, there is a lack of data related to this topic in the scientific literature. The combined effect of higher voltage levels and low-pressure environments puts air-insulated systems at risk, due to the reduced dielectric strength of air at low pressure. Electrical discharges can be detected using different methods, but most are susceptible to acoustic and electromagnetic noise typical of aircraft environments, making optical methods very attractive due to their sensitivity and relative immunity to electromagnetic and acoustic noise. It has been found that, regardless of operating pressure, supply voltage (ac, positive dc or negative dc) and type of discharge (corona or electric arcs), air discharges in closed environments generate an emission spectrum centered in the near-UV and violet regions, whose characteristic bands have been identified in this paper. The data presented in this paper can help to select the most suitable optical sensors to detect corona discharges at an early stage, long before significant damage occurs. These data can be useful in developing predictive maintenance approaches, thus preventing the development of major insulation failures and increasing aircraft safety. The results presented in this work can also be useful in other areas, such as monitoring discharges on power lines installed in high-altitude regions.

Funding

This research was funded by Ministerio de Ciencia e Innovación de España, grant number PID2020-114240RB-I00 and by the Generalitat de Catalunya, grant number 2017 SGR 967.

Data Availability Statement

Not applicable.

Acknowledgments

We would thank Hamamatsu Photonics for lending us a UV-visible spectrometer.

Conflicts of Interest

The author declares no conflict of interest.

References

  1. Borghei, M.; Ghassemi, M. Insulation Materials and Systems for More and All-Electric Aircraft: A Review Identifying Challenges and Future Research Needs. IEEE Trans. Transp. Electrif. 2021, 7, 1930–1953. [Google Scholar] [CrossRef]
  2. Riba, J.-R.; Gómez-Pau, Á.; Moreno-Eguilaz, M. Experimental Study of Visual Corona under Aeronautic Pressure Conditions Using Low-Cost Imaging Sensors. Sensors 2020, 20, 411. [Google Scholar] [CrossRef] [PubMed]
  3. Riba, J.-R.; Gómez-Pau, Á.; Moreno-Eguilaz, M.; Bogarra, S. Arc Tracking Control in Insulation Systems for Aeronautic Applications: Challenges, Opportunities, and Research Needs. Sensors 2020, 20, 1654. [Google Scholar] [CrossRef] [PubMed]
  4. Federal Aviation Administration. Aircraft Electrical Wiring Interconnect System (EWIS) Best Practices; FAA: Washington, DC, USA, 2020.
  5. Shafiq, M.; Robles, G.; Kauhaniemi, K.; Stewart, B.; Lehtonen, M. Propagation Characteristics of Partial discharge Signals in Medium Voltage Branched Cable Joints using HFCT Sensor. In Proceedings of the 25th International Conference on Electricity Distribution (CIRED 2019), Madrid, Spain, 3–6 June 2019; pp. 1–5. [Google Scholar] [CrossRef]
  6. Borghei, M.; Ghassemi, M. Separation and Classification of Corona Discharges under Low Pressures Based on Deep Learning Method. IEEE Trans. Dielectr. Electr. Insul. 2022, 29, 319–326. [Google Scholar] [CrossRef]
  7. Zhang, C.; Yi, Y.; Wang, L. Positive dc corona inception on dielectric-coated stranded conductors in air. IET Sci. Meas. Technol. 2016, 10, 557–563. [Google Scholar] [CrossRef]
  8. IEEE Std 100-2000; The Authoritative Dictionary of IEEE Standards Terms, Seventh Edition. IEEE: Piscataway, NJ, USA, 2000; pp. 1–1362. [CrossRef]
  9. Anis, H.; Srivastava, K.D. Pre-breakdown Discharges in Highly Non-uniform Fields in Relation to Gas-insulated Systems. IEEE Trans. Electr. Insul. 1982, EI-17, 131–142. [Google Scholar] [CrossRef]
  10. Du, B.X.; Liu, Y.; Liu, H.J. Effects of low pressure on tracking failure of printed circuit boards. IEEE Trans. Dielectr. Electr. Insul. 2008, 15, 1379–1384. [Google Scholar] [CrossRef]
  11. Cella, B. On-line Partial Discharges Detection in Conversion Systems Used in Aeronautics. Ph.D. Thesis, Université de Toulouse, Toulouse, France, 2015. [Google Scholar]
  12. Riba, J.-R.; Morosini, A.; Capelli, F. Comparative Study of AC and Positive and Negative DC Visual Corona for Sphere-Plane Gaps in Atmospheric Air. Energies 2018, 11, 2671. [Google Scholar] [CrossRef] [Green Version]
  13. Mermigkas, A.C.; Clark, D.; Manu Haddad, A. Investigation of High Altitude/Tropospheric Correction Factors for Electric Aircraft Applications. In Lecture Notes in Electrical Engineering, Proceedings of the 21st International Symposium on High Voltage Engineering, Budapest, Hungary, 26–30 August 2019; Springer: Cham, Switzerland, 2020; pp. 308–315. [Google Scholar] [CrossRef]
  14. Paschen, F. Ueber die zum Funkenübergang in Luft, Wasserstoff und Kohlensäure bei verschiedenen Drucken erforderliche Potentialdifferenz. Ann. Phys. 1889, 273, 69–96. [Google Scholar] [CrossRef]
  15. Jiang, J.; Wang, K.; Chen, L.; Cotton, I.; Chen, J.; Chen, J.; Zhang, C. Optical sensing of partial discharge in more electric aircraft. IEEE Sens. J. 2020, 20, 12723–12731. [Google Scholar] [CrossRef]
  16. Pastura, M.; Nuzzo, S.; Immovilli, F.; Toscani, A.; Rumi, A.; Cavallini, A.; Franceschini, G.; Barater, D. Partial Discharges in Electrical Machines for the More Electric Aircraft—Part I: A Comprehensive Modeling Tool for the Characterization of Electric Drives Based on Fast Switching Semiconductors. IEEE Access 2021, 9, 27109–27121. [Google Scholar] [CrossRef]
  17. Belijar, G.; Chanaud, G.; Hermette, L.; Risacher, A. Study of Electric Arc Ignition, Behavior and Extinction in Aeronautical Environment in Presence of FOD; HAL Open Science: Lyon, France, 2017; pp. 1–8. [Google Scholar]
  18. Esfahani, A.N.; Shahabi, S.; Stone, G.; Kordi, B. Investigation of Corona Partial Discharge Characteristics Under Variable Frequency and Air Pressure. In Proceedings of the 2018 IEEE Electrical Insulation Conference (EIC), San Antonio, TX, USA, 17–20 June 2018; pp. 31–34. [Google Scholar] [CrossRef]
  19. Ramin, R.; Montanari, G.C.; Yang, Q. Designing the Insulation System for Motors in Electrified Aircraft: Optimization, Partial Discharge Issues and Use of Advanced Materials. Materials 2021, 14, 7555. [Google Scholar] [CrossRef] [PubMed]
  20. Capineri, L.; Dainelli, G.; Materassi, M.; Dunn, B.D. Partial discharge testing of solder fillets on PCBs in a partial vacuum: New experimental results. IEEE Trans. Electron. Packag. Manuf. 2003, 26, 294–304. [Google Scholar] [CrossRef]
  21. Rui, R.; Cotton, I. Impact of low pressure aerospace environment on machine winding insulation. In Proceedings of the 2010 IEEE International Symposium on Electrical Insulation, San Diego, CA, USA, 6–9 June 2010; pp. 1–5. [Google Scholar] [CrossRef]
  22. Xavier, G.V.R.; Da Costa, E.G.; Serres, A.J.R.; Nobrega, L.A.M.M.; Oliveira, A.C.; Sousa, H.F.S. Design and Application of a Circular Printed Monopole Antenna in Partial Discharge Detection. IEEE Sens. J. 2019, 19, 3718–3725. [Google Scholar] [CrossRef]
  23. Bas-Calopa, P.; Riba, J.R.; Moreno-Eguilaz, M. Corona Discharge Characteristics under Variable Frequency and Pressure Environments. Sensors 2021, 21, 6676. [Google Scholar] [CrossRef] [PubMed]
  24. Zhang, L. Electrical Tracking over Solid Insulating Materials for Aerospace Applications. Ph.D. Thesis, University of Manchester, Manchester, UK, 2011. Available online: https://www.research.manchester.ac.uk/portal/files/54508943/FULL_TEXT.PDF (accessed on 14 September 2022).
  25. Riba, J.-R.; Gomez-Pau, A.; Moreno-Eguilaz, M. Sensor Comparison for Corona Discharge Detection Under Low Pressure Conditions. IEEE Sens. J. 2020, 20, 11698–11706. [Google Scholar] [CrossRef]
  26. Clean Sky. Annex: 11th Call for Proposals (CFP11)—List and Full Description of Topics Call Text. 2019. Available online: https://ec.europa.eu/info/funding-tenders/opportunities/docs/cap/h2020/jti-cs2-2020-cfp11-tht-12/1875197-cfp11_call_text_-_list_and_full_description_of_topics_r1_en.pdf (accessed on 12 November 2020).
  27. Wu, X.; Mahmoudi, R.; Xing, L.; Lents, C.E. Arc detection for high voltage aircraft distribution systems. In Proceedings of the AIAA Propulsion and Energy 2019 Forum, Indianapolis, IN, USA, 19–22 August 2019. [Google Scholar] [CrossRef]
  28. Clean Sky. Annex V: 9th Call for Proposals (CFP09)—List and Full Description of Topics. 2018. Available online: http://ec.europa.eu/research/participants/portal/doc/call/h2020/jti-cs2-2018-cfp09-lpa-01-70/1837638-cfp09_call_text_-_list_and_full_description_of_topics_r1_en.pdf (accessed on 12 November 2020).
  29. Nagi, Ł.; Kozioł, M.; Wotzka, D. Analysis of the spectrum of electromagnetic radiation generated by electrical discharges. IET Sci. Meas. Technol. 2019, 13, 812–817. [Google Scholar] [CrossRef]
  30. Nagi, Ł.; Kozioł, M.; Zygarlicki, J. Optical Radiation from an Electric Arc at Different Frequencies. Energies 2020, 13, 1676. [Google Scholar] [CrossRef]
  31. Yuan, Z.; Ye, Q.; Wang, Y.; Guo, Z. State Recognition of Surface Discharges by Visible Images and Machine Learning. IEEE Trans. Instrum. Meas. 2020, 70, 5004511. [Google Scholar] [CrossRef]
  32. Pinnangudi, B.; Gorur, R.S.S.; Kroese, A.J.J. Quantification of corona discharges on nonceramic insulators. IEEE Trans. Dielectr. Electr. Insul. 2005, 12, 513–523. [Google Scholar] [CrossRef]
  33. Prasad, D.S.; Reddy, B.S. Understanding Corona Discharges using Digital Imaging. In Proceedings of the 2018 IEEE International Conference on High Voltage Engineering and Application (ICHVE), Athens, Greece, 10–13 September 2018; pp. 1–4. [Google Scholar] [CrossRef]
  34. Riba, J.-R.; Gómez-Pau, Á.; Moreno-Eguilaz, M. Insulation Failure Quantification Based on the Energy of Digital Images Using Low-Cost Imaging Sensors. Sensors 2020, 20, 7219. [Google Scholar] [CrossRef] [PubMed]
  35. Bas-Calopa, P.; Riba, J.-R.; Moreno-Eguilaz, M. Measurement of Corona Discharges under Variable Geometry, Frequency and Pressure Environment. Sensors 2022, 22, 1856. [Google Scholar] [CrossRef] [PubMed]
  36. Fujii, K.; Yamada, M.; Tanaka, A.; Kurosawa, K. Emission spectrum of partial discharge light in SF6 gas. In Proceedings of the Conference Record of the 1992 IEEE International Symposium on Electrical Insulation, Baltimore, MD, USA, 7–10 June 1992; pp. 332–335. [Google Scholar] [CrossRef]
  37. Grum, F.; Costa, L.F. Spectral emission of corona discharges. Appl. Opt. 1976, 15, 76–79. [Google Scholar] [CrossRef] [PubMed]
  38. Muhr, M.; Schwarz, R. Experience with optical partial discharge detection. Mater. Sci. Pol. 2009, 27, 1139–1146. Available online: https://yadda.icm.edu.pl/yadda/element/bwmeta1.element.baztech-article-BPW7-0012-0020 (accessed on 11 June 2022).
  39. Gallimberti, I.; Hepworth, J.K.; Klewe, R.C. Spectroscopic investigation of impulse corona discharges. J. Phys. D Appl. Phys. 1974, 7, 880. [Google Scholar] [CrossRef]
  40. Nagi, Ł.; Kozioł, M.; Zygarlicki, J. Comparative Analysis of Optical Radiation Emitted by Electric Arc Generated at AC and DC Voltage. Energies 2020, 13, 5137. [Google Scholar] [CrossRef]
  41. Zhao, Y.; Li, Y.; Li, K.; Han, D.; Qiu, Z.; Zhang, G. Emission Spectrum Analysis of Two Typical Partial Discharge Forms under High Frequency Square Wave Voltages. IEEE Access 2020, 8, 219946–219954. [Google Scholar] [CrossRef]
  42. Czech, T.; Sobczyk, A.T.; Jaworek, A. Optical emission spectroscopy of point-plane corona and back-corona discharges in air. Eur. Phys. J. D 2011, 65, 459–474. [Google Scholar] [CrossRef]
  43. Janda, M.; Martišovitš, V.; Hensel, K.; Machala, Z. Generation of Antimicrobial NOx by Atmospheric Air Transient Spark Discharge. Plasma Chem. Plasma Process. 2016, 36, 767–781. [Google Scholar] [CrossRef]
  44. Riba, J.-R.; Bas-Calopa, P.; Qolla, Y.A.; Pourraz, M.; Ozsahin, B. Using CMOS Image Sensors to Determine the Intensity of Electrical Discharges for Aircraft Applications. Appl. Sci. 2022, 12, 8595. [Google Scholar] [CrossRef]
  45. Riba, J.-R. Application of Image Sensors to Detect and Locate Electrical Discharges: A Review. Sensors 2022, 22, 5886. [Google Scholar] [CrossRef] [PubMed]
Figure 1. Spectral data processing to minimize the effect of noise.
Aerospace 09 00524 g001
Figure 2. (a) Needle-plane gap in the high-voltage laboratory; and (b) needle-plane gap in the low pressure chamber.
Aerospace 09 00524 g002
Figure 3. Normalized spectra of the corona discharges with positive and negative dc supply, and 50 Hz ac supply using a needle-plane gap (diameter = 3.5 mm, gap = 150 mm).
Aerospace 09 00524 g003
Figure 4. Electric arcs without forced ventilation. Normalized spectra with 50 Hz ac supply at 43 kV, using a needle-plane gap (diameter = 3.5 mm, gap = 70 mm).
Aerospace 09 00524 g004
Figure 5. Electric arcs with forced ventilation (air replacement with fresh air). Normalized spectra of electric arcs with 50 Hz ac supply at 43 kV using a needle-plane gap (diameter = 3.5 mm, gap = 70 mm).
Aerospace 09 00524 g005
Figure 6. Normalized spectra of the corona discharges with positive and negative dc supply and 50 Hz ac supply in the 100–20 kPa pressure range using a needle-plane gap (diameter = 1.0 mm, gap = 30 mm).
Aerospace 09 00524 g006
Figure 7. Normalized spectra of the electric arcs with ac supply in the 100–10 kPa pressure range using a needle-plane gap (diameter = 1.0 mm, gap = 30 mm).
Aerospace 09 00524 g007aAerospace 09 00524 g007b
Table 1. Experimental corona conditions with a needle-plane gap (diameter = 3.5 mm, gap = 150 mm), main spectral bands and their relative intensities.
ConditionsApplied Voltage kVRelative Intensity [−] of Bands with Central Points at
295, 316, 337, 357, 380, 393, 399, 405, 427 nm
50 Hz ac500.06, 0.47, 1, 0.56, 0.19, 0.02, 0.06, 0.06, 0.02
Positive dc720.06, 0.45, 1, 0.56, 0.20, 0.02, 0.06, 0.06, 0.02
Negative dc−800.07, 0.48, 1, 0.56, 0.19, 0.03, 0.06, 0.06, 0.02
Table 2. Corona discharges. Experimental conditions using a needle-plane gap (diameter = 1.0 mm, gap = 30 mm), main spectral bands and their relative intensities.
PressureApplied Voltage [kVRMS]Relative Intensity [−] of Bands with Central Points at 295, 316, 337, 357, 380, 393, 399, 405, 427 nm
10013.70.06, 0.46, 1, 0.55, 0.18, 0.03, 0.06, 0.06, 0.03
9012.50.07, 0.45, 1, 0.56, 0.19, 0.02, 0.07, 0.06, 0.02
8011.40.06, 0.47, 1, 0.56, 0.19, 0.03, 0.06, 0.06, 0.02
709.90.07, 0.44, 1, 0.56, 0.19, 0.02, 0.06, 0.06, 0.02
608.60.06, 0.47, 1, 0.56, 0.19, 0.03, 0.06, 0.06, 0.02
507.60.07, 0.49, 1, 0.57, 0.19, 0.04, 0.06, 0.06, 0.02
406.40.11, 0.49, 1, 0.56, 0.18, 0.12, 0.06, 0.05, 0.04
303.20.09, 0.51, 1, 0.55, 0.18, 0.08, 0.07, 0.06, 0.04
202.80.12, 0.50, 1, 0.58, 0.21, 0.09, 0.11, 0.07, 0.08
Table 3. Electric arcs. Experimental conditions using a needle-plane gap (diameter = 1.0 mm, gap = 30 mm), main spectral bands and their relative intensities.
PressureApplied Voltage [kVRMS]Relative Intensity [−] of Bands with Central Points at
295, 316, 337, 357, 380, 399, 405, 427
10020.00.07, 0.47, 1, 0.55, 0.19, 0.07, 0.06, 0.02
9018.30.09, 0.59, 1, 0.55, 0.17, 0.06, 0.05, 0.02
8016.20.10, 0.50, 1, 0.55, 0.17, 0.06, 0.05, 0.02
7011.60.13, 0.52, 1, 0.54, 0.17, 0.06, 0.05, 0.021
608.60.12, 0.51, 1, 0.54, 0.17, 0.05, 0.05, 0.02
508.20.11, 0.49, 1, 0.54, 0.17, 0.05, 0.05, 0.02
407.60.11, 0.48, 1, 0.55, 0.18, 0.06, 0.05, 0.03
304.40.11, 0.49, 1, 0.55, 0.18, 0.06, 0.05, 0.03
202.00.19, 0.78, 1, 0.83, 0.26, 0.09, 0.08, 0.12
101.40.11, 0.55, 1, 0.56, 0.18, 0.06, 0.05, 0.10
Publisher’s Note: MDPI stays neutral with regard to jurisdictional claims in published maps and institutional affiliations.

