Abstract
The space gravitational wave detection mission has put forward multiple performance requirements for micro-newton thrusters, such as “fast response, high resolution, and low noise”. In order to solve the problem that the traditional open-loop propulsion system can hardly meet the high-precision performance, the microwave ion thruster with high accuracy and controllability of thrust estimation is adopted as the research object, and the precision feedback control method combining analog circuit and digital control technology is adopted to achieve a resolution of less than 0.1 μN, fast response of 20 ms, and 10−3~1 Hz frequency band noise less than 0.05 μN/Hz1/2 of the thrust performance. Experimental results show that, compared with open-loop regulation, the feedback control can effectively suppress various noises and disturbances caused by device temperature drift and complex operating characteristics of the thruster, and the anti-aliasing filter scheme adopted in this paper can suppress the folding of high-frequency data in the low- and medium-frequency bands during the digital control process, while it can effectively improve the system performance and reduce the impact of thrust noise. The feedback control strategy proposed in this paper verifies the possibility of a microwave ion thruster as an actuator for super “static and precise” space experiment satellites and provides a feasible solution for the application of a microwave ion thruster in deep space science experiment missions such as gravitational wave detection.
1. Introduction
With the development of aerospace technology, the space mission requirements for propulsion systems are becoming more rigorous [1,2,3,4,5]. One of the drag-free satellite platforms represented by space gravitational wave detection requires the use of thrusters to generate micro-newton thrust to counteract non-conservative forces such as solar radiation light pressure in real time, making the test mass less than 10−9 m/Hz1/2 relative to the spacecraft displacement control accuracy to ensure sufficient accuracy of scientific measurements. Therefore, high-performance indicators such as 0.1 μN/Hz1/2 thrust noise and 50 ms response time are proposed for the propulsion system (see Table 1) [6].

Table 1.
Gravitational wave propulsion system index requirements.
In order to meet the requirements of micro-propulsion technology for space gravitational wave detection missions, various countries have conducted research on micro-newton propulsion systems. LISA Pathfinder carries both cold gas thrusters and colloidal thrusters as its propulsion system, but the thrust noise is only suppressed to below 0.1 μN/Hz1/2 in the frequency band of 1 mHz to 30 mHz, and the step response time of its upper and lower output limits of 5 to 30 μN is as long as 170 s [7]. The full-size NG-µHEMPT and miniaturized NG-µHEMPT developed by TU Dresden achieve thrust output ranges of 6 to 4800 µN and 29 to 86 µN, respectively [8]; the Field Emission Electric Propulsion developed by Austria meets the requirements for thrust range, resolving power, and noise level, but the application needs to be improved in terms of controllability and lifetime [9]. In-orbit validation of Taiji-1 with RF ion thruster has achieved 1.5~60 μN thrust adjustment range, 0.5 μN resolution, 0.2 μN/Hz1/2 or less thrust noise, 50 ms response time, and greater than 60 s specific impulse [10]; ECRIT-µ1, designed by Shizuoka University in collaboration with the University of Tokyo, can achieve 20~316 µN thrust output range and specific impulse of up to 1500 s [11]. It can be seen that the research on thrusters for gravitational wave detection missions has been abundant in various countries, but there is still a gap between the achievable performance and the target requirements.
The microwave ion thruster has many advantages such as high specific impulse, wide range of thrust, high accuracy of thrust estimation, fast adjustment rate, etc. [12]. Its schematic diagram is shown in Figure 1, mainly composed of magnetic circuit, antenna, cavity and double gate system, etc. When the microwave ion thruster works, the microwave in the GHz band is fed into the ionization chamber through the antenna. Then, the electrons are heated based on the electron cyclotron resonance principle, the heated energetic electrons collide with the working gas in the discharge chamber to cause ionization, and the generated ions are accelerated and ejected through the gate system to generate propulsion. Since the ionization and acceleration processes of the microwave ion thruster are separated, the thrust can be accurately estimated by the beam parameters.
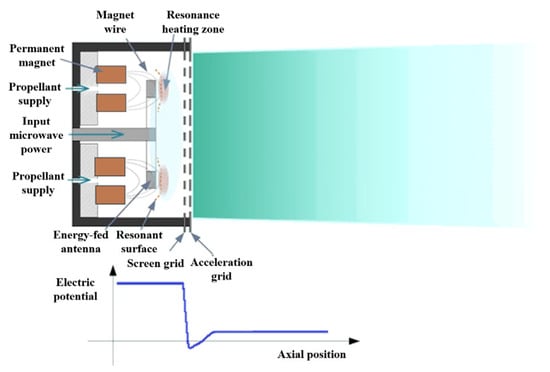
Figure 1.
Microwave ion thruster schematic.
In the space gravitational wave detection mission requirements, Northwestern Polytechnical University conducted an experimental study on the open-loop control of the 2 cm microwave ion thruster. Under the conditions of flow rate 0.1 sccm, microwave power 0.5~2.0 W, and acceleration voltage 150~1850 V, the thrust can be continuously adjusted in the range of 1.38~139.18 µN [13]. The microwave ion thruster μ1, designed for the DECIGO pathfinder mission, suppresses the thrust noise in the 0.1~1 Hz band to less than 0.2 μN/Hz1/2 by means of closed-loop feedback control of the input microwave power [14], which effectively suppresses the low-frequency disturbances but still requires more precise feedback control means.
Because the microwave ion thruster has the ability to use electrical parameters for accurate thrust estimation and can achieve closed-loop feedback control of the thruster, it can significantly improve the thruster response speed, thrust noise, stability, and other indicators, so there is a high prospect for future gravitational wave detection.
In order to achieve the high requirements of the gravitational wave detection mission for the micro-newton thruster, the control strategy and performance optimization of the microwave ion thruster are investigated in this paper. In the microwave ion thruster system, the microwave source has the advantages of high resolution and fast response adjustment compared with the voltage source and storage unit, so it is used as the main control means of the thruster. Compared with the analog control system, the digital control system has higher flexibility, and the controller parameters can be modified by telemetry and remote control to improve the adaptability in a deep space environment [15], so the thruster control scheme is developed in this paper under the framework of digital feedback control. Because of the high requirements of gravitational wave detection on the thruster noise, the overlapping phenomenon generated by the digital control process directly affects the final control accuracy [16]; therefore, this paper uses various filters to optimize the control system performance and reduce the impact of system noise on the system performance.
The main work of this paper is as follows:
- Proposed a microwave feedback control strategy for ion thruster, built a digital control system, and analyzed the effects of quantization noise and aliasing effect on the output performance of the thruster.
- A microwave feedback-based controller is designed to achieve accurate and stable thrust output under the premise of low bandwidth. In addition, the fourth-order Butterworth low-pass filter circuit, FIR, and other filters are designed to anti-alias and process noise reduction of the acquired signal, and then the control system design is optimized.
- Based on the ground vacuum experimental platform, the proposed thruster control scheme is experimentally verified to achieve 0.1 μN resolution, 20 ms response speed, and ≤0.05 μN/Hz1/2 (10−3~1 Hz) thrust noise, which is better than the requirements for the micro-propulsion system proposed by the gravitational wave detection mission.
2. Closed-Loop Control of Thrust Based on Microwave Modulation
2.1. Thruster Microwave Modulation Strategy
The microwave ion thruster experimental setup is shown in Figure 2. The thruster has three major regulatory components: voltage source, microwave source, and storage and supply unit, in which the output power range of the 4.2 GHz microwave source for workpiece ionization is 0.5 to 5 W, the screen grid voltage to provide the ion-induced electric field is 200 to 800 V, the accelerating grid voltage is −40 to −180 V, and the xenon gas flow rate as propellant is set to 0.01 to 0.2 sccm.
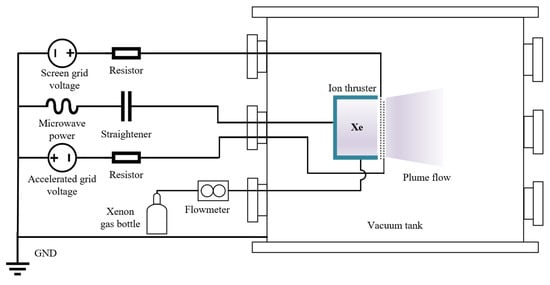
Figure 2.
The ion thruster experimental setup.
The microwave ion thruster thrust calculation formula is shown in Equation (1), where the lead current is equal to the screen grid loop current minus the accelerating grid loop current.
where is the correction factor for microwave ion thruster thrust, is the lead current (mA), and is the screen grid voltage (V).
In the control system design, the impact of the thruster output noise on the performance index cannot be ignored, which is mainly composed of gaussian white noise and pink noise, and the time domain signal of the thruster open-loop output is shown in Figure 3a. The noise level of the thruster in the frequency band below 1 Hz exceeds the gravitational wave detection index of 0.1 μN/Hz1/2 (in Figure 3b). Therefore, it is necessary to suppress the thruster output drift and fluctuation by means of closed-loop feedback control to reduce the low-frequency noise of the thruster.
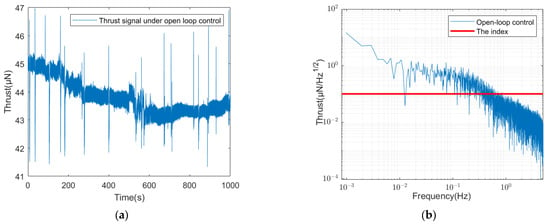
Figure 3.
Open-loop output analysis of thrusters: (a) time domain diagram of open-loop thrust; (b) open-loop thrust spectrogram.
The microwave ion thruster is dominated by microwave discharge. When the xenon flow rate is fixed, the size of the lead current is determined by the microwave power alone. Xenon flow rate of 0.1 sccm conditions, different microwave power, and voltage corresponding to the output thrust value are shown in Figure 4; elected to a moderate voltage value, the microwave power can be quickly adjusted to achieve a thrust output range of a few tens of a micro-newton.
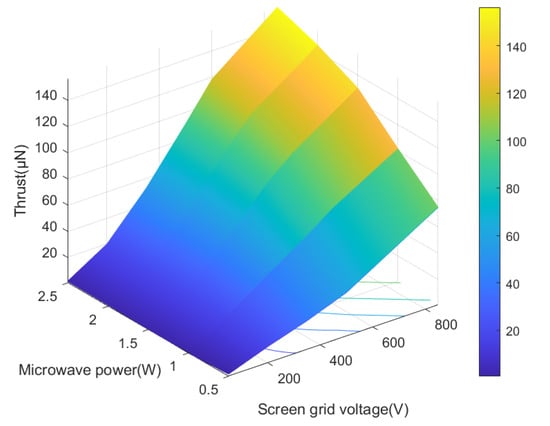
Figure 4.
Thrust regulation range diagram.
At present, the microwave source regulation response time is about 1 ms and the voltage source is about 50 ms, while the regulation response time of the storage unit is up to several seconds long. In order to achieve 50 ms thruster response time indicators, the microwave source regulation output thrust is required as the main means. Secondly, the microwave source output power can be adjusted through its internal analog attenuator, and the analog attenuator regulation resolution by the DAC voltage is applied to it to determine the number of DAC bits to achieve a high-resolution microwave source output power.
In this paper, we consider adjusting the microwave power to regulate the thrust; when the thrust command is given, the corresponding lead current is solved by Equation (1), and the feedback control can make it reach the set value, so as to achieve the thrust regulation.
2.2. Closed-Loop Control of Thrusters
The framework of the microwave modulation-based thruster system is shown in Figure 5. The system mainly consists of a controller, a thruster-induced current control model, a current detection device, and ADC/DAC.

Figure 5.
Ion thruster feedback control framework.
The experiments are based on the digital control of the thruster by microprocessor, and the thruster lead current control model is established first.
2.2.1. Thruster Lead Current Control Model
Because the microwave power of the microwave source acting on the thruster end is difficult to measure accurately, it is impossible to obtain the correspondence between it and the lead current, so in this paper, the voltage of the DAC output to the analog attenuator of the microwave source is used as the input quantity, the lead current of the thruster end is used as the output quantity to construct the control model of the thruster lead current, the step response curve is shown in Figure 6 according to the experimental synchronization measurement, and the control model is obtained according to the system identification of the curve as follows:
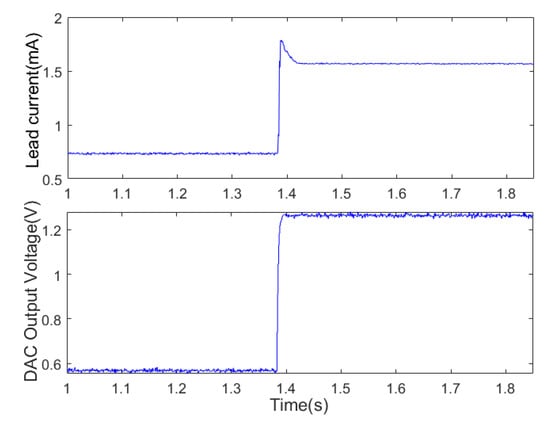
Figure 6.
Lead current step response.
In order to further verify the accuracy of the execution transfer function of the lead current obtained from the system identification, the thruster lead currents corresponding to different DAC output voltages were obtained according to Equation (2) and compared with the real collected data (as shown in Table 2), and it can be seen from the fourth row of the table that the error between the lead current calculated according to the execution transfer function and the measured value is basically controlled within 5.2%.

Table 2.
DAC output voltage and lead current correspondence.
2.2.2. Proportional–Integral Controller
In order to meet the requirement of 50 ms response index and to limit the open-loop bandwidth of the control system to 10 Hz without consuming a lot of controller resources, the discrete transfer function of the proportional–integral controller used in this paper is shown as follows:
where is the proportionality coefficient, is the integration coefficient, and is the control period.
2.3. Digital Implementation and Performance Analysis
The results of the time and frequency domain digital simulation in the control framework of Figure 5 are shown in Figure 7. At this time, the system control period is synchronized with the sampling period, and it can be seen from the lead current noise spectrum at different sampling frequencies in Figure 7b that the lead current noise gradually increases as the sampling frequency decreases, which is caused by the folding of high-frequency data to low frequency from the data acquisition perspective. From the closed-loop output noise of the thruster at different control frequencies in Figure 7c, it can be seen that the thrust output noise also gradually increases as the control frequency decreases. Therefore, it is concluded that the effect of aliasing on the closed loop of the thruster cannot be ignored, and anti-aliasing treatment from the filtering perspective is urgently needed.

Figure 7.
(a) Closed-loop output of thruster at 2 kHz control frequency; (b) lead current noise at different sampling frequencies; (c) thrust noise at different control frequencies.
3. Control System Optimization and Simulation Analysis
The closed-loop thrust control scheme adopted in the previous paper can effectively solve the temperature drift and output accuracy problems in the open-loop output of the thruster, but for the ultra-high control accuracy index, it is also necessary to theoretically analyze the quantization noise and aliasing effects generated during ADC data acquisition and design a targeted filtering scheme and then optimize the design of the controller.
3.1. Sampling Analysis and Filter Design
3.1.1. Sampling Analysis
The quantization noise introduced during the thrust estimation and digital control process also affects the final output accuracy of the thruster. For its quantization analysis, the quantization error of an ideal N-bit ADC (analog–digital converter) when digitizing the signal can be approximated by an uncorrelated sawtooth waveform [17,18], and the root mean square signal-to-noise ratio is found to be:
As shown in Equation (1), the thrust calculation of the ion thruster requires real-time detection of the screen grid voltage and lead current ; firstly, the voltage and current converter are used to convert the 0–1000 V screen grid voltage and 0–5 mA lead current to 0–5 V voltage signal with one-thousandth accuracy, and the acquisition is carried out by ADC. In order to ensure that the acquisition accuracy is better than the conversion accuracy while meeting the high-speed chip sampling rate, it is decided to use the 12-bit ADC (1/212 < 0.1%), at which time the ADC background noise is −74 dB.
3.1.2. Filter Design
- Anti-alias filter
In order to avoid the signal interference caused by the aliasing effect, an anti-aliasing filter is set at the front end of the ADC acquisition. For the amplitude accuracy as an important consideration, a fourth-order Butterworth filter [19] is selected as the anti-aliasing filter, which has the maximum flat amplitude characteristics in the passband, and the circuit diagram is shown in Figure 8.

Figure 8.
Fourth-order Butterworth low-pass filter circuit diagram.
Its pre-stage second-order active low-pass filter transfer function is shown below.
The amplitude–frequency transfer function is obtained as:
Set , , it can be obtained:
The cut-off frequency is obtained from Equation (7):
The anti-alias filter cut-off frequency should take into account both the control system bandwidth and control frequency requirements and should be at least 2~3 times higher than the system bandwidth, to avoid the system “step-up” on the system stability impact. In addition, the anti-alias filter should make the acquisition signal control frequency half of the frequency components outside the attenuation to the ADC background noise −74 dB.
At this time, the anti-alias filter cut-off frequency is set to five times the control system bandwidth, and the set fourth-order filter circuit components to take the value are shown in Table 3.

Table 3.
Fourth-order filter element values.
Substituting the parameters into Equation (5), the second-order filter transfer function is obtained as:
The structural parameters of the post-stage filter are the same as those of the pre-stage, so the fourth-order Butterworth low-pass filter transfer function shown in Figure 8 is:
The frequency response curve is shown in Figure 9, and the frequency component above 420 Hz is attenuated to below −74 dB by the anti-alias filter.
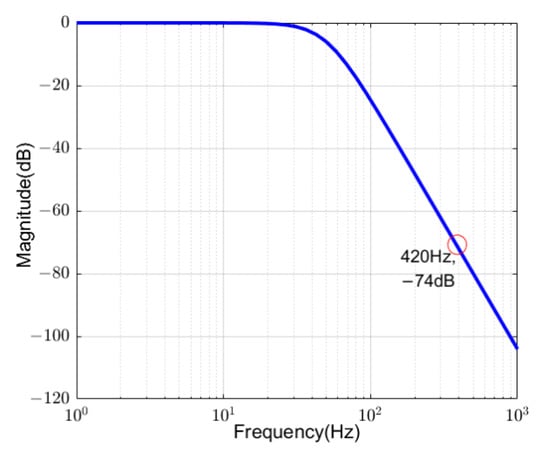
Figure 9.
Anti-alias filter frequency response curve.
- FIR Filters
In order to reduce the impact of ADC power supply noise (10 kHz~30 MHz) on the acquisition accuracy [20], it was decided to adopt a digital filtering means of high-speed oversampling of the signal at 100 kHz followed by extraction through an FIR low-pass filter with a differential equation of the following form:
where is the input sequence, is the filtered sequence, is the filter coefficient, and is the order of the filter.
FIR digital filters can be designed by the window function method, frequency sampling method, and equal ripple method. Designing filters using the window function method is one of the main methods of FIR digital filter design [21,22]. In this paper, a Hamming window is used to design the filter with a cutoff frequency of 1 kHz and an order of 70. The amplitude response curve is shown in Figure 10.
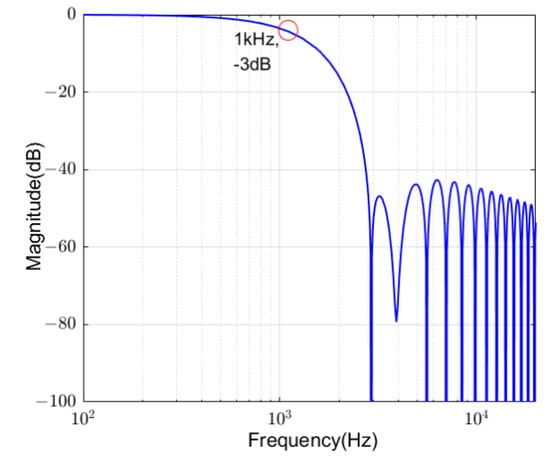
Figure 10.
FIR filter amplitude response curve.
- DAC output filter
- To reduce the 12-bit DAC output ripple while ensuring a fast voltage build-up time, a first-order RC low-pass filter with a cutoff frequency of 50 Hz is adopted, and its transfer function is shown below:
3.2. Controller Optimization
The optimized system framework after the introduction of the filter is shown in Figure 11. In order to ensure the comprehensive performance of the system, the control frequency should meet the system bandwidth of more than 20 times; at the same time, to avoid the impact of the phenomenon of overlapping, the control frequency should be at least twice higher than the filter −74 dB attenuation band of 420 Hz. This paper takes the integer value of 2 kHz, at this time above the Nyquist frequency, and 1 kHz of the collected signal component power is completely below −74 dB; even if the high-frequency signal components overlapped to the low-frequency band signal, its impact can be completely ignored.

Figure 11.
Optimized ion thruster feedback control framework.
A comparison of the open-loop bode diagram of the system with (without) a filter under the action of the controller at this time is shown in Figure 12, from which it can be seen that after the addition of the filter, the phase margin of the system decreases from 85° to 50°, and the amplitude margin decreases from 21.5 dB to 5.50 dB, representing a decrease in system stability, which is analyzed to be caused by the phase delay of the filter.
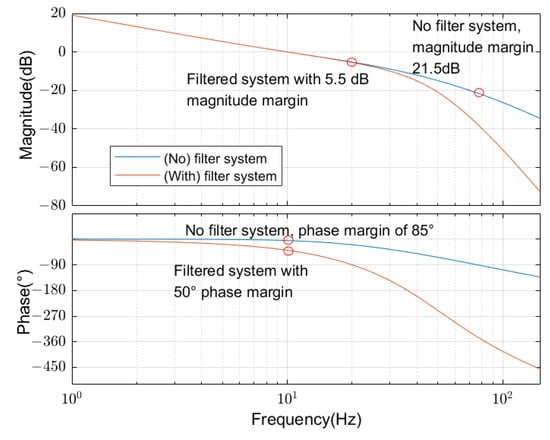
Figure 12.
Comparative analysis of open-loop bode diagram with/without filter system.
Therefore, the controller needs to be re-optimized, and the new controller parameters are obtained according to the required stability margins as shown below.
At this point, the bode diagram of the filtered system under the effect of controllers and is compared and analyzed as shown in Figure 13, which shows that the phase margin of the filtered system under the effect of the new controller is increased to 60° and the amplitude margin is increased to 6.67 dB, thus obtaining better stability performance.
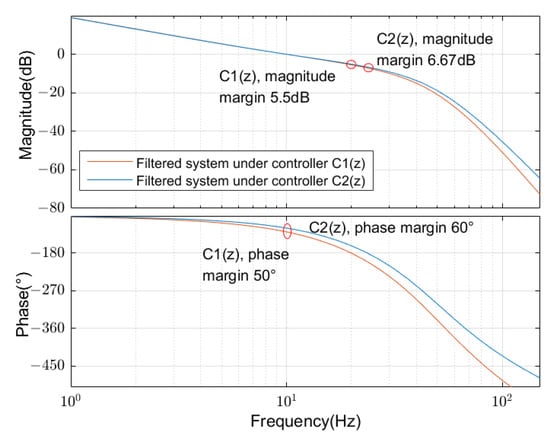
Figure 13.
Comparative analysis of open-loop bode plots of systems with different controllers.
The final combined information of the system with and without a filter for both control frameworks is shown in Table 4.

Table 4.
Comprehensive analysis of control system performance for different situations.
3.3. Simulation Verification and Analysis
3.3.1. Anti-Aliasing Filter Verification
Under the action of the anti-alias filter, the noise spectrum of the lead current at different sampling frequencies is shown in Figure 14. It can be found that the noise spectra at three sampling frequencies basically overlap, and there is no phenomenon like Figure 7b where the high-frequency noise overlaps to the low frequency, so it does not affect the closed-loop control effect of the thruster. This shows the effectiveness of the anti-aliasing filter designed in this paper.
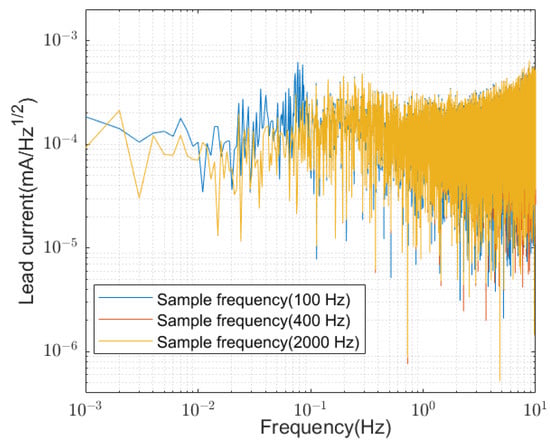
Figure 14.
Lead current noise at different sampling frequencies (with anti-alias filtering).
3.3.2. Analysis of Optimization Simulation Results
For the comprehensive index of gravitational wave detection micro-propulsion, the simulation results were compared and analyzed, and the response speed comparison test is shown in Figure 15. It can be seen that the step response time (10% and 90% of the response time is used as a criterion) of the system with a filter does not exceed 20 ms, which meets the index of gravitational wave detection micro-propulsion requirements, while the response time of the thruster without an anti-mixing filter is slightly slower but does not exceed 40 ms, which is due to the higher phase margin of the system without a filter, which can also increase the response speed by increasing the system bandwidth, but will undoubtedly increase the resource consumption of the controller (such as the need to increase the control frequency accordingly). When the propulsion system is actually applied to the spacecraft, the transmission rate is limited through the data bus communication. In other words, the allowable control frequency is limited, so the system design often requires compromise considerations.
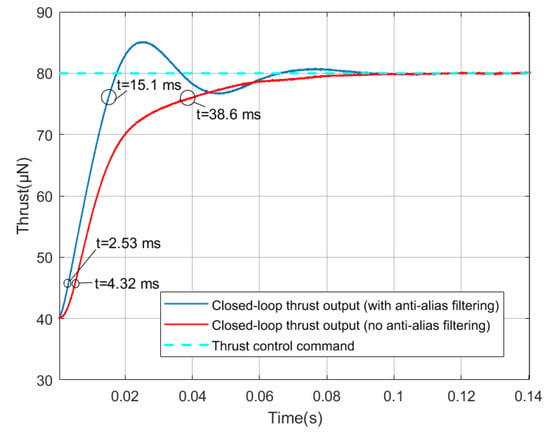
Figure 15.
Thruster response speed comparison test.
The low-frequency noise of the thruster mentioned in the previous section (Figure 3) is mainly pink noise, and the disturbance suppression capability of the control system with or without a filter is shown in Figure 16, which is basically the same in magnitude, indicating that both have the same capability to suppress the thruster disturbance.
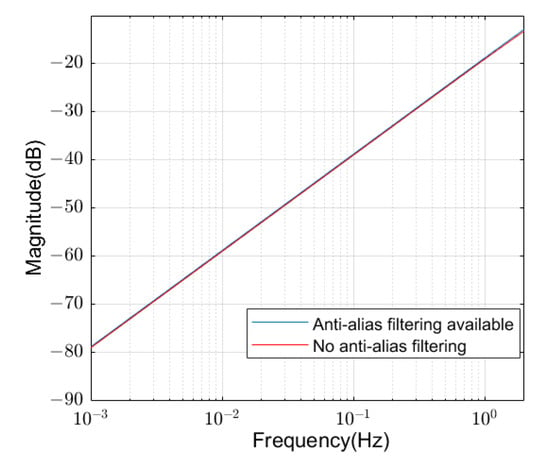
Figure 16.
Comparative analysis of system disturbance suppression capability.
From the final simulation test results in Figure 17a, it can be seen that the thruster open-loop control cannot achieve the 0.1 μN/Hz1/2 noise target, but the control systems with and without anti-alias filters have the ability to suppress the thrust output perturbation, and both can effectively suppress the thrust noise below the 0.1 μN/Hz1/2 target. However, it can be seen from Figure 17b,c that as the control frequency decreases, the thrust noise magnitude of the system without an anti-alias filter gradually exceeds the thrust noise with anti-alias filter in the low-frequency band and even exceeds the 0.1 μN/Hz1/2 indicator at the 100 Hz control frequency condition. This is the result of the aliasing effect of the sampling; the noise from the high-frequency band is aliased to the low-frequency band, which causes the thrust closed-loop control effect to be reduced. However, the thrust noise of the control system with an anti-aliasing filter is not affected by the decrease in control frequency, which shows the necessity of setting an anti-aliasing filter.

Figure 17.
Thrust noise spectrum analysis: (a) control frequency 2 kHz; (b) control frequency 400 Hz; (c) control frequency 100 Hz.
4. Experimental Results and Analysis
In this paper, the ground vacuum platform experimental verification of the thruster performance will be carried out according to the final optimized designed control system above; when the controller is , the control frequency is 2 kHz, and the anti-alias filter is included. The experimental conditions of the thruster are shown in Table 5.

Table 5.
Experimental conditions of the ion thruster.
4.1. Thrust Response Time
Thrust response time is an important dynamic index of the propulsion control system. In this paper, the output response of thrust is observed by giving a thrust step command, and 10% and 90% of the response time is used as a criterion. It can be seen from Figure 18 that the thrust response time from 34 μN to 43.1 μN does not exceed 20 ms.
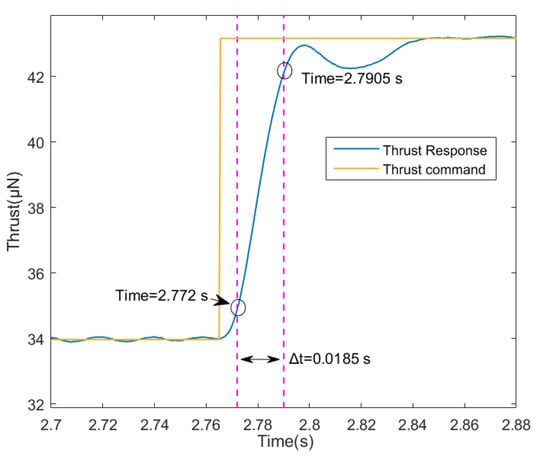
Figure 18.
Thrust response time.
4.2. Thrust Resolution
In the framework of closed-loop feedback control, the thrust resolution adjustment experiment is completed by adjusting the microwave power to regulate the lead current and thus change the thruster output thrust. Therefore, the thrust output resolution is limited by the resolution of microwave output power, and the microwave source output power is determined by the voltage output to it by the DAC, so the thrust output resolution is ultimately limited by the number of DAC bits. The 12-bit DAC used can meet the 0.002 mA lead current regulation resolution. The lead current climbing step from 1.036 mA to 1.056 mA regulation process is shown in Figure 19a, and the resulting change in thrust regulation is shown in Figure 19b, where it can be seen that the thrust rises from 44.92 μN to 45.71 μN with a resolution of less than 0.1 μN.
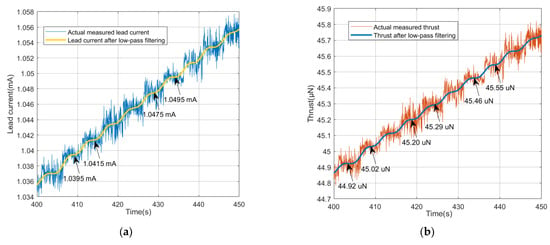
Figure 19.
Thrust resolution test: (a) lead current climbs in steps of 0.002 mA; (b) thrust step climbing resolution test.
4.3. Thrust Noise
The experimental plan of this paper is to suppress the low-frequency noise of the lead-in current by microwave feedback control, so as to achieve a thrust force of 0.1 μN/Hz1/2 in the frequency band of 10−3~1 Hz. The time domain signals of the three are shown in Figure 20, and compared with the open-loop experimental results, it can be seen that the lead current and thrust under the closed-loop feedback control have been maintained in a stable state, indicating that the feedback control has effectively suppressed the drift and fluctuation of the lead current and thrust. However, with the screen grid supply voltage as a constant value, there is not much difference in the voltage value under open-loop and closed-loop.

Figure 20.
Experimental testing of thruster time domain: (a) thrust time domain test; (b) lead current time domain test; (c) screen grid voltage time domain test.
The spectrum analysis of the measured thrust and lead current signals is shown in Figure 21, and the comparative analysis of the open-loop and closed-loop control results shows that the closed-loop control suppresses the thrust noise from 14.69 μN/Hz1/2 to 0.04 μN/Hz1/2 and the lead current noise from 0.3466 mA/Hz1/2 to 0.00072 mA/Hz1/2, which shows that the closed-loop feedback control can effectively suppress the low-frequency noise in the thrust.
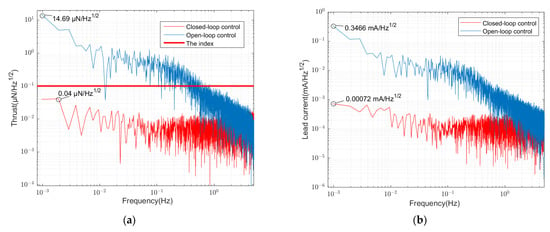
Figure 21.
Thruster noise spectrum: (a) thrust spectrum; (b) lead current spectrum.
From Table 6, it can be seen that the above thrust experimental results in response time, resolution, and noise level have met the requirements of the gravitational wave detection micro-propulsion index, and the experimental results and simulation results basically match, reflecting the effectiveness of the thruster closed-loop control system designed in this paper. It is also not difficult to see that the experimental curve is slightly different from the simulation curve, which is affected by the experimental environment and the complex working characteristics of the thruster, making the system model and the existence of noise and disturbances not completely consistent with the cause.

Table 6.
Comparison of experimental results.
5. Conclusions
In this paper, a digital feedback control study is carried out based on a micro-newton microwave ion thruster for high-precision micropropagation index requirements of gravitational wave detection, and the thrust output index of 0.1 μN resolution, 20 ms fast response, and 10−3~1 Hz frequency band noise of less than 0.05 μN/Hz1/2 are achieved. The feasibility of the microwave ion thruster as an actuator for the gravitational-wave-free satellite is effectively verified.
The following conclusions can be drawn from the open-loop and closed-loop simulation and experimental results of the thruster.
- (1)
- When the microwave ion thruster is in open-loop operation, there is a temperature drift and complex physical processes of the thruster lead to excessive low-frequency noise and fluctuations in thrust, resulting in inaccurate output.
- (2)
- Microwave power due to the regulation resolution and response speed is far superior to the voltage source, storage, and supply unit and can be used as the main means of regulation of feedback control of the micro-propulsion system.
- (3)
- Feedback control can effectively suppress the thruster output low-frequency drift, to achieve a low-noise fine and stable output of thrust.
- (4)
- The quantization noise and aliasing effect will affect the final control accuracy, and the design of the anti-aliasing filter can effectively improve the accuracy of digital control, combined with feedback control, to finally achieve the multiple performance requirements of the micro-propulsion system for gravitational wave detection.
Author Contributions
Conceptualization, J.Z.; methodology, J.Z.; software, J.Z.; validation, J.Z.; formal analysis, J.Z.; investigation, J.Z.; resources, A.P. and H.L.; data curation, J.Z.; writing—original draft preparation, J.Z. and A.P.; writing—review and editing, J.Z., A.P., H.L., H.Z., and X.N.; visualization, J.Z.; supervision, J.Z., A.P., H.L., H.Z., and X.N.; project administration, A.P. and H.L.; funding acquisition, A.P. and H.L. All authors have read and agreed to the published version of the manuscript.
Funding
This paper is supported by the National Key Research and Development Plan of China (no. 2020YFC2201000), the National Natural Science Foundation of China (grant no. 12162007) and the Research on New Power System and Its Digital Engineering (QianJiaoJi, China [2022] 043).
Data Availability Statement
Not applicable.
Acknowledgments
We would like to express our thanks to the editors of Aerospace and the reviewers for their work in processing this article.
Conflicts of Interest
The authors declare no conflict of interest.
References
- Yu, D.R.; Qiao, L.; Jiang, W.J.; Liu, H. Development and prospect of electric propulsion technology in China. J. Propuls. Technol. 2020, 41, 1–11. [Google Scholar] [CrossRef]
- Tighe, W.; Chien, K.-R.; Solis, E.; Rebello, P.; Goebel, D.; Snyder, J. Performance evaluation of the XIPS 25-cm thruster for application to NASA discovery missions. In Proceedings of the 42nd AIAA/ASME/SAE/ASEE Joint Propulsion Conference & Exhibit, Sacramento, CA, USA, 10–12 July 2006; p. 4666. [Google Scholar]
- Wu, W.; Liu, W.; Qiao, D.; Jie, D. Investigation on the development of deep space exploration. Sci. China Technol. Sci. 2012, 55, 1086–1091. [Google Scholar] [CrossRef]
- Perino, M.; Fenoglio, F.; Pelle, S.; Couzin, P.; Thaeter, J.; Eilingsfeld, F.; Hufenbach, B.; Bergamasco, A. Outlook of possible European contributions to future exploration scenarios and architectures. Acta Astronaut. 2013, 88, 25–34. [Google Scholar] [CrossRef]
- Diaz, F.C.; Squire, J.P.; Carter, M.; Corrigan, A.; Dean, L.; Farrias, J.; Giambusso, M.; McCaskill, G.; Yao, T. An overview of the VASIMR® engine. In Proceedings of the 2018 Joint Propulsion Conference, Cincinnati, OH, USA, 9–11 July 2018; p. 4416. [Google Scholar]
- Luo, J.; Chen, L.-S.; Duan, H.-Z.; Gong, Y.-G.; Hu, S.; Ji, J.; Liu, Q.; Mei, J.; Milyukov, V.; Sazhin, M.; et al. TianQin: A space-borne gravitational wave detector. Class. Quantum Gravity 2016, 33, 035010. [Google Scholar] [CrossRef]
- Anderson, G.; Aveni, G.; Bame, D.; Barela, P.; Blackman, K.; Carmain, A.; Chen, L.; Cherng, M.; Clark, S.; Connally, M.; et al. Experimental results from the ST7 mission on LISA Pathfinder. Phys. Rev. D 2018, 98, 102005. [Google Scholar] [CrossRef]
- Hey, F.G. Micro Newton Thruster Development; Springer: Wiesbaden, Germany, 2018. [Google Scholar]
- Scharlemann, C.; Buldrini, N.; Killinger, R.; Jentsch, M.; Polli, A.; Ceruti, L.; Serafini, L.; DiCara, D.; Nicolini, D. Qualifciation test series of the indium needle FEEP micro-propulsion system for LISA Pathfinder. Acta Astronaut. 2011, 69, 822–832. [Google Scholar] [CrossRef]
- Xu, S.-Y.; Xu, L.-X.; Cong, L.-X.; Li, Y.-G.; Qiao, C.-F.; Taiji Scientific Collaboration. First result of orbit verification of Taiji-1 hall micro thruster. Int. J. Mod. Phys. A 2021, 36, 2140013. [Google Scholar] [CrossRef]
- Koizumi, H.; Kuninaka, H. Performance of the miniature and low power microwave discharge ion engine mu-1. In Proceedings of the 46th AIAA/ASME/SAE/ASEE Joint Propulsion Conference & Exhibit, Nashville, TN, USA, 25–28 July 2010; p. 6617. [Google Scholar]
- Tang, M.-J.; Yang, J.; Jin, Y.-Z.; Luo, L.-T.; Feng, B.-B. Experimental study on the optimization of ion source structure of miniature electron cyclotron resonance ion thruster. J. Phys. 2015, 64, 327–333. [Google Scholar] [CrossRef]
- Yu, D.R.; Niu, X.; Wang, T.B.; Wang, S.S.; Zeng, M.; Cui, K.; Liu, H.; Tu, L.C.; Li, Z.; Huang, X.Q.; et al. Research progress of micro-propulsion technology for space gravitational wave detection mission. J. Sun Yat-Sen Univ. 2021, 60, 194–212. [Google Scholar] [CrossRef]
- Izumi, T.; Koizumi, H.; Yamagiwa, Y.; Matsui, M.; Kuninaka, H. Performance of miniature microwave discharge ion thruster for drag-free control. In Proceedings of the 48th AIAA/ASME/SAE/ASEE Joint Propulsion Conference & Exhibit, Atlanta, GA, USA, 30 July–1 August 2012; p. 4022. [Google Scholar]
- Wu, H.X.; Hu, J.; Xie, Y.C. Review and outlook of spacecraft intelligent autonomous control research. Space Control. Technol. Appl. 2016, 42, 1–6. [Google Scholar]
- Gou, X.Y.; Wang, L.J.; Li, M.Q.; Jiang, Q.H.; Wang, S.K. Drag-free control of Tianqin-1 satellite acceleration mode. J. Astronaut. 2021, 42, 603–610. [Google Scholar] [CrossRef]
- Kester, W. Analog-Digital Conversion; Analog Devices: Norwood, MA, USA, 2004. [Google Scholar]
- Bennett, W.R. Spectra of quantized signals. Bell Syst. Tech. J. 1948, 27, 446–471. [Google Scholar] [CrossRef]
- Yang, Y.; Xing, L.; Zhu, Y.Q.; Yang, W.L. Optimal design of a 2n-order unit gain Butterworth low-pass filter for voltage-controlled voltage sources. J. Electron. 2011, 39, 1894. [Google Scholar]
- Wang, L.; Wu, J. Effect of power supply noise on the performance of analog-to-digital converters. Nucl. Technol. 2020, 43, 47–53. [Google Scholar] [CrossRef]
- Cai, S.K.; Wu, M.P.; Zhang, K.D. Comparison of FIR low-pass filters in aerial gravity measurements. Phys. Chem. Explor. 2010, 34, 74–78. [Google Scholar]
- Guo, Z.H.; Luo, F.; An, Z.F. Experimental low-pass digital filtering of aerial gravity data by window function method FIR. Phys. Chem. Explor. 2007, 31, 568–571. [Google Scholar]
Publisher’s Note: MDPI stays neutral with regard to jurisdictional claims in published maps and institutional affiliations. |
© 2022 by the authors. Licensee MDPI, Basel, Switzerland. This article is an open access article distributed under the terms and conditions of the Creative Commons Attribution (CC BY) license (https://creativecommons.org/licenses/by/4.0/).