Abstract
The present work explores some critical aspects of the numerical modeling of a rotorcraft seat and subfloor equipped with energy-absorbing stages, which are paramount in crash landing conditions. To limit the vast complexity of the problem, a purely vertical impact is considered as a reference scenario for an assembly made of a crashworthy helicopter seat and a subfloor section, including an anthropomorphic dummy. A preliminary lumped mass model is used to drive the design of the experimental drop test. Some additional static and dynamic tests are carried out at the coupon and sub-component levels to characterize the seat cushion, the seat pan and the honeycomb elements that were introduced in the structure as energy absorbers. The subfloor section is designed and manufactured with a simplified technique, yet representative of this structural component. Eventually, a finite element model representing the full drop test was created and, together with the original lumped mass model, finally validated against the experimental test, outlining the advantage of using both the numerical techniques for design assistance.
1. Introduction
Crashworthiness is the ability of a vehicle to withstand an impact and protect its occupants; in particular, the vehicle structure should be designed to attenuate the loads and accelerations on the human body during a crash landing, preserve a livable volume inside the cabin and the appropriate emergency evacuation passages and control the leakage of flammable liquids.
Crashworthiness is therefore based on the human tolerance to dynamic conditions, or the biomechanics of impacts, a discipline that actually had an aeronautical origin [1,2,3] and was later introduced into the automotive field; here, it was considerably developed, thanks also to the fact that crash testing in this case is considerably easier and more affordable that in aeronautics. The use of advanced numerical techniques for automotive crash analysis and prediction, in particular when combined with an anthropomorphic surrogate model, has significantly contributed to the development of the systems and structural components that enhance crashworthiness; the numerical techniques were initially based on lumped parameter approaches [4,5], later evolving to finite element approaches as soon as the computational performance allowed [6,7,8] and to hybrid finite element–lumped parameter approaches [9].
The main achievements in automotive crashworthiness consist, first of all, in the design of a rigid cabin structure, to maintain a livable volume in case of a crash and minimize intrusion, surrounded by a structure with controllable deformation, to reduce the cabin accelerations; additional features are the development of the restraint systems with pretensioners and airbags, cabin delethalization based on the crushable steering column and the use of energy-absorbing pads in the interiors. In aviation, some of these concepts were developed at the same time, whilst others were imported from the automotive industry.
In particular, a significant effort has been made to study rotorcraft crashworthiness in the past four decades. A thorough synthesis of the most relevant activities can be found in [10]; this paper deals with all the main aspects, starting from accident statistics and then describing experimental test facilities, numerical modeling tools and techniques, design solutions and recommendations. The reader can easily find many aspects in common with automotive crashworthiness. A more recent literature review is summarized in [11], which also outlines the main results obtained in energy absorption mechanisms and principal design solutions.
A crash landing may occur in different conditions of velocity components and vehicle attitudes, but for an aircraft in general, and for a rotorcraft in particular, a nearly leveled attitude and a dominant vertical component of velocity are more frequent than others [12]. In these conditions, the landing gear (if extracted) is the first component to impact the ground, followed by the lower fuselage structure; the loads are transferred to the seat and eventually to the lumbar spine, where they may determine severe vertebral injuries [13,14,15].
Regulations present some scenarios that must be complied with, in order to certify the seats. In Europe, EASA CS 27 and 29 [16,17] must be used for rotorcraft, which are imported from the corresponding US FAR 27 and 29. In particular, the loading condition mentioned above, with a dominant vertical component of velocity, is reproduced by installing the seat on a horizontal sled facility in a 60° nose-up attitude and subjected to a 30 g horizontal acceleration pulse introducing a 9.1 m/s speed change. The most important certification criterion for the seat in this test condition is the lumbar spine load, measured with an anthropomorphic test dummy (ATD) instrumented with a lumbar spine load cell: the measured load must be limited to 6770 N.
With a very rough calculation, one can multiply the mass of the upper body parts (around 40 kg for a 50th percentile occupant) by the component of the 30-g acceleration pulse along the spine axis, which can be approximately considered aligned with the backrest, as follows:
where M is the upper body mass, a is the acceleration peak, αa is the angle of the acceleration pulse with respect to the vehicle yaw axis (30°) and αb is the backrest angle (usually around 10°). A lumbar spine dynamic compressive load above 11 kN would result from this calculation if no energy attenuation is provided, which is considerably higher than the mentioned safety limit of 6770 N. For this reason, all rotorcraft seats are equipped with energy-absorbing systems, usually based on some metal plastic deformation.
Besides the seat, a deformable subfloor and possibly landing gear with an additional crash stage can significantly contribute to increase crashworthiness, meaning that they can reduce the occupants’ injury risk or extend the survivable crash speed envelope.
If the vehicle is equipped with different energy-absorbing stages, located in the seat, subfloor and landing gear, they could be tuned to harmonize their interaction and minimize the occupant’s injuries [18,19]. Unfortunately, this mutual influence is yet to be studied and included in regulations.
The study of the response of the energy-absorbing stages based on rotorcraft full-scale crash tests is hardly feasible, in terms of costs and time [20,21]; a more viable way is to carry out tests on relevant sections of the cabin and structure to validate numerical models, which provide useful results to estimate the local crashworthiness and, eventually, could be extended to the full structure.
Different full-structure numerical models have been developed for rotorcraft, either with a lumped parameter [22,23,24] or finite element technique [25,26]. Their development often needs a number of experimental tests at the component level to increase the model reliability; this means that the model set-up and validation require an important effort, in terms of time and costs, independently from the technique used.
In some cases, a full-structure model is not needed to achieve important and useful results. In particular, if one considers the rotorcraft occupant’s protection in a vertical crash landing condition, it may be sufficient to focus on the structural components that are directly involved in this event: an assembly including an ATD, a crashworthy seat and a deformable subfloor section is more versatile than a full-scale structure, and yet of great interest; moreover, it can be affordably manufactured in the laboratory with characterized structural components and finally used as a baseline test to refine and validate the numerical models.
This paper describes the experimental tests carried out basing on a preliminary lumped mass model of the ATD, seat and subfloor assembly, and then the validation of a more complex finite element model. The main difficulties arising during the numerical model setting are outlined and the comparison of the results obtained by the two different numerical approaches is shown, pointing out the importance of the numerical analysis to drive the design of crashworthiness.
2. Crashworthy Stages
This paper focusses on two crashworthy stages, namely the seat and subfloor, which will be briefly described in this section.
2.1. Seat
During a crash landing, the seat is the ultimate structural path for the loads to the occupant. In reality, body segments can flail and impact against surroundings surfaces of the cabin, but the seat is mainly responsible for the load transfer to the occupant and therefore its dynamics.
In this work, to simplify the problem, horizontal components of the accelerations are neglected, meaning that a pure vertical impact is considered. Under this condition, the occupants have no interaction with the surrounding cabin surfaces, and their loads and accelerations are exclusively introduced by the seat.
Energy-absorbing seats on helicopters are formed by a set of tracks fixed to the floor, a moveable seat bucket and shock absorbers [27], as simplified in Figure 1.
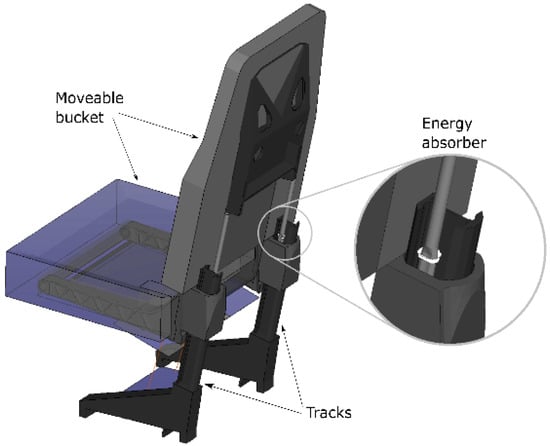
Figure 1.
Typical crashworthy seat layout, with an energy absorber based on the ovalization of a thin metal tube [27].
The bucket can translate along the tracks oriented more or less like the occupant’s spine, with the motion controlled by a couple of energy absorbers. The motion is limited by the available stroke. The most important factor that defines the seat response in a crash landing is the activation load of the seat energy absorbers. The purpose of the absorbers is to keep the load experienced by the occupant under the prescribed limit. One of the most common devices consists of a metal tube which passes through a couple of rollers; the outer diameter of the tube is lower than the rollers’ clearance, forcing tube ovalization when the seat bucket starts moving. The deformation is essentially plastic, meaning that the reaction force is almost constant, maximizing energy absorption.
Depending on the available stroke, the energy absorbers are set to a value in the range 4500–5500 N each [28], to keep the lumbar load under the limit of 6670 N. Once the stroke is exploited, the seat bucket bottoms out, typically introducing a spinal overload.
Adaptive energy absorbers, based on magnetorheological fluids or magnetostrictive friction, have been studied [29,30], which could further improve the efficiency of crashworthy seats, but this is beyond the scope of this paper.
As already mentioned, the seat must be certified against dynamic tests to demonstrate, among the other requirements, the fulfilment of the lumbar spine limit.
2.2. Subfloor
The subfloor is a box structure integrated in the fuselage belly, made of keel beams and transverse bulkheads, as shown in Figure 2.
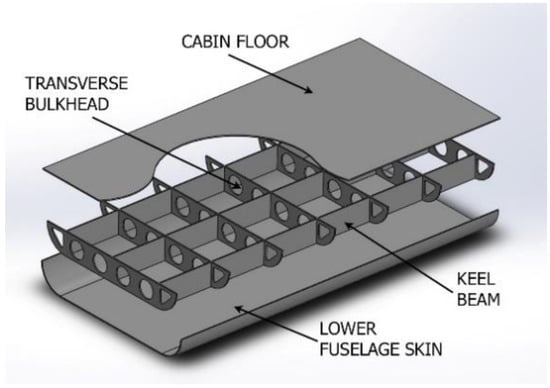
Figure 2.
Typical subfloor layout, with upper and lower skin, keel beams and transversal bulkheads.
This structure provides an important space that could be exploited for energy absorption, if suitably sized; in other words, the dynamic load of the full helicopter during ground impact must trigger the buckling of the subfloor structure, which then should keep crushing at constant load for more efficient energy absorption, preserving structural integrity [31,32,33].
In recent decades, helicopter subfloors have been extensively studied for crashworthiness, but most research focused mainly on energy-based results to assess the performance [31,32,33,34], or on the Dynamic Response Index (DRI) [35] that, although still used as a general indication of the occupant injury risk in vertical crash conditions, is less direct than the measure of the lumbar spine load in an anthropomorphic dummy. These parameters are important when studying structural crashworthiness in general, but may be misleading when the final target is the occupant’s lumbar spine load: the interposition of the seat between the human body and the subfloor determines an important coupling effect on the overall occupant’s dynamics.
Even if safety regulations do not require any particular certification test on the subfloor or its components, but issue only general recommendations, on the other side, the study of the mutual interaction between the subfloor and seat on the lumbar spine load could drive better design solutions.
3. Preliminary Lumped Mass Model
The initial approach to the study was based on a lumped parameter technique with a tool, MUSIAC—MUlti Scale Impact and Crash, developed at Politecnico di Milano [19].
The numerical model of the ATD represents a 50TH percentile Hybrid II, commonly used for the dynamic certification of aircraft seats. The model is composed of 17 rigid bodies, connected by hinges which reproduce the main articulations. In particular, the torso, lumbar spine section and pelvis are modeled as three rigid bodies, and the measure of the load in the hinge connecting the lumbar spine and the pelvis can be directly related to the load cell in the Hybrid II anthropomorphic dummy. This technique to model the anthropomorphic dummy and seat is not new: multi-body analysis was quite common in the early numerical simulations of the biomechanics of impacts because this approach is computationally cheaper than finite element, and the anthropomorphic dummy is prone to be discretized by a set of rigid bodies connected by hinges; at any rate, this technique is still in use [36,37,38] when fast computation is requested, typically in optimization problems.
The ATD was validated in a previous work [19] against experimental tests carried out with rigid seats.
The crashworthy seat is a very simplified model made of two rigid bodies: one body is fixed to the floor through 4 connectors and represents the tracks and their fixtures; the other rigid body represents the moveable part of the seat, made of the seat pan and backrest structures. The constraint between the two rigid bodies is obtained by a couple of translational joints, which allow the moveable part to slide along the tracks, and a single beam located in the symmetry plane of the seat and working as an energy absorber. This model was also validated in a previous work [19], together with the ATD model, against experimental tests that included a bottoming-out condition as well. The seat has a stroke of 130 mm before bottoming out.
The subfloor model is limited to the area including the seat attachments and the interaction with the ATD feet. This is also a simplified model: a rigid body represents the cabin floor and is then associated with a flat surface which can develop a contact force with the ATD feet; four vertical beams represent the connection between the cabin floor and the lower panels—typically, they are the cruciform structural components resulting from the intersections between the longitudinal and transversal subfloor beams, where usually energy absorption is concentrated. The available stroke is 190 mm, then the beams bottom out.
The final model is shown in Figure 3.
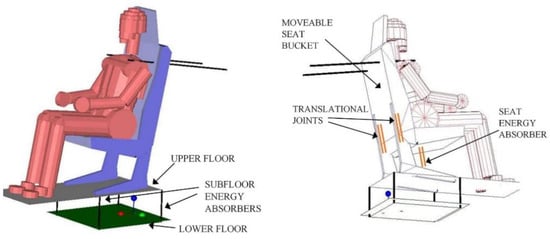
Figure 3.
Lumped mass model of the specimen, with an anthropomorphic test dummy (ATD), a crashworthy seat and a subfloor.
The seat is equipped with a 4-point safety belt system. The lap belt is modeled with two cables connecting two nodes on the pelvis to two nodes at the sides of the seat pan, respecting the geometry of the real lap belt; the shoulder belts are modeled with two cables connecting two nodes on the ATD shoulders with two nodes solid with the seat moveable body, but located considerably behind the backrest: this does not respect the real geometry, but well approximates the shoulder belt constraint, which is effective when the upper body tends to lean forward and has limited effect when the upper body tends to slide transversally or vertically along the backrest.
A series of analyses were run with the lumped parameter model, to outline a preliminary design of the experimental drop test in terms of dropping height and mechanical characteristics of the energy absorbers.
4. Mock-Up Configuration
The test assembly is made of an anthropomorphic test dummy, a helicopter seat and a subfloor section. The core idea was to have an assembly well controllable in terms of mass distribution and mechanical characteristics, to allow a more reliable comparison with the numerical models.
The first drop was carried out in 2017. It was useful for a first preliminary check of the initial finite element model, but the mock-up presented some weakness in the test design at the detail level, which is not described in this paper. The second mock-up, manufactured and tested in 2018, is here described and is shown in Figure 4.
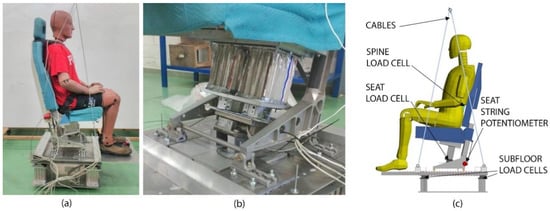
Figure 4.
(a) Full mock-up before drop test; (b) detail of seat energy absorber, installed under the seat pan above the load cell; (c) mock-up and sensor layout.
4.1. Anthropomorphic Test Dummy
The dummy is a calibrated 50th percentile Hybrid II, equipped with lumbar spine load cell, normally used in the crash test laboratory for aircraft seat testing and qualification. Its weight is 74 kg.
4.2. Seat
The seat is a crashworthy helicopter seat manufactured by IAI—Israel Aerospace Industries. Its original energy absorbers were removed and substituted with ad hoc absorbers made of aluminum honeycomb, which were previously characterized and then suitably installed under the seat pan, as shown in Figure 4b: one stiff aluminum plate was fixed under the seat pan beams and another one was fixed above the seat attachments to floor; a load cell was fixed above this plate, and the energy absorber honeycomb was inserted between the upper plate and the load cell. This set-up allowed maintaining the 130-mm nominal stroke of this seat model; bottoming out was now due to honeycomb compaction.
4.3. Subfloor
The subfloor was also manufactured ad hoc with a simplified technique, as shown in Figure 5: the upper side, that represents the cabin floor, was made of two aluminum panels joined in a sandwich-like set, with longitudinal stiffeners riveted between the panels and transversal stiffeners riveted on top of the upper panel. This sandwich set is connected to the bottom panel, representing the helicopter belly, with 4 crushable columns made again of honeycomb elements, but with different dimensions with respect to those used for the seat absorber. Four load cells were inserted on the top of the subfloor crushable columns. The available stroke is 130 mm: successively the densification of the crushed honeycomb determines a significant load increase.
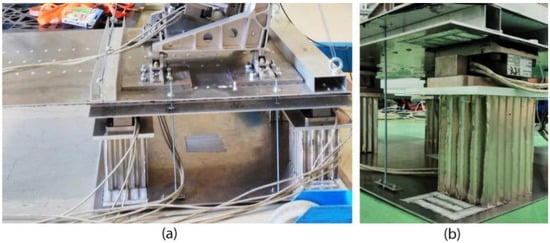
Figure 5.
(a) Subfloor energy absorbers and (b) detail of the load cells mounted between the upper sandwich floor and the energy absorbers.
Preliminary finite element calculations allowed sizing the sandwich floor, which was required to be stiff and avoid permanent deformation, in order to reduce the risk of obtaining further energy absorption during the test, which could be less controllable.
5. Component Testing
To refine the numerical models, some experimental tests were carried out at the component level for the cushion and seat pan; moreover, the honeycomb material used as crushable elements was experimentally characterized.
5.1. Cushion Foam Characterization
Cushion characterization was carried out on foam specimens, cut in a cylindrical shape, with a diameter of 203 mm and thickness from 51 to 114 mm. The cushion was made of graphite composite foam in layers as follows: 70% FRM C65 upper layer, 20% FRM C55 middle layer and FRM C55S lower layer. The specimens were first tested in a quasi-static condition (1 mm/s) and with a low constant speed condition (0.8 m/s) with a hydraulic press as shown in Figure 6a; then, they were tested under a drop tower with different impact speeds, as shown in Figure 6b, with a dropping mass of 41.5 kg, which is close to the mass of the 50th percentile upper body.
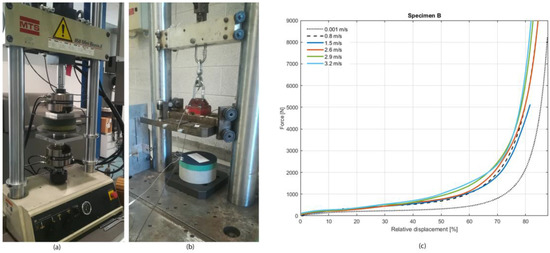
Figure 6.
Foam specimens’ tests: (a) static test with hydraulic press; (b) dynamic test with drop tower; (c) reactions at different impact speeds of the same type of specimen.
For each kind of test, 4 identical specimens were used, to account for possible scattering due to manufacturing tolerances. Some tests were also repeated on used specimens, which anyway showed negligible modification of their responses to both static and dynamic loading.
The curves shown in Figure 6c report the load as a function of the normalized deflection of the foam specimens, i.e., the deflection divided by the undeformed thickness of the specimens; the deflection during the static and low-speed tests was measured with the linear variable displacement transducer (LVDT) integrated in the hydraulic press, while during the dynamic tests, it was calculated by double integration of the acceleration signal from the dropping mass.
The curves are characterized by three regions: the initial region is linear elastic, generally very limited for the foam materials used in seat cushions and, in fact, not very evident in the plot, nor very significant for energy absorption; it is followed by the plateau region, which is actually characterized by a slight load increase, and, finally, the densification region [39]. The foam presents, moreover, a significant strain rate sensitivity when switching from the static to low-speed test, but then this sensitivity is less important as the speed increases.
These experimental results allowed for an appropriate definition of the cushion foam LS-Dyna material card, which will be described in Section 6.2.
5.2. Seat Pan Deflection Test
Even if most of the deformation is developed by the seat stroke and cushion, the seat pan stiffness may play an important role on the dummy response and its lumbar spine load, due to possible dynamic coupling. Therefore, an additional static test was carried out, in order to retrieve two force–displacement relations: the first one refers to the set including the bottom part of the dummy (in contact with the cushion) and the cushion itself and the other one represents the elastic response of the seat pan. The test consisted in the application of a force through the dummy to the seat, in quasi-static conditions: measuring the cushion deformation and the displacement of the forward tip of the seat pan, it was possible to relate the applied force and the two resultant displacements. The tested assembly, shown in Figure 7a, included only the seat without absorbers (the moveable bucket was blocked along the tracks to prevent its stroke) and the lower part of the ATD from the pelvis to the feet. The subfloor was completely removed, except the upper plate on which the seat was constrained.
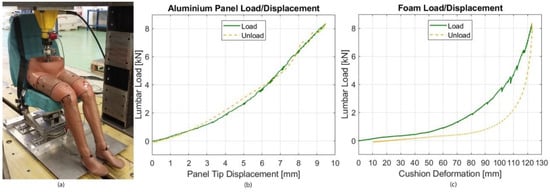
Figure 7.
Seat pan stiffness test: (a) test set-up with hydraulic cylinder applying the load on the pelvis; (b) seat pan tip load–deflection; (c) foam load–deflection.
The force was applied by means of a hydraulic cylinder equipped with a load cell and constrained with the ATD lower spine region. Two wire potentiometers were installed to measure the piston stroke and the seat panel tip deflection. The force applied had a maximum of about 8000 N, in order to avoid possible permanent damage to the seat and cushion foam. The starting point of the test corresponds to the moment when the buttocks of the dummy come into contact with the cushion.
Figure 7b represents the seat pan tip deflection only; the force applied on the cushion implies the tip displacement of the seat pan, meaning that, actually, this relation includes the contribution to the seat pan tip deflection of different seat components: movable part, legs and seat pan.
Figure 7c shows the relation retrieved for the cushion. As a matter of fact, this measure is not exactly the cushion deflection, but, as it is affected by the contributions of the seat pan deflection and of the dummy’s buttocks, more precisely skin and flesh in contact with the cushion; nevertheless, the seat pan deflection, measured at the seat pan tip, is approximately 10% of the cushion deflection, measured with a wire potentiometer along the hydraulic cylinder, and therefore representative of a deflection in the perineal region, where the contribution of the seat pan deflection is considerably smaller. Moreover, this test was fully reproduced with a corresponding finite element partial model: it included only the lower part of the dummy and the seat, but the beams representing the seat shock absorbers were deleted and the sliders were constrained as in the experimental test.
5.3. Honeycomb Characterization
As stated before, both the seat and subfloor were equipped with crushable elements made of honeycomb blocks, suitably sized to obtain the right level of energy absorption in the two stages. The honeycomb had hexagonal 19.05 mm cells, 76.2 µm wall thickness and was made of a 3000-series aluminum. The test campaign was focused on several dynamic experiments on diverse honeycomb blocks, intended to determine the appropriate dimensions for the section of the absorbers on the subfloor and the seat and possible scattering in the results. The tests were performed with the same vertical drop tower used to characterize the cushion foams, with a 68-kg mass installed. In most cases, the specimens were located on the ground anvil, and in few cases, they were attached to the lower surface of the dropping mass. Measurements were sampled at 12.5 kHz and the signals obtained were filtered with an SAE CFC-180 filter.
The blocks were all 150 mm high, but they were cut in different lengths and widths in the range 100–200 mm; in other words, they were made by a different number of cells. Two aluminum sheets, 1 mm thick each, were glued on the top and bottom sides of each block: this can be seen in Figure 8a, showing a tested specimen. Some of the blocks were statically triggered to reduce the initial peak. Figure 8b shows a synthesis of the most relevant results, where the load σcell is normalized to the actual number of cells of each honeycomb block and the displacement ε is normalized to the 150 mm height of the specimens.
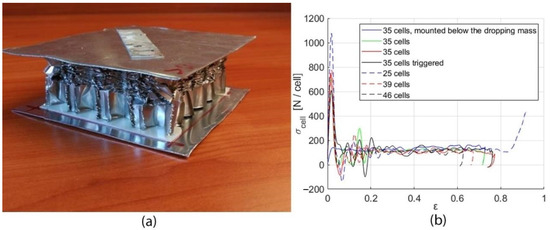
Figure 8.
Honeycomb characterization tests: (a) honeycomb block after test; (b) normalized load–displacement.
The main difference among the tested specimens is the first load peak values; this peak was observed in all the specimens, with the exception of the one which was mounted below the dropping mass surface, which also showed less oscillations in the curve.
Some specimens were triggered by buckling with a hydraulic press, but this did not significantly flatten the initial peak.
As a matter of fact, a further discussion about the initial load peak is of limited interest for this study because its transfer to the occupant is attenuated by the inertial effect of the structure between the energy absorber and the occupant.
Neglecting the initial load peak, the mean of the plateaus resulting from the tests is 127 N/cell. The preliminary multi-body analysis suggested a crushing load of 5.5 kN for each of the 4 subfloor energy absorbers and 11 kN for the seat energy absorber; the number of cells could then be easily determined and the honeycomb blocks were cut accordingly.
6. Finite Element Model
The finite element model was developed for the LS-Dyna code, version smp d R8.1.0.
6.1. Anthropomorphic Test Dummy
The ATD model was made available from a previous study at Politecnico di Milano [40]: this is actually a Hybrid III series dummy, but its lumbar spine region was updated, therefore converting it into an FAA-Hybrid III series, which is alternative to Hybrid II for aircraft seat certification. The model is made of 109 parts and 5588 elements and was validated against experimental data.
6.2. Seat
In the first stage of this research, the seat model contained various rigid parts, since it was the direct descendant of a multi-body approach: both the moveable seat bucket and the fixed tracks were actually made of sets of rigid bodies connected to each other by the CONSTRAINED_RIGID_BODIES card. Successively, all these parts were turned into MAT_ELASTIC with aluminum characteristics.
The translation constraint between the tracks assembly and the seat bucket assembly was initially obtained by accurate modeling of the parts and definition of a CONTACT_AUTOMATIC_SURFACE_TO_SURFACE card; nevertheless, this contributed to an increase in the computational cost and was very sensitive to the parameters used in the contact algorithm. This interaction was successively turned into a CONSTRAINED_JOINT_TRANSLATIONAL card, which is far more efficient and safer from the computational point of view and introduces a negligible approximation.
The seat pan aluminum panel was modeled in MAT_ELASTIC and the cushion in MAT_LOW_DENSITY_FOAM, which is generally suggested for polyurethane foam materials [41], with the DAMP factor set at 0.2 basing on the foam specimens experimental characterization tests mentioned above. The HYSTERETIC UNLOADING factor was set at 0.6: this value was set basing on the results of an extended experimental activity on polymeric cushion foams [39] and LS-Dyna numerical models [42]; nevertheless, this parameter has a very limited effect on the maximum lumbar load resulting from the numerical analysis, since it is relative to the unloading curve of the cushion.
The seat cushion contact with the dummy was based on the CONTACT_AUTOMATIC_SURFACE_TO_SURFACE card; the card used for the cushion contact with the seat pan metal parts was instead switched to CONTACT_GENERAL, as some studies show that using this card is particularly effective for representing the contact between soft materials such as foams and metal materials, when the Self-Constraint Penalty Formulation is used [43,44].
The seat energy-absorbing honeycomb was modeled as a single beam, with the properties, obtained in the above described experimental tests, introduced by the MAT_INELASTIC_SPRING_DISCRETE_BEAM card; the load–deflection curve was approximated with a perfect elastic–plastic reaction, reacting either in compression or in tension: the unloading path follows the stiffness, but, actually, the transition from compression to tension is not relevant for a lumbar spine reaction. The beam is of course aligned with the tracks.
6.3. Subfloor
The subfloor panels were modeled with shell elements, 3 mm thick, based on the classical Belytschko–Tsay formulation with aluminum properties. In the upper sandwich-like section of the subfloor, representing the cabin floor, both the longitudinal and transverse stiffeners were attached to the skins by means of rivets, represented in the model with spot welds. This sandwich-like section was joined to the bottom plate, representing the helicopter belly, with four struts, which were the same honeycomb elements used for the seat energy absorbers, and then again modeled as beam elements, constrained to the upper and lower plates with the CONSTRAINED_EXTRA_NODES card. These beam elements cannot operate under transversal loads, so the upper plate includes kinematic constraints that ensure the pure compression on the struts, i.e., movement along the z (yaw) axis and rotation along the x (pitch) axis.
Figure 9 shows the final finite element full model and some details of the seat energy absorber and subfloor assembly.
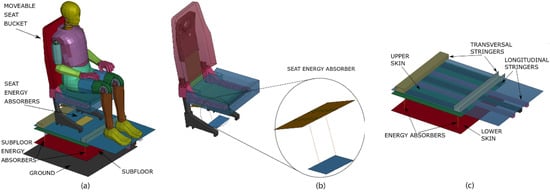
Figure 9.
Finite element model: (a) full assembly with an ATD; (b) seat with energy absorber detail; (c) subfloor.
7. Final Lumped Parameter Model
The preliminary lumped parameter model, initially used to drive the experimental drop test and described in a previous section, was eventually refined following the characterization tests on the seat pan and, at the component level, on the cushion foam and honeycomb. The main modifications consisted in the introduction of a cushion foam loading curve representative of the characterization tests carried out and the reduction in the rotational stiffness associated with the translational joints connecting the movable seat bucket to the tracks fixed to the floor (in MUSIAC, the constraints are not ideal: a stiffness is assigned to each degree of freedom of a constraint). Since the model is quite simplified, this last modification was intended to reduce the flexional stiffness of the seat pan, in agreement with the characterization test.
This feedback from the characterization tests to the lumped parameter model, although apparently very limited, actually has a significant influence on the lumbar spine load.
8. Results
The test was performed by dropping the specimen from the maximum height achievable in the crash test laboratory: 3.05 m free fall, therefore resulting in an impact speed of 7.7 m/s.
The instrumentation system consisted of the following components:
- A data acquisition system set at 12.5 kHz sampling rate;
- A lumbar load cell;
- A load cell under the seat shock absorber honeycomb block;
- Four load cells on the top of the subfloor shock absorber honeycomb blocks;
- A wire potentiometer to measure the seat stroke;
- Two high-speed cameras set at 1000 frames per second.
The videos confirm that the drop occurred with reasonably leveled roll and pitch attitudes.
Figure 10 shows a sequence of three states during the impact, including the finite element and lumped parameter models. The cameras in the test were located rear-right and in front of the test mock-up. As seen from the first frame, the model impacted the floor with no apparent rotation or deviation from the vertical. The next frames show the evolution of the energy-absorbing devices: the seat absorber starts moving after the subfloor struts have reached their final displacement. The floor panel maintained a flat shape and no residual plastic deformation was visible after the test, meaning that the sandwich-like upper plates reacted properly with no contribution to energy absorption.
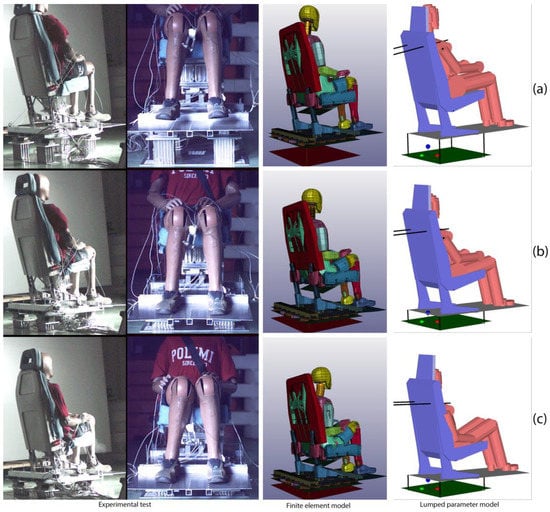
Figure 10.
Relevant frames from the high-speed video: (a) initial impact; (b) end of subfloor crushing and activation of seat energy absorbers; (c) end of seat energy absorbers crushing.
The next Figure 11 shows the most relevant results from the numerical analyses compared with the experimental test.
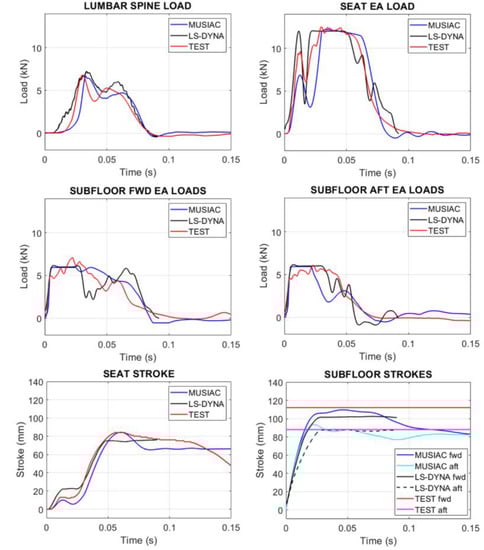
Figure 11.
Main test results and comparison with finite element (LS-Dyna) and lumped parameters (MUSIAC) results; the subfloor residual strokes are only reported for the test as flat horizontal lines.
The lumbar spine load has a satisfactory numerical–experimental correlation, especially as far as the maximum values are concerned; the curve shapes are slightly different, especially in the onset stage. Nevertheless, the double peak, which is typically observed in this test as a consequence of the dynamic coupling between the ATD and the seat, is well in evidence in both the numerical analyses.
The seat energy absorber load measured in this drop test was higher than expected in the honeycomb characterization test: as stated in a previous section, the energy absorber was sized basing on the specimen characterization campaign, to provide 11 kN, but, actually, the curve reported in Figure 11 results to be 12% higher; this difference may be due to a contribution of the air entrapped in the cells [45] or the different constraint in the final test with respect to the characterization tests. At any rate, the beam elements used to represent this energy absorber in both the finite element and lumped parameter models were updated accordingly. The first peak, associated with an eigenvalue, is evident also in both the numerical models, even if it has lower values.
In the next two plots, the subfloor energy absorber loads are reported; considering the test is virtually symmetrical and that the left and right curves are quite similar, for simplicity, the average fwd energy absorbers load and the average aft energy absorbers load are reported. In these plots, more than in the previous seat energy absorber load plot, the modeling approximation is evident: the beams in both the finite element and lumped parameter model were defined with a perfect elastic–plastic response, therefore providing more regular and smooth curves with respect to the experimental results.
The seat stroke is well represented by the lumped parameter model but 12% underestimated by the finite element model. The final part should not be considered because in the experimental mock-up, the seat was free to rebound along the tracks after the maximum stroke was reached, but the beam representing the seat energy absorber in both the numerical models reacted to this re-elongation, therefore maintaining the stroke constant.
Finally, subfloor strokes are compared; the subfloor was not instrumented with any displacement transducer, but the stroke was measured after the test: 88 mm on the rear side and 112 mm on the front side. These values are reported on the graph as flat horizontal lines: as already observed in the seat stroke, the lumped parameter numerical model shows a close correlation with the experimental results, especially in the fwd side deflection; the finite element model shows an excellent experimental correlation in the subfloor rear side deflection, but a significant underestimation in the front side.
9. Design Implications
A reliable numerical model is an important tool for design.
The lumbar spine load in the test was slightly more than the 6670 N limit prescribed by the regulations. The model can now be used to find a design solution that reduces the maximum lumbar spine load, investigating the effect of the seat energy absorber and subfloor crushable columns if there are still exploitable strokes, and also the effect of the seat cushion composition.
At an earlier design stage, a reliable numerical model could help to define or optimize the height and mechanical properties of the subfloor, and the seat specifications, considering that the latter must also comply with the regulation requirements.
Both the lumped parameter model and finite model should be refined to include in the analysis the fact that the different areas of a rotorcraft subfloor are loaded in different ways, meaning that the stiffness or strength of the subfloor are not uniform but have a topological distribution [35]: the numerical model may be used as a tool to drive the design of this distribution, though this additional aspect is beyond the scope of this article.
The numerical models described in this paper are based on two different techniques: lumped parameter and finite element. The latter actually had some modeling details that made it similar to a lumped parameter formulation, in particular as far as the energy absorbing elements are concerned: both the energy absorbers in the seat and those in the subfloor were modeled as beam elements, thus concentrating their mechanical characteristics in a way that is more typical of a lumped parameter formulation. On one side, this choice made the two numerical models more comparable, but on the other side, it deprived the finite element model from one of its strengths, which is the detail level. For a more appropriate use as design tools, at this point, the two formulations should be split, by keeping the lumped mass version as it is and increasing the detail of the finite element version at least in the subfloor: here, the typical keel beams and transverse frames should be modeled, with a particular focus of their intersection regions, where the energy absorption is usually concentrated. The buckling pattern of these cruciform elements is also influenced by the local cabin floor warping (and vice versa), and this aspect can be captured by a refined finite element model.
10. Conclusions
This paper is the synthesis of a 2-year activity, during which both the quality of the mock-up manufactured for experimental testing and its numerical models were upgraded.
Even if the assembled mock-up is a simplification of a real helicopter structure, especially in the subfloor section, it can be considered representative of a double-stage crash system made of a crashworthy seat and subfloor.
Both the finite element and lumped parameter numerical models and analyses of this mock-up are challenging, principally for the important non-linearities in most of the structural components and anthropomorphic dummy. Starting from the initial finite element model, which was a direct descendant of the lumped parameter model, a significant refinement was necessary to reach a good level of reliability; the steps of this refinement were based on a first experimental drop test (not described in this paper), a series of characterization tests at the coupon and sub-component levels and a final drop test. In particular, the characterization tests carried out to assess the seat pan stiffness and cushion damping effect turned out to be determinant for the improvement of the numerical model.
An important approximation in the model developed so far is probably the representation of the honeycomb crash stages in the finite element model with simple beams with an elastic–plastic load–deflection reaction. The honeycomb has a complex crushing pattern, made of buckling stages, self-contacts, constraint dependency and probably also a contribution of the air entrapped in the cells and outflowing during the crush: all these events are sensitive to local deformation and therefore the results obtained during honeycomb blocks characterization under the drop tower should not be considered perfectly valid when they are part of a more complex structure. This idea is supported by the fact that the loads measured along some honeycomb blocks during the final drop test have a significant difference with respect to an elastic–plastic approximation.
A second important approximation of this work is the lack of a more extended experimental database: the mock-up is quite a complex structure and scattering could arise if repeated tests could be carried out, typically associated with the ATD position, change in friction of the seat sliders along the tracks and installation details of the energy absorbers.
Nevertheless, the level of numerical–experimental correlation obtained so far is satisfactory: the multi-body model could be used for a parametrical analysis, aimed at optimizing the mechanical characteristics of the energy-absorbing stages for lumbar spine load reduction, while the finite element model could provide important information on local effects. The combination of the two approaches is a potentially useful tool for design assistance.
Author Contributions
Formal analysis, M.B.; investigation, P.A. and M.Z.; methodology, P.A.; supervision, P.A. All authors have read and agreed to the published version of the manuscript.
Funding
This research received no external funding.
Conflicts of Interest
The authors declare no conflict of interest.
References
- Stapp, J.P. Human Tolerance to Deceleration. Am. J. Surg. 1957, 93, 734–740. [Google Scholar] [CrossRef]
- De Haven, H. Causes of Injury in Light Plane Accidents. Aero Digest 1944, 206, 51–55. [Google Scholar]
- Eiband, A.M. Human Tolerance to Rapidly Applied Accelerations: A Summary of the Literature; NASA Memorandum 5-19-39E; NASA: Washington, DC, USA, 1959.
- Cheva, W.; Yasuki, T.; Gupta, V.; Mendis, K. Vehicle Development for Frontal/Offset Crash Using Lumped Parameter Modeling 960437. SAE Techl. Pap. 1996. [Google Scholar] [CrossRef]
- Prasad, P.; Padgaonkar, A. Static-to-Dynamic Amplification Factors for Use in Lumped-Mass Vehicle Crash Models 810475. SAE Tech. Pap. 1981. [Google Scholar] [CrossRef]
- Khalil, T.B.; Sheh, M.Y. Vehicle Crashworthiness and Occupant Protection in Frontal Impact by FE Analysis—An Integrated Approach. In Crashworthiness of Transportation Systems: Structural Impact and Occupant Protection; Ambrósio, J.A.C., Pereira, M.F.O.S., da Silva, F.P., Eds.; NATO ASI Series (Series E: Applied Sciences); Springer: Dordrecht, The Netherlands, 1997; Volume 332, pp. 363–399. [Google Scholar] [CrossRef]
- Schweizerhof, K.; Nilsson, L.; Hallquist, J.O. Crashworthiness analysis for the automotive industry. Int. J. Comput. Appl. Technol. 1992, 5, 134–156. [Google Scholar] [CrossRef]
- Kan, C.D.; Marzougui, D.; Bahouth, G.T.; Bedewi, N.E. Crashworthiness Evaluation Using Integrated Vehicle and Occupant Finite Element Models. Int. J. Crashworthiness 2001, 6, 387–398. [Google Scholar] [CrossRef]
- Ma, D.; Zhang, H. Evaluation of Frontal Occupant Protection System Responses to Crash Pulse Variations. Int. J. Crashworthiness 2006, 11, 243–250. [Google Scholar] [CrossRef]
- Jackson, K.E. Advances in Rotorcraft Crashworthiness—Trends Leading to Improved Survivability. J. Am. Helicopter Soc. 2018, 63. [Google Scholar] [CrossRef]
- Yang, X.; Ma, J.; Wen, D.; Yang, J. Crashworthy design and energy absorption mechanisms for helicopter structures: A systematic literature review. Prog. Aerosp. Sci. 2020, 114. [Google Scholar] [CrossRef]
- Coltman, J.W.; Bolukbasi, A.O.; Laananen, D.H. Analysis of Rotorcraft Crash Dynamics for Development of Improved Crashworthiness Design Criteria; Technical Report DOT/FAA/CT-85/11; US Department of Transportation, Federal Aviation Administration: Washington, DC, USA, 1985.
- Shanahan, D.F.; Shanahan, M.O. Kinematics of U.S. Army helicopter crashes: 1979–1985. Aviat. Space Environ. Med. 1989, 60, 112–121. [Google Scholar] [PubMed]
- King, A.I. Impact Injuries of the Thoracolumbar Spine. In The Biomechanics of Impact Injury; King, A.I., Ed.; Springer: Cham, Switzerland, 2018; pp. 281–317. [Google Scholar] [CrossRef]
- King, A.I. Biomechanics of Facet Loading in the Lumbar Spine. In The Biomechanics of Impact Injury; King, A.I., Ed.; Springer: Cham, Switzerland, 2018; pp. 319–356. [Google Scholar] [CrossRef]
- European Aviation Safety Agency. EASA CS 27 Certification Specifications for Small Rotorcraft, Amendment 4; European Aviation Safety Agency: Cologne, Germany, 2016.
- European Aviation Safety Agency. EASA CS 29 Certification Specifications for Large Rotorcraft, Amendment 4; European Aviation Safety Agency: Cologne, Germany, 2016.
- Bolukbasi, A.O. New technologies to enhance rotorcraft crash safety. In Proceedings of the 44th European Rotorcraft Forum, Delft, The Netherlands, 18–21 September 2018. [Google Scholar]
- Astori, P.; Impari, F. Crash Response Optimisation of Helicopter Seat and Subfloor. Int. J. Crashworthiness 2013, 18, 570–578. [Google Scholar] [CrossRef]
- Jackson, K.E.; Boitnott, R.L.; Fasanella, E.L.; Jones, L.E.; Lyle, K.H. A Summary of DOD-Sponsored Research Performed at NASA Langley’s Impact Dynamics Research Facility. J. Am. Helicopter Soc. 2006, 51, 59–69. [Google Scholar] [CrossRef]
- Fasanella, E.L.; Boitnott, R.L.; Lyle, K.H.; Jackson, K.E. Full-Scale Crash Test and Simulation of a Composite Helicopter. Int. J. Crashworthiness 2001, 6, 485–498. [Google Scholar] [CrossRef]
- Wittlin, G.; Rapaport, M.B. Naval Rotorcraft Water Impact Crash Simulation Using Program KRASH. In Proceedings of the American Helicopter Society 49th Annual Forum, St. Louis, MI, USA, 19–21 May 1993. [Google Scholar]
- Kindervater, C.M. Aircraft and Helicopter Crashworthiness: Design and Simulation. In Crashworthiness of Transportation Systems: Structural Impact and Occupant Protection; Ambrósio, J.A.C., Pereira, M.F.O.S., da Silva, F.P., Eds.; NATO ASI Series (Series E: Applied Sciences); Springer: Dordrecht, The Netherlands, 1997; Volume 332, pp. 525–577. [Google Scholar] [CrossRef]
- Kindervater, C.; Johnson, A.; Kohlgrüber, D.; Lützenburger, M.; Pentecôte, N. Crash and Impact Simulation of Aircraft Structures-Hybrid and FE Based Approaches. In Proceedings of the European Congress on Computational Methods in Applied Sciences and Engineering-ECCOMAS 2000, Barcelona, Spain, 11–14 September 2000. [Google Scholar]
- Annett, M.S. LS-DYNA Analysis of a Full-Scale Helicopter Crash Test. In Proceedings of the 11th International LS-DYNA Users Conference, Dearborn, MC, USA, 6–8 June 2010. [Google Scholar]
- Pentecôte, N.; Vigliotti, A. Crashworthiness of helicopters on water: Test and simulation of a full-scale WG30 impacting on water. Int. J. Crashworthiness 2003, 8, 559–572. [Google Scholar] [CrossRef]
- Desjardins, S. The Evolution of Energy Absorption Systems for Crashworthy Helicopter Seats. J. Am. Helicopter Soc. 2003, 51, 150–163. [Google Scholar] [CrossRef]
- Hu, D.Y.; Yang, J.L.; Hu, M.H. Full-Scale Vertical Drop Test and Numerical Simulation of a Crashworthy Helicopter Seat/Occupant System. Int. J. Crashworthiness 2009, 14, 565–583. [Google Scholar] [CrossRef]
- Hiemenz, G.J.; Choi, Y.T.; Wereley, N.M. Semi-Active Control of Vertical Stroking Helicopter Crew Seat for Enhanced Crashworthiness. J. Aircr. 2007, 44. [Google Scholar] [CrossRef]
- Murugan, M.; Yoo, J.H.; Hiemenz, G.J. Simulation of Adaptive Seat Energy Absorber for Military Rotorcraft Crash Safety Enhancement. In US Army Research Laboratory Report ARL-TR-6892; Aberdeen Proving Ground: Harford County, MD, USA, 2014. [Google Scholar]
- Bisagni, C. Crashworthiness of Helicopter Subfloor Structures. Int. J. Impact. Eng. 2002, 27, 1067–1082. [Google Scholar] [CrossRef]
- Bisagni, C. Crashworthiness of Helicopter Subfloor Structural Components. Aircr. Eng Aerosp. Tec. 1999, 71, 6–11. [Google Scholar] [CrossRef]
- Ren, Y.; Xiang, J. The Crashworthiness of Civil Aircraft Using Different Quadrangular Tubes as Cabin-Floor Struts. Int. J. Crashworthiness 2011, 16, 253–262. [Google Scholar] [CrossRef]
- Zheng, J.; Xiang, J.; Luo, Z.; Ren, Y. Crashworthiness Design of Transport Aircraft Subfloor Using Polymer Foams. Int. J. Crashworthiness 2011, 16, 375–383. [Google Scholar] [CrossRef]
- Hajela, P.; Lee, E. Topological Optimization of Rotorcraft Subfloor Structures for Crashworthiness Considerations. Comput. Struct. 1997, 64, 65–76. [Google Scholar] [CrossRef]
- Prasad, P.; Chou, C.C. A Review of Mathematical Occupant Simulation Models. In Accidental Injury-Biomechanics and Prevention; Nahum, A.M., Melvin, J.W., Eds.; Springer: New York, NY, USA, 1997; pp. 102–149. [Google Scholar] [CrossRef]
- Guida, M.; Manzoni, A.; Zuppardi, A.; Caputo, F.; Marulo, F.; De Luca, A. Development of a Multibody System for Crashworthiness Certification of Aircraft Seat. Multibody Syst. Dyn. 2018, 44, 191–221. [Google Scholar] [CrossRef]
- Cacchione, B.; Airoldi, A.; Astori, P. Modelling Technique to Optimise Energy Absorption in Helicopter Crashes. In Proceedings of the 6th International KRASH Users’ Seminar (IKUS6), Stuttgart, Germany, 15–17 June 2009. [Google Scholar]
- Hooper, S.J.; Henderson, M.J. Development and Validation of an Aircraft Seat Cushion Component Test—Volume, I; Technical Report DOT/FAA/AR-05/5, I; US Department of Transportation, Federal Aviation Administration: Washington, DC, USA, 1985.
- Anghileri, M.; Castelletti, L.M.L.; Fracasso, E. Hybrid III numerical model for aircraft seat crash performance assessment. J. Aircr. 2007, 44, 1691–1700. [Google Scholar] [CrossRef]
- Livermore Software Technology Corporation (LSTC). LS-DYNA Keyword User’s Manual-Vol 2: Material Models; LSTC: Hong Kong, China, 2015. [Google Scholar]
- Slik, G.; Vogel, G.; Cawda, V. Material Model Validation of a High Efficient Energy Absorbing Foam. In Proceedings of the 5th LS-DYNA Forum, Ulm, Germany, 12–13 October 2006. [Google Scholar]
- Livermore Software Technology Corporation (LSTC). LS-DYNA Theory Manual; LSTC: Hong Kong, China, 2015. [Google Scholar]
- Gulavani, O.V. Comparative Assessment of Implicit and Explicit Finite Element Solution Schemes for Static and Dynamic Civilian Aircraft Seat Certification (CS25.561 and CS25562). Ph.D. Thesis, Cranfield University, Cranfield, UK, 2013. [Google Scholar]
- Xu, S.; Beynon, J.H.; Ruan, D.; Yu, T.X. Strength enhancement of aluminium honeycombs caused by entrapped air under dynamic out-of-plane compression. Int. J. Impact. Eng. 2002, 47, 1–13. [Google Scholar] [CrossRef]
Publisher’s Note: MDPI stays neutral with regard to jurisdictional claims in published maps and institutional affiliations. |
© 2020 by the authors. Licensee MDPI, Basel, Switzerland. This article is an open access article distributed under the terms and conditions of the Creative Commons Attribution (CC BY) license (http://creativecommons.org/licenses/by/4.0/).