Abstract
Vertical takeoff and landing (VTOL) aircraft must balance the conflicting demands of hover and cruise performance. To address the lack of integrated design methodologies in the existing literature, a unified design-optimization framework is presented, coupling high-fidelity CFD simulations with a genetic algorithm to refine a gas-driven thrust fan (GDTF) VTOL nacelle. Key geometric parameters—fan pressure ratio pressure ratio, fan tilt, nozzle angle, tail inclination, and tip shape—were varied in a comprehensive parametric study to maximize lift-to-drag ratio and maintain constant mass flow. The optimization reveals that a nearly horizontal fan axis maximizes cruise efficiency (), a nozzle angle of about offers the best lift-vs-drag compromise during transition, and refining the tip geometry yields a – performance boost. To validate the numerical predictions, a 1:1.05 scale VTOL nacelle model (fan diameter ) was fabricated and tested in a low-speed wind tunnel at (, turbulence intensity ≈ 2%). Total-pressure probes at the intake exit plane and static taps along the inner cowl wall provided detailed pressure distributions, from which exit Mach number, velocity and the equivalent flow coefficient φ (≈0.68 under test conditions) were derived. Oil-flow visualization on the external cowl surface confirmed smooth, attached streamlines with no large separation bubbles. This dual validation combining surface-flow visualization and pressure-recovery mapping demonstrates the accuracy and reliability of the proposed simulation methodology. By successfully bridging detailed CFD with genetic-algorithm-driven design and validating against comprehensive wind-tunnel measurements, this integrated approach paves the way for next-generation VTOL configurations with longer range and lower fuel consumption.
1. Introduction
VTOL aircraft have captured the interest of researchers and engineers for decades because they are able to operate within harsh environments such as ship decks to mountainous regions—without the necessity to use large amounts of runway infrastructure [1,2]. Over the decades, various VTOL concepts have been developed, from helicopters and tilt-rotor aircraft (e.g., V-22 Osprey) to aircraft equipped with lift fans or downward thrust devices (e.g., AV-8B, XV-5, F-35B) [3,4]. Although each technique has some irrefutable advantages, none has managed to address every performance trade-off simultaneously whether mechanical complexity, excessive specific fuel consumption during hovering, or dead weight issues created through the use of the lift fans during forward flight [5,6].
Among the new solutions, the gas-powered fan (also known as the tip-turbine fan) is particularly noteworthy for having lower specific fuel consumption and the capability to be efficient both in the hover regime and the cruise regime [7,8]. Rather than letting the exhaust gases be wasted, a tip turbine positioned near the edge of the fan exploits the kinetic energy of the exhaust gases to generate a large gain in thrust and lift often 200–400% higher than that of a turbojet exhaust alone [9,10]. The X353-5 lift fan, developed by General Electric, was one of the early demonstrations that highlighted the potential of tip-turbine lift-fan technology. This success has led to a variety of subsequent studies exploring areas such as aerodynamic design, cost analysis, and experimental testing [11,12,13]. A major challenge in using gas-driven fans on fixed-wing aircraft is ensuring that the propulsion system remains effective and advantageous throughout the entire flight envelope. Traditional “fan-in-wing” configurations, such as those seen in the XV-5A/B, provide strong lift during vertical operations. However, once the aircraft transitions to forward flight, these systems often become dead weight, leading to a decrease in overall efficiency [14,15]. Motivated by this drawback, several new concepts have been proposed, including VTOL nacelles and other integrated propulsion-airframe solutions [16,17]. New designs have indicated the possibility of creating an innovative exhaust and intake system to allow the fan to produce both during take-off and landing vertically but also during flight forwards increasing the efficiency aerodynamically and the penalty of drag [18,19]. Indeed, the exhaust and intake geometry (exhaust nozzle angle, cowl radius, and intake height) has been one of the chief determinants of performance that affect fan pressure recovery, thrust creation, and drag characteristics [20,21]. Moreover, sophisticated computational analysis tools like computational fluid dynamics (CFD) and machine learning algorithms have played a crucial role in the optimization of eVTOL designs. Early-stage aerodynamic analysis using CFD makes it possible to test innovative designs like ducted fans, blended-wing bodies, and unconventional nacelle designs [22,23]. Machine learning, particularly through neural networks and genetic algorithms (GAs), has significantly enhanced optimization processes, enabling rapid evaluations of complex aerodynamic interactions [24,25]. Studies on tilt-wing and contra-rotating propeller configurations have shown that adaptive propulsion solutions can improve both hover and cruise efficiencies, reducing energy consumption and structural weight penalties [26,27]. Researchers have made significant strides in VTOL technology recently, focusing on boosting both aerodynamic performance and propulsion efficiency. For example, studies reveal that Zero Net Mass Flux (ZNMF) actuators a type of Active Flow Control (AFC) can effectively delay flow separation and sharpen aerodynamic efficiency when aircraft operate near stall conditions [28]. Meanwhile, investigations into rotor-rotor interactions in eVTOL designs show that spacing rotors vertically or longitudinally directly impacts thrust efficiency and torque demands [29]. Innovative approaches like CoFlow Jet (CFJ) airfoils are gaining traction, as they enhance lift and power efficiency during both hover and cruise phases [30,31]. Ducted fans continue to be a key area of study for VTOL systems, with researchers refining designs to improve stability and efficiency across diverse flight scenarios [32]. Recent work on ducted coaxial propellers highlights how vortex restrain rings can curb airflow separation, offering a practical way to enhance lift and aerodynamic performance [33]. Urban air mobility (UAM) operations are also evolving. Optimized control strategies for multicopper approaches are making flights safer and more efficient around vertiports [34]. Assessments of flying-wing VTOL UAVs, however, underscore unique control challenges tied to their design, pointing to opportunities for future improvements [35]. On the optimization front, Genetic Algorithms (GA) have uncovered Pareto-optimal solutions for hybrid and electric propulsion systems in lift-plus-cruise eVTOLs [36]. Structural upgrades, like composite engine mounts, are cutting weight while boosting reliability [37]. Multi-objective strategies for 3D route planning are slashing noise, energy use, and flight durations [38], and blade shape optimizations now balance hover and cruise efficiency in propeller design [10]. Real-world testing of streamlined flight control systems on subscale UAVs confirms their viability [39], and new path-planning methods for electric VTOLs prioritize energy savings without compromising safety in cities [40]. Transition stability in fixed-wing VTOLs has also improved thanks to evolutionary algorithm-tuned active disturbance rejection control (ADRC) [41]. Experimental techniques like microjets and vortex generators are proving effective at managing flow separation [42,43], while advanced turbulence models are refining simulations of these aerodynamic interventions [44]. Drag optimization for VTOL hulls, guided by stability needs, is boosting cruise efficiency [45], and hybrid suction/blowing actuators are emerging as energy-smart tools for flow control [46]. Also, analysis of transient thrust patterns in compact propulsion systems is helping engineers achieve steadier performance [47]. Lastly, recent integrated design approaches, such as the composite regenerative cooling system for scramjets investigated by Liu, et al. [48], similarly employ high-fidelity CFD and parametric optimization to harmonize thermal-fluid and structural performance. This aligns with the core multidisciplinary philosophy of the aerodynamic propulsion co-optimization framework presented here for gas-powered fan VTOL systems.
Together, these innovations are driving progress in VTOL technology, emphasizing the importance of combining aerodynamic and propulsion system optimizations.
Despite significant advancements in individual VTOL propulsion components, a critical challenge persists: the lack of a truly integrated design methodology that harmonizes the propulsion system with the airframe across all flight regimes. Existing research often focuses on isolated aspects such as fan efficiency, thrust-vector actuation, or nacelle-airframe integration without fully addressing their interdependent effects on overall system performance. Key unresolved issues include maintaining optimal fan pressure ratio under varying atmospheric conditions, minimizing weight penalties associated with thrust-vector mechanisms, and reconciling external aerodynamics with internal flow dynamics during transition phases. These limitations inevitably lead to performance compromises in practical VTOL operations.
This paper bridges this gap by introducing a multidisciplinary design optimization (MDO) framework that simultaneously co-optimizes the gas-driven fan system, thrust-vectoring nozzle, and airframe tail surfaces using high-fidelity CFD simulations coupled with a genetic algorithm. This integrated approach enables us to capture complex interactions including inlet distortion effects, thrust transients, and aerodynamic interference that are typically overlooked in conventional sequential design processes. The efficacy of this framework is rigorously validated through wind-tunnel testing of a scaled model, employing detailed pressure measurements and flow visualization techniques. We argue that the proposed methodology provides a foundational step towards next-generation VTOL systems with enhanced aerodynamic efficiency, reduced fuel consumption, and greater mission flexibility.
2. Geometry and Methodology
2.1. Geometry Description
The isolated nacelle configuration examined in this study was generated in SolidWorks (v2021), with its propulsion components modeled as a single integrated system. Key geometric details include the placement of the gas-driven fan within the fuselage (or nacelle), as well as the inlet and exhaust nozzle features that allow for thrust-vector control during VTOL operations and forward flight. To ensure accurate capture of aerodynamic interactions, particular attention was paid to the fan inlet duct, nozzle geometry, and tail surfaces, all of which affect both the external flow field. Figure 1a shows an isometric view of the isolated nacelle assembly, highlighting its outer mold line of the fuselage, the position of the lift fan, and the transition between the fan duct and the nozzle. Meanwhile, to reduce computational requirements, only half the model was used in the numerical analysis by leveraging the geometric symmetry of the nacelle assembly. Also, this figure illustrates the symmetry plane cut, clarifying how the flow domain and boundaries were defined in the CFD setup. Furthermore, additional close-up views of the fan tip region, tail geometry, and exhaust nozzle can be found in this figure. These images highlight critical design features including the fan’s tip clearance, inlet curvature, and nozzle deflection angles that substantially influence the flow distribution and thrust performance. This study focuses exclusively on the aerodynamic analysis and optimization of the isolated Gas-Driven Thrust Fan (GDTF) nacelle assembly, rather than a complete aircraft configuration. All reported aerodynamic coefficients, including the maximum lift-to-drag ratio (L/D), correspond to this nacelle unit under prescribed forward-flight simulation conditions. For ducted propulsion systems of this type, which inherently exhibit internal flow losses and external interference drag, the obtained L/D values are consistent with prior studies of similar systems. The primary contribution of this work is therefore the demonstration of relative performance improvement and parametric sensitivity for the nacelle geometry.
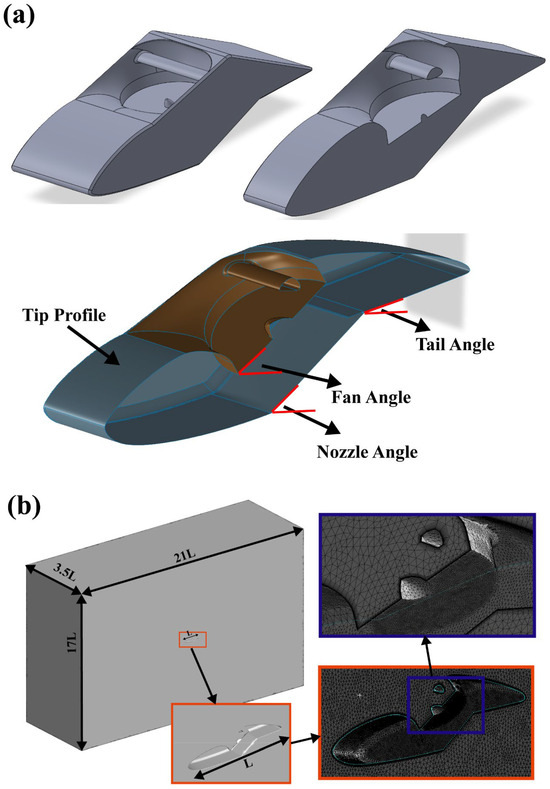
Figure 1.
(a) Geometry and optimization parameters of the isolated nacelle model. (b) Computational domain and mesh details.
In summary, the final CAD model of the isolated nacelle incorporates the inlet duct, gas-driven fan, and vectored-thrust nozzle in a single integrated assembly.
2.2. Governing Equations
All simulations were performed using the finite-volume solver Ansys Fluent [49], which numerically solves the Navier–Stokes equations under the assumption of a Reynolds-averaged formulation for turbulence. The continuity equation for a compressible flow is given by [49,50]:
Conservation of momentum is governed by the RANS momentum equations, typically written in index notation as:
where is the static pressure, represents the viscous and turbulent stresses (modeled through an eddy viscosity hypothesis in RANS), and is the gravitational acceleration vector (if considered). Finally, the energy equation is solved to account for temperature and density changes under compressible conditions. The energy equation in its common form for compressible flow is:
where:
- ○
- Turbulence Modeling: The Model
To accurately predict flow separation and capture near-wall effects including those at the fan inlet, duct surfaces, and nozzle walls this study adopted the Shear Stress Transport () model. The approach blends the robust near-wall behavior of the framework with the free-stream insensitivity of the model. Its formulation relies on two transport equations:
- 1.
- Turbulent Kinetic Energy ()
- 2.
- Specific Dissipation Rate ()
It should be noted that the turbulence model was selected for this study based on its established capability for predicting flows with adverse pressure gradients and moderate separation, which are characteristic of the cruise-dominant conditions central to our optimization. Given the parametric nature of this study requiring approximately 200 CFD simulations, the model provides an optimal balance between accuracy and computational efficiency, as advanced scale-resolving methods (e.g., DES, LES) would be prohibitively expensive for such a large-scale exploration. The model’s validity is further supported by indirect validation against experimental flow patterns and pressure recovery data presented in Section 3. While acknowledging that scale-resolving approaches could offer enhanced resolution of complex transitional flow physics in full VTOL operation, such high-fidelity analysis is beyond the scope of this parametric trend-based optimization and is noted as a valuable direction for future research.
2.3. Computational Domain and Mesh
An unstructured mesh was constructed around the model to ensure adequate resolution in high-gradient regions particularly near leading edges, fan, and the nozzle exit. Special refinements were introduced around the fan tip, intake lip, and tail planes to reduce numerical diffusion. A high-quality mesh is critical for accurately capturing the flow physics around the fan inlet, nozzle, and fuselage. To ensure mesh independence, a preliminary mesh refinement study was performed, gradually increasing the cell count in regions of significant flow gradients particularly near the fan tip, inlet lip, and nozzle exit. Key steps included:
- Global Domain and Refinements
- ○
- A hybrid structured–unstructured approach was adopted. Coarse tetrahedral cells were used in the far field, transitioning to finer cells in boundary-layer and wake regions.
- ○
- The inlet and far-field boundaries were placed sufficiently far from the aircraft geometry to prevent boundary-condition interference.
- Near-Wall Resolution
- ○
- A boundary-layer mesh was generated around all solid surfaces, ensuring for capturing the near-wall flow correctly under the turbulence model.
- ○
- The fan tip clearance region was given special attention. A fine mesh captured potential tip-vortex interactions between rotating and stationary surfaces.
- Mesh Independence Criteria
- ○
- Several mesh densities (e.g., 2 million, 4 million, 8 million, and 16 million cells) were tested.
- ○
- Convergence was judged by monitoring differences in and across refinements. Once successive refinements altered drag and lift by less than , the mesh was deemed sufficient.
- ○
- The simulation for this validation was conducted at a fixed cruise condition of , with other geometric parameters held constant (Nozzle Angle = 15°, Fan Angle = 20°, Tail Angle = 0°, = 80 mm, = 150 mm).
- ○
- Consequently, the Fine mesh configuration was selected for all subsequent simulations to achieve an optimal balance between computational accuracy and cost (see Table 1).
 Table 1. Mesh independence study results.
The final mesh—selected to balance computational expense and accuracy—was then used for all subsequent optimization steps. The domain extents were chosen based on best practices for external aerodynamic simulations, ensuring that inlet and far-field boundaries lie sufficiently far from the aircraft surfaces to minimize boundary-condition interference. Figure 1b shows the problem domain and mesh.
Boundary conditions were applied as follows: the freestream was defined using a pressure far-field condition (specifying Mach number and static temperature); the domain exit was a pressure outlet; all nacelle surfaces were modeled as adiabatic, no-slip walls; and a symmetry condition was applied on the central longitudinal plane. These conditions were kept consistent across all simulations to ensure result comparability.
- Inlet/Far-Field Boundary Conditions: specified as a velocity inlet or pressure far-field, depending on the flight condition simulated.
- Outlet Boundary: set as a pressure outlet, with zero-gauge pressure unless otherwise specified.
- Walls: aircraft surfaces were modeled as no-slip adiabatic walls, with boundary-layer mesh refinements resolving alues typically below 5–10 in critical regions.
- The propulsion system was modeled by imposing a key performance target rather than a fixed boundary value. The target was to maintain a constant fan pressure ratio (PR = = 1.11) at the simulated cruise condition (e.g., = 60 m/s). This was implemented via a User-Defined Function (Appendix A), that dynamically adjusted the static pressure at the fan inlet boundary at each solver iteration. Simultaneously, to ensure physical consistency, the UDF enforced global mass conservation by specifying that the mass flow rate exiting the vectored nozzle (modeled as a mass flow inlet boundary) must equal the mass flow rate entering the fan. Consequently, the mass flow rate was not a preset input but a converged output of the simulation, satisfying both the target PR and the geometric configuration. This approach more accurately represents the behavior of a real gas-driven fan operating at a set performance point.
2.4. Simulation Setup and Convergence
All simulations were run in transient mode, given the focus on specific operating points (e.g., hover conditions, moderate forward velocity). The SIMPLE scheme was used for pressure–velocity coupling. Second-order upwind spatial discretization was employed for both momentum and turbulence equations to minimize numerical dissipation. The residuals for continuity, momentum, turbulent kinetic energy, and specific dissipation rate were monitored; typical convergence criteria required residual drops to or lower, complemented by stable lift, drag, and fan mass flow readings over several hundred iterations.
- ○
- Post-Processing and Key Quantities
From the converged flow solutions, the primary output quantities included:
- Lift () and Lift Coefficient ()
- Drag () and Drag Coefficient ()
- Mass Flow Rate through the fan ()
- Lift-to-Drag Ratio ()
The drag and lift coefficients were computed using the standard aerodynamic definitions:
where and are the free-stream density and velocity, respectively, and is the aircraft’s reference area. In sum, the combination of a high-fidelity geometric model (developed in SolidWorks) and an advanced turbulence model () in Ansys Fluent provides a robust framework for predicting the aerodynamic performance of the gas-driven fan VTOL configuration. By systematically varying parameters such as fan pressure ratio, inlet geometry, and nozzle deflection angle, the present methodology enables an in-depth exploration of aerodynamic trade-offs central to VTOL aircraft design.
- ○
- Genetic Algorithm Framework
The Genetic Algorithm employed in this study is a population-based stochastic optimization method inspired by natural evolution. The specific parameters used included: a population size of 50 individuals, a crossover rate of 0.8, and a mutation rate of 0.1. The stopping criterion was defined as either 100 generations or a change in fitness value of less than 0.01 for 20 consecutive generations (see Table 2). Each individual (or “chromosome”) in the population encodes a particular set of design variables:
- Horizontal velocity ()
- Fan pressure ratio ()
- Tip profile geometry parameters
- Tail angle ()
- Fan angle ()
- Nozzle angle ()
Table 2.
Genetic Algorithm Parameters.
Table 2.
Genetic Algorithm Parameters.
| Parameter | Value/Description |
|---|---|
| Population Size | 50 |
| Selection Method | Roulette Wheel Selection |
| Crossover Method | Simulated Binary Crossover (SBX), Probability = 0.8 |
| Mutation Method | Polynomial Mutation, Probability = 0.1 |
| Termination Criteria | (1) 100 generations reached, OR (2) Change in average fitness < 0.01 for 20 consecutive generations |
The optimization process follows the flowchart in Figure 2. When the fitness function (L/D ratio) is not satisfied, the algorithm proceeds to generate a new population through selection, crossover, and mutation operations rather than recalculating fitness values. Additional customization was required for User-Defined Functions (UDFs) that manage:
- Mass conservation between fan inlet and nozzle outlet
- Dynamic boundary conditions (fan inlet as a pressure outlet and nozzle outlet as a mass flow inlet)

Figure 2.
Genetic algorithm flowchart.
Figure 2.
Genetic algorithm flowchart.

Each generation, a set of candidate designs is evaluated, yielding performance metrics (drag, lift, mass flow rate, etc.). A fitness function here guides the GA’s selection of superior designs. Randomized crossover and mutation operators then produce new design variants. This iterative process continues until convergence is reached (i.e., repeated generations yield negligible performance improvement). The UDF framework provides robust control of fan operating conditions (mass flow, pressure ratio) for this parametric study. It is noted that the model does not explicitly impose the tangential velocity component (swirl) from the fan rotor. This simplification is justified as the optimization focuses on axial momentum balance and geometric sensitivities, which are the dominant effects for the investigated parameter ranges. Capturing swirl remains important for higher-fidelity performance analysis and is recommended for future design stages. The rationality of the genetic algorithm was verified through multiple independent optimizations runs with different random seeds. All runs converged to similar optimal regions, confirming the robustness and consistency of the optimization results against stochastic variations in the algorithm’s initial population. Figure 2 shows the GA’s flowchart.
- ○
- Dynamic Adjustment of Fan Pressure Ratio (PR)
A crucial aspect of our approach involved maintaining a target pressure ratio across the fan. This was achieved via a UDF that executes the following logic each iteration:
- Measure Current PR: For each CFD iteration, the code measures the gauge pressures at the fan inlet and outlet, converts them to absolute values, and computes the current pressure ratio .
- Adjust Inlet Gauge Pressure: If deviates from by more than a tolerance , the code increments or decrements the fan inlet gauge pressure in steps of 100 Pa to push the system closer to the target ratio.
- Enforce Mass Conservation: The UDF sets the nozzle outlet boundary as a mass flow inlet, ensuring . This prevents artificial accumulation or depletion of flow in the fan duct.
The pseudocode in the Appendix A shows how the UDF adjusts pressure dynamically.
- ○
- Optimization Problem Formulation
The multidisciplinary design optimization is formally defined as follows:
- Objective: Maximize the lift-to-drag ratio (L/D for cruise-condition aerodynamics.
- Design Variables: Horizontal velocity, nozzle angle, fan tilt angle, tail inclination angle, and tip profile coordinates and . Their bounds are specified in Table 1.
- Constraints:
- ✓
- Mass flow conservation∣ < 0.01 kg/s.
- ✓
- Fan pressure ratio maintenance = 1.11 ± 0.02.
3. Experimental Investigation
3.1. Setup
The experimental data presented in this section were obtained from wind tunnel tests performed by our research group on a 1:1.05 scale VTOL nacelle model (fan diameter ), as shown in Figure 3a. Eight total-pressure probes were mounted circumferentially at the intake exit plane to measure the total-pressure recovery coefficient (σ), defined as the ratio of outlet total pressure to freestream total pressure, and static-pressure taps were embedded along the inner cowl wall for detailed pressure recovery measurements. All pressure signals were acquired using a multichannel pressure scanner with a full-scale accuracy of ±0.05% and sampled at 10 Hz. This high-accuracy instrumentation, combined with individual probe calibration and standard wind-tunnel blockage corrections, ensures the reliability of the experimental pressure data used for validation. Ambient static pressure and temperature were monitored continuously with a manometer and platinum-wire thermometer, respectively. The wind tunnel test section dimensions are , and the blockage ratio was calculated to be less than 5%. A single series of wind-tunnel tests was carried out to examine nacelle performance under cruise-condition aerodynamics. The model was tested at a free-stream speed of (, turbulence intensity ). Pressure data from each probe was corrected using its individual calibration curve, and a standard wind-tunnel wall blockage correction was applied. All tests were conducted at zero angle of attack (AoA = 0°), defined as the angle between the freestream velocity vector and the nacelle centerline. The deflector angle was swept from to to assess its effect on total-pressure recovery. Total-pressure measurements were recorded at each angle, and external flow was visualized using the oil-flow technique. No separate VTOL-mode entrainment tests were performed; all validation data refer to the cruise-condition wind-tunnel campaign.
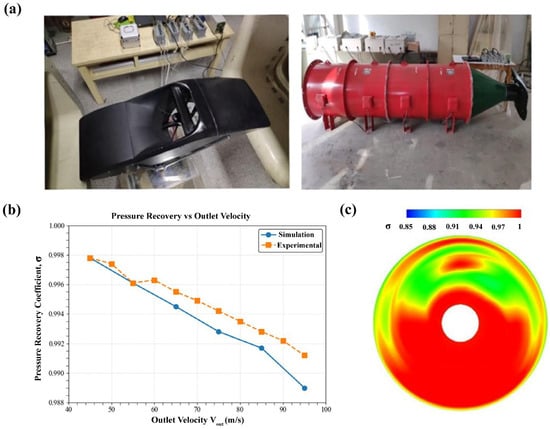
Figure 3.
(a) The experimental model of VTOL nacelle. (b) The variation of with , experiment vs. simulation. (c) The contour plot of intake outlet ().
3.2. Pressure Recovery and Internal Flow Performance
The outlet velocity at the intake () was used to assess the operating conditions of the gas-driven fan, enabling calculation of the velocity ratio ( = /). Figure 3b presents the excellent agreement between the experimentally measured and numerically predicted total-pressure recovery coefficient (). The experimental data confirm that as the deflector was swept from to , σ remained consistently high, between 0.996 and 0.997. At the design deflector setting (), reached approximately 0.997, which is within 0.1% of the CFD prediction. These results demonstrate that the 3D VTOL nacelle model with deflector meets the performance requirements of the gas-driven fan under all tested cruise-condition angles. The contour plot in Figure 3c, derived from the pressure probe measurements at the intake exit plane for a representative condition (= 76.7 m/s), provides a detailed map of the flow uniformity, further validating the internal flow performance.
3.3. External Flow Validation via Surface Flow Visualization
Figure 4 shows streamline from both numerical simulations and experiments at different values and zero angle of attack (AoA = 0°). The tested values ( = 0.670, 0.659, 0.645, 0.631) are compared against the design condition = 0.671. At the design deflector setting (), external surface streamlines remained smooth with no evidence of flow separation as clearly evidenced by the experimental oil-flow visualization. When the deflector angle was set outside the optimal range (e.g., below or above ), localized regions of reversed flow appeared near the cowl lip. The extent of these separation zones grew as the deflector deviated further from , in agreement with numerical predictions. Hence, the deflector is most effective at its design angle. The remarkable similarity between the numerical and experimental streamline patterns in Figure 4 provides strong qualitative validation of the CFD model’s ability to accurately capture the complex external flow physics.
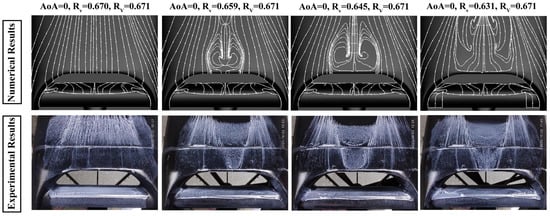
Figure 4.
Pattern of surface streamline.
These experimental measurements validate the fundamental flow characteristics total-pressure recovery and surface streamline patterns predicted by the CFD methodology. This provides confidence in the physical realism of the simulated flow fields upon which the parametric optimization is based. Consequently, the trends in integrated performance metrics (lift, drag, L/D) discussed in Section 4, resulting from variations in key geometric parameters (fan angle, nozzle angle, tail inclination, tip profile), are underpinned by a validated numerical approach. The optimization employs these trend-based aerodynamic relationships from the CFD dataset to identify optimal configurations, rather than relying on absolute force prediction.
4. Results and Discussion
This section presents the outcomes of a multi-faceted optimization study conducted on the proposed VTOL configuration. As introduced earlier, our objectives involve optimizing several geometric and flow-control parameters, each of which can significantly impact the aircraft’s overall aerodynamic performance. To handle the complexity of these design variables and associated constraints, we employed a Genetic Algorithm (GA), which explores the design space systematically by “evolving” candidate solutions based on objective-function evaluations. All aerodynamic forces, coefficients, and lift-to-drag ratios presented in this section are for the isolated nacelle assembly under the specified simulation conditions.
Table 3 shows the parameter values used in each case. In the parametric study, the target independent variable changes, while other independent variables are kept constant.
Table 3.
Parameter Values during Optimization.
4.1. Horizontal Velocity Optimization
Firstly, the effect of varying horizontal inlet velocity () was examined to see how it influences overall drag and lift characteristics. The inlet velocity was swept in increments of 5 m/s from 50 to 70 m/s, with the fan pressure ratio regulated around by the UDF. Figure 5 shows the target variables vs. horizontal velocity.
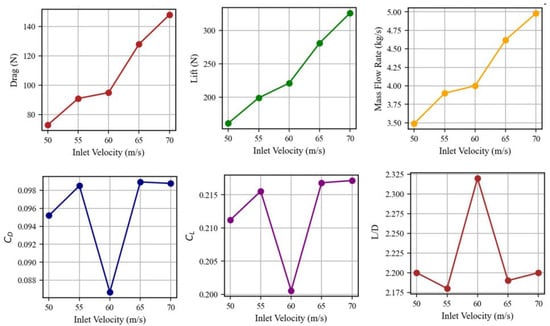
Figure 5.
Target variables vs. inlet velocity.
As the horizontal velocity () increases from 50 to 70 m/s, a significant rise in drag is observed, climbing from 73 to 148. This increase is primarily driven by the growing parasitic drag acting on the airframe and nacelle, as higher speeds intensify skin friction and pressure drag. The flow interactions around these components become more pronounced, further contributing to the overall resistance. At the same time, lift also increases, nearly doubling from 161 to 326. This suggests that the wing and fuselage are experiencing higher dynamic pressure due to the increased velocity. However, the lift coefficient () does not exhibit a proportional rise, indicating that while more lift is being generated, the aerodynamic efficiency in terms of lift production per unit of dynamic pressure does not improve significantly. The mass flow rate through the propulsion fans () shows a more gradual increase, rising from 3.49 to 4.98. This suggests that, while higher forward velocity slightly enhances inlet capture efficiency, the effect is not particularly dramatic, possibly due to flow distortions or suboptimal inlet aerodynamics at these speeds. Despite the changes in lift and drag, the lift-to-drag () ratio remains within a narrow range of 2.18 to 2.32. While both forces grow with speed, their relative magnitudes remain largely unchanged. Interestingly, at around 60 m/s, there is a modest peak in , suggesting a brief window of slightly improved aerodynamic efficiency before drag penalties outweigh any further benefits. From a design perspective, 60 m/s emerges as an optimal operating point where the balance between increasing drag and enhanced lift remains favorable. Beyond this, any further speed increase would come with a sharp rise in drag, leading to higher energy consumption and reduced overall efficiency. If the mission profile demands sustained flight at higher speeds, designers must account for the escalating power requirements and potential thermal management challenges associated with increased drag and propulsion workload. Figure 6 shows the velocity, temperature, and pressure contours and streamlines around the VTOL in the optimized condition.
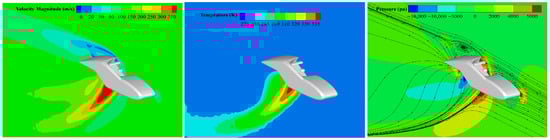
Figure 6.
Flow field characteristics for the optimized VTOL configuration: velocity contour, temperature contour, Pressure contour and Streamlines.
4.2. Nozzle Angle Optimization
As the nozzle angle () varied between 15° and 35°, its impact on aerodynamic performance became evident through detailed CFD simulations. Figure 7 shows the target variables vs. nozzle angle.
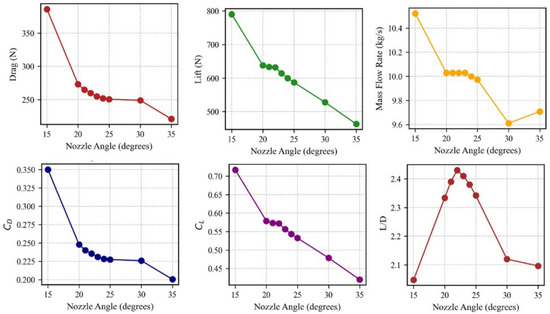
Figure 7.
Target variables vs. nozzle angle.
Between 15° and 22°, there was a noticeable reduction in drag, dropping from approximately 386 N to 260 N. Interestingly, lift remained relatively stable within the range of 600–800 N, leading to an optimal lift-to-drag ratio () of 2.48 at . This suggests that, at moderate deflection angles, the nozzle efficiently redirects flow without excessively penalizing aerodynamic efficiency. As the angle increased beyond 25°, drag continued to decrease slightly, but lift began to decline more noticeably, reaching just 463 N by the time the nozzle angle hit 35°. Consequently, the ratio slipped below 2.2, indicating a trade-off where further reduction in drag no longer compensated for the loss in lift. From a fluid dynamics perspective, this behavior can be attributed to changes in flow separation and pressure distribution around the nozzle. At lower angles, the flow remains relatively attached, promoting efficient thrust vectoring while maintaining favorable aerodynamic characteristics. However, as the deflection increases, stronger flow recirculation zones likely develop, weakening lift generation and increasing pressure losses. The mass flow analysis further reinforced the accuracy of the simulation, with intake and outlet mass flows remaining nearly identical (within 0.01 kg/s), confirming that the dynamic mass-balance User-Defined Function (UDF) was functioning correctly. The non-monotonic variation in lift force between nozzle angles of 15° and 22° (Figure 7) can be attributed to the complex, transitional nature of the exhaust jet interaction with the external flow in this geometric range. As the nozzle deflects, the jet undergoes a significant reorganization, leading to localized separation and reattachment phenomena that manifest as fluctuations in the integrated lift force (±4–6% of the mean value). This behavior is characteristic of jet-dominated flows during geometric changes and underscores the physical realism captured by the simulations. Importantly, this transitional regime does not compromise the identification of the global optimum. The optimization algorithm, executed across three independent runs with different random seeds, consistently identified the 22° configuration as optimal (with variations in less than ±2°), confirming the robustness of this result. Beyond 22°, the flow establishes a stable, attached pattern, yielding the consistent performance improvement discussed. For transitional flight conditions, where both hover stability and forward-flight efficiency are critical, setting provides an effective compromise. At this angle, the balance between thrust redirection and aerodynamic efficiency is optimized, ensuring controlled maneuverability while minimizing unnecessary drag penalties.
4.3. Fan Angle Optimization
To better understand the aerodynamic impact of fan tilt, was adjusted from 0° (aligned with the fuselage centerline) to 30° (tilted upward) and analyzed the resulting forces. Figure 8 shows the target variables vs. fan angle.
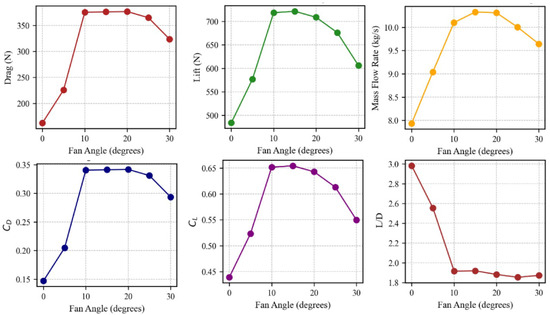
Figure 8.
Target variables vs. fan angle.
Tilting the fan even slightly has a pronounced effect on drag. At just 5°, drag increases by approximately 39%, primarily because a portion of the fan exhaust is redirected downward, disrupting the surrounding flow and generating additional wake structures. As the tilt angle increases beyond 15°, drag remains elevated but eventually decreases slightly at 30°, likely due to a more stabilized wake pattern and reduced interference with the fuselage. Net lift benefits from moderate fan tilting, rising from 483.87 N at 0° to a peak of 721.43 N at 15°. This suggests that directing some thrust upward enhances the overall lift force. However, beyond this point, lift declines to 605.87 N at 30°, likely due to degraded flow distribution and increasing downward flow interference with the airframe. Excessive tilt can also cause unfavorable interactions between the exhaust and ambient flow, reducing the effective lift gain. The best aerodynamic efficiency occurs with the fan fully aligned at 0°, where . As the tilt angle increases, the lift-to-drag ratio steadily drops, reaching a minimum in the 1.85–1.92 range. This decline reflects the growing drag penalty associated with redirecting the fan thrust downward. From an efficiency standpoint, maintaining the fan axis aligned with the fuselage in forward flight () offers the best , making it ideal for cruising conditions. However, if the mission requires additional vertical thrust such as during short takeoff and landing (STOL) operations or steep climbs a small tilt may be justified. The key trade-off is that while tilting improves lift initially, it comes at the cost of significantly increased drag, which reduces overall aerodynamic efficiency. This suggests that fan tilt should be dynamically optimized based on the specific flight phase to balance thrust augmentation with aerodynamic penalties.
4.4. Tail Angle Optimization
As the tail angle () was incrementally adjusted from 0° to 30°, its influence on aerodynamic performance became evident through CFD analysis. Figure 9 shows the target variables vs. tail angle.
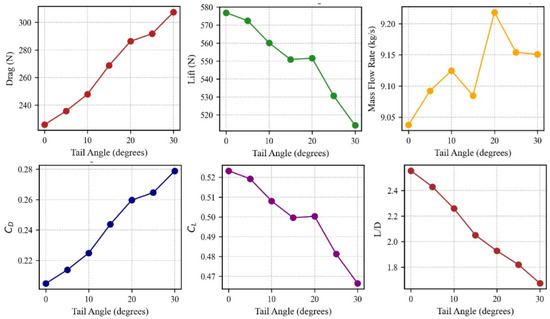
Figure 9.
Target variable vs. tail angle.
A clear trend emerged: as increased, drag steadily rose from 225.78 N at 0° to 307.44 N at 30°. This increase can be attributed to multiple aerodynamic factors. A more deflected tail effectively increases the vehicle’s frontal area, exposing more surface to the incoming airflow and contributing to form drag. Additionally, the tail’s interaction with the surrounding flow—particularly the wake of the nozzle—likely introduces unsteady vortices and pressure distortions, further adding to the overall drag. While drag increased, lift followed a subtle downward trend, decreasing from 576.91 N at 0° to 514.17 N at 30°. This reduction suggests that more aggressive tail deflections disrupt the natural airflow over key lift-generating surfaces. Instead of maintaining smooth flow attachment, a higher tail angle may promote premature flow separation or deflect streamlines away from regions where lift production is most efficient. This phenomenon is especially relevant in transitional flight conditions, where maintaining stable lift is crucial for maneuverability. From a performance standpoint, the highest lift-to-drag ratio () of 2.56 was achieved at . While small positive tail angles may contribute to airframe stability in specific flight regimes, the results suggest a trade-off: any upward deflection introduces a penalty in aerodynamic efficiency. The CFD results highlight the delicate balance between stability and performance, emphasizing that an optimal tail angle depends on the specific mission requirements of the aircraft.
4.5. Tip Profile Optimization
The shape of the fan nacelle tip was carefully controlled by adjusting two key parameters, and , which define its outer contour. By systematically varying these control points across a grid, a range of nacelle tip geometries was explored to assess their aerodynamic impact. Figure 10 shows the target variables versus and , and the (Lift/Drag) contour.
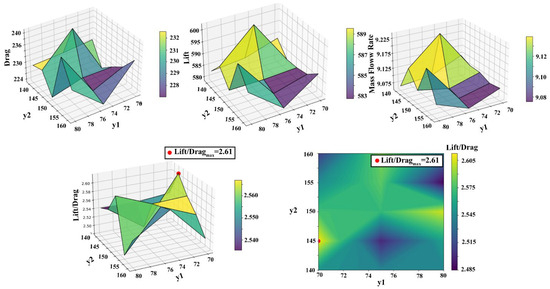
Figure 10.
Target variables ( and
) vs. Drag, Lift, Mass flow rate, and Lift/Drag (The red dot shows the maximum lift to drag ratio).
Among the tested configurations, the highest Lift/Drag () of approximately 2.61 was achieved when and . Interestingly, small deviations from this configuration resulted in slightly lower but still comparable efficiency, suggesting that the aerodynamic performance remains relatively stable in this region. However, pushing beyond 160, while initially refining the nacelle’s upper curvature, introduced additional drag. This is likely due to excessive contouring, which can create undesirable pressure gradients and localized flow separation, leading to a gradual drop in below 2.55 in some cases. Despite these geometric modifications, the mass flow rate through the fan remained largely consistent, fluctuating between 9.05 and 9.24 kg/s across most designs. This stability in mass flow suggests that the primary aerodynamic effects stem from changes in external flow behavior rather than fundamental variations in airflow ingestion. The alterations in drag, therefore, can be attributed to subtle shifts in flow separation and interference patterns around the nacelle tip. These findings highlight the importance of precise nacelle tip shaping, where even minor refinements can yield 1–3% improvements in . While this gain may seem modest in isolation, when combined with other aerodynamic optimizations, it contributes meaningfully to overall VTOL efficiency, enhancing both lift generation and forward-flight performance.
4.6. Sensitivity Analysis
The influence of key independent variables horizontal velocity, fan angle, nozzle angle, tail angle, and tip profile coordinates ( and ) on critical dependent variables, including drag coefficient, lift coefficient, mass flow rate, and lift-to-drag ratio, was explored through sensitivity analysis. A strong positive correlation was observed between horizontal velocity and drag coefficient (, ), indicating that a significant increase in drag is produced as velocity rises. A strong negative correlation was found between fan angle and lift-to-drag ratio (, ), suggesting that the lift-to-drag ratio is reduced as broader angles are adopted. Conversely, a negative correlation was noted between nozzle angle and mass flow rate (, ), implying that flow is diminished as the angle increases. A strong positive correlation was associated between tail angle and drag coefficient (, ), demonstrating that drag is significantly increased with larger tail angles. Minimal influence was exhibited by tip profile coordinates ( and ), with a very weak correlation observed between and lift coefficient (, ). Figure 11 shows the sensitivity analysis of different control parameters on Lift/Drag . These insights, detailed in the plots, highlight the varying effects of the variables on performance metrics.
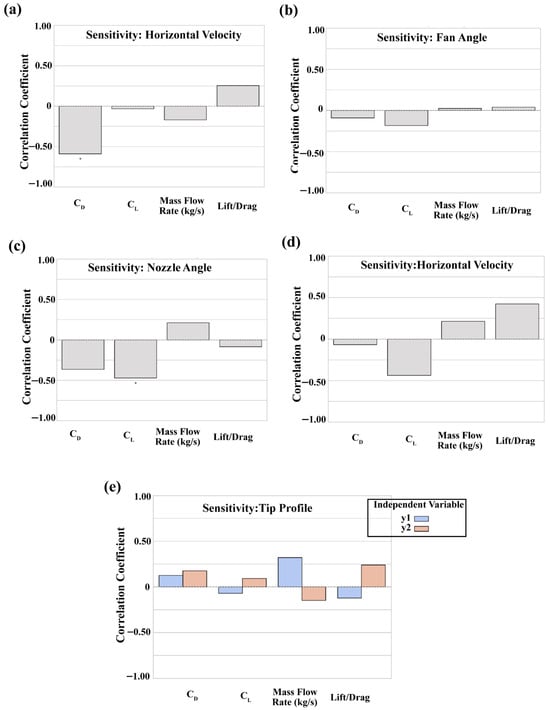
Figure 11.
Sensitivity analysis results: correlations between key design variables (horizontal velocity, fan angle, nozzle angle, tail angle, and tip profile coordinates (
and ), and critical aerodynamic performance metrics. (a) Horizontal velocity, (b) Fan angle, (c) Nozzle angle, (d) Tail angle, and (e) Tip profile.
5. Conclusions
In this paper, we presented an extensive CFD optimization of a gas-powered fan Vertical Takeoff and Landing (VTOL) aircraft, focusing on both control strategies and geometry optimizations. We used a User-Defined Function (UDF) to maintain a specified fan pressure ratio and to enforce mass-flow equivalence between the nozzle exit and fan inlet, ensuring that each simulation provided stable and real-world propulsor performance for an array of flight velocities and configurations.
Through our multi-parameter analysis, we confirmed the strong dependence between key design parameters (horizontal speed, fan angle, nozzle angle, tail angle, and tip shape). For instance, tilting the fan axis or nozzle to improve vertical lift can generate significant drag during forward flight, but adjusting the tail angle or optimizing the tip shape can counter some of these penalties. We specifically discovered the following:
- Near-zero fan angle () gives the maximum possible lift-to-drag ratio (up to 2.98 within our database) for cruise-like conditions.
- Moderate nozzle angles () offer the best compromise between lift generation and drag increase, especially during transition.
- Angles close to 0° minimize drag buildup, but small positive deflections can aid stability with a slight efficiency trade-off.
- Tip geometry at (, ) enhances the lift-to-drag ratio to approximately 2.61, highlighting the influence of subtle shaping on nacelle aerodynamics.
A major factor was sustaining a target fan pressure ratio of 1.11 at each operating point for consistent thrust control and mass flow. This enabled reliable comparisons between design options, yielding aerodynamic efficiency gains of 10–20% compared to less optimized baselines. These improvements are particularly significant for VTOL platforms, where fuel consumption, payload capacity, and range highly depend on propulsion-system performance in both hover and forward-flight regimes.
We tested a 1:1.05-scale VTOL nacelle (fan diameter 0.42 m) in a low-speed wind tunnel at (, turbulence ). Total-pressure probes at the intake exit plane and static taps along the inner cowl wall provided detailed pressure maps, from which we extracted exit Mach number, velocity distributions, and an equivalent flow coefficient under test conditions. Oil-flow visualization on the external cowl surface confirmed smooth, fully attached streamlines with no large separation bubbles precisely as our CFD predicted. By combining quantitative pressure-recovery mapping with qualitative surface-flow images, we validated the accuracy of our simulation methodology and demonstrated that the optimized geometry performs well in realistic VTOL environments.
In conclusion, this work shows that combined geometric optimization coupled with advanced flow-control UDFs can significantly enhance overall VTOL performance. Looking ahead, future research could integrate variable-geometry hardware (e.g., morphing nozzles, actively adjustable tail surfaces) or structural/manufacturing constraints (e.g., weight and material limits) into the genetic algorithm’s fitness function, extending our methodology into a robust multi-objective design optimization framework for next-generation VTOL aircraft. We also note that our study primarily focused on cruise conditions; thus, further validation for hover and transition phases would be valuable. Furthermore, while the wind-tunnel tests provided detailed validation of the internal and external flow fields, direct experimental measurement of the nacelle’s lift and drag forces remains a valuable objective for future experimental campaigns.
Author Contributions
Conceptualization, M.J.P.R. and G.H.; methodology, M.J.P.R. and Y.Z.; software, M.J.P.R. and Y.Z.; validation, Y.Z.; formal analysis, M.J.P.R.; investigation, M.J.P.R.; resources, G.H.; data curation, M.J.P.R.; writing—original draft preparation, M.J.P.R.; writing—review and editing, G.H. and Y.Z.; visualization, M.J.P.R.; supervision, G.H.; project administration, M.J.P.R.; funding acquisition, G.H. All authors have read and agreed to the published version of the manuscript.
Funding
This work was supported by the National Natural Science Foundation of China (No. 52476030, 52206046).
Data Availability Statement
The data that support the findings of this study are available from the corresponding author upon reasonable request.
Acknowledgments
The authors sincerely thank Yasin Masoumi for his substantial contributions during the revision of this manuscript. His expertise in numerical analysis and his critical role in formulating the responses to the reviewers’ comments were instrumental in improving the quality of this work and securing its acceptance.
Conflicts of Interest
The authors declare that they have no known competing financial interests or personal relationships that could have appeared to influence the work reported in this paper.
Nomenclature
| VTOL | Vertical Take-Off and Landing | CFD | Computational Fluid Dynamics |
| GA | Genetic Algorithm | UDF | User-Defined Function |
| L/D | Lift-to-Drag Ratio | RANS | Reynolds-Averaged Navier–Stokes |
| SST | Shear Stress Transport (turbulence model) | ZNMF | Zero Net Mass Flux |
| AFC | Active Flow Control | CFJ | CoFlow Jet |
| UAM | Urban Air Mobility | ADRC | Active Disturbance Rejection Control |
| CAD | Computer-Aided Design | AAref | Reference area [m2] |
| Lift coefficient | Drag coefficient | ||
| Total energy per unit mass [J/kg] | Blending function in the model | ||
| Turbulent kinetic energy [m2/s2] | Lift force [N] | ||
| Drag force [N] | Mass flow rate [kg/s] | ||
| Static pressure [Pa] | Fan inlet/outlet pressures [Pa] | ||
| PR | Fan pressure ratio | Reynolds number | |
| Strain rate magnitude [1/s] | Temperature [K] | ||
| Time [s] | Horizontal velocity [m/s] | ||
| Velocity vector and components [m/s] | Non-dimensional wall distance for turbulence modeling | ||
| Fluid density [kg/m3] | Free-stream density [kg/m3] | ||
| Dynamic viscosity [Pa·s] | Turbulent (eddy) viscosity [Pa·s] | ||
| Viscous stress tensor [Pa] | Specific dissipation rate [1/s] | ||
| Fan tilt angle [°] | Nozzle deflection angle [°] | ||
| Tail inclination angle [°] | Empirical constants for turbulence production/dissipation | ||
| Turbulent Prandtl number for k | Turbulent Prandtl numbers for ω |
Appendix A

Figure A1.
UDF code for maintaining constant fan pressure ratio and mass balance.
Figure A1.
UDF code for maintaining constant fan pressure ratio and mass balance.

References
- Adeyi, T.A.; Alabi, O.O.; Towoju, O.A. Influence of Airfoil Geometry on VTOL UAV Aerodynamics at Low Reynolds Numbers. Arch. Adv. Eng. Sci. 2024, 1–13. [Google Scholar] [CrossRef]
- Wang, J.-G.; Guo, X.-Y. Aerodynamic Analysis and Simulation for a Z-Shaped Folding Wing UAV. Aerospace 2024, 11, 769. [Google Scholar] [CrossRef]
- Rao, J.P.; Chimata, S.N. Machine learning-based surrogates for eVTOL performance prediction and design optimization. Metascience Aerosp. 2024, 1, 246–267. [Google Scholar] [CrossRef]
- Yeh, S.-T.; Du, X. Transfer-Learning-Enhanced Regression Generative Adversarial Networks for Optimal eVTOL Takeoff Trajectory Prediction. Electronics 2024, 13, 1911. [Google Scholar] [CrossRef]
- Cong, K.; Ma, D.; Zhang, L.; Xia, X.; Yao, Y. Design and analysis of passive variable-pitch propeller for VTOL UAVs. Aerosp. Sci. Technol. 2023, 132, 108063. [Google Scholar] [CrossRef]
- Prieto, M.; Escarti-Guillem, M.S.; Hoyas, S. Aerodynamic optimization of a VTOL drone using winglets. Results Eng. 2023, 17, 100855. [Google Scholar] [CrossRef]
- Qiao, N.; Ma, T.; Fu, J.; Zhang, L.; Wang, X.; Xue, P. Rapid blade shape optimization for contra-rotating propellers for eVTOL aircraft considering the aerodynamic interference. Aerospace 2023, 10, 54. [Google Scholar] [CrossRef]
- Yeh, S.-T.; Yan, G.; Du, X. Inverse machine learning prediction for optimal tilt-wing eVTOL takeoff trajectory. In Proceedings of the AIAA AVIATION 2023 Forum, San Diego, CA, USA, 12–16 June 2023; American Institute of Aeronautics and Astronautics, Inc.: Reston, VA, USA, 2023; p. 3593. [Google Scholar]
- Liu, L.; Wang, T.; Gao, Z.; Zeng, L.; Shao, X. Deep learning based adaptive deformation of aerodynamic shape for ducted propellers. Aerosp. Sci. Technol. 2023, 142, 108607. [Google Scholar] [CrossRef]
- Xia, X.; Ma, D.; Zhang, L.; Liu, X.A.; Cong, K. Blade shape optimization and analysis of a propeller for VTOL based on an inverse method. Appl. Sci. 2022, 12, 3694. [Google Scholar] [CrossRef]
- Nugroho, G.; Hutagaol, Y.D.; Zuliardiansyah, G. Aerodynamic performance analysis of VTOL arm configurations of a VTOL plane UAV using a computational fluid dynamics simulation. Drones 2022, 6, 392. [Google Scholar] [CrossRef]
- Pollet, F.; Delbecq, S.; Budinger, M.; Moschetta, J.-M.; Liscouët, J. A common framework for the design optimization of fixed-wing, multicopter and VTOL UAV configurations. In Proceedings of the 33rd Congress of the International Council of the Aeronautical Sciences, Stockholm, Sweden, 4–9 September 2022. [Google Scholar]
- Zhu, Y.; Huang, G.; Xia, C.; Wu, Y. Aerodynamic design of fixed-wing VTOL aircraft powered by gas-driven fan propulsion system. Aerosp. Sci. Technol. 2025, 162, 110165. [Google Scholar] [CrossRef]
- Alves, B.; Marta, A.; Félix, L. Multidisciplinary optimisation of an eVTOL UAV with a hydrogen fuel cell. In Proceedings of the 2022 International Conference on Unmanned Aircraft Systems (ICUAS), Dubrovnik, Croatia, 21–24 June 2022; IEEE: New York, NY, USA, 2022; pp. 134–143. [Google Scholar]
- Nugroho, G.; Zuliardiansyah, G.; Rasyiddin, A.A. Performance Analysis of Empennage Configurations on a Surveillance and Monitoring Mission of a VTOL-Plane UAV Using a Computational Fluid Dynamics Simulation. Aerospace 2022, 9, 208. [Google Scholar] [CrossRef]
- Ma, T.; Wang, X.; Qiao, N.; Zhang, Z.; Fu, J.; Bao, M. A conceptual design and optimization approach for distributed electric propulsion eVTOL aircraft based on ducted-fan wing unit. Aerospace 2022, 9, 690. [Google Scholar] [CrossRef]
- Sethi, N.; Ahlawat, S. Low-fidelity design optimization and development of a VTOL swarm UAV with an open-source framework. Array 2022, 14, 100183. [Google Scholar] [CrossRef]
- Zanjani, A.; Tahsini, A.M.; Sadafi, K.; Ghavidel Mangodeh, F. Shape optimization and flow analysis of supersonic nozzles using deep learning. Int. J. Comput. Fluid Dyn. 2022, 36, 875–891. [Google Scholar] [CrossRef]
- Li, J.; Zhang, M.; Tay, C.M.J.; Liu, N.; Cui, Y.; Chew, S.C.; Khoo, B.C. Low-Reynolds-number airfoil design optimization using deep-learning-based tailored airfoil modes. Aerosp. Sci. Technol. 2022, 121, 107309. [Google Scholar] [CrossRef]
- Kapsalis, S.; Panagiotou, P.; Yakinthos, K. CFD-aided optimization of a tactical Blended-Wing-Body UAV platform using the Taguchi method. Aerosp. Sci. Technol. 2021, 108, 106395. [Google Scholar] [CrossRef]
- Tugnoli, M.; Montagnani, D.; Syal, M.; Droandi, G.; Zanotti, A. Mid-fidelity approach to aerodynamic simulations of unconventional VTOL aircraft configurations. Aerosp. Sci. Technol. 2021, 115, 106804. [Google Scholar] [CrossRef]
- Şumnu, A.; Güzelbey, I. CFD simulations and external shape optimization of missile with wing and tailfin configuration to improve aerodynamic performance. J. Appl. Fluid Mech. 2021, 14, 1795–1807. [Google Scholar] [CrossRef]
- Ueno, M.; Toriida, H.; Ueno, Y.; Tsuge, H.; Ito, Y. CFD-Based Assessment of Aerodynamic Design for the “PUPA™ Heavy” eVTOL/Ground Dual-Use Cargo Pod. In Proceedings of the AIAA Scitech 2021 Forum, Virtual, 11–15 & 19–21 January 2021; American Institute of Aeronautics and Astronautics, Inc.: Reston, VA, USA, 2021; p. 1513. [Google Scholar]
- Chauhan, S.S.; Martins, J.R. Tilt-wing eVTOL takeoff trajectory optimization. J. Aircr. 2020, 57, 93–112. [Google Scholar] [CrossRef]
- Sridharan, A.; Govindarajan, B. Evaluation of sizing strategies for eVTOL UAV configurations. In Proceedings of the 76th Annual Forum of the Vertical Flight Society, Virtual, 5–8 October 2020. [Google Scholar]
- Thiele, M.; Staudenmaier, A.; Madabhushi Venkata, S.; Hornung, M. Development of a reinforcement learning inspired monte carlo tree search design optimization algorithm for fixed-wing vtol uav propellers. In Proceedings of the AIAA Scitech 2020 Forum, Orlando, FL, USA, 6–10 January 2020; American Institute of Aeronautics and Astronautics, Inc.: Reston, VA, USA, 2020; p. 1639. [Google Scholar]
- Zhou, Y.; Huang, G.; Li, L. Numerical investigation of a VTOL power unit based on gas-driven fan. In Proceedings of the 2019 IEEE 10th International Conference on Mechanical and Aerospace Engineering (ICMAE), Brussels, Belgium, 22–25 July 2019; IEEE: New York, NY, USA, 2019; pp. 397–403. [Google Scholar]
- Truong, H.D.; Marouf, A.; Chouippe, A.; Hoarau, Y.; Charbonnier, D.; Gehri, A.; Vos, J.B. Flow analysis around a VTOL aircraft near stall conditions and application of Active Flow Control to enhance the aerodynamic performances at real flight conditions. In Proceedings of the AIAA AVIATION 2022 Forum, Chicago, IL, USA, 27 June–1 July 2022; American Institute of Aeronautics and Astronautics, Inc.: Reston, VA, USA, 2022; p. 3238. [Google Scholar]
- Healy, R.; Misiorowski, M.; Gandhi, F. A CFD-based examination of rotor-rotor separation effects on interactional aerodynamics for eVTOL aircraft. J. Am. Helicopter Soc. 2022, 67, 1–12. [Google Scholar] [CrossRef]
- Boling, J.S.; Zha, G.; Zeune, C. A high-speed, high-efficiency VTOL concept using coflow jet Airfoil. In Proceedings of the AIAA Aviation 2020 Forum, Virtual, 15–19 June 2020; American Institute of Aeronautics and Astronautics, Inc.: Reston, VA, USA, 2020; p. 2792. [Google Scholar]
- Zha, G.; Ren, Y.; Fredericks, W.; Whiteside, S. Design and Testing of Deflected Slipstream Airfoil for VTOL Hover Enabled by CoFlow Jet. In Proceedings of the AIAA Aviation Forum and Ascend 2024, Las Vegas, NV, USA, 29 July–2 August 2024; American Institute of Aeronautics and Astronautics, Inc.: Reston, VA, USA, 2024; p. 4420. [Google Scholar]
- Qian, Y.; Luo, Y.; Hu, X.; Zeng, Z.; Zhang, Y. Improving the performance of ducted fans for VTOL applications: A review. Sci. China Technol. Sci. 2022, 65, 2521–2541. [Google Scholar] [CrossRef]
- Wang, J.; Chen, R.; Lu, J. Experimental and numerical studies on the effect of airflow separation suppression on aerodynamic performance of a ducted coaxial propeller in hovering. Aerospace 2022, 10, 11. [Google Scholar] [CrossRef]
- Song, K.; Yeo, H. Development of optimal scheduling strategy and approach control model of multicopter VTOL aircraft for urban air mobility (UAM) operation. Transp. Res. Part C Emerg. Technol. 2021, 128, 103181. [Google Scholar] [CrossRef]
- Bliamis, C.; Zacharakis, I.; Kaparos, P.; Yakinthos, K. Aerodynamic and stability analysis of a VTOL flying wing UAV. IOP Conf. Ser. Mater. Sci. Eng. 2021, 1024, 012039. [Google Scholar] [CrossRef]
- Bhandari, R.; Mishra, A.A.; Chakraborty, I. Genetic algorithm optimization of lift-plus-cruise VTOL aircraft with electrified propulsion. In Proceedings of the AIAA SciTech 2023 Forum, National Harbor, MD, USA, 23–27 January 2023; American Institute of Aeronautics and Astronautics, Inc.: Reston, VA, USA, 2023; p. 0398. [Google Scholar]
- Milić, M.; Svorcan, J.; Ivanov, T.; Atanasovska, I.; Momčilović, D.; Flajs, Ž.; Rašuo, B. Structural Optimization and Experimental Validation of a Composite Engine Mount Designed for VTOL UAV. Aerospace 2025, 12, 178. [Google Scholar] [CrossRef]
- Hildemann, M.; Verstegen, J.A. 3D-flight route optimization for air-taxis in urban areas with Evolutionary Algorithms and GIS. J. Air Transp. Manag. 2023, 107, 102356. [Google Scholar] [CrossRef]
- Comer, A.M.; Chakraborty, I.; Putra, S.H.; Bhandari, R.; Kunwar, B.; Davis, B. Design, Optimization, and Flight Testing of a Trajectory Control System for Lift-Plus-Cruise VTOL Aircraft. In Proceedings of the AIAA Aviation Forum and Ascend 2024, Las Vegas, NV, USA, 29 July–2 August 2024; American Institute of Aeronautics and Astronautics, Inc.: Reston, VA, USA, 2024; p. 4563. [Google Scholar]
- Li, Y.; Liu, M. Path planning of electric VTOL UAV considering minimum energy consumption in urban areas. Sustainability 2022, 14, 13421. [Google Scholar] [CrossRef]
- Hangxuan, H.; Haibin, D. A multi-strategy pigeon-inspired optimization approach to active disturbance rejection control parameters tuning for vertical take-off and landing fixed-wing UAV. Chin. J. Aeronaut. 2022, 35, 19–30. [Google Scholar]
- Pour Razzaghi, M.J.; Masoumi, Y.; Rezaei Sani, S.M.; Huang, G. Controlling flow separation over a curved ramp using vortex generator microjets. Phys. Fluids 2022, 34, 115114. [Google Scholar] [CrossRef]
- Pour Razzaghi, M.J.; Xu, C.; Liu, Y.; Masoumi, Y. The effects of minute vortex generator jet in a turbulent boundary layer with adverse pressure gradient. Sci. Prog. 2021, 104, 00368504211023294. [Google Scholar] [CrossRef] [PubMed]
- Pour Razaghi, M.J.; Rezaei Sani, S.M.; Masoumi, Y.; Huang, G.; Li, H. Comparison and modification of turbulence models for active flow separation control over a flat surface. Phys. Fluids 2023, 35, 065125. [Google Scholar] [CrossRef]
- Masumi, Y.; Nikseresht, A.H. Drag Optimization of a planing vessel based on the stability criteria limits. China Ocean Eng. 2019, 33, 365–372. [Google Scholar] [CrossRef]
- Pour Razzaghi, M.J.; Rezaei Sani, S.M.; Musa, O.; Masoumi, Y.; Huang, G. Hybrid suction/blowing actuator to control flow separation on the ramp and energy cost analysis. Phys. Fluids 2023, 35, 125103. [Google Scholar] [CrossRef]
- Zanjani, A.; Tahsini, A.M. Transient thrust behavior of low-aspect-ratio rocket propulsion systems. Propellants Explos. Pyrotech. 2023, 48, e202300101. [Google Scholar] [CrossRef]
- Liu, J.; Guo, W.; Zhao, G.; Ma, J.; Xi, W.; Sunden, B. Study on Heat Transfer Characteristics of Supercritical CO2/n-decane Composite Double Triangular Regenerative Cooling for Scramjets. Aerosp. Sci. Technol. 2026, 172, 111725. [Google Scholar] [CrossRef]
- ANSYS, Inc. ANSYS Fluent User’s Guide; Release 18.2; ANSYS, Inc.: Canonsburg, PA, USA, 2017. [Google Scholar]
- Wang, H.; Zhai, Q.; Zhang, J. Numerical study of flow-induced vibration of a flexible plate behind a circular cylinder. Ocean Eng. 2018, 163, 419–430. [Google Scholar] [CrossRef]


Disclaimer/Publisher’s Note: The statements, opinions and data contained in all publications are solely those of the individual author(s) and contributor(s) and not of MDPI and/or the editor(s). MDPI and/or the editor(s) disclaim responsibility for any injury to people or property resulting from any ideas, methods, instructions or products referred to in the content. |
© 2026 by the authors. Licensee MDPI, Basel, Switzerland. This article is an open access article distributed under the terms and conditions of the Creative Commons Attribution (CC BY) license.