Abstract
Detailed knowledge regarding the thermophysical properties and electrical conductivity of the combustion products derived from solid propellants is essential for the optimized design and operation of solid-fuel rocket engines employing magnetohydrodynamic drive technology. However, the high-temperature and high-pressure environment prevailing during rocket operation makes the experimental measurement of these characteristics extremely difficult, while the ionization reactions obtained by adding ionization seeds containing cesium to solid propellants for increasing the electrical conductivity of gaseous combustion products makes the theoretical calculation of these characteristics extremely problematic as well. The present work addresses these issues by constructing a minimum Gibbs free energy constraint function in conjunction with the Debye–Hückel correction under the condition of ionization to calculate the equilibrium components of combustion products. The obtained equilibrium components are then applied in conjunction with Lennard–Jones potential energy theory and the Champan–Enskog framework to approximately calculate the specific heat, viscosity coefficient, and thermal conductivity of propellant gases over a wide range of temperatures and pressures. The Kantrowitz model is proposed to solve the electrical conductivity of combustion products. Finally, the accuracy of the numerical calculations is validated through the Langmuir probe experiment. The discrepancy between calculated and measured electron density decreases with increasing temperature and remains within 5% when the combustion product temperature exceeds approximately 1800 K. The validity of the proposed framework is demonstrated by examining the effects of temperature, pressure, and ionization seed content on the thermophysical properties and electrical conductivity of the combustion products derived from tri-base solid propellant with cesium atoms employed as ionization seeds.
1. Introduction
Detailed knowledge regarding the thermophysical properties of solid-propellant combustion products, such as specific heat, viscosity coefficient, and thermal conductivity, is a prerequisite for evaluating the propulsion performance of solid-fuel rocket engines, and these properties have important applications in engine design and optimized propellant formulation [1,2]. Moreover, engines employing magnetohydrodynamic (MHD) drive technology involve electrically conductive combustion products for which the accurate acquisition of electrical conductivity is essential. However, the high-temperature and high-pressure environment prevailing during rocket operation makes the experimental measurement of these characteristics of combustion products extremely difficult. In addition, these efforts are further complicated by the technology of increasing the electrical conductivity of gaseous combustion products via the ionization reactions obtained by adding ionization seeds containing cesium to solid propellants, which has been widely used in MHD power generation [3], performance optimization of pulse detonation engines [4], and magnetically controlled thermal protection of reentry vehicles [5]. These complications make theoretical and numerical computations important means of obtaining the above characteristic parameters.
The theoretical calculation of thermophysical properties for solid-propellant combustion products is generally conducted based on the solutions to the equilibrium product fractions in the solid-propellant combustion products. Therefore, the accuracy of the obtained combustion product component solutions is of particular importance for calculating reliable thermophysical properties. The main methods currently employed for solving the equilibrium components of chemical reactions mainly include the chemical equilibrium constant method [6], the Brinkley method [7], and the minimum Gibbs free energy method [8]. Among these methods, the minimum Gibbs free energy method does not require the construction of complex chemical reaction equations and does not involve the selection of chemical reaction equilibrium constants. Therefore, this method is more user-friendly and offers improved accuracy compared with the other two methods. However, the electrically conductive combustion products produced in conjunction with ionization reactions also contain ionized electrons and ions in addition to neutral particles. Accordingly, the need to consider the ionization process of the gas in the equilibrium component solution leads to a more complicated construction and solution process for the minimum Gibbs free energy function.
Once the equilibrium components of solid-propellant combustion products have been determined, a variety of theoretical approaches have been applied for evaluating their corresponding thermophysical properties. For example, Xu and Yuan [9] calculated the specific heat, specific enthalpy, and other thermodynamic parameters of coal combustion products using gas mixing theory based on equilibrium components obtained using the chemical equilibrium constant method. Glascock et al. [10] calculated the specific enthalpy, specific heat, and other thermodynamic parameters for the combustion products of an electric solid propellant using thermodynamic methods in conjunction with combustion product fractions calculated at atmospheric pressure based on the minimum Gibbs free energy method. Kayadelen [11] developed a multi-featured combustion model considering equilibrium constants, and solved the model using the Newton-Raphson iterative method to obtain the fuel combustion product fractions and corresponding thermodynamic parameters with respect to temperature, pressure, and equivalence ratio.
The theoretical methods developed for calculating the electrical conductivity and other electrophysical parameters, such as electron mobility, of a thermally ionized plasma include the direct solution of the Boltzmann equation method, the semi-empirical model method, and the Boltzmann equation approximation method. Considering the direct solution of the Boltzmann equation and semi-empirical model methods, we note that the direct solution of the Boltzmann equation is the more precise of the three methods, although this approach is less computationally efficient, and typically requires a computation time that is 5 to 8 orders of magnitude greater than that of the semi-empirical model method [12]. As a result, this method is mainly used for air plasma or arc plasma under low pressure conditions, and is accordingly ill-suited to the severe operating environment prevailing during rocket operation. The semi-empirical model method usually obtains semi-empirical formulas for the electrical conductivity of a thermal plasma with respect to temperature, pressure, and other parameters by fitting to the results of experimental measurements or theoretical calculations. These semi-empirical formulas of the electrical conductivity make use of a wide range of models. For example, the Otsu model fits the electrical conductivity as a power function of temperature [13]. The Raizer model fits the electrical conductivity as an exponential function of temperature [14]. The Spitzer-Harm model fits the electrical conductivity as a function of the gas temperature and electron density under the assumption that the ions in the plasma are stationary and do not collide with each other, while ignoring the collisions between electrons [15]. The Chapman-Cowling model considers the collision cross-section between particles based on the Boltzmann distribution and the binary diffusion model, and is generally used to describe weakly ionized gases. For example, Fu et al. [16] applied the Chapman-Cowling model in conjunction with the Saha equation to calculate the electrical conductivity of a helium plasma in the high temperature range of 104–105 K.
Although the Spitzer-Harm and Chapman-Cowling models consider the electron density in the plasma, they ignore changes in the pressure. Therefore, these models are generally not applicable to the extremely high-pressure environment prevailing during rocket operation. These issues have been addressed by the Kantrowitz model, which takes the equilibrium components of the combustion products as the basis of calculation, and considers collisions between electrons and neutral particles and between electrons and ions based on migration collision theory [17]. For example, Bedick et al. [18] applied the Kantrowitz model to calculate the electrical conductivity of the combustion products of an oxygen fuel containing potassium carbonate ionization seeds. On the other hand, the accuracy of the Kantrowitz model is also quite limited by its requirement for accurate collision cross-section data between the different plasma components, which is difficult to obtain, particularly after adding ionization seeds to the propellant because this introduces alkali metal atoms and their compounds in the combustion products in addition to conventional components composed of C, H, O, N, and other elements. As can be seen, while the semi-empirical model method is computationally efficient, no single semi-empirical model is applicable to all possible application scenarios. Hence, model selection is challenging aspect of the method because models can provide inaccurate results. For example, Bisek et al. [19,20] applied the Raizer, Chapman-Cowling, and 2nd order polynomial response surface (PRS) models for evaluating the thermal protection performance of the leading edge of hypersonic vehicles, and found that the conductivities calculated from different empirical formulations differed by more than an order of magnitude.
In contrast to the direct Boltzmann equation solution method and the semi-empirical modeling method, the Boltzmann equation approximation method generally approximates the solution of the multi-integral differential Boltzmann equation using Chapman-Enskog theory to expand the velocity distribution function into a finite degree of the Sonine polynomials, and ultimately obtain the electrical conductivity via the charge transport parameters of the plasma [21]. For example, Askari et al. [22] applied the Boltzmann equation approximation method to calculate the electrical conductivity of hydrogen/air and methane/air thermal ionization plasmas. This method was also applied to evaluate the electrical conductivity of various local thermodynamic equilibrium plasmas over wide temperature and pressure ranges, such as for plasmas in the Martian atmosphere [23], air plasma containing silicon compounds [24], and air plasma at atmospheric pressure [25]. Similarly, Bruno et al. [26,27] applied the Boltzmann equation approximation method to calculate the electrical conductivity of air and argon plasmas under the influence of a magnetic field. Schulz et al. [28] applied this method to calculate the electrical conductivity of the detonation products of an H2/O2/N2 mixture containing potassium salts. These results demonstrated that even the addition of 1.25 mol% potassium salt was capable of increasing the electrical conductivity of the combustion products by five orders of magnitude at a detonation temperature of around 3000 K.
The above discussion provides a detailed description of the solution process for the combustion composition and electrical conductivity of propellants containing ionization seeds, where the accuracy of electron density directly determines the precision of the conductivity calculation [29]. The accuracy of the numerical results can be further verified by comparing the experimentally measured electron density of the conductive combustion gas fluid with the calculated results. Currently, testing methods for plasma electron density generated by combustion mainly include contact diagnostic methods [30] and non-contact diagnostic methods [31]. Among these, non-contact diagnostic methods primarily involve emission spectroscopy, which offers high spatial resolution, but the absolute sensitivity calibration of the spectrometer and signal transmission can lead to systematic errors. Contact diagnostic methods mainly refer to the Langmuir probe method. This approach is simple to operate, highly mature, and well-suited for both normal and high-pressure environments, making it the most commonly used method for diagnosing plasma temperature and electron density.
The present work addresses the above-discussed limitations in current efforts to calculate the thermophysical properties and electrical conductivity for the combustion products of a solid propellant with ionization seeds. Firstly, the minimum Gibbs free energy method is employed for solving the equilibrium components of chemical reactions, where the need to consider the ionization process of the gas in the equilibrium component solution is addressed by constructing a minimum Gibbs free energy constraint function that applies the Debye-Hückel correction, and the exterior point penalty function method is finally applied to solve the equilibrium components of the combustion products. Furthermore, Lennard-Jones potential energy theory and the Champan-Enskog approximation framework are applied to calculate the parameters of combustion products, such as constant pressure specific heat, viscosity coefficient, and thermal conductivity, over a wide temperature range of 400–4000 K and pressures of 0.1–500 MPa. The Kantrowitz model is applied to calculate the electrical conductivity of combustion products in conjunction with improved momentum transfer cross-section data between particles. Finally, the accuracy of the numerical calculations is validated through the Langmuir probe experiment. The proposed framework is evaluated for solid propellant using cesium atoms as ionization seeds by examining the effects of temperature, pressure, and ionization seed content on the thermophysical properties and electrical conductivity of the combustion products.
The innovation of this study is primarily reflected in the following three aspects. First, for the combustion products of cesium-seeded solid propellants, a comprehensive computational framework integrating Gibbs free energy minimization, Chapman–Enskog transport theory, and the Kantrowitz conductivity model has been established. Second, the Kantrowitz model was extended by incorporating newly compiled and fitted electron–neutral momentum-transfer cross-section data covering a broad temperature range of 400–4000 K. Last, the predicted electron density was systematically validated using Langmuir probe experiments, providing experimental support for the study of material properties in cesium-containing propellant combustion products.
The remainder of this paper is arranged as follows. Section 2 presents the method applied for calculating the equilibrium components of the combustion products of propellants containing ionization seeds. Section 3 presents the method applied for solving for the thermal and electrical conductivity characteristics of combustion products. The validity of the proposed framework is demonstrated in Section 4 by its application to a solid propellant as an example. the accuracy of the numerical calculations is validated through experiments In Section 5. Finally, the paper is concluded in Section 6.
2. Solving the Equilibrium Components of Propellant Combustion Products
This study employs a tri-base propellant with the chemical formula C22.4859H28.7758O35.5363N9.4866. To enhance the electrical conductivity of the combustion products, a small amount of cesium salt ionization seed with a lower ionization potential (3.89 eV) is added to the propellant, as it ionizes more readily at high temperatures. The additive is incorporated at mass fractions ranging from 0% to 20%. Initially, the equilibrium combustion composition, including electron density, is calculated. Considering the Debye-Hückel correction under ionization conditions, the minimum Gibbs free energy constraint function is constructed as follows [32]:
Here, G is the Gibbs free energy of the reaction system, R0 is the ideal gas constant, T is the combustion reaction temperature, Lκ is the number of species of condensed phase components in the combustion products, where components j = Lκ+1 to Nκ represent the gas phase components. In addition, is the chemical potential of the condensed phase components in the combustion products and nj is the number of moles of component j in 1 kg of reactant, while is the chemical potential of 1 mol of component j at 1 standard atmospheric pressure and Φ represents the parameter value at 1 standard atmospheric pressure. Meanwhile, P is the total pressure of the reaction system, ng is the total number of moles of the gas phase components, e is the electron charge, Zj is the number of elementary charges on component j, ε0 is the dielectric constant in a vacuum, kB is the Boltzmann constant, and λD is the Debye radius when only the electron contribution is included. Among these, λD is calculated as follows:
where Ne is the electron density (m−3) in the equilibrium product. In the above, the standard chemical potentials and of the product components at different temperatures are key parameters for solving the Gibbs free energy constraint equation. The chemical potentials of pure substances at 1 atm are fitted as a univariate linear function with temperature as the independent variable. Specific data can be referenced from the NIST database [33].
The problem of solving for the equilibrium components of the combustion products is transformed into a constrained optimization problem of solving for the extreme value of the function by supplementing the Dalton’s law of partial pressures, the equation of conservation of mass, and the equation of quasi-neutrality of charge. The improved exterior point penalty function method is used to complete the transformation and obtain a solution to the constraint equation [34]. According to the function and constraints, the exterior point method is constructed as
where , , and respectively stand for Dalton’s law of partial pressures, the law of conservation of mass, and the quasi-neutrality equation for charge.
The actual feasible domain of the constraint is contracted inward while considering the actual range of values of the equilibrium components. As a result, . Accordingly, is required, and the augmented objective function is constructed with a function f(n) and a penalty factor as follows:
where is defined as
When is a feasible solution, h1 = σ(l) = 0. Therefore, , and the objective function is not subject to additional penalties. In contrast, σ(l) increases as the infeasibility of as a solution increases. As a result, .
In the exterior point penalty function method, the initial penalty factor r(0) was set to 0.01 and increased geometrically in each outer iteration, i.e., r(k+1) = 10·r(k). The inner iterations of the conjugate gradient method used a line search strategy that satisfies the Wolfe conditions. The convergence criteria required that the change in the augmented objective function L (n, r(k)) between successive iterations be less than 10−6, and the maximum relative change in all species mole fractions nj also be less than 10−6. To verify the algorithm’s robustness with respect to the initial guess, ten different chemically plausible initial mole number vectors were tested. All calculations independently converged to the same equilibrium composition, with relative differences in the final mole numbers of all species being less than 10−5, demonstrating the stability and reliability of the numerical solution process.
The proposed process of calculating the equilibrium components of propellant combustion products by the minimum Gibbs free energy method is illustrated in Figure 1.
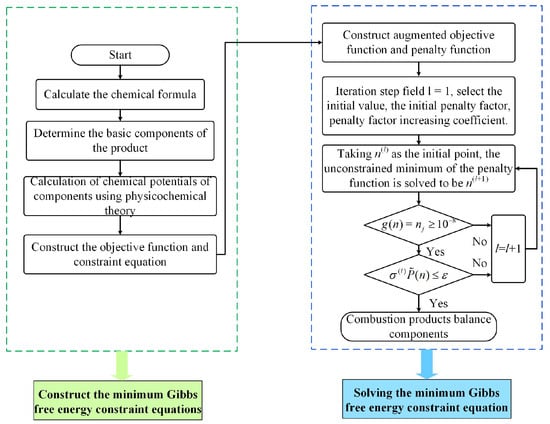
Figure 1.
Proposed process for calculating the equilibrium components of propellant combustion products.
The standard conjugate gradient method is applied herein to solve the unconstrained minimum of the penalty function. This method requires only first derivative information, which greatly reduces memory requirements when solving large-scale nonlinear equations in contrast to the high memory needs of the Newton-Raphson method for inverting the Hessian matrix. Using this method, the equilibrium composition of CO2, CO, H2O, H2, N2, OH, CH4, H, Cs2O, Cs, CsO, Cs+, and e− under varying ionization seed contents, temperatures, and pressures can be ultimately calculated, thereby providing data support for determining thermophysical properties and electrical conductivity.
The chemical equilibrium system considered in this study includes 13 key species: CO2, CO, H2O, H2, N2, OH, CH4, H (gas-phase neutrals), Cs2O, Cs, CsO (cesium-containing neutrals and oxides), Cs+ (ion), and e− (electron). This set was chosen based on prior research on cesium-containing propellant combustion systems, aiming to capture the primary thermodynamic and transport processes. Gibbs free energy minimization was repeated over the same initial conditions and temperature–pressure range (400–4000 K, 0.1–100 MPa) with an extended candidate list that included potential species such as Cs2+, O−, OH−, and CsOH. The results indicate that, within the core operating range (T > 1500 K), adding these species changes the calculated total electron density Ne by less than 2%.
3. Solving the Thermophysical Properties and Electrical Conductivity of Combustion Products
3.1. Calculating the Specific Heat at Constant Pressure
According to physicochemical theory, the specific heat Cp of a mixed product at constant pressure can be expressed as [35]:
where hg is the specific enthalpy of combustion products, which is calculated as follows:
Here, Wj is the molar fraction, Mj is the molecular weight, and Hj is the molar enthalpy of component j, which can be obtained from the NIST database [36]. Setting in Equations (6) and (7) yields the following.
3.2. Calculating the Viscosity Coefficient
Enskog and Champan applied Lennard-Jones potential energy theory to derive the following formula for calculating the viscosity coefficient μj of gas molecule j from the Maxwell distribution function of the thermal motion of gas molecules [37]:
where mj is the molar mass, which is numerically equal to the molecular weight of the gas, σj is the collision cross section diameter, which can be obtained from the NASA database [38], and Ωμ,j is the calculated collision integral. Here, Ωμ,j can be defined with respect to the gas conversion temperature , which is given as follows:
where εk is the intermolecular characteristic energy. The values of εk/kB for different gas molecules can be obtained by querying the NIST database. Meanwhile, the actual relationship of Ωμ,j with can be fitted as follows [39]:
where A2 = 1.1615, B2 = 0.1487, C2 = 0.5249, D2 = 0.7732, E2 = 2.1618, and F2 = 2.4378. After obtaining the viscosity coefficients of individual gas components according to Equation (9), the viscosity coefficient of a multi-component gas mixture can be calculated as follows:
where ϕij is the viscosity correlation coefficient between gas components i and j, which is given as follows.
3.3. Calculating the Thermal Conductivity
The thermal conductivity λi of a single gas component is defined as follows.
On this basis, the thermal conductivity of a gas mixture can be calculated by
where ψij is the correlation coefficient of thermal conductivity between gas components, which is given as follows.
3.4. Calculating the Electrical Conductivity
The Kantrowitz model applies the following representation of the electrical conductivity for a combustion-type thermal plasma with complex product components:
where σen represents the conductivity generated by collisions between electrons and neutral particles and σei represents the conductivity generated by collisions between electrons and ions. The value of σen can be calculated as
where me is the electron mass, Nn is the number density of neutral particles, and Qi is the average momentum transfer cross-section (m2) between electrons and the neutral particles, which is related to the temperature and the types of components. From a microscopic perspective, all neutral particles can interact with free electrons in the combustion products through momentum transfer, and the probability of interaction increases with increasing particle number density. Therefore, the velocity of electron thermal motion through collision is reduced significantly as the number density and momentum transfer cross-section of neutral particles increases, which thereby affects the conductivity of combustion products. Finally, the value of σei can be calculated as follows [2]:
where Ni is the number density of ions and the parameter Λ is defined as
Comparing Equations (1)–(5) with Equations (18)–(20) indicates that the variables Ne associated with the equilibrium components of combustion products obtained by the minimum Gibbs free energy method represent all of the physical quantities employed in the Kantrowitz model except the momentum transfer cross-section Qi. Therefore, obtaining accurate values of Qi is the key to calculating the electrical conductivity of the combustion products.
In the past few decades, the momentum transfer cross-sections between electrons and different gas molecules have been calculated theoretically based on experimentally measured elastic scattering cross-sections. For example, Bedick et al. [18] established the momentum transfer interface between electrons and various gas molecules, such as CO2, CO, H2O, H2, N2, K and KOH, from a large volume of research data relevant to open-cycle MHD combustion systems, and fitted the cross-section data into a cubic equation with respect to temperature T. However, the temperature range employed in this earlier work was 1500–3500 K, and cannot accommodate the temperature range of 400–4000 K employed in the current study.
The present work addresses this issue by analyzing the momentum transfer cross-sections between the components and electrons based on the equilibrium components of combustion products obtained by the minimum Gibbs free energy method. Therefore, the momentum transfer cross-sections between electrons and neutral CO2, CO, H2O, H2, N2, CH4, H, and OH particles in the temperature range of 400–4000 K were fitting. The fitting form was , and the results are listed in Table 1.

Table 1.
Constant parameters in the momentum transfer cross-section between electrons and different neutral gas particles.
In addition, the original study of Bedick et al. [18] did not consider the momentum transfer cross-sections of cesium atoms and their oxides. However, this is essential in the present work to accommodate the use of cesium atoms for ionization seeds. Nonetheless, the momentum transfer cross-section between electrons and cesium atoms represents a special case, which has been addressed in the literature by fitting to the following sixth-order form [58,59,60]:
where A4 = −1.582 × 10⁻¹⁷, B4 = 3.049 × 10⁻¹³, C4 = −2.115 × 10⁻⁹, D4 = 6.388 × 10⁻⁶, E4 = 7.828 × 10⁻³, F4 = 2.97, G4 = 439.1. Finally, the momentum transfer cross-sections of electrons with CsO and Cs2O are also needed for calculating the electrical conductivity. Nonetheless, relevant reference data is currently unavailable. To this end, we note that the molar mass fractions of CsO and Cs2O differ from those of cesium atoms by 2 to 3 orders of magnitude within the temperature range considered, and the radius of cesium atoms is much larger than that of oxygen atoms. Therefore, we set the momentum transfer cross-sections of electrons with CsO and Cs2O with reference to the cross-section obtained above for electrons and cesium atoms. This simplification was found to have little impact on the electrical conductivity of the mixed product calculated under practical conditions.
3.5. Sensitivity Analysis
To assess the influence of uncertainties in different electron–neutral momentum-transfer cross-section Qi data on the prediction of electrical conductivity σ, a local sensitivity analysis was conducted. The normalized sensitivity coefficient is defined as:
This coefficient characterizes the relative rate of change in σ induced by a unit relative change in Qi. The values for the major neutral components (CO2, H2O, N2, H2, Cs) were calculated under the conditions of T = 1000, 2000, 3000 K; pressure P = 10 MPa; and ionization seed content αCs = 2 mol%. The results indicate that the electrical conductivity is most sensitive to the collision cross-section of the currently dominant neutral species: at 1000 K, H2O is the dominant neutral component, with ≈ −0.7; at 3000 K, Cs atoms become significant contributors, with ≈ −0.6. The negative sign indicates that an increase in Qi leads to a decrease in σ, which is consistent with the physics of the Kantrowitz model. To further quantify the actual error propagation, all major neutral components’ Qi values were simultaneously increased and decreased by 20%, and the resulting changes in σ were observed. At T = 3000 K and P = 10 MPa, a ±20% perturbation in Qi caused an approximate ∓15% change in σ. For CsO and Cs2O, because their mole fractions are 2–3 orders of magnitude lower than that of atomic Cs, even doubling or halving their assumed Qi values has an impact on the total conductivity σ of less than 2% for T < 3500 K, and about 5–8% in the highest temperature region. This result justifies the simplified treatment in Section 3.4 of approximating the e–CsO and e–Cs2O cross-sections as the e–Cs cross-section. Furthermore, regarding the cross-section fits extrapolated to low temperatures (<1500 K), although any fitting errors might have a magnified relative effect on the absolute value of σ in this temperature range where conductivity itself is extremely low, the impact on the order of magnitude of σ and the overall trend assessment is limited.
4. Results of Calculations
4.1. Mass Density of Combustion Products
As discussed above, the proposed framework for calculating the thermophysical properties and electrical conductivities of solid propellant combustion products was evaluated for solid propellant. Based on the calculation results of equilibrium components, the mass density ρ of the combustion products are plotted with respect to temperature and pressure under an ionization seed content of αCs = 2 mol% in Figure 2a, while ρ is plotted with respect to temperature and αCs under a pressure of P = 100 MPa in Figure 2b.
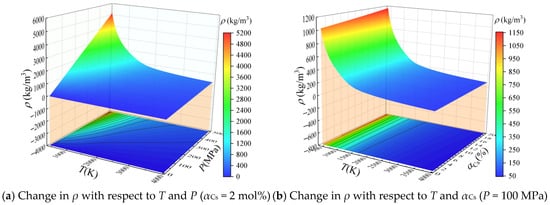
Figure 2.
Calculated mass density ρ of the combustion products of solid propellant containing cesium with respect to temperature (T), pressure (P), and ionization seed content (αCs).
According to the ideal gas equation of state, the value of ρ for the combustion product is proportional to the pressure and inversely proportional to the temperature and the total number of moles of the components in the product. At T = 2000 K, ρ increases from about 0.8 kg/m3 at P = 0.1 MPa to approximately 120 kg/m3 at P = 500 MPa. For all values of αCs considered, both dissociation and ionization reactions are intensified with increasing temperature, and the total number of moles of the individual components in the combustion products increases. Therefore, ρ decreases with increasing temperature. In contrast, the dissociation and ionization reactions are inhibited with increasing pressure, and the total number of moles for components in the combustion products decreases. Accordingly, ρ increases with increasing pressure, as shown in Figure 2a. Meanwhile, the results in Figure 2b indicate that ρ increases with increasing αCs at a given temperature and pressure, which is caused by the relatively large molecular weight of cesium and its oxides. At T = 2000 K, increasing αCs from 0% to 20% raises ρ by about 15%.
4.2. Specific Heat of Combustion Products at Constant Pressure
Based on the calculated equilibrium composition, the specific heat Cp at constant pressure was calculated according to Equation (8), and the values of Cp are plotted with respect to temperature and pressure (αCs = 2 mol%) and with respect to temperature and αCs (P = 100 MPa) in Figure 3a,b, respectively.
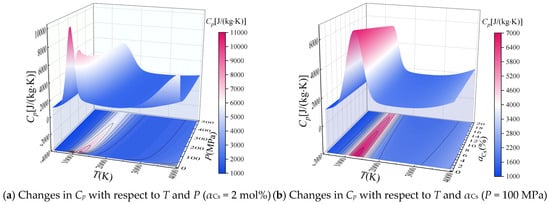
Figure 3.
Calculated specific heat Cp at constant pressure of the combustion products of solid propellant containing cesium with respect to T, P, and αCs.
It can be seen that Cp exhibits a complex variation with respect to temperature at a given pressure, which is related to the dissociation reactions of the combustion products. As shown in Figure 3a, the first characteristic peak of Cp appears when the temperature is about 1000 K, and the temperature corresponding to the peak decreases with increasing pressure. This occurs because the dissociation reaction of CO2 and C in the combustion reaction dominant at this temperature produces carbon monoxide, and the dissociation reaction is inhibited with increasing pressure. Therefore, the reaction temperature corresponding to the characteristic Cp peak increases. In addition, a second characteristic peak in Cp appears at a temperature of about 4000 K when the pressure is less than about 1 MPa. This is related to the dissociation reaction of water vapor to generate H and OH components and the first ionization reaction of cesium atoms. It can be seen from Figure 3b that Cp decreases with increasing αCs at a given temperature and pressure, but αCs appears to have no impact on the temperature of the combustion product corresponding to the characteristic Cp peak. This is because the relative atomic mass of cesium is large, and the increase in αCs reduces the value of mg in Equation (8), which has an increasing effect on Cp.
4.3. Viscosity Coefficient of Combustion Products
Based on the calculated equilibrium composition, the viscosity coefficient μ was calculated according to Equation (12), and the values of μ are plotted with respect to temperature and pressure (αCs = 2 mol%) and with respect to temperature and αCs (P = 100 MPa) in Figure 4a,b, respectively.
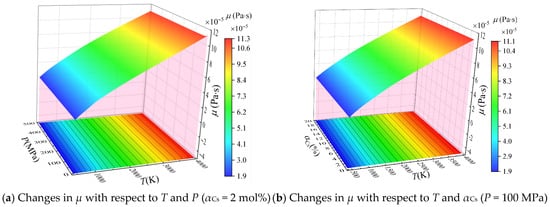
Figure 4.
Calculated viscosity coefficient μ of the combustion products of solid propellant containing cesium with respect to T, P, and αCs.
It can be seen that μ increases with increasing temperature, but it does not vary significantly with respect to pressure and αCs. This follows from an analysis of Equations (9) and (10). According to Equation (10), the single-component collision integral Ωμ,j decreases with increasing temperature. Therefore, the single-component viscosity coefficient calculated from Equation (9) increases with increasing temperature, which in turn increases μ as well. In contrast, the change in the molar fraction of the major particles in the combustion gas is insignificant with increasing pressure and αCs. Accordingly, these parameters also have little effect on the viscosity coefficient of the mixture product calculated by Equation (12).
4.4. Thermal Conductivity of Combustion Products
Based on the calculated equilibrium composition, the thermal conductivity λ was calculated according to Equation (15), and the values of λ are plotted with respect to temperature and pressure (αCs = 2 mol%) and with respect to temperature and αCs (P = 100 MPa) in Figure 5a,b, respectively.
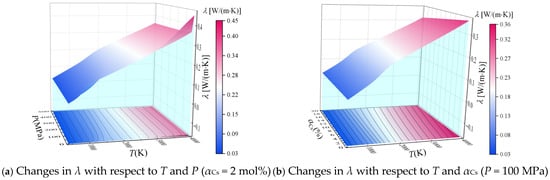
Figure 5.
Calculated thermal conductivity λ of the combustion products of solid propellant containing cesium with respect to T, P, and αCs.
It can be seen that λ increases with increasing temperature. From the point of view of a physical mechanism, the increase in temperature intensifies the thermal motion of the particles and enhances the transfer of thermal energy due to collisions, which is macroscopically manifested in the observed increase in thermal conductivity. As was observed for Cp (Figure 3), λ also exhibits characteristic peaks at temperatures of about 1000 K and 4000 K, which are also related to the dissociation reactions of CO2 and H2O at the corresponding temperatures. In addition, we note from Figure 5a that the effect of pressure on λ is not significant when the pressure is greater than 100 MPa. This is because the degree of ionization of the cesium ionization seeds is not high within the temperature range considered in this paper. Therefore, the value of λ is mainly related to the thermal motion of neutral particles. Accordingly, the effect of pressure on λ is minor because the molar fraction of neutral particles does not change significantly when P > 100 MPa. This also means that αCs has little effect on λ at temperatures less than about 2000 K, as can be seen from Figure 5b. In contrast, λ decreases with increasing αCs when the temperature is greater than 2000 K because the addition of ionization seeds decreases the mass percentage of CO2, CO, H2O, H2, N2 and other combustion components with relatively large thermal conductivity.
4.5. Electrical Conductivity of Combustion Products
Based on the calculated equilibrium composition, the electrical conductivity σ was calculated according to Equation (17), and the values of σ are plotted with respect to temperature and pressure (αCs = 2 mol%), with respect to temperature and αCs (P = 100 MPa), and with respect to pressure and αCs (T = 3000 K) in Figure 6a–c, respectively.
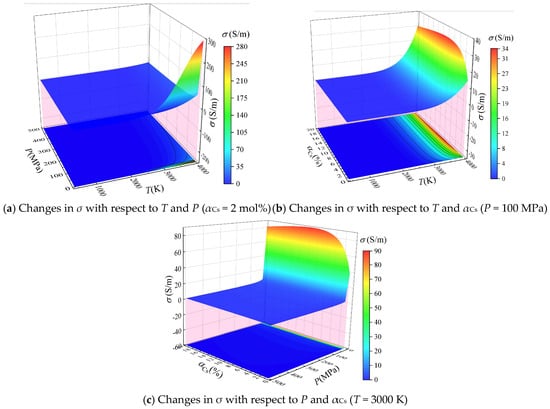
Figure 6.
Calculated electrical conductivity σ of the combustion products of solid propellant containing cesium with respect to T, P, and αCs.
It can be seen from Figure 6a,b that σ increases with increasing temperature under given values of P and αCs. This is because the electron density in the combustion product increases exponentially with increasing temperature over the temperature range considered herein.
It can be seen from Figure 6a,c that σ decreases with increasing pressure under given values of T and αCs. For example, σ is 183.19 S/m, 75.15 S/m, and 25.62 S/m when the temperature is 4000 K and the pressure is 1 MPa, 10 MPa, and 100 MPa, respectively. The reason for this phenomenon can be explained as follows. On the one hand, although an increase in pressure increases the electron density, it also inhibits ionization reactions and reduces the degree of ionization of the system. On the other hand, the number density of neutral particles increases proportionally with increasing pressure, but the increase in the electron density with increasing pressure is gradually diminished relative to density of neutral particles. This leads to a decrease in the contribution of collisions between electrons and neutral particles to the conductivity in Equation (18). In addition, since the number densities of electrons and cesium ions in the combustion products are equivalent, the Λ in Equation (20) increases with increasing electron density. This leads to a decrease in the contribution of collisions between electrons and ions given in Equation (19), which ultimately results in a decreased total conductivity.
It can be seen from Figure 6b,c that σ increases with increasing αCs under given values of T and P when αCs < 8 mol%. However, the observed increase in σ diminishes gradually when αCs > 3 mol%. Meanwhile, σ gradually decreases with the further increase in αCs above 8 mol%. The reasons for the above trends can be explained as follows. The electron density in the combustion product increases with increasing αCs. Hence, the observed increase in σ generally follows the increasing trend of αCs when αCs < 8 mol%. However, the contribution of collisions between electrons and neutral particles to σ decreases according to the data employed in Equation (18) due to the large collision cross-section of cesium atoms and their oxides, which eventually diminishes the impact of increasing αCs on σ, and leads to a decrease in the total conductivity at high values of αCs greater than 8 mol%.
4.6. Analysis of Model Prediction Uncertainties
The standard chemical potentials used in the equilibrium composition calculation are taken from authoritative databases such as NIST. For the major gas-phase species considered in this study (e.g., CO2, H2O, CO, N2, H2, OH), the uncertainties of their thermochemical parameters (standard enthalpy of formation, entropy) within the relevant temperature range are generally below 1%. For cesium and its compounds (Cs, CsO, Cs2O, Cs+), we adopted validated data from the literature. Uncertainties in such fundamental data have limited direct impact on the final equilibrium mole fractions, especially in temperature regions (>1000 K) where highly sensitive phase equilibria or critical phenomena are not involved.
A Debye–Hückel correction was introduced into the Gibbs free energy function. The validity of this correction is based on the weak-coupling plasma assumption (Γ ≪ 1). This assumption holds over most of the parameter space covered in this paper. However, in the highest-pressure regions (e.g., P > 300 MPa) at relatively low temperatures (e.g., T < 3000 K), the electron density Ne can exceed 1023 m−3, and the coupling parameter Γ approaches 0.3–0.5. Our evaluation indicates that under such extreme conditions, the difference in electron density between neglecting the Debye–Hückel correction and using the present model can reach 10–20%. This constitutes a known systematic error source in the model predictions for extreme high-density regimes.
The equilibrium composition is solved iteratively via the exterior point penalty function method combined with the conjugate gradient method. The initial penalty factor r(0) = 0.01 and is increased by a factor of 10 in each outer iteration. The inner conjugate gradient solver employs a line search that satisfies the Wolfe conditions. Convergence is declared when both the change in the penalty function value and the maximum relative change in all species mole fractions are less than 10−6. To verify robustness, we tested ten different initial guesses ranging from lean to rich mixtures; all cases converged stably to the same equilibrium composition, indicating that numerical truncation errors are negligible.
The present model, based on the LTE assumption, performs well at temperatures above 1800 K, with deviations < 5%. In low-temperature regimes (e.g., during ignition or transient combustion stages), where non-equilibrium effects are pronounced, predictions from this framework should be applied with caution. Future work may extend the model to a two-temperature formulation to better describe non-equilibrium states.
5. Experimental Validation
5.1. Experimental System
To validate the accuracy of the theoretical calculations, experimental testing of the electron density in the combustion products of propellant with ionization seeds was conducted. This study utilizes a Langmuir probe system, where a sweeping voltage is applied between two probes inserted into the combustion products to obtain the current-voltage (I-V) characteristic curve of the double probe, i.e., the relationship between the operating current (ID) and the sweeping voltage (VD). The parameters derived from the curve are then used to calculate the electron temperature and ion density in the plasma. The schematic diagram of the Langmuir probe experimental system for propellant combustion gas is shown in Figure 7.
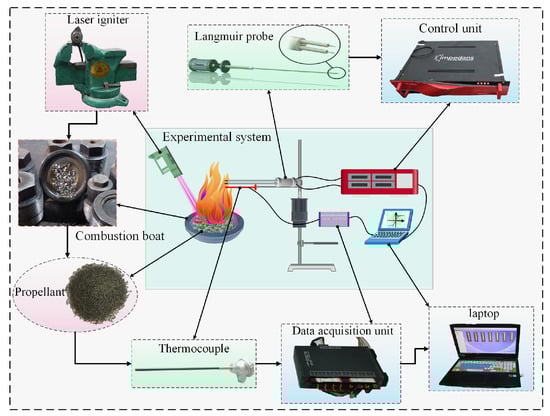
Figure 7.
Schematic diagram of the experimental system.
Figure 7 shows the experimental system, which consists of propellant with ionization seeds, a combustion chamber, a laser igniter, a Langmuir probe system control unit, a thermocouple, and other components. The combustion chamber is made of high-temperature-resistant steel. The probe has a tip diameter (dp) of 0.4 mm and a tip length (Lp) of 10 mm, with a distance (ΔLp) of 2 mm between the two tips. The Langmuir probe is connected via wires to the probe system control unit, which provides a voltage sweep range of −150 to 150 V and enables real-time acquisition of probe potential and current data. This allows the current-voltage characteristic curve to be obtained for analyzing plasma parameters. The propellant used is the tri-base propellant, with a precisely measured mass of cesium salt seeds thoroughly mixed into the propellant using a high precision balance. This setup allows testing of plasma parameters in the combustion flame under three conditions with ionization seed mass fractions of 1%, 2%, and 4%.
5.2. Test Method
The purpose of the Langmuir probe experiment is to obtain the electron density in the combustion products under different combustion temperatures and ionization seed contents. Typically, by applying a sweeping voltage, a current-voltage characteristic curve as shown in Figure 8. is formed between the probes of the Langmuir probe.
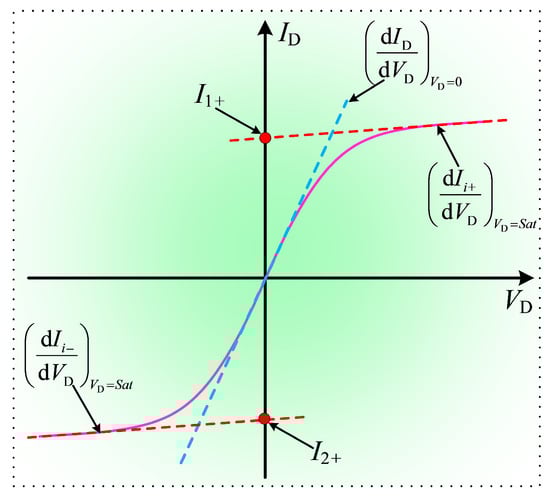
Figure 8.
Current-voltage characteristic curve of Langmuir probe.
In Figure 8, I1+ and I2+ represent the saturation ion currents of Probe 1 and Probe 2, respectively. When the two probes have identical structures, it is generally true that I+ = I1+ = −I2+. denotes the slope of the current-voltage characteristic curve when the potential difference between the two probes is zero, while represents the slope when the potential between the probes reaches saturation. The calculation of electron temperature and ion density in plasma using the Langmuir probe method can be referred to the following formulas [61]:
The electron density Ne and ion density Ni in the propellant flame can be expressed as:
In the formulas, Ap = π dpLp represents the surface area of the probe tip, and Mi denotes the mass of the ions, which in this context refers to the mass of Cs+ ions.
5.3. Analysis of Test Results
Before testing, the scanning voltage of the Langmuir double probe was set to −5~5 V (with a voltage step of 0.2 V), the loading time of the scanning voltage was 20 ms, and after each scan, a 20 ms interval was applied for continuous scanning and calibration. Repeatability verification conducted before testing served to limit random error effects on the experimental data. After laser ignition, testing began once the propellant flame had stabilized. For each test point, voltage-current values were recorded 10 times, and the average was taken as the final current-voltage characteristic curve. Additionally, outliers that deviated significantly from the average in the experimental data were excluded to avoid the influence of errors. Based on this, plasma parameters at different temperatures were studied by varying the mass fraction of cesium nitrate in the propellant and adjusting the probe position within the flame. Multiple laser ignition experiments were conducted with simultaneous recording of current-voltage characteristic curves, thereby obtaining multiple sets of plasma parameter values under different ionization seed contents and temperatures. The results are shown in Figure 9.
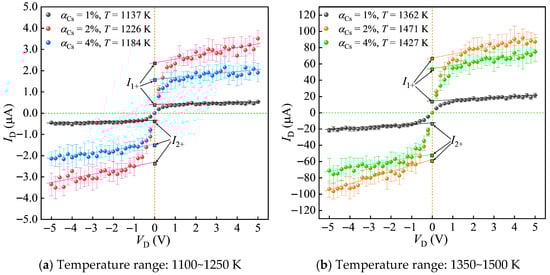
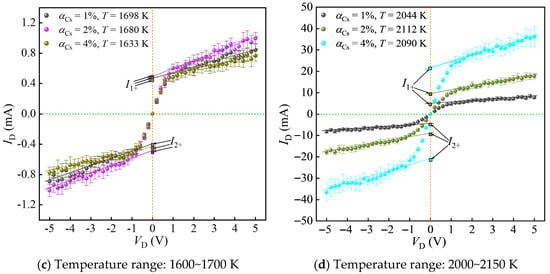
Figure 9.
Current-voltage characteristic curves under different temperature ranges and ionization seed contents.
As shown in Figure 9, the current-voltage characteristic curves plotted from the average of 10 experiments exhibit good symmetry in both the positive and negative voltage regions. Although there is a slight deviation between the saturation ion currents of Probe 1 and Probe 2, the deviation is minor, indicating the feasibility of using the Langmuir double-probe method to measure plasma parameters in propellant flames. From Figure 9a,b,d, it can be observed that the saturation ion current and the value of increase with rising temperature. Figure 9c shows that at similar propellant gas temperatures, the shapes of the current-voltage characteristic curves are largely consistent across different ionization seed contents, suggesting that temperature has the most significant impact on plasma parameters. Even small temperature variations can lead to noticeable changes in electron number density. Furthermore, comparing Figure 9a–d, it is evident that although the standard deviation of the current value ID gradually increases with temperature, the coefficient of variation decreases, indicating that the ionization reaction in the combustion products becomes increasingly stable at higher temperatures, resulting in smaller deviations in the experimental data.
These experiments validate the equilibrium model’s Ne predictions at P = 0.1 MPa. Based on the current-voltage characteristic curves under different combustion temperatures and ionization seed contents, the electron temperature (Te) and electron density (Ne) of the combustion products are calculated and compared with the data obtained from numerical calculations. The calculation formula for the electron density deviation is ξNe = (Ne,calc − Ne,exp)/Ne,exp. Taking the ionization seed content of 2% as an example, the calculated plasma parameters under different combustion temperatures are shown in Table 2.
Table 2.
Plasma parameters at different combustion temperatures with 2% ionization seed content.
As shown in Table 1, the electron temperature of the combustion products measured by the Langmuir probe is higher than the neutral particle temperature measured by the thermocouple, indicating that the combustion products are not in a state of complete thermodynamic equilibrium under atmospheric pressure. At temperatures below 1500 K, the significant discrepancies between calculated and experimental electron density highlight the limitation of the LTE assumption under these low-temperature, non-equilibrium conditions. However, unlike the non-equilibrium plasma generated by discharge reactions (where the electron temperature can be several or even tens of times higher than the heavy particle temperature), the difference between the two temperatures is not significant. Therefore, the combustion products of propellant containing ionization seeds under atmospheric pressure can be regarded as weakly non-isothermal plasma. Additionally, at lower combustion temperatures, there is a considerable deviation between the experimental and calculated values of Ne. This is because, at low temperatures, the electron density in the combustion products is extremely low, leading to inherent inaccuracies in the results obtained via the Gibbs free energy minimization method. At the same time, limitations in the measurement range and accuracy of the Langmuir probe method contribute to substantial random errors in electron density measurements at low temperatures. As the temperature increases, the deviation between the experimental and calculated values of electron density gradually decreases. When the combustion product temperature exceeds 1800 K, the deviation remains within 5%, effectively validating the accuracy of the theoretical calculations.
The experimental validation in this work is limited to atmospheric pressure conditions, while the numerical study covers a pressure range of 0–500 MPa. In the extreme high-pressure regime approaching 500 MPa, the uncertainty of model predictions increases. The main sources of uncertainty include: (1) the potential breakdown of the Debye–Hückel theory in describing strongly non-ideal plasmas; (2) possible changes in the electron–neutral momentum-transfer cross-sections in ultra-high-density media; and (3) the lack of direct experimental benchmarks at corresponding pressures. These factors collectively constitute the key limitations of the present model under high-pressure conditions. Despite these limitations, the model retains high reliability in the pressure range below about 100 MPa, where non-ideality remains moderate and the underlying physics is well-established. It is therefore sufficiently credible to support preliminary design and analysis for the operating pressure range of most solid-rocket motors. To extend the model reliably over the entire 500 MPa range, future work should focus on developing a more accurate high-pressure plasma equation of state and on obtaining critical validation parameters through ultra-high-pressure experiments or high-fidelity molecular-dynamics simulations.
6. Conclusions
The present study addresses existing limitations in the research on solid propellants containing ionization seeds. To gain detailed knowledge of the thermophysical properties and electrical conductivity of their combustion products, the equilibrium composition was determined by constructing a constraint function based on minimizing Gibbs free energy. This approach, combined with the Debye–Hückel correction under ionized conditions, enabled the calculation of thermophysical properties across a wide range of temperatures and pressures. The Kantrowitz model was applied to solve the electrical conductivity of combustion products. The validity of the proposed framework was demonstrated by evaluating the effects of temperature, pressure, and ionization seed content on the thermophysical properties and electrical conductivity of the combustion products derived from tri-base solid propellant with cesium atoms employed as ionization seeds. Finally, the accuracy of the theoretical calculations for electron density in the combustion products was experimentally validated. The results can be summarized as follows.
(1) The viscosity coefficient and thermal conductivity of the combustion products increase with increasing temperature, while the specific heat at constant pressure exhibits characteristic peaks at temperatures of about 1000 K and 4000 K. The specific heat at constant pressure, viscosity coefficient, and thermal conductivity are not affected significantly by changes in the pressure and ionization seed content.
(2) The conductivity of the combustion products increases with increasing temperature and decreases with increasing pressure. When the temperature is 4000 K, the conductivity corresponding to pressures of 1 MPa, 10 MPa and 100 MPa is 183.19 S/m, 75.15 S/m, and 25.62 S/m, respectively.
(3) The conductivity of the combustion products initially increases with increasing ionization seed content and then decreases.
(4) When the combustion product temperature exceeds 1500 K, the deviation between experimental and theoretical results remains within 5%.
Accordingly, the proposed framework offers support for determining the flow fields of rocket engines and conductive gases under the control of magnetic fields. In the future, the accuracy of the numerical results obtained by the computational framework proposed in this paper will be evaluated based on measured properties extracted using a custom experimental system capable of directly measuring electrical conductivity. Specific efforts should focus on the following three aspects: (ⅰ) implementing a two-temperature plasma model to improve accuracy in low-temperature regimes, which is crucial for ignition and transient analysis; (ⅱ) obtaining accurate momentum-transfer cross-sections for cesium oxides through theoretical or experimental studies; (ⅲ) conducting high-pressure electrical conductivity measurements to validate the model across its full operational envelope, which is essential for the design and application of solid-fuel MHD thrusters.
Author Contributions
Conceptualization, B.M., R.L., Q.Z. and X.B.; methodology, C.C., L.C., B.M. and X.B.; software, Q.Z. and R.L.; validation, B.M.; formal analysis, C.C., L.C., Q.Z. and R.L.; investigation, R.L. and X.B.; resources, L.C., R.L. and X.B.; data curation, C.C.; writing—original draft preparation, C.C.; writing—review and editing, C.C., L.C., B.M., Q.Z., R.L. and X.B.; visualization, C.C. and Q.Z.; supervision, R.L. and X.B.; project administration, X.B.; funding acquisition, X.B. All authors have read and agreed to the published version of the manuscript.
Funding
This paper is supported by National Natural Science Foundation of China (No. 52006241).
Data Availability Statement
Data sharing is not applicable to this article as no new data were created or analyzed in this study.
Conflicts of Interest
The authors declare no conflicts of interest.
References
- Caetano, N.R.; Lorenzini, G.; Lhamby, A.R.; Guillet, V.M.M.; Klunk, M.A.; Rocha, L.A.O. Experimental Assessment of Thermal Radiation Behavior Emitted by Solid Porous Material. Int. J. Heat Technol. 2020, 38, 1–8. [Google Scholar] [CrossRef]
- Wang, Z.; Wang, H.; Li, L.; Zhang, Q.; Li, F.; Shen, R.; Ye, Y.; Zhang, W. Combustion and plume-plasma characteristics of cesium-based solid propellant. Combust. Flame 2024, 263, 113419. [Google Scholar] [CrossRef]
- Bedick, C.R.; Albunio, C.; Strakey, P.; Ferguson, D.; Woodside, R. Potassium carbonate decomposition modeling within rotating detonation engines for direct power extraction applications. Combust. Flame 2022, 244, 112263. [Google Scholar] [CrossRef]
- Blunck, D.; Apte, S.; Niemeyer, K. Pulse Detonation Engine for Advanced Oxy-Combustion of Coal-Based Fuel for Direct Power Extraction Applications; Oregon State University: Corvallis, OR, USA, 2021. [Google Scholar]
- Lefevre, A.; Gildfind, D.E.; Gollan, R.J.; Jacobs, P.A.; James, C.M. Magnetohydrodynamic Experiments of Total Heat Flux Mitigation for Superorbital Earth Reentry. AIAA J. 2022, 60, 5046–5059. [Google Scholar] [CrossRef]
- Ozsari, I.; Ust, Y. Effect of varying fuel types on oxy-combustion performance. Int. J. Energy Res. 2019, 43, 8684–8696. [Google Scholar] [CrossRef]
- Brinkley, S.R. calculation of the equilibrium composition of systems of many constituents. J. Chem. Phys. 1947, 15, 107–110. [Google Scholar] [CrossRef]
- Yılmaz, S.; Kumlutaş, D.; Yücekaya, U.A.; Cumbul, A.Y. Prediction of the equilibrium compositions in the combustion products of a domestic boiler. Energy 2021, 233, 121123. [Google Scholar] [CrossRef]
- Xu, L.; Yuan, J. Thermodynamic properties calculation of the flue gas based on its composition estimation for coal-fired power plants. Appl. Therm. Eng. 2015, 90, 366–375. [Google Scholar] [CrossRef]
- Glascock, M.S.; Drew, P.D.; Rovey, J.L.; Polzin, K.A. Thermodynamic Properties of Hydroxylammonium Nitrate-Based Electric Solid Propellant Plasma. J. Thermophys. Heat Transf. 2020, 34, 522–529. [Google Scholar] [CrossRef]
- Kayadelen, H.K. A multi-featured model for estimation of thermodynamic properties, adiabatic flame temperature and equilibrium combustion products of fuels, fuel blends, surrogates and fuel additives. Energy 2018, 143, 241–256. [Google Scholar] [CrossRef]
- Li, K.; Liu, J.; Liu, W.Q. Thermal protection performance of magnetohydrodynamic heat shield system based on multipolar magnetic field. Acta Astronaut. 2017, 136, 248–258. [Google Scholar] [CrossRef]
- Otsu, H.; Matsushita, K.; Detlev, K.; Abe, T.; Funaki, I. Reentry heating mitigation by utilizing the Hall effect. In Proceedings of the 35th AIAA Plasmadynamics and Lasers Conference, Portland, OR, USA, 28 June–1 July 2004; p. 2167. [Google Scholar]
- Cristofolini, A.; Borghi, C.; Schettino, A.; Battista, F. Numerical rebuilding of MHD tests in an unseeded Mach 10 air flow around a blunt body. In Proceedings of the 43rd AIAA Plasmadynamics and Lasers Conference, New Orleans, LA, USA, 25–28 June 2012; p. 2733. [Google Scholar]
- Fridman, A.; Kennedy, L.A. Plasma Physics and Engineering; CRC Press: Boca Raton, FL, USA, 2004. [Google Scholar]
- Fu, Z.; Chen, Q.; Chen, X. Electrical Conductivity of Noble Gas Plasmas in the Warm Dense Matter Regime. Contrib. Plasma Phys. 2012, 52, 251–260. [Google Scholar] [CrossRef]
- Zhao, Q.; Mao, B.; Bai, X.; Yang, Y.; Zhu, R.; Chen, C. Advances in Electrical Conductivity Calculation Method of Thermal Ionization Plasma. In Proceedings of the 2021 IEEE 12th International Conference on Mechanical and Intelligent Manufacturing Technologies (ICMIMT), Cape Town, South Africa, 13–15 May 2021; pp. 213–218. [Google Scholar]
- Bedick, C.R.; Kolczynski, L.; Woodside, C.R. Combustion plasma electrical conductivity model development for oxy-fuel MHD applications. Combust. Flame 2017, 181, 225–238. [Google Scholar] [CrossRef]
- Bisek, N.; Gosse, R.; Poggie, J. Use of impregnated ablator for improved magnetohydrodynamic-heat shield concept. In Proceedings of the 42nd AIAA Plasmadynamics and Lasers Conference in Conjunction with the 18th International Conference on MHD Energy Conversion (ICMHD), Honolulu, HA, USA, 27–30 June 2011; p. 3468. [Google Scholar]
- Bisek, N.J.; Boyd, I.D.; Poggie, J. Numerical study of magnetoaerodynamic flow around a hemisphere. J. Spacecr. Rocket. 2010, 47, 816–827. [Google Scholar] [CrossRef]
- Wang, W.Z.; Murphy, A.B.; Yan, J.D.; Rong, M.Z.; Spencer, J.W.; Fang, M.T.C. Thermophysical properties of high-temperature reacting mixtures of carbon and water in the range 400–30,000 K and 0.1–10 atm. Part 1: Equilibrium composition and thermodynamic properties. Plasma Chem. Plasma Process. 2012, 32, 75–96. [Google Scholar] [CrossRef]
- Askari, O. Thermodynamic properties of pure and mixed thermal plasmas over a wide range of temperature and pressure. J. Energy Resour. Technol. 2018, 140, 032202. [Google Scholar] [CrossRef]
- Colonna, G.; D’aNgola, A.; Laricchiuta, A.; Bruno, D.; Capitelli, M. Analytical expressions of thermodynamic and transport properties of the Martian atmosphere in a wide temperature and pressure range. Plasma Chem. Plasma Process. 2012, 33, 401–431. [Google Scholar] [CrossRef]
- Colonna, G.; D’aNgola, A.; Pietanza, L.D.; Capitelli, M.; Pirani, F.; Stevanato, E.; Laricchiuta, A. Thermodynamic and transport properties of plasmas including silicon-based compounds. Plasma Sources Sci. Technol. 2018, 27, 015007. [Google Scholar] [CrossRef]
- D’aNgola, A.; Colonna, G.; Kustova, E. Thermal and non-thermal plasmas at atmospheric pressure. Front. Phys. 2022, 10, 852905. [Google Scholar] [CrossRef]
- Bruno, D.; Capitelli, M.; Catalfamo, C.; Giordano, D. Transport properties of high-temperature air in a magnetic field. Phys. Plasmas 2011, 18, 012308. [Google Scholar] [CrossRef]
- Bruno, D.; Laricchiuta, A.; Capitelli, M.; Catalfamo, C.; Giordano, D. Transport properties of partially ionized argon in a magnetic field. J. Thermophys. Heat Transf. 2008, 22, 424–433. [Google Scholar] [CrossRef]
- Schulz, J.C.; Gottiparthi, K.C.; Menon, S. Menon, Ionization in gaseous detonation waves. Shock. Waves 2012, 22, 579–590. [Google Scholar] [CrossRef]
- Bedick, C.R.; Woodside, C.R.; Baylor, R.; Paul-Irudayaraj, M. Combustion plasma electrical conductivity model validation for oxy-fuel MHD applications: Spectroscopic and electrostatic probe studies. Combust. Flame 2020, 213, 140–155. [Google Scholar] [CrossRef]
- Irudayaraj, M.J.C.A.P.; Bedick, C. Determination of Electrical Conductivity in Potassium Seeded Oxy-Fuel Flame using RF Coil Approach. In Proceedings of the AIAA Scitech 2020 Forum, Orlando, FL, USA, 6–10 January 2020; p. 1430. [Google Scholar]
- Szulc, M.; Forster, G.; Marques-Lopez, J.-L.; Schein, J. Spectroscopic characterization of a pulsed low-current high-voltage discharge operated at atmospheric pressure. Appl. Sci. 2022, 12, 6366. [Google Scholar] [CrossRef]
- Koukkari, P.; Blomberg, P. Extents of reaction as supplementary constraints for Gibbs energy minimization. Chem. Eng. Sci. 2024, 295, 120112. [Google Scholar] [CrossRef]
- Chan, B. Reliable quantum-chemistry heats of formation for an extensive set of c-, h-, n-, o-, f-, s-, cl-, br-containing molecules in the nist chemistry webbook. J. Phys. Chem. A 2025, 129, 3578–3586. [Google Scholar] [CrossRef] [PubMed]
- Sun, B.; Guo, X.; Zhang, Y.; Wang, Z.L.; Shao, J. A generalized model for a triboelectric nanogenerator energy harvesting system. Nano Energy 2024, 126, 109637. [Google Scholar] [CrossRef]
- Wang, Y.; Wang, P. Analysis on the determination of specific heat of air at constant pressure. In Proceedings of the IOP Conference Series: Earth and Environmental Science; IOP Publishing: Bristol, UK, 2020; p. 052021. [Google Scholar]
- Samuilov, E.V.; Sheveleva, N.A. Thermodynamic properties of coal combustion products. Therm. Eng. 2006, 53, 842–847. [Google Scholar] [CrossRef]
- Miyazaki, K.; Srinivas, G.; Bagchi, B. The Enskog theory for transport coefficients of simple fluids with continuous potentials. J. Chem. Phys. 2001, 114, 6276–6285. [Google Scholar] [CrossRef][Green Version]
- Svehla, R.A. Estimated Viscosities and Thermal Conductivities of Gases at High Temperatures; National Aeronautics and Space Administration: Washington, DC, USA, 1963.
- Hattikudur, U.R.; Thodos, G. Equations for the Collision Integrals Ω21 (1, 1)* and Ω (2, 2). J. Chem. Phys. 1970, 52, 4313. [Google Scholar] [CrossRef]
- Itikawa, Y. Cross sections for electron collisions with carbon dioxide. J. Phys. Chem. Ref. Data 2002, 31, 749–767. [Google Scholar] [CrossRef]
- Itikawa, Y. Momentum-transfer cross sections for electron collisions with atoms and molecules. At. Data Nucl. Data Tables 1974, 14, 1–10. [Google Scholar] [CrossRef]
- Anzai, K.; Kato, H.; Hoshino, M.; Tanaka, H.; Itikawa, Y.; Campbell, L.; Brunger, M.J.; Buckman, S.; Cho, H.; Blanco, F. Cross section data sets for electron collisions with H2, O2, CO, CO2, N2O and H2O. Eur. Phys. J. D 2012, 66, 1–8. [Google Scholar] [CrossRef]
- Itikawa, Y. Cross sections for electron collisions with carbon monoxide. J. Phys. Chem. Ref. Data 2015, 44, 013105. [Google Scholar] [CrossRef]
- Song, M.-Y.; Cho, H.; Karwasz, G.P.; Kokoouline, V.; Nakamura, Y.; Tennyson, J.; Faure, A.; Mason, N.J.; Itikawa, Y. Cross sections for electron collisions with H2O. J. Phys. Chem. Ref. Data 2021, 50, 023103. [Google Scholar] [CrossRef]
- Dolan, T.J. Electron and ion collisions with water vapour. J. Phys. D Appl. Phys. 1993, 26, 4–8. [Google Scholar] [CrossRef]
- Ayouz, M.; Faure, A.; Tennyson, J.; Tudorovskaya, M.; Kokoouline, V. Cross Sections and Rate Coefficients for Vibrational Excitation of H2O by Electron Impact. Atoms 2021, 9, 62. [Google Scholar] [CrossRef]
- Itikawa, Y.; Mason, N. Cross sections for electron collisions with water molecules. J. Phys. Chem. Ref. Data 2005, 34, 1–22. [Google Scholar] [CrossRef]
- Yoon, J.-S.; Song, M.-Y.; Han, J.-M.; Hwang, S.H.; Chang, W.-S.; Lee, B.; Itikawa, Y. Cross sections for electron collisions with hydrogen molecules. J. Phys. Chem. Ref. Data 2008, 37, 913. [Google Scholar] [CrossRef]
- Riahi, R.; Teulet, P.; Ben Lakhdar, Z.; Gleizes, A. Cross-section and rate coefficient calculation for electron impact excitation, ionisation and dissociation of H2 and OH molecules. Eur. Phys. J. D 2006, 40, 223–230. [Google Scholar] [CrossRef]
- Itikawa, Y. Cross sections for electron collisions with nitrogen molecules. J. Phys. Chem. Ref. Data 2006, 35, 31–53. [Google Scholar] [CrossRef]
- Song, M.-Y.; Yoon, J.-S.; Cho, H.; Itikawa, Y.; Karwasz, G.P.; Kokoouline, V.; Nakamura, Y.; Tennyson, J. Cross sections for electron collisions with methane. J. Phys. Chem. Ref. Data 2015, 44, 023101. [Google Scholar] [CrossRef]
- Gadoum, A.; Benyoucef, D. Set of the electron collision cross sections for methane molecule. IEEE Trans. Plasma Sci. 2018, 47, 1505–1513. [Google Scholar] [CrossRef]
- Fite, W.L.; Brackmann, R. Collisions of electrons with hydrogen atoms. I. Ionization. Phys. Rev. 1958, 112, 1141. [Google Scholar] [CrossRef]
- Percival, I. Cross sections for collisions of electrons with hydrogen atoms and hydrogen-like ions. Nucl. Fusion 1966, 6, 182–187. [Google Scholar] [CrossRef]
- Rudd, M.E. Differential and total cross sections for ionization of helium and hydrogen by electrons. Phys. Rev. A 1991, 44, 1644–1652. [Google Scholar] [CrossRef][Green Version]
- Zhou, S.; Kauppila, W.E.; Kwan, C.K.; Stein, T.S. Measurements of total cross sections for positrons and electrons colliding with atomic hydrogen. Phys. Rev. Lett. 1994, 72, 1443–1446. [Google Scholar] [CrossRef]
- Chakrabarti, K.; Laporta, V.; Tennyson, J. Calculated cross sections for low energy electron collision with OH. Plasma Sources Sci. Technol. 2019, 28, 085013. [Google Scholar] [CrossRef]
- Stefanov, B. Electron momentum-transfer cross section in cesium: Fit to the experimental data. Phys. Rev. A 1980, 22, 427–434. [Google Scholar] [CrossRef]
- Talaat, M. Closed-cycle magnetoplasmadynamic (MPD) generator ducts with various cesium-seeded working fluids. In Proceedings of the 24th Intersociety Energy Conversion Engineering Conference, Washington, DC, USA, 6–11 August 1989; pp. 1033–1038. [Google Scholar]
- Guéneau, C.; Flèche, J.-L. Thermodynamic assessment of the cesium–oxygen system by coupling density functional theory and CALPHAD approaches. Calphad 2015, 49, 67–78. [Google Scholar] [CrossRef]
- Wild, J.; Kudrna, P.; Tichý, M.; Nevrlý, V.; Střižík, M.; Bitala, P.; Filipi, B.; Zelinger, Z. Electron temperature measurement in a premixed flat flame using the double probe method. Contrib. Plasma Phys. 2012, 52, 692–698. [Google Scholar] [CrossRef]
Disclaimer/Publisher’s Note: The statements, opinions and data contained in all publications are solely those of the individual author(s) and contributor(s) and not of MDPI and/or the editor(s). MDPI and/or the editor(s) disclaim responsibility for any injury to people or property resulting from any ideas, methods, instructions or products referred to in the content. |
© 2026 by the authors. Licensee MDPI, Basel, Switzerland. This article is an open access article distributed under the terms and conditions of the Creative Commons Attribution (CC BY) license.