Abstract
Compared with conventional symmetric aircraft, the oblique-wing aircraft offers significant advantages across a wide speed range due to the variable oblique angle. However, the asymmetric aerodynamic characteristics will arise from the differential leading-edge sweep between the forward and aft wings during the rotation process. This study investigates the aerodynamic effects of a conceptual oblique-wing configuration at transonic (Mach 0.85) and supersonic (Mach 1.40) flight conditions. For the baseline design, peak lift-to-drag ratio occurs at oblique angles of 30° and 60°, respectively. Analysis at Mach 0.85 reveals that the forward wing dominates the aerodynamic performance of the whole configuration. The parameter study of the leading-edge sweep confirms that the configuration combining a smaller forward-wing sweep with a larger aft-wing sweep is an effective design for achieving the balanced aerodynamic performance, namely, the forward wing with a 24° leading-edge sweepback angle and the after wing with 33° yield a high lift-to-drag ratio, achieving an optimal trade-off with rolling moment minimization. This drag reduction is achieved through the simultaneous decrease in both wave drag and induced drag. Furthermore, downwash analysis reveals that the inherent rolling moment originates from asymmetric tail loads induced by uneven downwash distribution. These findings provide guidance for the aerodynamic design of future oblique-wing aircraft.
1. Introduction
With the escalating complexity of future aircraft missions and the continual expansion of operational envelopes in wide speed ranges, the aircraft should maintain outstanding flight qualities across diverse flight conditions and mission profiles. Conventional fixed-wing configurations are increasingly unable to satisfy the conflicting aerodynamic demands, multiple design points, and complex flight environments [1]. The oblique-wing configuration significantly reduces the approach speed and takeoff/landing rollout distances during low-speed phases. In mid-to-high-altitude subsonic cruise, a small oblique angle enables highly efficient flight that substantially extends range and endurance.
Similar to variable-sweep wings, the oblique-wing configuration can adaptively vary its oblique angle in response to flight speed [2]. At low speeds, a small oblique angle provides a high aspect ratio with minimal effective sweep, delivering excellent low-speed performance and superior subsonic loiter efficiency (particularly at lower altitudes) compared to high-speed conditions. As the aircraft accelerates into transonic and supersonic conditions, increasing the oblique angle progressively reduces the effective aspect ratio while increasing the effective sweep, thereby achieving outstanding high-speed aerodynamic performance according to the aircraft design theory.
But unlike symmetric variable-sweep aircraft, the oblique wing pivots the entire wing about a single pivot located on the fuselage centerline. This unidirectional rotation produces a highly asymmetric planform: one side becomes the forward wing with a forward-swept leading edge, while the opposite side becomes the after wing with a backward-swept leading edge (when viewed from tail to nose). The oblique wing can achieve the required effective sweep variation for different flight conditions without significant longitudinal shifts in the aerodynamic center or center of gravity [3,4]. Consequently, the oblique-wing configuration offers several key advantages over traditional variable-sweep-back aircraft:
- Minimal aerodynamic center shift. In symmetric variable-sweep wings, increasing the swept-back angle causes both the center of gravity and the aerodynamic center to shift backward, with the aerodynamic center typically displacing farther after than the center of gravity. This differential shift degrades pitch stability. In contrast, the oblique-wing configuration produces negligible movement of either the aerodynamic center or center of gravity during oblique angle rotation, thereby preserving pitch stability across the entire speed ranges.
- Preservation of sweep effectiveness in the root region. The pressure distribution on an oblique wing is nearly parallel to the free-stream direction and uniformly distributed along the span, effectively eliminating the severe root stall tendency in symmetric fixed swept wings. This uniformity substantially increases the root region lift coefficient, resulting in a maximum lift-to-drag ratio in the transonic condition that is typically higher than that of comparable conventional variable-sweep or fixed swept-wing configurations [5].
Based on these advantages, the oblique-wing aircraft has made significant progress in development, whose concept was first proposed by the German aerospace industry during the 1940s. Since the 1950s, major aviation nations led by the United States have invested heavily in its development. NASA, in collaboration with industry, systematically demonstrated the feasibility of oblique-wing technology for civil applications, conducting extensive high- and low-speed wind tunnel tests on rigid and aeroelastically scaled models. Between 1979 and 1982, NASA and Boeing designed and flew the AD-1 (Ames-Dryden-1) aircraft—the world’s first manned oblique-wing demonstrator [6]. Multiple flight tests successfully validated in-flight wing rotation and collected critical aerodynamic and handling qualities data across a wide range of speeds and oblique angles. Building on the AD-1 experience, both Boeing and Lockheed proposed oblique-wing airliner concepts. Subsequently, NASA initiated the Oblique Wing Research Aircraft (OWRA) program using an F-8 platform, performing extensive CFD analyses and wind tunnel testing. After 1980, NASA and Stanford University advanced the Oblique Flying Wing (OFW) concept and developed small-scale flight demonstrators. In 2006, DARPA partnered with Northrop Grumman to explore oblique flying wing applications, conducting comprehensive wind tunnel campaigns on flying-wing configurations with oblique angles up to 65° [7] and addressing key technologies including aerodynamics, flight control, and aeroelastic tailoring. Despite extensive historical research and multiple flight demonstrations that have proven the fundamental feasibility of the oblique-wing concept, technical hurdles remain particularly in aerodynamic design that have prevented its transition to reliable aircraft.
A principal obstacle lay in determining the precise impact of diverse parameters upon the aircraft’s aerodynamic characteristics. Initial investigations were conducted by Li and colleagues at Boeing in 1999. Their methodology applied the supersonic area rule, principles for minimizing wave drag on rotating bodies, and supercritical airfoil theory to enhance an oblique flying wing design. Modifications to airfoil geometry and twist distribution were implemented to achieve greater efficiency at supersonic speeds [8,9]. Subsequently, researchers from the University of Tokyo, Hamaki et al. (2004) [10], utilized unconstrained optimization strategies. Their work aimed at improving the supersonic performance of oblique wings by systematically varying asymmetric planforms and airfoil profiles. The development of a multidisciplinary design tool based on response surface methodology was reported by Mathias et al. from Stanford University in 2006. This framework employed Euler equations to optimize the supersonic efficiency of oblique-wing aircraft configurations [11]. Between 2008 and 2009, Ueno of JAXA employed gradient-based optimization techniques. This approach successfully enhanced airfoil performance across a wide speed range, yielding marked improvements [12,13]. In 2012, research from the German Aerospace Center by Eberhardsteiner designed an oblique flying wing featuring an asymmetric platform and specific twist angles for flight, confirming associated aerodynamic benefits [14]. A more recent study from NASA’s Dayton Center in 2020 examined the influence of spanwise load and twist angle distributions on oblique flying wings. The findings indicated that adjustments to twist can substantially alter rolling moment coefficients and contribute to improved flight stability [15]. Despite these efforts, scholarly work dedicated specifically to the aerodynamic design of the oblique-wing configuration remains notably scarce. In 2021, Zandsalimy [5] pointed out that oblique-wing aircraft show large cross-coupling in their control and dynamic behavior which is not present in conventional symmetrical airplanes. In 2022, Huang [16] proposed an auto-sweep scheme that optimizes UAV wing angles in flight using RCS evaluation and PSO to minimize radar detection. In 2025, Sun [17] et al. investigated the origin of the asymmetric aerodynamic characteristics inherent to the oblique-wing configuration and performed optimization to reduce its drag and the rolling moment concurrently. At the conceptual design stage, few aerodynamic studies have examined how the forward and after wings differ in oblique and sweep angles. Consequently, their coupled flow physics and aerodynamic benefits remain poorly understood.
This paper proposed the conceptual design of the oblique-wing aircraft. Through high-fidelity numerical simulations, the optimal oblique angles that maximize lift-to-drag ratio are determined to be 30° at Mach 0.85 and 60° at Mach 1.40, respectively. Particular emphasis is placed on the transonic condition (Mach 0.85), where a detailed sensitivity analysis of asymmetric leading-edge sweep angles (forward wing versus after wing) is conducted with respect to the lift-to-drag ratio, wave drag, induced drag, and rolling moment characteristics.
2. Conceptual Design of the Oblique-Wing Aircraft
Based on the previous section, the design is carried out on the basis of the conceptual design, aiming at transonic and supersonic flight, and minimizing the asymmetric effect as much as possible. To reduce the downwash effect of the forward wing on the after wing, an asymmetric twist angle distribution from −2° to 1° is equipped from the wingtip of the forward wing to the wingtip of the after wing. Regarding the aspect ratio selection, studies show that the aspect ratio of most oblique-wing aircraft is between 9.5 and 13 [18], and here the middle value of 11 is chosen. In terms of airfoil selection, the F-8 adopted the NASA-SC(2) family series airfoil NASA-SC(2)0714 [19]. Considering the requirements of drag reduction at transonic and supersonic speeds, here the NASA-SC(2)0712, NASA-SC(2)0710, and NASA-SC(2)0708 series airfoils are selected. The above series of airfoils only have a change in relative thickness. The changes in twist angle and relative thickness are shown in Table 1. In terms of the root-to-tip ratio selection, the root-to-tip ratio of the forward and after wings is set to 0.4. During the conceptual design phase, the rotating shaft structure is overlooked, and the gap between the wing and the fuselage is 0.2 m.

Table 1.
Relative thickness and twist distribution across wing spanwise.
The fuselage design is based on a cruise speed of Ma1.4 as the design condition. Under the premise of meeting the internal loading space requirements, the fuselage drag is reduced by controlling the typical cross-sectional area and fuselage length, reducing the fuselage cross-sectional area, and increasing the slenderness ratio. The tail design requires sufficient directional stability throughout the flight envelope and in all flight conditions. A cruciform layout is adopted, with both the horizontal and vertical tails having a large sweep angle to ensure sufficient static stability and control efficiency at different speed ranges. Based on the above design results, an initial aerodynamic layout scheme is formed, as shown in Figure 1.
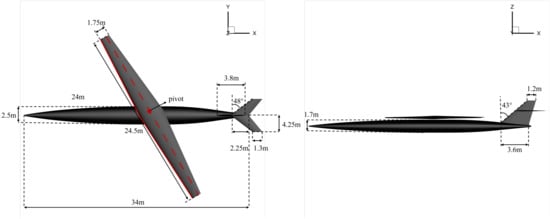
Figure 1.
The top and side views of the oblique-wing aircraft.
3. Aerodynamic Performance Analysis
3.1. High-Fidelity Aerodynamic Analytical Method Based on Solving RANS
Accurately simulating computational fluid dynamics (CFD) is essential for the effective optimization of aerodynamic forms. To evaluate the performance of an oblique wing, the Reynolds-averaged Navier–Stokes (RANS) equations are solved. In the Cartesian coordinate system (, , ), the velocity components are denoted as (, , ). The Navier–Stokes equations without heat sources can be formulated as follows:
where W is the conserved variable, is the inviscid flux vector, and is the viscous flux vector. The specific expressions are expressed as follows:
Ideal gas state equation in Equation (3) is also used:
The RANS equations are discretized using a second-order central difference finite volume method. The convective term is discretized using the second-order upwind Scheme Roe FDS (Flux Differences Splitting) [20]. The turbulence effects are modeled using the Spalart–Allmaras (S-A) turbulence model [21].
3.2. Validation of RANS Solver
To verify the computational methodology employed in this research, the well-established DLR-F6 transonic aircraft configuration is selected for study. This model represents a standard benchmark in the field, with extensive wind-tunnel experimental data and prior numerical results available in the literature for comparison.
Table 2 provides a summary of the primary geometrical parameters defining the DLR-F6 configuration. The corresponding geometry, including pressure coefficient contours and cross-sectional slices for the wing and fuselage, is presented in Figure 2. Furthermore, Figure 3 illustrates the surface discretization and the overall mesh topology employed for the wing-body model. For the wing pressure distribution analysis, benchmark data from ONERA S2MA wind tunnel experiments [22] are used for validation. These tests were conducted at a freestream Mach number of 0.75, a Reynolds number of 5 million, and a target lift coefficient of 0.5979. In the subsequent Figure 4, the experimental measurements are denoted by black points, while the computational fluid dynamics (CFD) results from the present simulation are represented by a solid red line.
Table 2.
Geometrical parameters of DLR-F6 model.
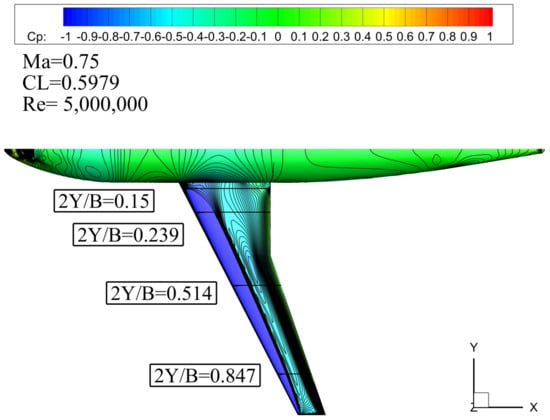
Figure 2.
Geometric and contour of the DLR-F6.
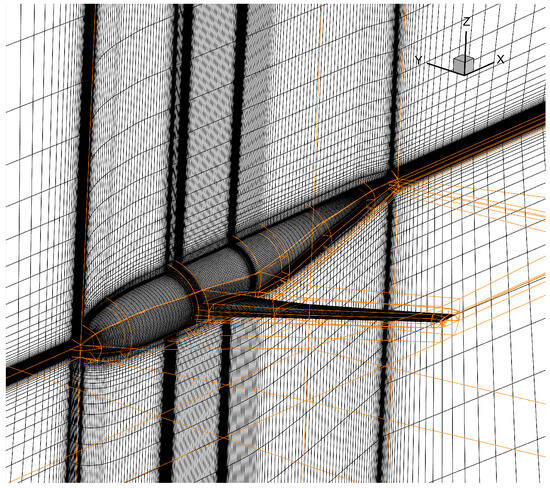
Figure 3.
DLR-F6 mesh.
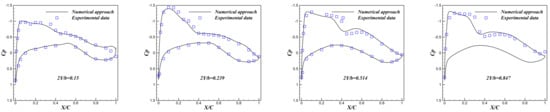
Figure 4.
Pressure slice sections of DLR-F6.
3.3. Mesh Convergence
When conducting the parameter sensitivity analysis of the oblique-wing aircraft, there is no need to change the current topology structure shown in Figure 5. The geometric block can be reassociated and mapped accordingly. The flow direction of the calculation area is taken as 200 times the mean aerodynamic chord (mac) length in the forward and backward directions (see Figure 6), and 100 times in the spanwise and vertical directions. The height of the first layer of the boundary layer grid is m, the normal growth rate is 1.15, and the value of the surface grid is all less than 1. is a dimensionless wall distance directly related to the spacing of the first layer of grid on the wall and specific flow parameters, and it characterizes the position of the first layer grid points in the boundary layer partition structure. The surface grid used in the calculation is shown in Figure 7. Three levels of grids with different numbers of grids are generated, including fine grids of 32 million, medium grids of 4 million, and coarse grids of 0.5 million for the grid independence verification analysis. As shown in Table 3 and Figure 8, it can be seen that the coarse grid has a significant difference in aerodynamic coefficients (lift-to-drag ratio), while the medium grid and the fine grid are almost consistent. In the subsequent aerodynamic simulation, the medium grid is used to reduce time and computational source.
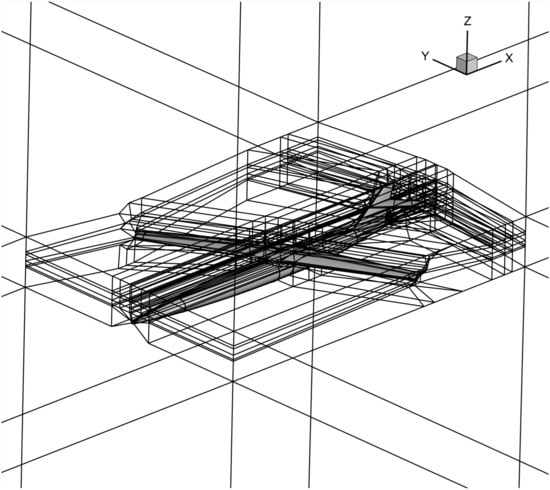
Figure 5.
Grid topology of the oblique-wing aircraft.
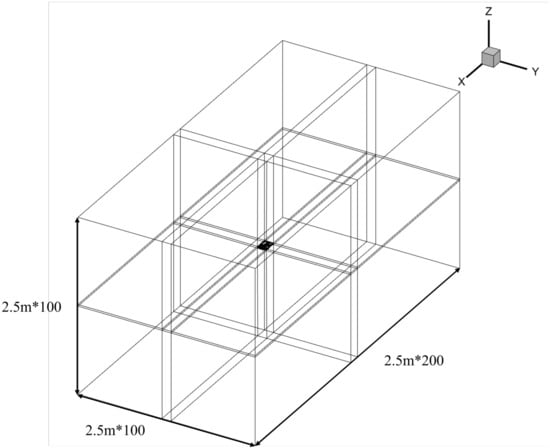
Figure 6.
Computational area.
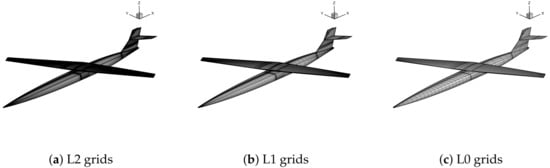
Figure 7.
Three grid sizes for simulation.
Table 3.
Verification of grid convergence in transonic condition.
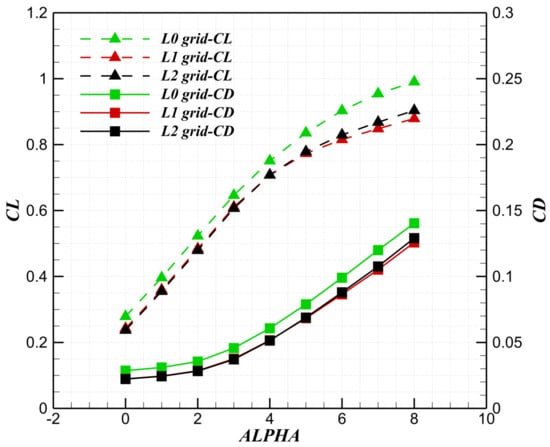
Figure 8.
Grid independence verification at transonic condition.
3.4. Aerodynamic Performance in Different Mach Numbers for Transonic and Supersonic Conditions
As shown in Figure 9, the maximum lift-to-drag ratio occurs at a 30° oblique angle with Mach 0.85, and at a 60° oblique angle with Mach 1.40. In the transonic regime Figure 9a, variations in the Mach number have a relatively minor impact on the lift-to-drag ratio, which remains largely within the same order of magnitude. In the supersonic regime in Figure 9b, however, the lift-to-drag ratio exhibits a declining trend as the Mach number increases.
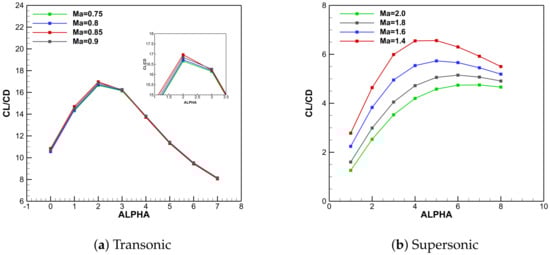
Figure 9.
Aerodynamic performance under 30° and 60° oblique angle across various Mach numbers.
3.5. Aerodynamic Performance with Different Oblique Angles of the Aircraft
As shown in Figure 10, the wing rotates about a pivot axis located at 50% of the root chord length. As the oblique angle increases, the effective aspect ratio decreases proportionally to of the oblique angle. In conventional swept wings, increasing the sweep angle reduces the lift–curve slope. In oblique-wing aircraft, increasing the oblique angle simultaneously increases the effective sweep of both the forward-swept and after-swept panels. Unlike fixed swept wings, the three-dimensional flow field of an oblique wing further increases the spanwise velocity component. At the design condition-cruise condition, the oblique-wing aircraft operates at an angle of attack (AoA) of 1–3°. For consistency in comparison, all oblique-wing analyses use an angle of attack of 2°. The reference conventional configuration has a fixed sweep angle in the subsonic range of 25–40°. Transonic computations are performed for oblique angles of 25°, 30°, 35°, and 40°. As shown in Figure 11, Figure 12 and Figure 13, the maximum lift-to-drag ratio at transonic speeds occurs at an oblique angle of 30°. In the supersonic regime (oblique angles 40–65°), this maximum value increases monotonically with an increasing oblique angle.
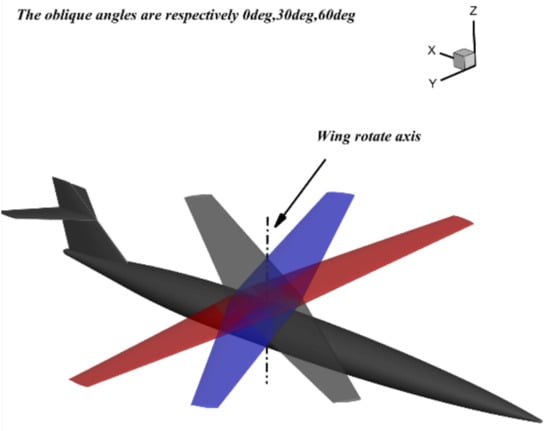
Figure 10.
The rotation process of the oblique-wing aircraft (the oblique angle is 0° (red), 30° (blue), and 60° (gray), respectively).
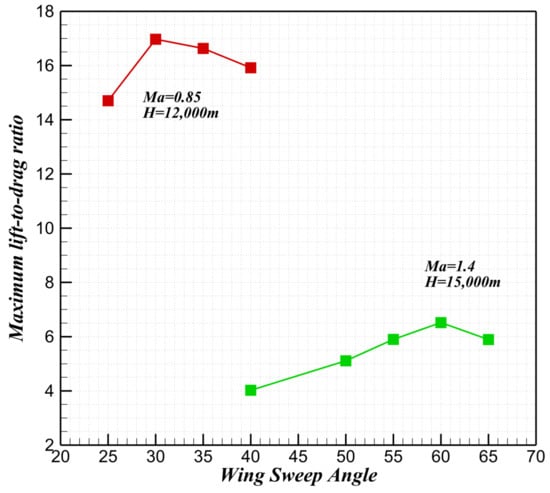
Figure 11.
The optimal lift-to-drag ratio in different oblique angles.
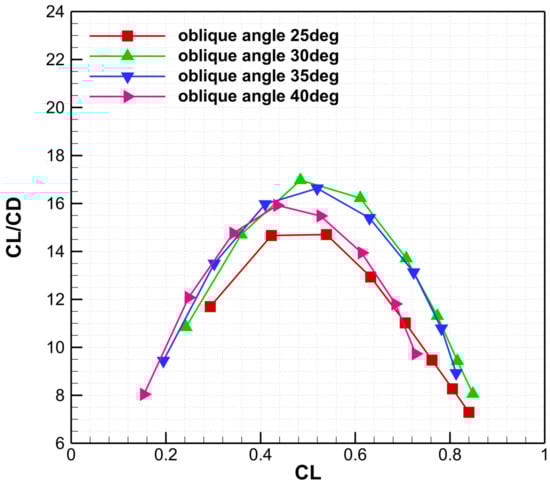
Figure 12.
Lift-to-drag ratio curve in different oblique angles at transonic condition.
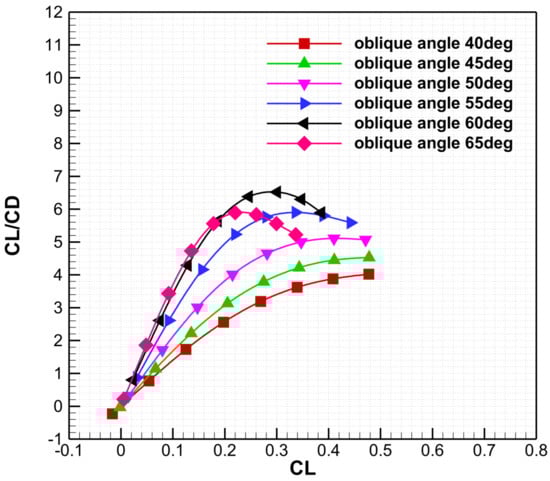
Figure 13.
Lift-to-drag ratio curve in different oblique angles at supersonic condition.
Figure 14 shows that increasing the oblique angle systematically shifts the rolling-moment curve downward: excessive oblique angles yield large negative coefficients, whereas small oblique angles produce equally large positive ones. Figure 15 shows the same tendency compared with the transonic condition, where the rolling moment curve shifts downward with the increasing oblique angles. As the oblique angle increases, the shock moves forward, and the supersonic region shrinks. Variation of the oblique angle significantly affects aerodynamic performance. At small oblique angles, the larger effective wing area produces higher lift but also higher drag. As the oblique angle increases, both lift and drag decrease sharply. Pressure distributions at transonic conditions are presented in Figure 16. At 25°, the aft shock location hinders aileron placement and degrades transonic performance. At 30°, a complex shock system forms, including secondary shocks over the mid-span of the after panel. At 35°, the supersonic region is confined to a narrow strip near the leading edge. Strong spanwise flow near the tip of the after swept wing induces secondary shocks. At 40°, secondary shocks are confined to the upper surface near the tip of the oblique wing, while the flow elsewhere is essentially uniform.
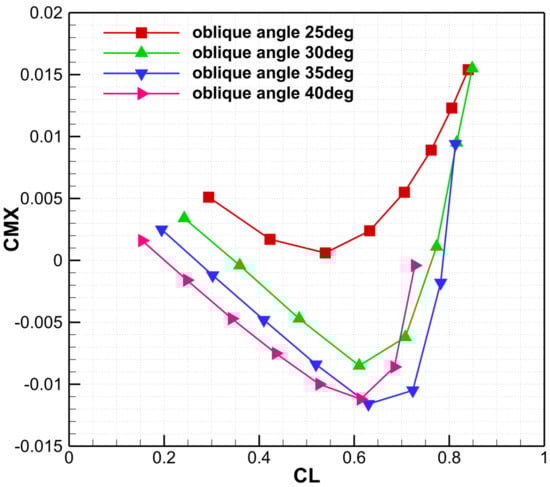
Figure 14.
The rolling moment curve with different oblique angles at transonic condition.
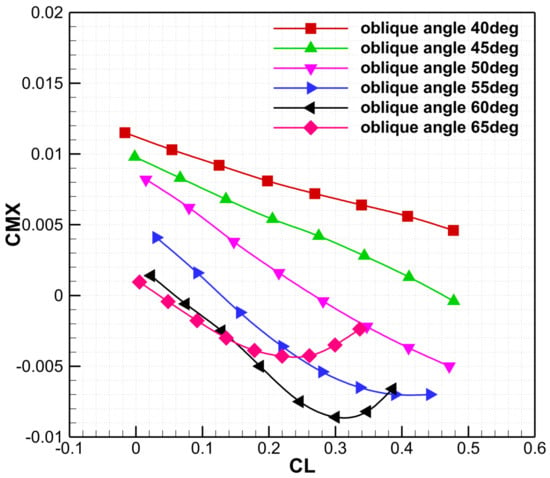
Figure 15.
The rolling moment curve with different oblique angles at supersonic condition.
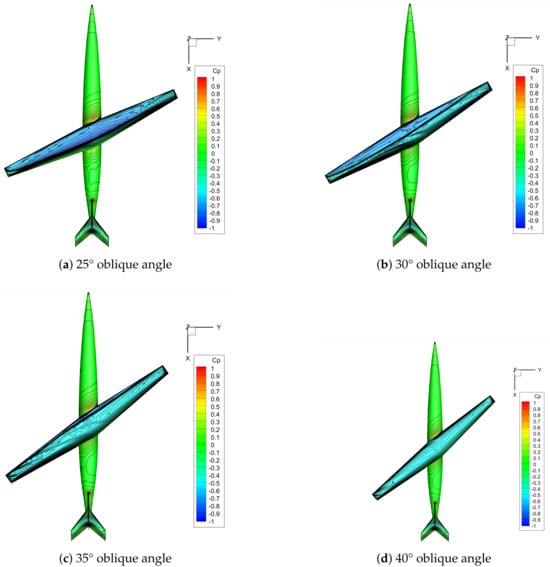
Figure 16.
Pressure distribution of an oblique-wing aircraft at 0.85 Ma and 2° angle of attack (transonic) under different oblique angles.
Pressure distributions at transonic conditions are presented in Figure 17. At supersonic speeds, increasing the oblique angle changes the wing surface pressure distribution from nearly uniform to highly non-uniform. At oblique angles of 55° and 60°, the leading edges of both panels produce a complex shock system. As the oblique angle increases, the effective sweep of the tip and forward-swept leading edge decreases, thereby promoting shock formation. Simultaneously, stronger spanwise flow renders the tip of the aft-swept wing more susceptible to shock formation. Optimization of the tip region is therefore recommended to reduce pressure non-uniformity at high oblique angles. The highest lift-to-drag ratio is achieved at 60°. Integrating the lift-to-drag and rolling-moment curves across transonic and supersonic conditions reveals that a 30° oblique angle at transonic cruise and 60° at supersonic cruise jointly maximize the lift-to-drag ratio while minimizing the rolling-moment coefficient. Overall, to keep rolling moment low, the forward and after wing must share nearly identical lift–curve slopes while maintaining equal areas; a leading-edge sweep angle is the decisive factor shaping these slopes.
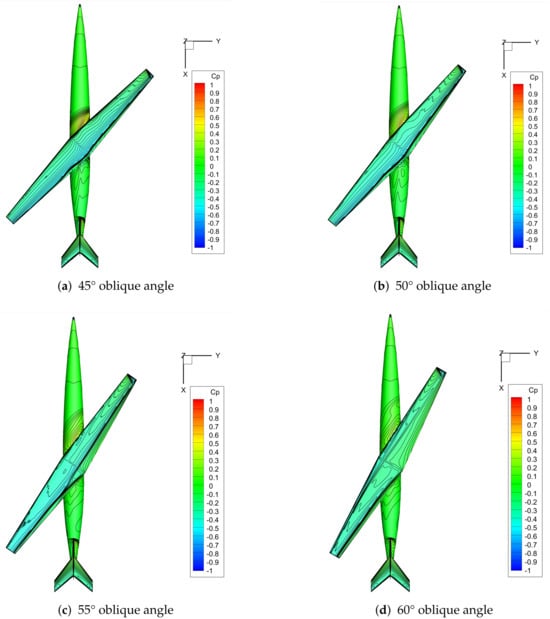
Figure 17.
Pressure distribution of an oblique-wing aircraft at 1.40 Ma and 2° angle of attack (supersonic) under different oblique angles.
4. Transonic Aerodynamic Sensitivity to Different Sweep Angle for Forward and After Wing
4.1. Aerodynamic Performance of Oblique Wing with Different Forward-Wing Leading-Edge Angle
As the oblique-wing aircraft changes flight speed, the entire wing pivots about its central rotation axis. The effective leading-edge sweep of the after wing is the sum of the oblique angle and its geometric leading-edge angle (which is 0° at zero obliquity). Similarly, the effective leading-edge sweep of the forward wing is the oblique angle minus its geometric leading-edge angle (0° at zero obliquity). Fixing the after-wing geometric sweep at 33°, Figure 18 shows that lift-to-drag peaks at a 24° oblique angle, where the effective sweeps are 6° for the forward wing and 3° for the aft wing (both measured at 0° obliquity). The pitching moment curves in Figure 19 indicate that decreasing the leading-edge sweep of the forward wing moves the center of pressure rearward. The pitch stability margin increases monotonically with the effective leading-edge sweep of the forward wing, exhibiting nearly the same trend as the center of pressure movement.
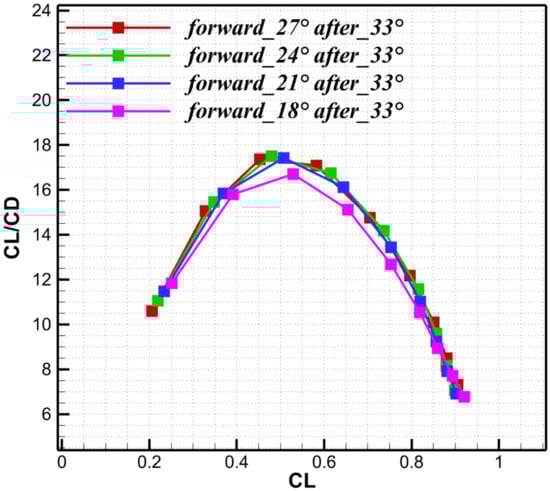
Figure 18.
Lift-to-drag ratio for different forward-wing leading-edge angle.
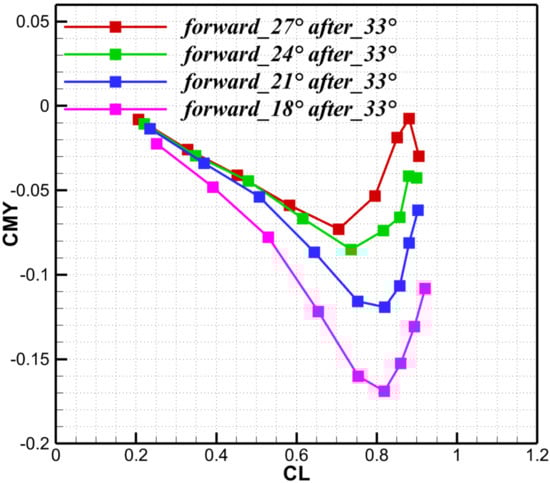
Figure 19.
Pitching moment coefficient for different forward-wing leading-edge angle.
As shown in Figure 20, under the cruise condition with a lift coefficient of , the rolling-moment curve exhibits a minimum when the forward wing has a leading-edge sweep of 24° and the after wing 33°. The specific values of the rolling moment under this condition are shown in the following Table 4. Further reduction in the forward-wing leading-edge sweep translates the curve upward.
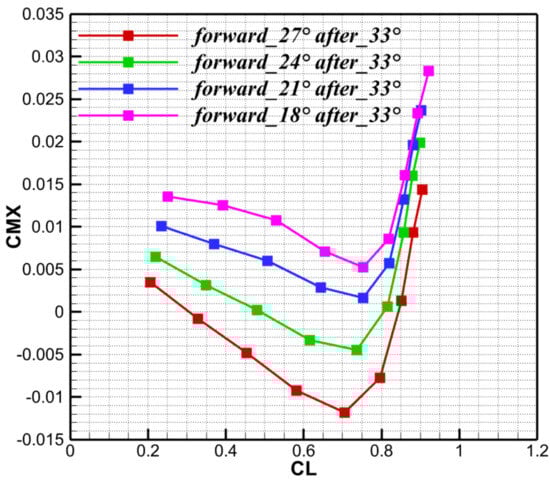
Figure 20.
The rolling moment coefficient for different forward-wing leading-edge angle.
Table 4.
The value of the rolling moment for different forward-wing leading-edge angle at cruise condition.
The reference location is set as 15.1224 m, with a mean aerodynamic chord (MAC) of 2.24 m. Based on this reference point, the positions of the aerodynamic center are presented in Table 5.
Table 5.
Aerodynamic center for forward wing with different leading-edge angles.
Although the supersonic zone enlarges, the value remains nearly unchanged (Figure 19); however, the downward shift of the curve indicates that this expansion boosts forward-wing lift, driving the curve lower (Figure 20). At Mach 0.85, aerodynamic performance is highly sensitive to the leading-edge sweep of the forward wing. Secondary shocks intensify and move rearward as the forward-wing sweep increases. As shown in Figure 21, with the after-wing sweep fixed, increasing the forward-wing leading-edge sweep enlarges the supersonic region on the forward wing and shifts the overall shock pattern rearward. Shocks on the forward wing are located farther aft than those on the after wing. The spanwise pressure profiles in Figure 22 show that the rearward displacement of the supersonic region scales nearly linearly with decreasing forward wing sweep. Consequently, a larger forward-wing sweep results in lift loss and reduced aerodynamic efficiency. Moreover, it moves the shock closer to the wingtip, thereby complicating aileron placement. Tip-induced secondary shocks further restrict aileron positioning. Therefore, oblique-wing designs must balance roll authority with high lift-to-drag ratio. The opposing sweep directions of the forward and afterwings require independent leading-edge sweep optimization. Additionally, large oblique angles generate strong spanwise flow. Nevertheless, downwash from the forward wing imposes a cleaner, near elliptical circulation distribution on the after wing (see Figure 23), resulting in lower induced drag despite the forward wing’s own complex shock system.
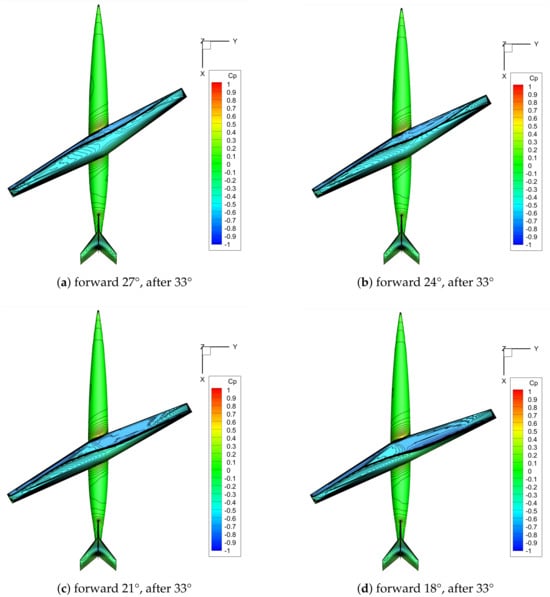
Figure 21.
Pressure distributions for forward-wing leading-edge sweep of 27°, 24°, 21° and 18° with after wing fixed at 33° leading edge sweep.
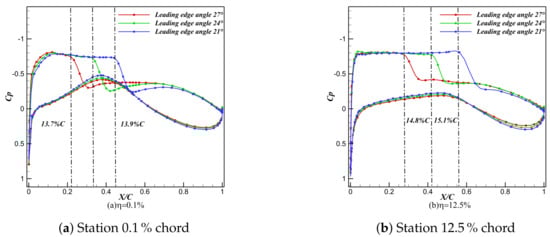
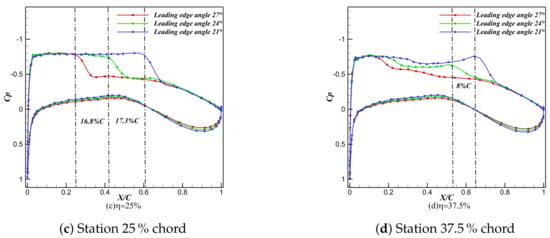
Figure 22.
Sectional pressure distributions at different forward spanwise stations.
Figure 23.
Circulation distributions over the forward and after wing. (a) Forward-wing circulation distribution. (b) After-wing circulation distribution.
4.2. Aerodynamic Performance of Oblique Wing with Different After-Wing Leading-Edge Angle at Transonic Condition
With the forward-wing leading-edge sweep fixed at 27°, the after-wing leading-edge sweep was varied (30°, 33°, and 36°). Compared with changes in forward-wing sweep, variations in after-wing sweep have minimal effect on lift-to-drag ratio (see Figure 24). In contrast, the pitching-moment curves (Figure 25) show that increasing the after-wing sweep shifts the nose-up break point rearward and increases the stability margin. The rolling-moment curves in Figure 26 indicate that reducing the after-wing sweep slightly degrades the rolling-moment characteristics at the design point and make the curve shift downward, as the after wing then produces greater effective lift. After balancing the lift-to-drag ratio and rolling-moment characteristics, the leading-edge sweep angles are finalized as 24° for the forward wing and 33° for the after wing.
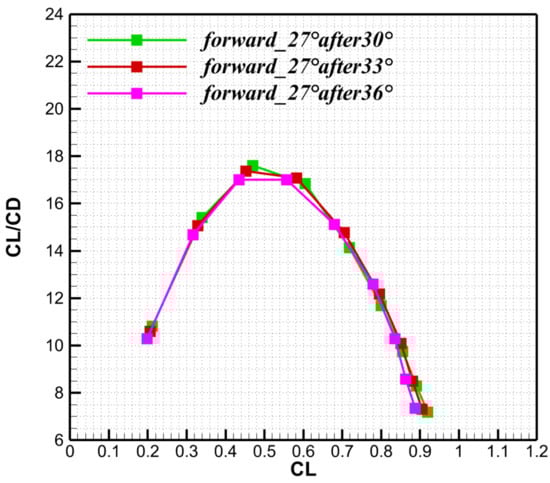
Figure 24.
Lift-to-drag ratio for different after-wing leading-edge angle.
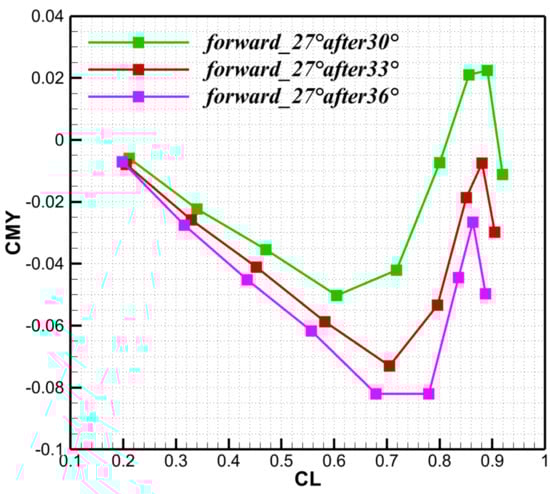
Figure 25.
Pitching moment coefficient for different after-wing leading-edge angle.
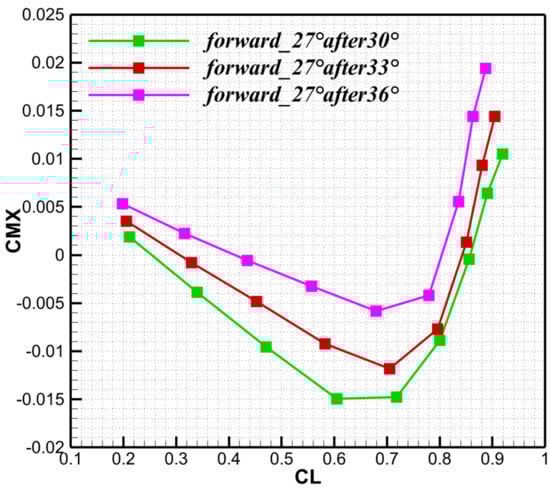
Figure 26.
Rolling moment coefficient for different after-wing leading-edge angle.
The lift-to-drag ratio is insensitive to after-wing sweep. Increasing this sweep angle displaces the aerodynamic center rearward and increases the static stability margin presented in Table 6, whereas a reduction in this sweep angle slightly degrades roll performance at the design point due to the higher lift generated by the after wing. Overall, the aerodynamic center moves forward as the leading-edge sweepback angle of the forward wing decreases and the leading-edge sweepback angle of the after wing increases. After balancing roll performance and lift-to-drag ratio, an after-wing leading-edge sweep of 33° is selected. As shown in Figure 27a,b, downwash from the forward wing increases loading on the after wing, resulting in asymmetric spanwise loads. This geometric asymmetry also produces unequal downwash on the horizontal tail, thereby reducing its lateral-control effectiveness. Downwash in the planform region is stronger from the forward wing and acts more intensely on the right side of the vertical tail, thereby increasing the local angle of attack on the left tail panel and producing a yawing moment to the left. Near the root, downwash is stronger on the right side, which increases lift on the left tail panel and decreases lift on the right panel, thereby inducing a rolling moment to the right. The Mach number downstream of the forward wing is higher than that downstream of the after wing as depicted in the Figure 28, which indicates that the after wing exhibits greater shock wave intensity and a more pronounced deceleration effect. Wingtip-induced shock waves are present in the wingtip region, resulting in a reduction in the local Mach number within this area.
Table 6.
Aerodynamic center for after wing with different leading-edge angles.
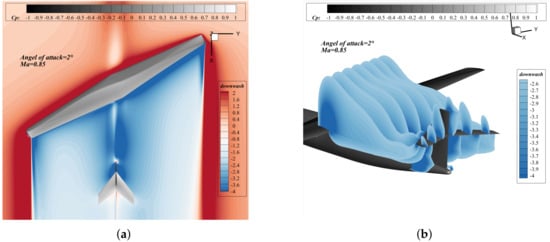
Figure 27.
Downwash characteristics of the oblique-wing configuration. (a) Downwash of oblique-wing aircraft. (b) Downwash at different longitudinal slices.
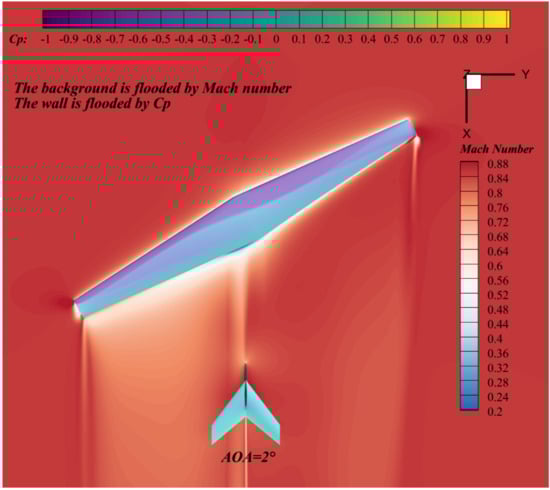
Figure 28.
Pressure and mach number distribution at transonic condition.
In this section, the aerodynamic design of an oblique-wing aircraft across a range of oblique angles under transonic and supersonic conditions is presented, along with an evaluation of its aerodynamic performance. Based on the maximum lift-to-drag ratio, the optimal oblique angle is 30° for transonic flight (Mach 0.85) and 60° for supersonic flight (Mach 1.40). Parametric studies of forward and after-wing leading-edge sweep angles reveal that the lift-to-drag ratio is far more sensitive to forward-wing sweep than to after-wing sweep. The key geometric parameters of the final oblique-wing configuration are presented in Figure 29. Furthermore, flow field analysis of the optimal configuration indicates that the non-zero rolling moment arises primarily from asymmetric downwash induced by the oblique wing on the horizontal and vertical tails.
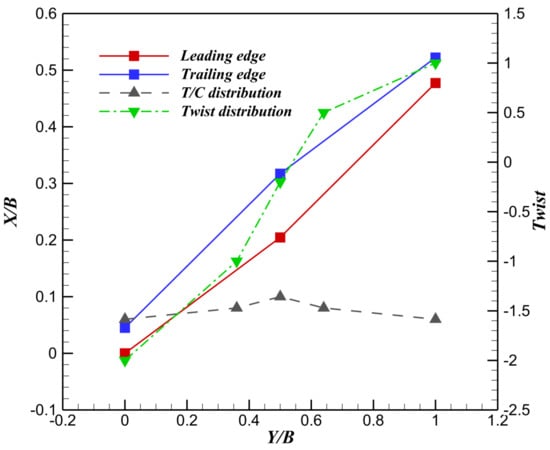
Figure 29.
Geometric parameters of the optimal oblique-wing aircraft.
5. Conclusions
This study introduces an oblique-wing aircraft optimized for flight across a broad speed envelope. Evaluating lift-to-drag ratio and rolling moment at Mach 0.85 (transonic) and Mach 1.40 (supersonic) identifies 30° and 60° as the optimal oblique angles, respectively. The asymmetric leading-edge sweeps of the forward and after wings generate distinct pressure distributions and aerodynamic characteristics. Downwash analysis is further performed for the optimal configuration, revealing the physical origin of the rolling moment in oblique-wing aircraft. The main conclusions are as follows:
- (1)
- RANS simulations maximizing lift-to-drag ratio and minimizing the rolling moment value establish optimal oblique angles of 30° for transonic cruise and 60° for supersonic cruise. The rolling-moment curve shifts downward as the oblique angle increases.
- (2)
- At transonic condition, the forward wing is more sensitive for the lift-to-drag ratio than the after wing. The aerodynamic center shifts backward as the leading-edge sweep of the forward wing decreases and that of the after wing increases.
- (3)
- The rolling moment curve shifts upward when the leading edge of the forward wing is reduced, and shifts downward when the leading edge of the after wing is increased. Balancing the lift-to-drag ratio and rolling moment, the forward-wing leading edge is set to 24° and the after wing to 33°.
- (4)
- Beyond producing asymmetric surface aerodynamics, the geometric asymmetry also generates an uneven downwash. Transonic downwash produces asymmetric tail loads, resulting in a right rolling moment on the horizontal tail and a left yawing moment on the vertical tail.
Author Contributions
Z.L.: Writing—original draft, Visualization, Validation, Software, Methodology, Investigation, Formal analysis, Data curation, Conceptualization. H.S.: Writing—review and editing, Visualization, Supervision, Project administration, Investigation, Conceptualization. H.Z.: Writing—review and editing, Visualization, Supervision, Software, Methodology, Investigation, Funding acquisition. J.L.: Writing—review and editing, Supervision, Project administration, Investigation, Funding acquisition, Conceptualization. W.F.: Writing—review and editing, Project administration, Investigation, Conceptualization. All authors have read and agreed to the published version of the manuscript.
Funding
This research is supported by the National Natural Science Foundation of China (Grant Nos. 12302300, 12272312), 1-0 Major Engineering Science Problem project of Northwestern Polytechnical University (No. G2024KY0613).
Data Availability Statement
Data will be made available on request.
Conflicts of Interest
Authors Zhou Liu and Weijia Fu were employed by the company AVIC Jiangxi Hongdu Aviation Industry Group. The remaining authors declare that the research was conducted in the absence of any commercial or financial relationships that could be construed as a potential conflict of interest.
References
- Barbarino, S.; Bilgen, O.; Ajaj, R.M.; Friswell, M.I.; Inman, D.J. A review of morphing aircraft. J. Intell. Mater. Syst. Struct. 2011, 22, 823–877. [Google Scholar] [CrossRef]
- Alam, M.; Narenathreyas, K. Oblique wing: Future generation transonic aircraft. Int. J. Mech. Aerospace Ind. Mechatron. Eng. 2014, 8, 887–890. [Google Scholar]
- NELMS, W., Jr. Applications of oblique-wing technology-An overview. In Proceedings of the Aircraft Systems and Technology Meeting, Dallas, TX, USA, 27–29 September 1976; p. 943. [Google Scholar] [CrossRef]
- Jones, R.T. The oblique wing—Aircraft design for transonic and low supersonic speeds. Acta Astronaut. 1977, 4, 99–109. [Google Scholar] [CrossRef]
- Zandsalimy, M. Investigation of Aerodynamic Characteristics and Stability of Oblique Wing Airplanes; The University of British Columbia: Vancouver, BC, Canada, 2021. [Google Scholar]
- Mcmurtry, T.; Sim, A.; Andrews, W. AD-1 oblique wing aircraft program. In Proceedings of the 1st Flight Test Conference, Las Vegas, NV, USA, 11–13 November 1981; p. 2354. [Google Scholar]
- Enns, D.; Bugajski, D.; Klepl, M. Flight control for the F-8 oblique wing research aircraft. IEEE Control Syst. Mag. 1988, 8, 81–86. [Google Scholar] [CrossRef]
- Li, P.; Sobieczky, H.; Seebass, R. A design method for supersonic transport wings. In Proceedings of the 13th Applied Aerodynamics Conference, San Diego, CA, USA, 19–22 June 1995. [Google Scholar] [CrossRef]
- Li, P.; Sobieczky, H.; Seebass, R. Manual Aerodynamic Optimization of an Oblique Wing Supersonic Transport. J. Aircr. 1999, 36, 907–913. [Google Scholar] [CrossRef]
- Hamaki, T. Numerical Study of High L/D Oblique Flying Wing. In Proceedings of the 24th International Congress of the Aeronautical Sciences, Yokohama, Japan, 29 August–3 September 2004; pp. 2–5. [Google Scholar]
- Wintzer, M.; Sturdza, P.; Kroo, I. Conceptual Design of Conventional and Oblique Wing Configurations for Small Supersonic Aircraft. In Proceedings of the 44th AIAA Aerospace Sciences Meeting and Exhibit, Reno, NV, USA, 9–12 January 2012. [Google Scholar] [CrossRef]
- Ueno, A.; Suzuki, K. CFD-Based Shape Optimization of Hypersonic Vehicles Considering Transonic Aerodynamic Performance. In Proceedings of the 46th AIAA Aerospace Sciences Meeting and Exhibit, Reno, Nevada, 7–10 January 2008. [Google Scholar] [CrossRef]
- Ueno, A.; Suzuki, K. Two-dimensional shape optimization of hypersonic vehicles considering transonic aerodynamic performance. Trans. Jpn. Soc. Aeronaut. Space Sci. 2009, 52, 65–73. [Google Scholar] [CrossRef]
- Rütten, M.; Trenker, M.; Rosemann, H. Formation Flight Aerodynamics of Oblique Flying Wing Type Aircrafts. In Proceedings of the 6th European Congress on Computational Methods in Applied Sciences and Engineering (ECCOMAS 2012), Vienna, Austria, 10–14 September 2012. [Google Scholar]
- Deslich, J.; Gunasekaran, S.; Flick, P.; Szczublewski, D. Effects of spanloading and slew angle on an Oblique Flying Wing. In Proceedings of the AIAA Scitech 2020 Forum, Orlando, FL, USA, 6–10 January 2020. [Google Scholar] [CrossRef]
- Zhou, Z.; Huang, J. Auto Sweptback Wing Based on Low Scattering Demand for an Unmanned Aerial Vehicle in Phase Flight. Aerospace 2022, 9, 757. [Google Scholar] [CrossRef]
- Sun, H.; Zhang, H.; Wei, Z.; Li, J. Aerodynamic shape design of oblique wing for transonic/supersonic conditions: Integrating coupled drag and lateral performance using the adjoint method. Aerosp. Sci. Technol. 2026, 168, 110841. [Google Scholar] [CrossRef]
- Larrimer, B.I. Thinking Obliquely: Robert T. Jones, the Oblique Wing, NASA’s AD-1 Demonstrator, and Its Legacy; National Aeronautics and Space Administration: Washington, DC, USA, 2013.
- Morris, S.J. Integrated Aerodynamic and Control System Design of Oblique Wing Aircraft. Ph.D. Thesis, Stanford University, Stanford, CA, USA, 1990. [Google Scholar]
- Schwamborn, D.; Gerhold, T.; Heinrich, R. The DLR TAU-code: Recent applications in research and industry. In Proceedings of the ECCOMAS CFD 2006 CONFERENCE, Egmond aan Zee, The Netherlands, 5–8 September 2006. [Google Scholar]
- Spalart, P.; Allmaras, S. A one-equation turbulence model for aerodynamic flows. In Proceedings of the 30th Aerospace Sciences Meeting and Exhibit, Reno, NV, USA, 6–9 January 1992; p. 439. [Google Scholar]
- Rudnik, R.; Sitzmann, M.; Godard, J.L.; Lebrun, F. Experimental Investigation of the Wing-Body Juncture Flow on the DLR-F6 Configuration in the ONERA S2MA Facility. In Proceedings of the 27th AIAA Applied Aerodynamics Conference, San Antonio, TX, USA, 22–25 June 2009. [Google Scholar] [CrossRef]
Disclaimer/Publisher’s Note: The statements, opinions and data contained in all publications are solely those of the individual author(s) and contributor(s) and not of MDPI and/or the editor(s). MDPI and/or the editor(s) disclaim responsibility for any injury to people or property resulting from any ideas, methods, instructions or products referred to in the content. |
© 2026 by the authors. Licensee MDPI, Basel, Switzerland. This article is an open access article distributed under the terms and conditions of the Creative Commons Attribution (CC BY) license.