Abstract
Due to the complexity of aerodynamic coupling between the duct and propeller, the overall design and optimization of ducted fans often require extensive experience and time. Meanwhile, traditional design methods based on Blade Element Momentum Theory, Lifting Surface Theory, Vortex Lattice Methods, and Panel Method usually exhibit certain deviations between their design results and actual outcomes. This is because these approaches struggle to accurately calculate the aerodynamic coupling effects between the duct and propeller, coupled with numerous simplifications inherent in the methods themselves. Considering the strong nonlinear coupling relationship between the duct and propeller, the Response Surface Method (RSM), which enables efficient and accurate analysis of multi-variable coupling effects, was selected for the parameter design and optimization of ducted fans. Computational Fluid Dynamics (CFD) was applied to evaluate the impact of design parameters on overall aerodynamic performance. This approach addresses the limitations of traditional methods, including low design accuracy, high computational cost, and insufficient multi–objective optimization capability. It explicitly models multi-parameter coupling and nonlinear effects using a small number of experimental points, combined with the Multi-Objective Genetic Algorithm (MOGA) to find the global optimum. Compared to the baseline duct fan, the optimized duct fan achieved a 9.6% increase in overall lift and a 9.5% improvement in lift efficiency.
1. Introduction
In the fields of Electric Vertical Take-off and Landing (eVTOL) aircraft and new energy aircraft, ducted fans are widely adopted as efficient propulsion devices [1]. This power unit comprises an enclosed propeller within a duct, building upon the structure of the isolated propeller. Due to their compact configuration, ducts can effectively block the aerodynamic noise generated by the high-speed rotation of propellers from a physical perspective, reducing both the noise intensity and its propagation range. Meanwhile, the small gap between the duct and its propeller reduces the tip vortex of the propeller to a certain extent, recovers the energy loss caused by the tip vortex, and improves propeller efficiency [2]. In summary, compared with open propellers, ducted fans offer advantages including better safety, lower aerodynamic noise, and higher aerodynamic efficiency.
Design methods for ducted fans generally rely on the Blade Element Momentum Theory (BEMT), a traditional design approach for propellers. However, this theory struggles to accurately predict the aerodynamic impact of the duct on the propeller, which results in difficulties in accurately calculating the proportion of additional thrust generated by the duct wall as well as the total lift during the preliminary design phase of the ducted fan [3]. Consequently, numerous scholars have modified this theory by incorporating the aerodynamic effects of the duct on the propeller through adjustments to the inflow velocity and angle of attack. These modifications are coupled with Computational Fluid Dynamics (CFD) results to inversely solve the corresponding correction coefficients, enabling rapid generation of ducted fan designs meeting design requirements. Stubblefield [4] employed the optimal circulation solution method proposed by Kerwin et al. [5] for integrated design of the ducted fan; Guo Jiahao et al. developed an efficient design methodology for ducted fan blades, utilizing CFD to determine correction coefficients for blade element inflow angle and angle of attack during the design process, thereby rapidly producing a ducted fan meeting design requirements [6,7]; Kong Fanjie et al. [8] proposed a computational method for correcting the incoming flow velocity. Without propeller geometry, they estimated duct thrust using the momentum source method and employed the Multiple Reference Frame (MRF) approach for CFD correction calculations. This yielded the distribution relationship between blade chord length and twist angle of the ducted fan under a single operating condition, as well as the corrected incoming flow velocity.
Design variables of ducted fans include the airfoil shape, chord length, and twist angle at each radial section of the propeller blades, as well as duct height, duct diffusion angle, and propeller disk position [9]. One of the difficulties in the design optimization of ducted fans is that variations in each of the aforementioned design variables will influence the output variables, potentially altering the relationship between design variables and outputs. This exhibits highly nonlinear coupling between variables, rendering traditional global optimization methods computationally intensive and prone to non-convergence issues under such coupling. The second difficulty is that the design optimization objectives for ducted fans include not only high lift that meets operational requirements, but also improvements in lift efficiency (total lift/input power) and noise reduction, among others. How to make trade-offs among these multiple objectives and select the optimal solution is a highly challenging problem.
To address the aforementioned challenges, this paper develops a dedicated collaborative design optimization framework for ducted fans, namely the “nonparametric regression response surface + Multi-objective Genetic Algorithm (MOGA)” framework. The core innovation of this framework lies not in the simple superposition of the two technologies, but in targeted breakthroughs and in-depth synergy tailored to the specific challenges of ducted fans. This framework adopts a small-sample-driven nonparametric regression response surface model instead of traditional parametric response surfaces, fully leveraging its advantages of “small sample size, high accuracy, and strong adaptability” to establish a high-precision surrogate model that accurately captures the coupling relationships among “propeller blade parameters, duct structural parameters, and aerodynamic performance”. Building on this foundation, deep synergy with MOGA is realized. By leveraging the model’s high-precision fitting capability, the framework enhances the algorithm’s global search efficacy and multi-objective trade-off capability, thereby efficiently determining the optimal combination of design variables that satisfies multiple optimization objectives. This overcomes the limitations of traditional methods—including local optima trapping and multi-objective imbalance. To ensure the reliability of optimization results, this study further conducted dual validation through CFD simulations and physical prototype experiments, completing a closed-loop design process of “modeling–optimization–verification”. This framework not only specifically addresses the core challenges of multi-variable coupled optimization for ducted fans but also achieves a synergistic balance of “low computational cost, high optimization accuracy, and strong engineering adaptability”. It provides a comprehensive technical solution that is both innovative and practical for the engineering design of ducted fans in future eVTOL and new energy aircrafts.
2. Optimization of the Propeller Section for Ducted Fans
The overall optimization idea of this paper is to first optimize the propeller section of the ducted fan, then optimize the duct structure parameters based on the optimized propeller parameters, and finally obtain an integrated ducted fan that meets the optimization objectives. In this section, under the condition of a fixed duct shape, the propeller section of the ducted fan is optimized. Herein, the duct shape parameters adopt those of the baseline ducted fan: the sectional airfoil is NACA2412, the airfoil chord length is 65 mm, the diffusion angle is 7°, the tip clearance is 1.8 mm, and the propeller disk position is 21 mm. The duct shape is as shown in Figure 1.
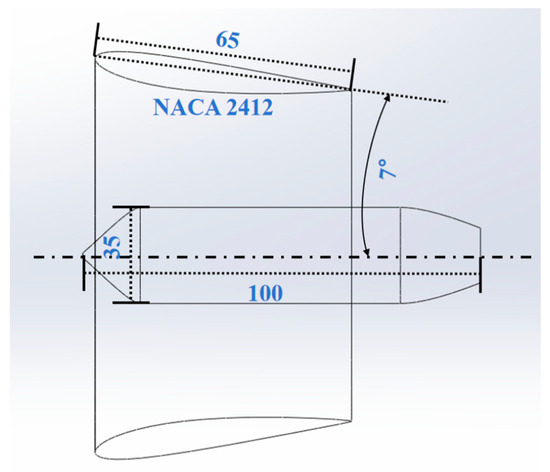
Figure 1.
Duct shape.
2.1. Blade Element Momentum Theory
According to the Blade Element Momentum Theory, the relationship between the blade element force and velocity at a certain cross-section is shown in Figure 2.
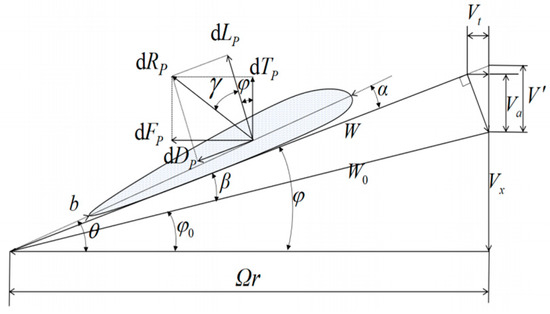
Figure 2.
Relationship between blade element force and velocity.
Propeller design involves determining the distribution of chord length and twist angle across each section under the requirements of the given operating conditions, guided by BEMT and the principle of minimum energy loss [10]. At radial section r, increasing the chord length or altering the twist angle will cause an incremental disturbance ΔΓ to the local circulation ΔΓ. This consequently increases the propeller’s thrust ΔT and torque ΔM. Therefore, the ratio k representing the change in useful work relative to input power is:
where ∆T and ∆M represent, respectively.
Based on the geometric relationships in Figure 2, we obtain
combining the above equations yields
according to the Betz condition for maximum propeller efficiency, the ratio k of the corresponding variation in the useful work of the propeller to the input power must be constant along the blade span. Therefore, the value of determines the distribution relationship of the chord length and twist angle of the blade elements along the radial direction.
2.2. Optimization of the Airfoil
2.2.1. CST Parameterization
To optimize the airfoil, it must first be modeled parametrically to derive optimization parameters describing its geometry. The prevailing airfoil parameterization method is Kulfan’s CST (Class/Shape Transformation) approach [11], which encompasses most airfoil shapes using relatively few design variables. This approach introduces a transformation technique for class functions and shape functions, enabling a precise representation of circular leading edges/tapered trailing edges and other geometric configurations through easily observable physical characteristics and straightforward mathematical functions. Specifically for airfoil parameterization modeling, the class function governs the airfoil type, while the shape function describes the geometry of individual airfoils within the class-controlled family, as expressed mathematically in Equation (6).
where ψ = x/c denotes the dimensionless x–coordinate of the airfoil, ζ = y/c denotes the dimensionless y-coordinate of the airfoil, denotes the dimensionless y-coordinate along the trailing edge of the airfoil, denotes the class function, and S(ψ) denotes the shape function.
The mathematical expressions for the class function and shape function are:
The class function controls the airfoil type via the parameter and . When = 0.5 and = 1.0, the airfoil is a classical NACA airfoil with a rounded leading edge and a sharp trailing edge; when and are both 1.0, the airfoil is a biconvex airfoil.
2.2.2. NeuralFoil Optimization
NeuralFoil is a novel and open-source tool for rapid aerodynamic analysis of airfoils. Its core consists of a physical information neural network trained through tens of millions of XFoil simulations. In terms of airfoil modeling, it supports generating airfoils from a set of (x, y) coordinates or common airfoil dat files. However, at its foundation, it employs the CST (Kulfan) parameterization method mentioned in the previous section to achieve geometric parameterization modeling of airfoils. Through the synergy between NeuralFoil and the CST parameterization method, a real-time interactive optimization framework is established. Users can instantly obtain optimal geometric solutions on the Pareto front by adjusting the weights of objectives such as lift-to-drag ratio and moment coefficient. Simultaneously, NeuralFoil demonstrates significant computational efficiency advantages: single-point analysis is approximately 30 times faster than XFoil, while multi-point analysis is about 1000 times faster, with minimal loss in result accuracy compared to XFoil [12].
It is generally recommended that 4th–10th order Bernstein polynomials be adopted for parameter configuration in the CST parameterization method. NeuralFoil employs 8th order Bernstein polynomials to characterize airfoil geometry. This polynomial order not only provides sufficient degrees of freedom to accurately capture the continuous variation characteristics of the airfoil surface and the geometric details of the high-curvature leading edge, but also effectively avoids the numerical ill-conditioning problems prone to be induced by high-order polynomials. On this basis, NeuralFoil further incorporates the leading-edge modification (LEM) and trailing-edge thickness (TE) parameters introduced by Kulfan in his subsequent optimization of the CST parameterization method [13]. Among these parameters, the LEM parameter can significantly enhance the fitting accuracy of the airfoil leading-edge geometry, rendering it more suitable for the refined modeling of complex aerodynamic configurations. The TE parameter is a key geometric parameter affecting core aerodynamic performance metrics such as the lift-to-drag ratio and moment coefficient, and it effectively addresses the issue of difficult-to-precisely-control trailing-edge characteristics in traditional parameterization methods. Therefore, after comprehensively considering fitting accuracy and computational resources, NeuralFoil ultimately employs 18 parameters (8 design parameters for each of the upper and lower airfoil surfaces + LEM + TE) to fully characterize airfoil geometry; the specific geometric input parameters corresponding to these 18 parameters are illustrated in Figure 3.
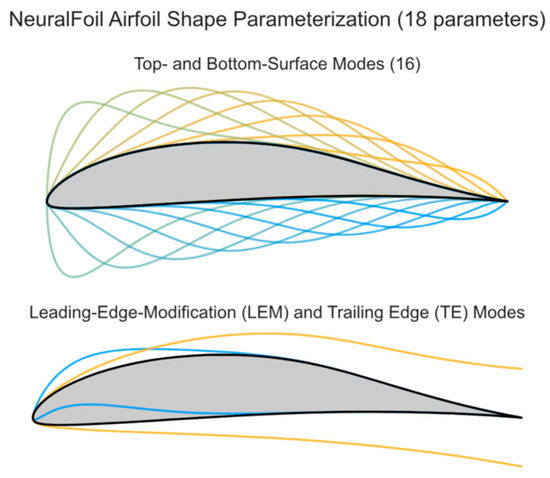
Figure 3.
NeuralFoil geometric input parameters. Reprinted from ref. [12], used under CC BY 4.0.
The inflow velocity at each radial section of the propeller is composed of its rotational velocity and axial velocity. Therefore, the velocity of the propeller varies significantly across different radial sections, especially under high rotational speed conditions. The propeller root is close to the rotating shaft, featuring low linear velocity and bearing large bending moments, which requires airfoils with greater thickness. The middle section of the propeller is the main lift-generating region, demanding airfoils with high lift coefficients and lift–drag ratios. The propeller tip has a high linear velocity, necessitating the design of thinner airfoils to reduce wave drag [14].
Compared with isolated propellers, the duct’s influence on the propeller during the design and optimization stage is mainly reflected in the change in axial velocity at the blade sections. The angle of the inflow velocity at the corresponding sections of ducted fans undergoes a significant change, but this aerodynamic influence caused by the duct mainly affects the spanwise twist angle distribution of the blades and has little impact on the design and optimization of the airfoil. Secondly, the magnitude of the inflow velocity at the corresponding section also increases. Under design conditions, the inflow velocity is a combination of rotational velocity and axial velocity. Although at high rotational speeds, the axial velocity increase due to the duct wall contraction effect has a negligible impact on the total flow velocity magnitude after superposition with the higher linear velocity. Directly applying traditional isolated propeller design optimization methods will lead to compatibility issues such as a sudden drop in the lift–drag ratio and intensified flow separation. This challenge remains unresolved in existing research. To address these issues, this paper proposes a novel Reynolds number correction optimization strategy specific to ducted fans. Building upon NeuralFoil-based airfoil optimization, it innovatively incorporates a Reynolds number correction coefficient into the original optimization framework to adapt to the actual flow field of ducted fans.
The airfoil optimization of NeuralFoil is a multi-point optimization, which aims to minimize the weighted average value of the drag coefficient () under multiple operating conditions of the lift coefficient (). For example, it is required to minimize the weighted average value of under the conditions of = [0.8, 1.0, 1.2, 1.4, 1.5, 1.6] with corresponding weights w = [5, 6, 7, 8, 9, 10]. Therefore, the calculation formula for the corrected Reynolds number Re′ under each optimized operating condition is as follows:
where Re is the reference Reynolds number; is the target lift coefficient, corresponding to the multiple lift coefficient operating conditions specified in the multi-point optimization; is the reference lift coefficient, which is the average value of the multiple target lift coefficients; a is the coupling correction factor, a correction coefficient introduced for the special flow field of the ducted fan to improve the practical adaptability of the Reynolds number. After modification and calibration based on multiple sets of experimental data of ducted fans, it was finally determined that a = 1.08.
The baseline ducted fan features 12 blades, adopting the Clark–Y airfoil commonly used in APC propellers. Its propeller disk diameter is 80 mm, its hub diameter is 35 mm, and kits normal operating rotational speed is n = 18,000 r/min. The root section of the propeller (0–0.3R) retains the baseline airfoil unchanged, with the main optimization focused on the middle section (0.3R–0.7R) and the tip section (0.7R–R). The 0.5R position is selected as the optimization cross-section for the propeller middle part, corresponding to a linear velocity V = 38 m/s, Mach number Ma = 0.11, and Reynolds number Re = 26,012. Similarly, the 0.85R position is chosen as the optimization cross-section for the tip part, corresponding to a linear velocity V = 64 m/s, Mach number Ma = 0.19, and Reynolds number Re = 41,756. The corresponding aerodynamic performance comparison is presented in Figure 4, where the red line represents the baseline airfoil and the blue line denotes the optimized airfoil.
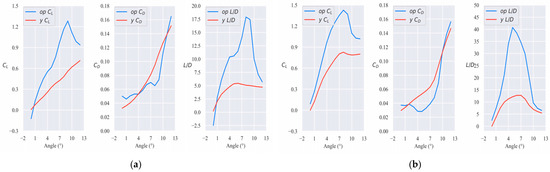
Figure 4.
Comparison of aerodynamic performance between optimized and baseline airfoils—(a) Middle airfoil vs. Baseline airfoil and (b) Tip airfoil vs. Baseline airfoil.
It is important to note that the aforementioned airfoil optimization is based on an improved cross-multi-operating-point optimization framework tailored to the aerodynamic coupling characteristics of ducted fans. This innovative framework can systematically address various issues such as single-point optimization and incompatibility with ducted fans. For instance, excessive optimization targeting a single specified lift coefficient leads to a sharp drop in aerodynamic performance when the airfoil deviates from the actual complex flow field of the duct; it is highly sensitive to operating condition changes, making it difficult to meet the robustness requirements of ducted fans under dynamic operating scenarios. As shown in the optimization results in Figure 4, the airfoils designed and optimized by this framework are more robust with better performance under dynamic actual operating conditions. Therefore, this optimization framework, while achieving high computational efficiency (with multi-point analysis approximately 1000 times faster than XFoil), possesses stronger engineering practicality and universality.
2.2.3. XFoil Validation
XFoil6.99 is an open-source software developed by the Massachusetts Institute of Technology for analyzing the aerodynamic performance of airfoils. It employs the Panel Method to compute aerodynamic parameters and applies compressibility correction theory to refine results. XFoil offers high computational efficiency and accuracy, is well-established, and has undergone extensive experimental validations, earning widespread recognition in both academic and engineering fields [15,16].
To validate the accuracy of NeuralFoil optimization results, XFoil was employed to calculate the lift and drag coefficients of the optimized airfoil under identical operating conditions. These XFoil results were then compared with NeuralFoil’s tip airfoil optimization outcomes. As shown in Figure 5, within the linear lift coefficient range, the discrepancy between the two is negligible. A significant difference only emerges after the airfoil stalls; however, conditions beyond the stall point do not fall within the design operating range. Therefore, the optimization results from NeuralFoil remain reliable.
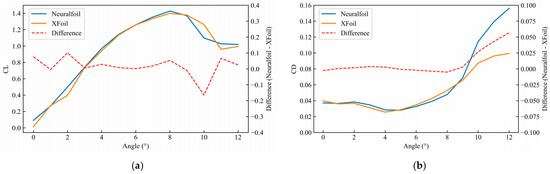
Figure 5.
Optimization results verification—(a) Lift coefficient verification and (b) Drag coefficient verification.
2.3. Optimization of Blade Chord Length and Twist Angle
2.3.1. Response Surface Methodology
Response Surface Methodology(RSM), proposed by Box et al. in 1951, is a method for analyzing and optimizing systems with multiple factors and response variables. Its core principle involves conducting experiments at representative local points through Design of Experiments (DOE), establishing mathematical models, fitting functional relationships between input and output parameters, and seeking optimal combinations of design variables and optimal solutions for response objectives. Compared to orthogonal experimental design, RSM offers advantages such as fewer experimental runs, effective handling of complex nonlinear relationships between design variables and response objectives, and superior predictive capability [17,18].
This study employs Central Composite Design (CCD) as the DOE method adapted for RSM. Its design logic accurately supports the construction of response surface models, fully captures the nonlinear coupling relationships between design variables and response objectives, and is highly compatible with the optimization requirements of ducted fans characterized by multiple variables and strong coupling effects. Meanwhile, the distribution of experimental points in CCD exhibits both comprehensiveness and efficiency: it not only includes factorial points covering the design space but also improves model predictive accuracy through central points (for verifying repeatability) and axial points (for enhancing boundary feature capture). Furthermore, the number of experimental runs in CCD is significantly lower than that of full factorial design, which aligns with the constraint of high computational cost associated with CFD simulations.
This paper employs duct structure parameters and propeller blade parameters as design variables, with the ultimate optimization objective defined as ducted fan lift efficiency. Utilizing BEMT, the radial distribution trend and range of propeller blade parameters can be determined. Subsequently, based on the aforementioned basis, CCD is adopted for DOE, followed by CFD simulations conducted on the design points. A non-parametric regression response surface model is generated based on CFD results. Finally, the optimal solution is obtained using MOGA, with the optimization results validated via CFD simulations. The overall workflow is illustrated in Figure 6.
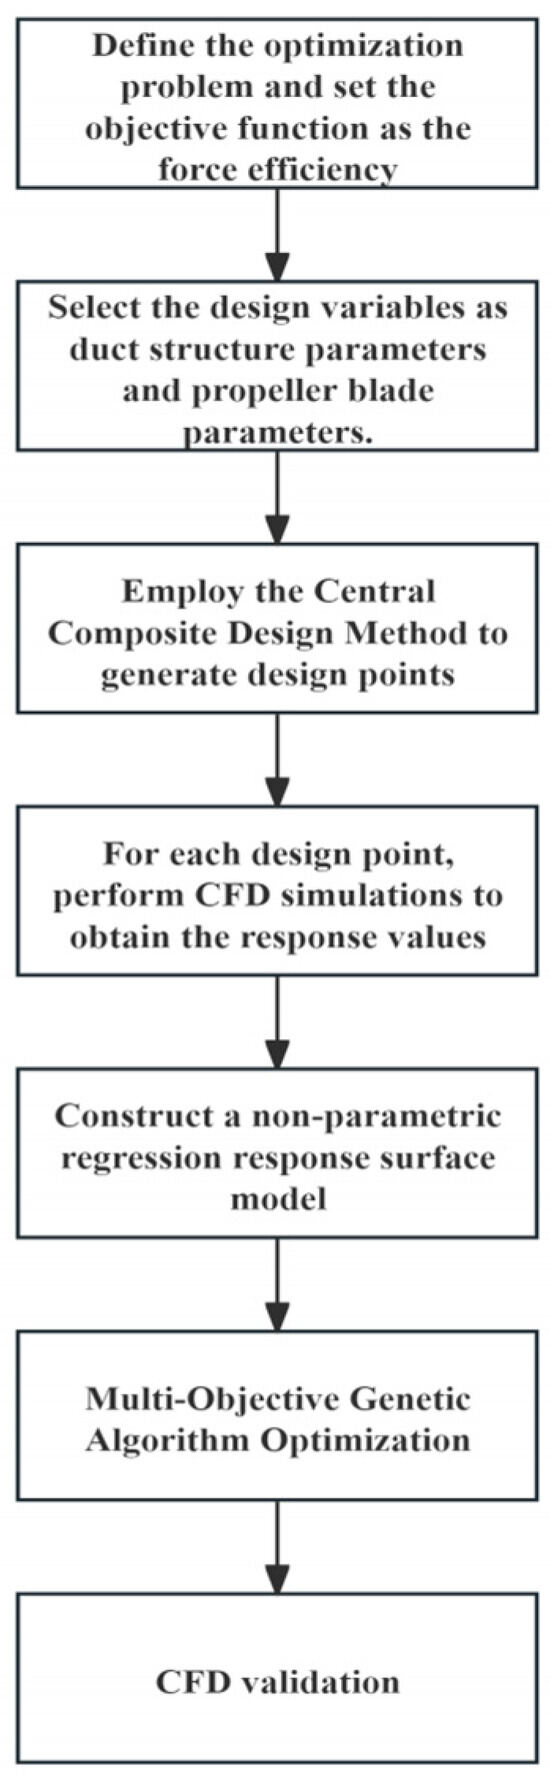
Figure 6.
Ducted fan design optimization workflow.
2.3.2. Response Surface Optimization
Based on the optimized airfoil from Section 2.2.2, a parametric model of the ducted fan was established. Three control sections at 0.2R, 0.5R, and R were selected for modeling. The chord length and twist angle of the airfoil on these control sections were defined as design variables for RSM, comprising six parameters in total. Their corresponding ranges are specified in Equation (10).
Once the type, number, and range of design variables are identified, the CCD method is adopted to generate design points within the design space. Detailed information of these design points, 45 in total, is provided in Table A1 of Appendix A. CFD simulations are performed on these designed points to obtain the corresponding response objectives, namely the values of propeller lift, propeller torque, and duct lift.
The standard k-epsilon model from the vortex-viscosity model was selected for turbulence calculation in this study. As a two-equation model, it is straightforward and readily implementable, while also demonstrating good applicability in handling rotating flows, boundary layer flows with strong reverse pressure gradients, flow separation, and secondary flows. The MRF method was employed to simulate the flow field around the propeller, dividing the computational domain into a stationary region and a rotating region. The rotational speed of the dynamic domain was set at 18,000 r/min. The pressure–velocity coupled equations were solved using the SIMPLE algorithm with a hybrid initialization, running for 2400 steps until convergence was achieved. Propeller lift and torque, along with duct lift values, were monitored throughout.
The stationary domain of the computational domain is a cylinder with a diameter of 30D and a length of 50D, where D denotes the duct propeller disk diameter, i.e., 80 mm. The rotating domain is a cylinder with a diameter of 81 mm and a height of 13 mm. The boundary condition settings are presented in Table 1. The overlapping surface between the stationary domain and the rotating domain is defined as the “Interface” type to ensure the continuous transfer of computational values between the two domains.

Table 1.
Boundary condition settings.
Meshing was performed via the meshing module of the finite element analysis software. Polyhedral core element type was adopted for mesh generation, and the software’s built-in optimization algorithm was utilized to improve mesh quality. Figure 7 shows the local surface mesh of the computational domain. The total number of mesh elements is 3.31 million, with a minimum orthogonal quality of 0.25 and a maximum skewness of 0.7, which meets the requirements for simulation applications.
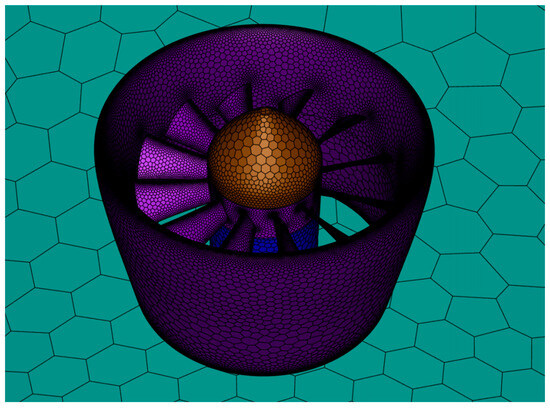
Figure 7.
Local surface mesh of computational domain.
Given the high dimensionality of input variables and strong nonlinear coupling between design variables and response objectives in duct fan design optimization, this study employs nonparametric regression models to construct response surfaces. Compared to traditional parametric response surface models, nonparametric regression response surfaces exhibit “data-driven, structure-free” characteristics. They do not require prior assumptions about variable coupling relationships and can accurately characterize high-dimensional nonlinear systems with minimal samples. This effectively overcomes the reliance on prior assumptions and the limited adaptability of traditional models in scenarios with small sample sizes. The three-dimensional response surface constructed using the nonparametric regression model is shown in Figure 8 (where each design variable assumes the midpoint within its range of values). S1, S2, and S3 cross-sections correspond to the sections at 0.2R, 0.5R, and R, respectively. The characteristics of the three-dimensional surface in Figure 7 reveal significant nonlinear coupling relationships between the two design variables corresponding to each cross-section and the response objective. This not only validates the complexity of variable interactions but also further demonstrates the nonparametric regression model’s capability to accurately capture such strongly coupled characteristics.
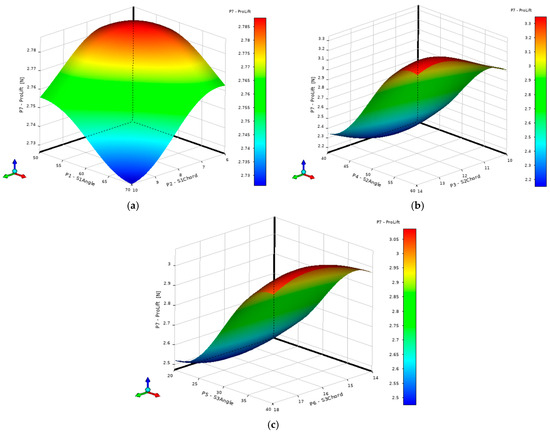
Figure 8.
Response surface of lift and propeller design parameters: (a) S1 cross-section. (b) S2 cross-section. (c) S3 cross-section.
The value of the twist angle of the blade element in the S2 section was changed; the corresponding response surfaces for the S1 and S3 sections are depicted in Figure 9. Through the comparison of Figure 8 and Figure 9, the complex coupling effects among all design variables are confirmed. Altering the S2 section parameters modifies the relationship between the design variables and response variables for the S1 and S3 sections, thereby altering the response surface morphology.
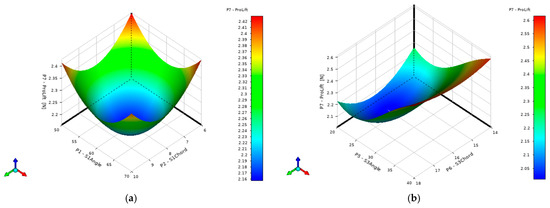
Figure 9.
Morphological variation in response surface—(a) S1 cross-section and (b) S3 cross-section.
The accuracy and reliability of the response surface surrogate model can be evaluated through the value of the coefficient of determination . The closer the coefficient of determination is to 1, the higher the goodness of fit of the response surface, and the better the fitting quality [19]. The coefficients of determination for each output parameter are presented in Table 2. The coefficient of determination indicates that the response surface fitting quality in this optimization is favorable, yielding accurate and reliable prediction results.
Table 2.
Goodness of fit of the response surface.
Based on the aforementioned non-parametric regression response surface model, this paper selects the MOGA as the optimization algorithm. It is a variant of the popular Non-Dominated Sorting Genetic Algorithm II (NSGA–II) which is based on the concept of controlled elites, supporting multiple objectives and constraints, and is capable of searching for Pareto optimal solutions globally [20].
In terms of algorithm configuration, the initial population size was set to 6000 samples, with 1200 new individuals generated per generation through evolution, and the maximum number of iterations was limited to 20 generations.
Assuming that the optimization problem is defined as maximizing the total lift of the ducted fan with no constraints on torque (i.e., without considering lift efficiency), the optimization results obtained by the RSM are presented in Table 3.
Table 3.
Candidate points information.
Assuming that the optimization problem is defined as minimizing the propeller torque and maximizing the overall lift of the ducted fan (i.e., pursuing maximum lift efficiency), the optimization results obtained by the RSM under these objectives and constraints are presented in Table 4.
Table 4.
Candidate points information.
This paper defines the optimization problem and constraints such that the overall lift of the ducted fan is maximized at a given power level. This approach effectively addresses the issue of over-optimization, where pursuing the lift efficiency of the ducted fan leads to insufficient overall lift. Based on experimental data at the design point, the torque range of the propeller is 0.05–0.12 . A value of 0.1 is selected as the power constraint, and the optimal combination of design variables that maximizes the overall lift is solved for. Taking 0.1 as the torque threshold, this value ensures the practical feasibility of the parameters; it not only avoids the issue of insufficient lift that may arise when the torque is too low but also does not reach the upper limit of the torque range (0.12 ). This makes it a reasonable value that balances the power constraint and lift performance. Ultimately, the optimization results obtained via the RSM are presented in Table 5.
Table 5.
Candidate points information.
Candidate point 1 was selected for CFD validation of this optimization result. Considering factors such as physical manufacturing and 3D printing accuracy, the design variable combinations were fine-tuned. The final response target values are shown in Table 6, with the response surface fitted values exhibiting a total lift error of 2.7% and a propeller torque error that is negligible compared to the simulation validation values.
Table 6.
Validation point information.
According to the propeller shaft power calculation formula P = Mω, at rotational speed n = 18,000 r/min and torque M = 0.101 , the corresponding power P = 191 W, yielding lift efficiency λ = 2.75 g/W.
The multi-response objective trade-off for this optimization problem is illustrated in Figure 10, where the x-axis represents propeller lift, the y-axis denotes duct lift, and the z-axis indicates propeller torque. Each discrete data point in the figure is a feasible point, corresponding to a feasible solution obtained during the optimization solution process, and these points together constitute the feasible solution space for the problem. Meanwhile, the different hues of the feasible points in the figure indicate the merit of the corresponding feasible solutions; the cooler the hue of a point (e.g., blue tones), the higher the degree of alignment with the preset optimization objectives.
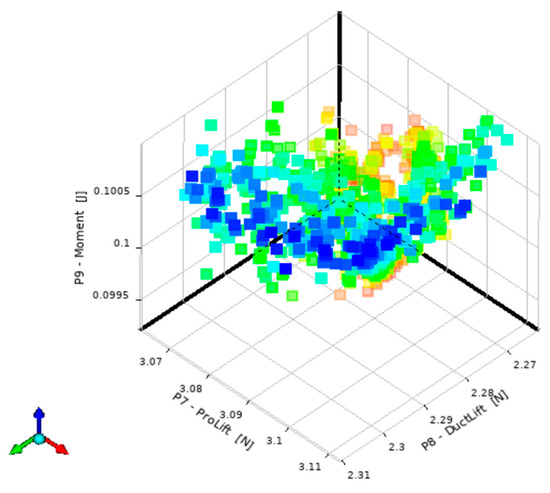
Figure 10.
Multi-objective trade-off diagram for the ducted fan.
3. Optimization of the Duct Section for Ducted Fans
The optimization methodology for the duct section mirrors that of the propeller section. The design variables selected for the RSM are the propeller disk position, duct chord length, and duct expansion angle, comprising three parameters. Their respective ranges are specified in Equation (11).
After defining the design variables for the duct, design points were generated within the design space using the CCD method. Detailed information on these design points, 15 in total, is provided in Table A2 of Appendix A. CFD simulations are performed on these design points to obtain the corresponding response objectives, namely the values of propeller lift, propeller torque and duct lift.
Based on the design point information, the response surface of the propeller lift of the ducted fan, which is influenced by the three design variables and generated using a non-parametric regression model, is shown in Figure 11.
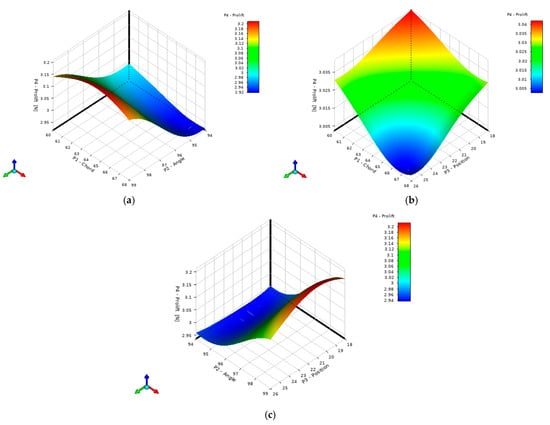
Figure 11.
Response surface of lift and duct design parameters—(a) Chord and Angle, (b) Chord and Position, and (c) Angle and Position.
Based on the aforementioned non-parametric regression response surface model, the MOGA was employed. Similarly, the upper limit of propeller torque was set to 0.1 as the power constraint condition to solve for the combination of design variables when the total lift value is maximized. Finally, the candidate points meeting the optimization objectives provided by MOGA are shown in Table 7.
Table 7.
Candidate points information.
Design parameters for Candidate Point 1 were selected. Considering factors such as physical manufacturing and 3D printing accuracy, the design variable combinations were fine-tuned and validated via CFD simulation. The simulation results are presented in Table 8. The response surface fitted values exhibited a total lift error of 1.8% compared to the simulation-validated values, while the propeller torque error was −1.0%.
Table 8.
Validation point information.
According to the propeller shaft power calculation formula P = Mω, the final optimized power of the ducted fan P = 189 W, with a lift efficiency λ = 2.79 g/W. The power–lift relationship of the baseline ducted fan, measured experimentally, is shown in Table A3 of Appendix A. The curve fitting results are presented in Figure 12. At an operating condition of approximately 189 W power, the baseline ducted fan delivers an overall lift of 3.953 N, with a lift efficiency of 2.08 g/W. The optimized ducted fan achieves a 33.5% increase in overall lift and a 34.1% improvement in lift efficiency.
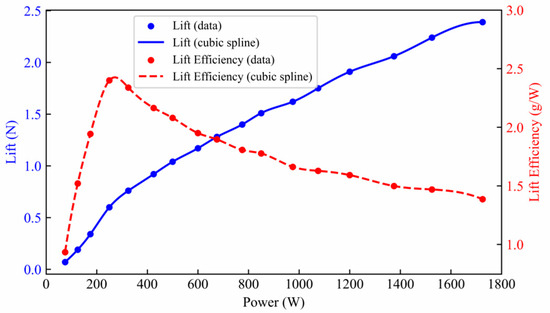
Figure 12.
Aerodynamic performance curves of the baseline ducted fan.
The ducted fan model optimized using the methodology described herein is depicted in Figure 13.
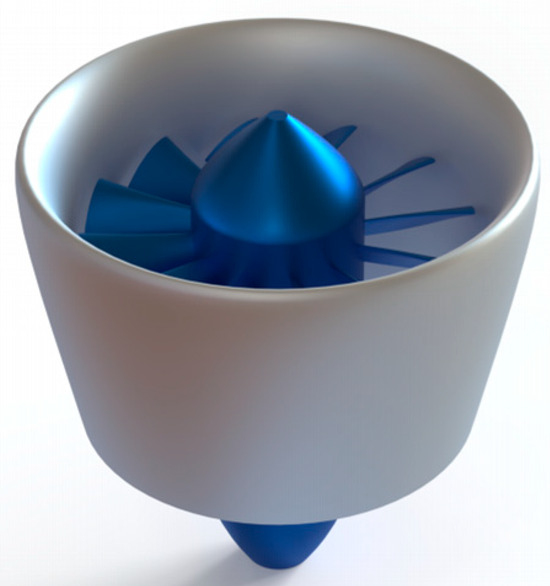
Figure 13.
Model of the ducted fan.
4. Experiments on the Ducted Fan
To validate the aerodynamic performance of the ducted fan designed and optimized using the RSM, the propeller and duct were fabricated using 3D printing technology and tested on an experimental platform. Figure 14 illustrates the experimental setup configuration. The platform employs an STL61–BG300N photoelectric sensor (manufactured by METUOES, China) for rotational speed measurement, featuring a response time below 0.5 s. This sensor generates a small light spot with minimal differential distance and operates within a speed range of 12–99,999 r/min. A DYZ–101 pressure sensor (manufactured by Dayang, China) was employed, featuring a 0–10 kg measurement range and 0.005 kg accuracy, characterized by high precision and dynamic responsiveness.
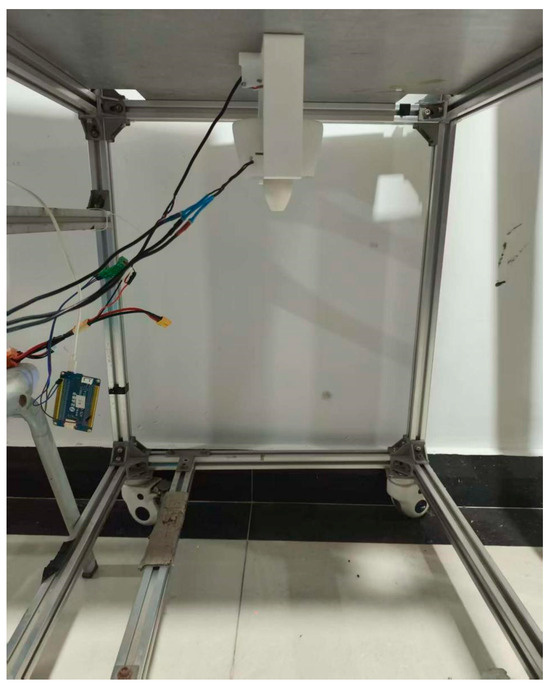
Figure 14.
Experimental platform for the ducted fan.
Experimentally measured aerodynamic performance data for the ducted fan are shown in Figure 15. The aerodynamic performance curve indicates that at motor speed of 18,000 r/min, the ducted fan achieves an overall power of 207 W, total lift of 4.993 N, and a lift efficiency of 2.4 g/W. The measured experimental power differs from the simulated power by 9.5%, potentially due to: (1) Simplification of the simulation geometric model. During the simulation modeling process, we simplified non-critical factors such as the duct inner wall roughness; this simplification resulted in the calculated aerodynamic drag being slightly lower than the actual experimental value. (2) Deviations between experimental conditions and simulation boundary conditions. The simulation adopted the Pressure-inlet boundary condition, which assumes a uniform inlet pressure distribution by default; however, in the experimental environment, the inlet pressure is also affected by factors such as the test bench itself and ambient airflow disturbance. (3) Power losses inherent to the motor itself. The experimentally measured power is the actual operating power, which includes losses such as heat generation from motor internal resistance and bearing friction, whereas the simulation only calculates the aerodynamic power. Consequently, the final experimental group data must be compared with the baseline group at the identical power level of 207 W. As shown in Figure 12, the baseline ducted fan achieves a total lift of 4.555 N and a lift efficiency of 2.18 g/W at 207 W power.
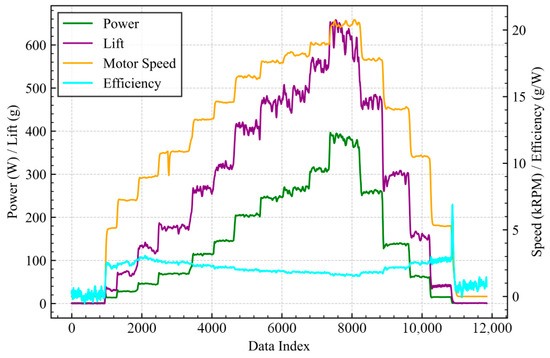
Figure 15.
Experimental data of aerodynamic performance test for the ducted fan.
Finally, the aerodynamic performance data for the experimental, CFD, and baseline groups are presented in Table 9.
Table 9.
Aerodynamic performance data of each group.
The aerodynamic performance differences between the experimental group and other groups are shown in Table 10. The table indicates that, compared to the baseline propeller, the optimized ducted fan achieves a 9.6% increase in total lift and a 9.5% improvement in lift efficiency at the same power output.
Table 10.
Deviation of aerodynamic performance data between the experimental group and other groups.
5. Conclusions
To address the multi-parameter and strong nonlinear aerodynamic coupling characteristics of ducted fans, as well as the issues of traditional optimization methods such as low computational accuracy, high computational cost, difficulty in multi-objective trade-offs, and insufficient adaptability to dynamic operating conditions, this paper proposes an efficient design and optimization method for ducted fans based on RSM, and develops a collaborative design and optimization framework of “nonparametric regression response surface-MOGA”. Through systematic simulation experiments and comparative analysis, the following conclusions were drawn:
- The optimized airfoil derived from the independently developed cross-multi-operating-point optimization module with Reynolds number corrections specific to ducted fans, which is built on the novel open-source tool NeuralFoil, provides a high-quality airfoil foundation for the subsequent collaborative design and optimization framework. This module breaks through the limitations of traditional isolated propeller airfoil optimization, is better adapted to the requirements of ducted fans under dynamic operating conditions, and exhibits more superior aerodynamic performance. For example, the overall lift–drag ratio of the optimized airfoil in the middle region is significantly higher than that of the baseline airfoil, with the maximum lift–drag ratio reaching 3.29 times that of the baseline. Under core design conditions, the maximum relative error between the lift coefficient of the optimized airfoil and the XFoil calculation results does not exceed 5%. This not only verifies the reliability of the optimization module but also proves its engineering value in ducted fan airfoil design, providing an innovative solution for efficient and reliable airfoil optimization of ducted fans.
- Targeting the pain points of ducted fans, such as multi-variable, strong nonlinear coupling characteristics, as well as the large sample demand and poor adaptability to complex relationships of traditional response surface models, this paper selects a small-sample-driven nonparametric regression response surface model. This model exhibits excellent predictive performance, with errors between its predicted values (e.g., lift and torque) and CFD simulation verification results within 3%. Based on this high-precision model, MOGA enhances its global optimization capability and efficiently achieves the multi-objective balance of “propeller lift–duct lift–torque”. The finally optimized ducted fan achieves a 9.6% increase in lift and a 9.5% improvement in power efficiency compared with a commercial ducted fan (i.e., the baseline ducted fan in this study) under the same power condition. This verifies the adaptability and practicality of the collaborative design and optimization framework for ducted fan design, which has significant engineering application value.
- Traditional methods and the correction coefficient design method introduced in References [7,8] fail to fully consider the complex multi-parameter coupling relationships in ducted fans. They can only output a single solution and lack adaptability to actual dynamic operating conditions. In contrast, the collaborative design optimization framework constructed in this paper uses a nonparametric response surface to accurately fit multi-variable coupling relationships and combines with MOGA to efficiently generate a Pareto optimal solution set covering multiple operating conditions. This facilitates decision-makers to flexibly select design schemes according to actual operating conditions, significantly enhancing the adaptability and flexibility of ducted fan design and optimization.
Author Contributions
Conceptualization, W.G. and K.F.; methodology, W.G. and K.F.; validation, K.F.; investigation, K.F. and H.C.; resources, H.C.; data curation, W.G. and K.F.; writing—original draft preparation, W.G. and K.F.; writing—review and editing, W.G., K.F. and H.C.; visualization, K.F.; supervision, W.G. and H.C.; project administration, H.C. All authors have read and agreed to the published version of the manuscript.
Funding
This research received no external funding.
Data Availability Statement
The original contributions presented in the study are included in the article, further inquiries can be directed to the corresponding author.
Conflicts of Interest
The authors declare no conflicts of interest.
Appendix A
Table A1.
Design points information of propeller section optimization for the ducted fan.
Table A1.
Design points information of propeller section optimization for the ducted fan.
| S1 Angle | S1 Chord | S2 Angle | S2 Chord | S3 Angle | S3 Chord | Prolift | Ductlift | Torque |
|---|---|---|---|---|---|---|---|---|
| 60.000 | 8.000 | 50.000 | 12.000 | 30.000 | 16.000 | 2.778 | 1.931 | 0.082 |
| 50.000 | 8.000 | 50.000 | 12.000 | 30.000 | 16.000 | 2.790 | 1.952 | 0.083 |
| 70.000 | 8.000 | 50.000 | 12.000 | 30.000 | 16.000 | 2.758 | 1.904 | 0.081 |
| 60.000 | 6.000 | 50.000 | 12.000 | 30.000 | 16.000 | 2.792 | 1.950 | 0.083 |
| 60.000 | 10.000 | 50.000 | 12.000 | 30.000 | 16.000 | 2.753 | 1.916 | 0.081 |
| 60.000 | 8.000 | 50.000 | 10.000 | 30.000 | 16.000 | 2.655 | 1.839 | 0.076 |
| 60.000 | 8.000 | 50.000 | 14.000 | 30.000 | 16.000 | 2.872 | 2.001 | 0.088 |
| 60.000 | 8.000 | 40.000 | 12.000 | 30.000 | 16.000 | 2.169 | 1.531 | 0.058 |
| 60.000 | 8.000 | 60.000 | 12.000 | 30.000 | 16.000 | 3.245 | 2.282 | 0.111 |
| 60.000 | 8.000 | 50.000 | 12.000 | 20.000 | 16.000 | 2.488 | 1.501 | 0.067 |
| 60.000 | 8.000 | 50.000 | 12.000 | 40.000 | 16.000 | 3.064 | 2.299 | 0.102 |
| 60.000 | 8.000 | 50.000 | 12.000 | 30.000 | 14.000 | 2.770 | 1.900 | 0.081 |
| 60.000 | 8.000 | 50.000 | 12.000 | 30.000 | 18.000 | 2.787 | 1.948 | 0.083 |
| 54.220 | 6.844 | 44.220 | 10.844 | 24.220 | 14.844 | 2.233 | 1.459 | 0.057 |
| 65.780 | 6.844 | 44.220 | 10.844 | 24.220 | 17.156 | 2.210 | 1.447 | 0.057 |
| 54.220 | 9.156 | 44.220 | 10.844 | 24.220 | 17.156 | 2.200 | 1.447 | 0.056 |
| 65.780 | 9.156 | 44.220 | 10.844 | 24.220 | 14.844 | 2.194 | 1.388 | 0.055 |
| 54.220 | 6.844 | 44.220 | 13.156 | 24.220 | 17.156 | 2.312 | 1.555 | 0.062 |
| 65.780 | 6.844 | 44.220 | 13.156 | 24.220 | 14.844 | 2.325 | 1.503 | 0.061 |
| 54.220 | 9.156 | 44.220 | 13.156 | 24.220 | 14.844 | 2.315 | 1.500 | 0.061 |
| 65.780 | 9.156 | 44.220 | 13.156 | 24.220 | 17.156 | 2.286 | 1.493 | 0.061 |
| 54.220 | 6.844 | 55.780 | 10.844 | 24.220 | 17.156 | 2.825 | 1.851 | 0.084 |
| 65.780 | 6.844 | 55.780 | 10.844 | 24.220 | 14.844 | 2.791 | 1.792 | 0.083 |
| 54.220 | 9.156 | 55.780 | 10.844 | 24.220 | 14.844 | 2.800 | 1.804 | 0.082 |
| 65.780 | 9.156 | 55.780 | 10.844 | 24.220 | 17.156 | 2.759 | 1.778 | 0.081 |
| 54.220 | 6.844 | 55.780 | 13.156 | 24.220 | 14.844 | 3.003 | 1.978 | 0.094 |
| 65.780 | 6.844 | 55.780 | 13.156 | 24.220 | 17.156 | 2.998 | 1.962 | 0.094 |
| 54.220 | 9.156 | 55.780 | 13.156 | 24.220 | 14.844 | 2.988 | 1.977 | 0.094 |
| 65.780 | 9.156 | 55.780 | 13.156 | 24.220 | 17.156 | 2.974 | 1.909 | 0.092 |
| 54.220 | 6.844 | 44.220 | 10.844 | 35.780 | 14.844 | 2.600 | 1.911 | 0.077 |
| 65.780 | 6.844 | 44.220 | 10.844 | 35.780 | 14.844 | 2.569 | 1.862 | 0.074 |
| 54.220 | 9.156 | 44.220 | 10.844 | 35.780 | 14.844 | 2.560 | 1.864 | 0.074 |
| 65.780 | 9.156 | 44.220 | 10.844 | 35.780 | 17.156 | 2.564 | 1.908 | 0.072 |
| 54.220 | 6.844 | 44.220 | 13.156 | 35.780 | 14.844 | 2.631 | 1.928 | 0.079 |
| 65.780 | 6.844 | 44.220 | 13.156 | 35.780 | 17.156 | 2.631 | 1.948 | 0.080 |
| 54.220 | 9.156 | 44.220 | 13.156 | 35.780 | 17.156 | 2.642 | 1.947 | 0.080 |
| 65.780 | 9.156 | 44.220 | 13.156 | 35.780 | 14.844 | 2.609 | 1.894 | 0.077 |
| 54.220 | 6.844 | 55.780 | 10.844 | 35.780 | 14.844 | 3.157 | 2.314 | 0.106 |
| 65.780 | 6.844 | 55.780 | 10.844 | 35.780 | 17.156 | 3.179 | 2.325 | 0.107 |
| 54.220 | 9.156 | 55.780 | 10.844 | 35.780 | 17.156 | 3.183 | 2.344 | 0.107 |
| 65.780 | 9.156 | 55.780 | 10.844 | 35.780 | 14.844 | 3.123 | 2.260 | 0.103 |
| 54.220 | 6.844 | 55.780 | 13.156 | 35.780 | 17.156 | 3.322 | 2.465 | 0.118 |
| 65.780 | 6.844 | 55.780 | 13.156 | 35.780 | 14.844 | 3.284 | 2.402 | 0.114 |
| 54.220 | 9.156 | 55.780 | 13.156 | 35.780 | 14.844 | 3.276 | 2.409 | 0.115 |
| 65.780 | 9.156 | 55.780 | 13.156 | 35.780 | 17.156 | 3.297 | 2.419 | 0.115 |
Table A2.
Design points information of duct section optimization for the ducted fan.
Table A2.
Design points information of duct section optimization for the ducted fan.
| Chord Length | Duct Diffusion Angle | Propeller Disk Position | Prolift Ductlift | Torque | |
|---|---|---|---|---|---|
| 64.000 | 6.500 | 22.000 | 3.016 | 2.206 | 0.100 |
| 60.000 | 6.500 | 22.000 | 3.034 | 2.138 | 0.100 |
| 68.000 | 6.500 | 22.000 | 3.019 | 2.266 | 0.100 |
| 64.000 | 4.000 | 22.000 | 2.945 | 2.151 | 0.099 |
| 64.000 | 9.000 | 22.000 | 3.211 | 2.165 | 0.100 |
| 64.000 | 6.500 | 18.000 | 3.034 | 2.191 | 0.100 |
| 64.000 | 6.500 | 26.000 | 3.008 | 2.187 | 0.099 |
| 60.748 | 4.467 | 18.748 | 2.974 | 2.113 | 0.100 |
| 67.252 | 4.467 | 18.748 | 2.925 | 2.238 | 0.099 |
| 60.748 | 8.533 | 18.748 | 3.141 | 2.090 | 0.101 |
| 67.252 | 8.533 | 18.748 | 3.163 | 2.092 | 0.102 |
| 60.748 | 4.467 | 25.252 | 2.987 | 2.077 | 0.099 |
| 67.252 | 4.467 | 25.252 | 2.927 | 2.207 | 0.098 |
| 60.748 | 8.533 | 25.252 | 3.107 | 2.141 | 0.101 |
| 67.252 | 8.533 | 25.252 | 3.120 | 2.195 | 0.100 |
Table A3.
The power–lift relationship of the baseline ducted fan.
Table A3.
The power–lift relationship of the baseline ducted fan.
| Power | Lift | Current | Voltage | Lift Efficiency |
|---|---|---|---|---|
| 75 | 0.7 | 3 | 25 | 0.933 |
| 125 | 1.9 | 5 | 25 | 1.520 |
| 175 | 3.4 | 7 | 25 | 1.943 |
| 250 | 6.0 | 10 | 25 | 2.400 |
| 325 | 7.6 | 13 | 25 | 2.338 |
| 425 | 9.2 | 17 | 25 | 2.165 |
| 500 | 10.4 | 20 | 25 | 2.080 |
| 600 | 11.7 | 24 | 25 | 1.950 |
| 675 | 12.8 | 27 | 25 | 1.896 |
| 775 | 14.0 | 31 | 25 | 1.806 |
| 850 | 15.1 | 34 | 25 | 1.776 |
| 975 | 16.2 | 39 | 25 | 1.662 |
| 1075 | 17.5 | 43 | 25 | 1.628 |
| 1200 | 19.1 | 48 | 25 | 1.592 |
| 1375 | 20.6 | 55 | 25 | 1.498 |
| 1525 | 22.4 | 61 | 25 | 1.469 |
| 1725 | 23.9 | 69 | 25 | 1.386 |
References
- Li, Z.; Wu, J.; Lin, H. Numerical analysis of the effect of ducted propeller configuration parameters on aerodynamic performance. J. Phys. Conf. Ser. 2022, 2361, 012022. [Google Scholar] [CrossRef]
- Zeng, P.; Wei, W.; Shi, S.; Yang, Y. Numerical Simulation Study on Aerodynamic Characteristics of 350 kW–Class Ducted Fan. J. Eng. Therm. Energy Power 2024, 39, 61–70. [Google Scholar]
- Ye, K.; Ye, Z.; Qu, Z. Method of Ducted Aerodynamic Optimization Design. J. Aerosp. Power 2013, 28, 1828–1835. [Google Scholar]
- Stubblefield, J.M. Numerically–Based Ducted Propeller Design Using Vortex Lattice Lifting Line Theory. Ph.D. Thesis, Massachusetts Institute of Technology, Cambridge, MA, USA, 2008. [Google Scholar]
- Kerwin, J.E.; Coney, W.; Hsin, C. Optimum circulation distributions for single and multi–component propulsors. In Proceedings of the American Towing Tank Conference, 21st, Washington, DC, USA, 5–7 August 1986. [Google Scholar]
- Guo, J.; Zhou, Z.; Li, X. An Efficient Design Method for Ducted Propeller Blades. Acta Aeronaut. Astronaut. Sin. 2022, 43, 89–99. [Google Scholar]
- Guo, J.; Zhou, Z.; Fan, Z. An Efficient Propeller Design Method Coupled with CFD Correction. Acta Aeronaut. et Astronaut. Sin. 2020, 41, 67–76. [Google Scholar]
- Kong, F.; Feng, Z. Ducted Propeller Multi–Operating Condition Design. Sci. Technol. Eng. 2024, 24, 6510–6517. [Google Scholar]
- Ji, L.; Li, J.; Fang, Y. Aerodynamic Characteristics and Parameter Optimization Design of Ducted Fan. Sci. Technol. Eng. 2019, 19, 245–251. [Google Scholar]
- Liu, P. Air Propeller Theory and Its Application; Beihang University Press: Beijing, China, 2006. [Google Scholar]
- Kulfan, B.M. Universal parametric geometry representation method. J. Aircr. 2008, 45, 142–158. [Google Scholar] [CrossRef]
- Sharpe, P.; Hansman, R.J. NeuralFoil: An airfoil aerodynamics analysis tool using physics–informed machine learning. arXiv 2025, arXiv:2503.16323. [Google Scholar]
- Kulfan, B.M. Recent extensions and applications of the ‘CST’ universal parametric geometry representation method. Aeronaut. J. 2010, 114, 157–176. [Google Scholar] [CrossRef]
- Xu, Z.; Tang, S.; He, M.; Zan, B.; Cao, D. Propeller Aerodynamic Parameters and Aircraft Integrated Design Technology. Acta Aerodyn. Sin. 2023, 41, 88–99. [Google Scholar]
- Morgado, J.; Vizinho, R.; Silvestre, M.; Páscoa, J. XFOIL vs CFD performance predictions for high lift low Reynolds number airfoils. Aerosp. Sci. Technol. 2016, 52, 207–214. [Google Scholar] [CrossRef]
- Cestino, E. Design of solar high altitude long endurance aircraft for multi payload & operations. Aerosp. Sci. Technol. 2006, 10, 541–550. [Google Scholar] [CrossRef]
- Xiong, J.; Qiao, Z.; Han, Z. Application Research of Response Surface Methodology in Aerodynamic Optimization Design of Transonic Airfoils. J. Northwestern Polytech. Univ. 2006, 24, 232–236. [Google Scholar]
- Deng, L.; Qiao, Z.; Xiong, J.; Yang, X. Multi–Objective Inverse Design Method for Natural Laminar Flow Airfoils. Acta Aeronaut. et Astronaut. Sin. 2010, 31, 1373–1378. [Google Scholar]
- Yang, J.; Zhou, Z.; Lin, X.; Deng, X.; Wang, J.; Zheng, Y. Multi–Objective Joint Optimization Design of High–Precision Turn–Mill Compound Machine Tool Bed Based on Non–Parametric Regression Response Surface Methodology. Manuf. Technol. Mach. Tool 2024, 128–133. [Google Scholar] [CrossRef]
- Jiang, J.; Cai, H.; Ma, C.; Qian, Z.; Chen, K.; Wu, P. A ship propeller design methodology of multi–objective optimization considering fluid–structure interaction. Eng. Appl. Comput. Fluid Mech. 2018, 12, 28–40. [Google Scholar] [CrossRef]


Disclaimer/Publisher’s Note: The statements, opinions and data contained in all publications are solely those of the individual author(s) and contributor(s) and not of MDPI and/or the editor(s). MDPI and/or the editor(s) disclaim responsibility for any injury to people or property resulting from any ideas, methods, instructions or products referred to in the content. |
© 2026 by the authors. Licensee MDPI, Basel, Switzerland. This article is an open access article distributed under the terms and conditions of the Creative Commons Attribution (CC BY) license.