Abstract
Urban helicopter activity is intermittent and route-focused, yet most strategic mapping tools were developed for fixed-wing traffic and long-term averages, leaving urban rotorcraft noise under-represented. In the EU, the Environmental Noise Directive (2002/49/EC) and its CNOSSOS-EU methods require Member States to measure, map, and report aviation noise at major airports (using indicators such as Lden and Lnight), covering helicopter operations as part of overall aviation noise; yet current practice and tooling remain largely fixed-wing oriented. To the authors’ knowledge, no peer-reviewed real-case applications of NORAH2 to urban helicopter operations have yet been published. Therefore, this study demonstrates an end-to-end NORAH2 workflow using Cannes, France, as an urban case study, modelling 556 helicopter operations recorded between 12 and 25 May 2025 over an 8.3 km × 2.5 km analysis grid, and utilising openly available ADS-B/Mode-S trajectories to generate noise-related maps that can be used to support policy-making. Radar trajectories were conditioned to retain sampling while ensuring kinematic plausibility; environmental layers (terrain, land cover, basic meteorology) and rotorcraft representations were configured in NORAH2. Standard indicators were produced on a uniform grid, Lden (day–evening–night) and LAeq, 16 h, alongside event-count metrics (N60/N65/N70) and single-event LAmax footprints. Over a two-week window, outputs exhibited coherent corridor-level structure and event footprints consistent with observed operations, indicating that ADS-B-derived trajectories, after light conditioning, are suitable inputs for urban NORAH2 mapping. The period analysed is short; results are demonstrative for that window and not intended as statutory exposure assessments. The contribution is twofold: (i) the first published demonstration that connects open radar-like data to NORAH2 outputs in a dense urban setting, and (ii) evidence that NORAH2 can provide both energy-average and frequency-of-occurrence views useful for city noise management.
1. Introduction
NORAH2 (NOise of Rotorcraft Assessed by a Hemisphere approach, version 2), released by EASA in December 2024, is the first dedicated European tool for helicopter noise modelling. It provides decision-grade outputs for the measurement and reporting of rotorcraft noise, supporting the development of more effective noise management policies. NORAH2 computes sound levels by sampling pre-computed acoustic hemispheres along each trajectory point. For every rotorcraft type and each combination of speed and vertical angle, a dedicated hemisphere encodes the full 3-D directivity—i.e., how the aircraft radiates sound in all directions for that specific flight condition.
1.1. Policy Context and Motivation
Environmental noise is a major public health concern in Europe, with well-established links to annoyance, sleep disturbance, and cardiovascular effects. The Environmental Noise Directive (2002/49/EC, END) provides the policy framework for the strategic assessment and management of noise exposure from major transport sources, including roads, railways, airports, and agglomerations [1]. Under this directive, Member States must produce strategic maps and action plans every five years using harmonised metrics, most notably for the day–evening–night level (Lden) and for the night-time level (Lnight), as well as consistent assessment methods defined by CNOSSOS-EU [2,3].
While END explicitly includes helicopters within the definition of “aircraft,” the obligation to map noise only applies to “major airports” with more than 50,000 movements per year. Many heliports and corridors fall below this threshold, even though community annoyance depends strongly on event characteristics such as maximum levels, tonality, and intermittency, rather than on total annual counts. In practice, helicopter noise is often under-represented in official assessments, leaving affected communities without the same transparency as those exposed to road or rail noise.
ICAO Certification standards administered by EASA provide another regulatory dimension. Helicopters are certified under specific chapters (e.g., Chapter 8, for helicopters over 3175 kg maximum certificated take-off mass, and Chapter 11, for helicopters with or less than 3175 kg MTOW—ICAO Annex 16, Volume I—for defined flight phases (take-off, flyover, approach), but these conditions do not fully capture real-world operations such as hovering, low-altitude manoeuvres, or complex terrain interactions [4,5]. Moreover, fixed-wing-oriented modelling tools used in standard aircraft noise mapping often fail to represent rotorcraft directivity or mode-specific emissions.
The gap is therefore clear: robust, transparent tools are needed to model helicopter operations with sufficient fidelity to support regulatory metrics, planning, and community engagement. NORAH2 addresses this by segmenting trajectories into operational modes, coupling them to rotorcraft-specific noise hemispheres, and producing gridded exposure metrics (e.g., LAeq, Lden, Lnight, and number of events above certain levels—N60, N65, N70) that are compatible with EU reporting. In parallel, the rapid emergence of Urban Air Mobility (UAM) and eVTOL concepts reinforces the urgency of consistent, rotorcraft-aware noise prediction for urban settings.
Against this background, the present study sets out specific objectives and scope, described in Section 1.2.
1.2. Research Scope
The main objective of this study is to demonstrate the capability of NORAH2 to model helicopter noise in an urban airspace, using the case of Cannes, France. A secondary objective is to assess the suitability of open flight radar data, specifically ADS-B trajectories from the OpenSky Network [6], as an input source for noise assessments. Together, these elements provide a reproducible pipeline that links open traffic data to mode-specific rotorcraft noise modelling.
The scope of the work includes the following:
- reconstructing trajectories from ADS-B archives and converting those to form NORAH2 input files;
- generating noise contours for standard regulatory metrics over a georeferenced basemap of the study area;
- illustrating the potential of these outputs to inform discussions on helicopter noise in the context of urban noise management.
Certain aspects are purposely excluded. For instance, population exposure calculations (number of people or households per noise band) are not presented here, although this process is straightforward once contours are available. Likewise, validation using dedicated microphone measurements is outside the present scope, as it depends more on site-specific circumstances than on NORAH2’s capabilities.
By focusing on the methodological pipeline and the resulting exposure maps, the study aims to generate example noise contours from reconstructed helicopter trajectories. These contours are not presented as official exposure maps, but as a demonstration of how rotorcraft operations can be represented within established regulatory metrics. In this way, the work illustrates the feasibility of integrating helicopter noise into wider urban noise analyses, using reproducible methods that combine open traffic data with NORAH2 modelling.
2. Literature Review
2.1. Regulatory Context and Indicators
While END enabled pan-European assessments and encouraged action planning, early evaluations noted large differences in how Member States applied interim methods, limiting comparability and reliability of aggregated European datasets [7,8].
To overcome these divergences, the European Commission developed CNOSSOS-EU (Common Noise Assessment Methods in Europe), a harmonised methodological framework covering road, rail, air, and industrial sources. CNOSSOS-EU provides detailed procedures for source emission modelling, sound propagation, and indicator calculation, and has been mandatory since the 2018 reporting round. Its design aimed to strengthen consistency, transparency, and scientific credibility across Member States [9].
Despite this progress, challenges remain in terms of input data quality, methodological complexity, and uneven local capacity for implementation. Studies highlight that CNOSSOS-EU has significantly advanced harmonisation, but uncertainties and operational difficulties still affect its ability to fully support health-oriented policy development [8]. The evolution from END to CNOSSOS-EU therefore reflects both the ambition and the ongoing challenges of building a coherent European regulatory framework for noise assessment.
2.2. Aircraft (Fixed-Wing)
Within the EU framework, CNOSSOS-EU standardises noise from road, rail, and industry, but when it comes to aircrafts, it explicitly defers to ECAC Doc. 29 [10,11,12,13]. CNOSSOS recommended ECAC Doc 29, 3rd edition [10] together with the ICAO Aircraft Noise and Performance (ANP) database for incorporation into Annex II of the END (2002/49/EC). This linkage was reinforced in the 4th edition (2016) of ECAC Doc. 29 [11,12,13], which provides a full applications guide, the standard calculation method, and verification cases.
At its core, Doc 29 specifies a segmented flight profile approach: aircraft operations are broken into discrete flight segments (climb, approach, etc.), each with associated thrust and configuration. For each segment, noise–power–distance (NPD) curves from the ICAO ANP database are used to predict sound exposure levels at ground receivers, with propagation corrections for distance, atmospheric absorption and ground effects. Contours are then constructed by aggregating events across operations. To ensure robustness, Doc 29 includes a suite of verification cases so that different software implementations yield consistent results [12], and validation is achieved by comparing modelled contours with measurements from airport monitoring systems [4,14].
Several major modelling platforms implement Doc 29. ANCON (UK CAA) is used for statutory contouring in the UK, calibrated against extensive radar and monitor data [14]. AEDT (FAA, successor to INM) is now Doc-29-compliant and widely applied by consultants in Europe [15]. At the European ATM research level, EUROCONTROL’s IMPACT is the recommended Doc-29 platform within SESAR (Single European Sky ATM Research) projects [16,17]. For EU-wide policy assessments, STAPES enables multi-airport scenario modelling under Doc 29 [18]. These schemes differ in scope—ANCON as a national operational tool, AEDT as an international multi-impact platform, IMPACT/STAPES for European research and policy—but they all rely on the same reference method. Advances in Doc 29 (e.g., updated ANP data, novel procedures) are incorporated into these engines, ensuring that improvements in scientific understanding percolate to operational studies.
2.3. Helicopters and Rotorcraft
CNOSSOS explicitly recognises that, unlike fixed-wing aircraft, there is no internationally agreed helicopter noise calculation method suitable for END reporting. As an interim compromise, it recommends applying the fixed-wing contour framework to helicopters but with helicopter-specific noise/performance data, while calling for a dedicated rotorcraft method and data resource in the longer term [2].
Before NORAH, two families of models were commonly used. The Heliport Noise Model (HNM) (FAA) extended the fixed-wing NPD workflow to rotorcraft for heliport studies and remained widely cited/used in practice, but it depended on limited type-specific data and lacked a pan-EU verification/validation regime aligned with END/CNOSSOS [19,20]. In research and some operational analyses, NASA’s Rotorcraft Noise Model (RNM) represented sources as measured or computed sound hemispheres and predicted single-event footprints and cumulative metrics. RNM demonstrated good validation on campaigns (including tiltrotor) but, again, is not coupled to an EU-maintained database/verification suite for strategic mapping [21]. Note that Nord2000 is a propagation framework (not a rotorcraft source model); it is often used as the reference outdoor propagation scheme in validations because of its documented accuracy for a broad range of meteorological/ground conditions [22].
NORAH2 addresses those gaps with a hemisphere-based source methodology plus a corresponding database [5]. Importantly, the novelty of NORAH2 lies not in the hemispherical source concept itself, but in its integration into a CNOSSOS-compliant, database-driven, and verifiable framework suitable for strategic noise mapping.
In brief: (1) each rotorcraft/type/condition is characterised by hemispherical source directivity (spectral levels versus emission angle); (2) a 4-D trajectory is discretised into time steps with associated speed/attitude; (3) for each step, interpolation on the hemisphere yields the emitted spectrum toward the receiver; (4) outdoor propagation to the ground receiver is applied (with standard terms for geometric spreading, atmospheric absorption, ground, and meteorology, validated in practice via Nord2000); (5) the resulting time histories are integrated to single-event metrics such as SEL and LAmax, and can be aggregated to longer-term indicators (e.g., Lden, NAx) [5,22,23]. This design gives single-event fidelity (needed for route-focused, low-altitude operations) while creating a shareable database and verification path (the key hurdles CNOSSOS identified [2]).
NORAH2 is fully compliant with CNOSSOS in its propagation treatment and documentation: it integrates a CNOSSOS-EU-based diffraction scheme within a newly combined propagation block (with ground reflection), and this implementation was independently re-implemented and peer-reviewed to remove ambiguities and ensure conformity with the latest EC/ISO texts [24,25]. Validation consists of certification checks for new helicopter types plus a like-for-like comparison with a Nord2000-based reference. Agreement is generally good for strategic-mapping cases, with larger differences limited to heavily screened or long-range, low-noise situations—compatible with END/CNOSSOS single-event and long-term metrics [24]. In parallel, the EASA project brief records the upgrade goals that underpin this compliance, extending propagation to urban/terrain/vegetation and weather contexts, implementing the revised method in the NORAH prototype, and validating the model against benchmark data, so Member States can deploy a CNOSSOS-consistent rotorcraft path alongside road, rail and industry [5].
In regard to UAM/VTOL (rotorcraft-like but not helicopters), recent evidence includes a controlled laboratory study deriving single-event dose–response curves from measured recordings of multicopter drones, one UAM air taxi, and helicopters [26]. Complementary NASA psychoacoustic studies show that attributes such as tonality and roughness materially affect perceived annoyance of UAM sounds, supporting the use of event-based metrics alongside long-term averages in urban contexts [27,28].
3. Methods
This section describes the procedures applied to process ADS-B trajectories, convert coordinates, segment operations, optimise positional, speed, and altitude profiles, and prepare model inputs for NORAH2. The sequence of steps was designed to ensure reproducibility and transparency in helicopter noise modelling.
3.1. Study Area: Cannes Coastal Corridor
Cannes is a coastal city on the French Riviera (Côte d’Azur) in the Alpes-Maritimes department of southeastern France. Its municipal population is about 74,000 inhabitants [29]. Cannes is internationally recognised for the annual Film Festival, which attracts thousands of visitors and major figures in the film industry.
Helicopter transfers along the Riviera and especially during the film festival period generate recurring community concerns due to low-altitude operations near coastal neighbourhoods. A Le Monde feature (May 2023) described the “incessant buzz” of rotorcraft as an entrenched part of mobility in the region [30]. The article underscored a striking contrast: while helicopters enable rapid transfers between Nice, Monaco, Cannes, and inland estates, they also generate persistent annoyance among coastal residents. This juxtaposition of glamour, accessibility, and disturbance positions Cannes as a relevant case where environmental questions converge with social perception. Such reports highlight the need to test whether modern noise-modelling tools can provide evidence beyond anecdotal accounts.
Helicopters often operate at lower altitudes and closer to populated areas compared to fixed-wing aircraft, creating distinct exposure patterns. Yet systematic quantification of helicopter noise exposures remains limited. This absence of noise exposure information provided the motivation for a proof-of-concept study: translating helicopter operations into mapped metrics using the NORAH2 model.
The study period coincided with the Cannes Film Festival 2025 (12–25 May), when helicopter transfers typically play a prominent role in the noise landscape. The analysis was deliberately scoped to a representative coastal corridor of Cannes, an 8.3 km × 2.5 km grid extending from the Cannes–Mandelieu helicopter base along the shoreline to Pointe Croisette, rather than to the entire commune. This subset was selected because most movements during the study period occurred over this area, with the most affected receptors located in coastal neighbourhoods. The intention was to demonstrate NORAH2’s end-to-end workflow (from trajectory sourcing to mapped metrics), not to produce a comprehensive city-wide noise map. Results should therefore be interpreted as illustrative of method and capability, with the approach readily extensible to a wider study.
Figure 1 presents an overview of the study grid (in red) superimposed on the Cannes coastline, with helicopter trajectories (in yellow) recorded during the two-week study period, highlighting the concentration of operations between the Cannes–Mandelieu heliport and the Port de Cannes helipad. Operations extended beyond the study area to avoid boundary-related noise level artifacts (end of yellow lines).
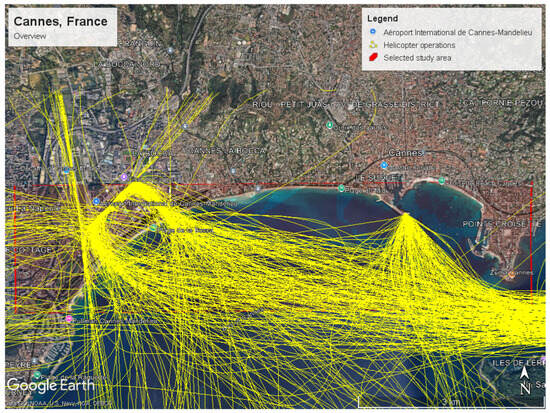
Figure 1.
Overview map of Cannes, France, showing the study grid boundaries (red box) and the ground track trajectories of helicopter operations (in yellow) during the study period.
The two main facilities within the study area are the Cannes–Mandelieu Heliport, adjacent to Cannes–Mandelieu Airport, and a helipad at the end of the pier at Port de Cannes towards the right of the figure. Table 1 summarises arrivals and departures at these two sites during the study period, broken down by period of day. The majority of operations were concentrated at Cannes–Mandelieu, with activity peaking during daytime hours, although transfers at the Port Helipad also contributed to localised exposure.

Table 1.
Summary of helicopter operations between 12 and 25 May 2025, Cannes, France.
The number of operations per rotorcraft type is presented in Table 2.
Table 2.
Number of operations per rotorcraft type during the study period.
3.2. Data Sources: ADS-B, Weather, Terrain, Land Cover
3.2.1. ADS-B Signals: Background and Accuracy
Automatic Dependent Surveillance-Broadcast (ADS-B) is an aircraft positioning system that complements existing primary and secondary radars. Unlike secondary surveillance radar (SSR) it provides conspicuity by broadcasting (as the “B” indicates) a signal at regular intervals, without interrogation. These broadcasts can include a wide range of aircraft state parameters: registration, squawk, 3-D position, barometric and geometric altitude, speed (indicated airspeed and ground speed), heading, vertical rate (climb or descent), QNH setting, autopilot engagement, and others.
ADS-B differs fundamentally from the other two radar systems in current use. Primary radar relies on reflected signals, yielding only basic range and bearing and requiring no action by the aircraft. SSR operates via interrogation and reply, with different modes (A, C, S) providing increasing levels of detail; even Mode S, however, is considered less informative than ADS-B. Introduced operationally in 2003, ADS-B has since proven its value and is now mandatory for many commercial aircraft in specific classes of controlled airspace and under IFR conditions.
By receiving ADS-B broadcasts, a ground station can reconstruct an aircraft’s trajectory at 1 Hz intervals. Aircraft can also receive each other’s signals, which improves situational awareness and enables ADS-B to function as a collision avoidance tool. The signals are unencrypted and free to receive, enabling inexpensive receivers or software-defined radios (SDRs) to capture them. Platforms such as the OpenSky Network, FlightRadar24, and FlightAware aggregate data from large numbers of distributed receivers and make flight trajectories widely accessible.
ADS-B operates at 1090 MHz, whereas the global VHF airband spans 108–137 MHz (with 118–137 MHz used for verbal communications). While higher frequencies generally reduce range at equal transmit power, ADS-B’s digital modulation with error correction ensures high reliability. In practice, inexpensive ground-level receivers can often capture ADS-B transmissions from aircraft 150–200 NM away, with Earth’s curvature being the principal constraint.
The horizontal position reported by ADS-B is highly accurate because it derives from GNSS constellations (GPS, GLONASS, BeiDou, Galileo), often within a metre. Vertical positioning is less precise: GNSS geometry limits access to satellites below the horizon, and signals are refracted at low angles through the atmosphere [31]. Errors of around ±50 ft are common, though temporal continuity and filtering can reduce noise.
Finally, since ADS-B signals are unencrypted, they could in theory be subject to interference or malicious use. At present, such risks are not considered critical for research applications.
3.2.2. OpenSky: Flight Radar Data
The present study relies on ADS-B trajectory data collected and distributed by the OpenSky Network [3], which provides access to historical, crowdsourced ADS-B signals.
Data extraction, for the period 12–25 May 2025, was constrained to a fixed bounding box covering the Cannes shoreline study area and limited to altitudes ≤2000 m above mean sea level (AMSL). The dataset provided 1 Hz messages containing icao24 (Mode-S), callsign, UTC timestamp (later converted to local time), latitude, longitude, geo-altitude, baro-altitude, velocity, heading, vertical rate, and on-ground status (all in metric units).
Each message was linked to aircraft metadata using the icao24 identifier. Rotorcraft were retained while fixed-wing traffic was excluded. For each icao24, independent operations (opnum) were defined as continuous sequences of points with no long-time gaps and no large position jumps. The native sampling frequency of 1 Hz was preserved throughout the analysis, with no down-sampling applied to the source data.
3.2.3. Weather Data
Atmospheric parameters were obtained from the Open-Meteo Historical Weather API [32]. This service provides hourly values for key meteorological variables, including temperature, relative humidity, mean sea-level pressure, surface pressure, and wind vectors. Data were downloaded in CSV format for the coordinates and date range of the study area.
Table 3 presents mean values of selected parameters for day, evening, night, and aggregated 16 h and 24 h periods. For each time partition, a single set of representative meteorological values was applied to all operations within that partition, and frequency-dependent atmospheric absorption was computed using those values.
Table 3.
Period-mean meteorology for NORAH2.
3.2.4. Topographic Data
Terrain elevation data were sourced from France’s national mapping agency (IGN), which distributes digital elevation models via the Géoplateforme. The BD ALTI® 25 m resolution digital terrain model (DTM) [33] was downloaded in Cloud-Optimized GeoTIFF (COG) format, referenced to Lambert-93/RGF93. All IGN datasets are released under Licence Ouverte/Open Licence v2.0 (Etalab).
For this study, terrain elevations covering the analysis grid plus a 1.5 km buffer were extracted. Heights were sampled at grid-node centres using nearest-neighbour interpolation and assembled into a NORAH2-formatted ESRI ASCII raster (*.asc).
3.2.5. Land Cover Category Data
NORAH2 accounts for ground-surface impedance, which influences how sound travels and attenuates. Unlike terrain elevation, no authoritative spatial dataset exists that directly provides acoustic ground impedance. A practical approach is to infer impedance values from land-use/land-cover classifications.
The Copernicus Land Monitoring Service (CLMS) provides harmonised pan-European datasets suitable for environmental assessments. The CORINE Land Cover (CLC) 2018 raster (100 m resolution; version 2020_20u1) [34] was used to classify terrestrial surfaces into thematic categories (e.g., artificial surfaces, agricultural areas, forests, wetlands, water bodies).
For acoustic ground modelling, CLC classes were reclassified to NORAH2 ground categories and associated with representative acoustic parameters (e.g., effective flow resistivity, ground factor) based on Annex D of the NORAH2 User Manual and the established acoustics literature. The resulting impedance field was exported as a NORAH2-compatible ESRI ASCII raster (*.asc) with grid geometry consistent with the terrain raster.
3.3. Trajectory Conditioning (Ground Track, Altitude, Speed)
Preprocessing of ADS-B/Mode-S trajectories is warranted because raw crowdsourced observations contain artefacts that can yield implausible kinematics if used as-is. Documented issues include delayed data and duplicate receptions in multi-receiver networks; occasional erroneous positions that appear as short target “jumps”; misassigned transponder identifiers; short gaps and dropouts that complicate interpolation; and variability in reported position integrity together with the widespread use of barometric (rather than geometric) altitude in position messages. Untreated, these effects can produce mismatches between reported position and velocity and propagate into unrealistic climb/descent rates and headings in reconstructed profiles [35,36,37].
Although ADS-B messages may include both geometric (GNSS-derived) altitude and barometric altitude, the latter is used in this study as the primary vertical reference. This choice reflects aviation surveillance and operational standards: ICAO Annex 10 (Volume IV) [38] defines pressure-based altitude as the standard vertical quantity for ADS-B reporting and surveillance processing. Barometric altitude therefore represents the altitude reference used by pilots, procedures, and controllers, and provides a temporally stable basis for reconstructing low-altitude flight profiles. By contrast, GNSS-derived geometric altitude is more sensitive to satellite geometry and short-scale variability as mentioned in Section 3.2.1
3.3.1. Correction of Barometric Altitude
Barometric altimeters assume International Standard Atmosphere conditions (15 °C, 1013.25 hPa). Any departure from these reference values introduces a bias. To account for this, hourly meteorological observations (surface pressure and temperature) were obtained and corrected for each altitude sample using the standard hypsometric relation (Equation (1)) [39]:
where hcorrected is the corrected altitude (m), hbaro is the barometric altitude as supplied in the source data and P is the surface pressure in hPa. Likewise, this altitude was corrected for ISA temperature deviation using the standard 0.4% per °C rule. These adjustments align the trajectories to actual atmospheric conditions at the time of each operation.
After ISA correction, residual negative samples persisted due to pad elevations close to sea level. Subsequently, trajectories were compared against a 25 m-resolution digital elevation model (DEM). Known helipad elevations (e.g., Heliport Mandelieu, Port Helipad) were used as anchors, shifting the altitude of the entire operation consistently up or down, ensuring that ground and taxi segments matched surveyed elevations. This also eliminated negative altitude artefacts.
Figure 2 presents an example comparing the barometric altitude (after ISA correction) versus the optimised altitude, where the shifting upwards made to align pad and ground elevation is evident.
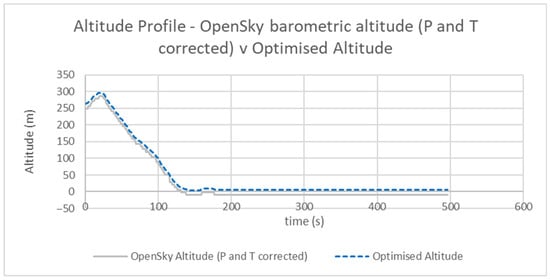
Figure 2.
Comparison between raw (P corrected) and optimised altitudes.
3.3.2. Ground Track Optimisation
The original ground track positions describe rather smoothly the overall trajectory of the operation (see Figure 3); however, when zoomed in (see Figure 4), changes of direction are noticeable.
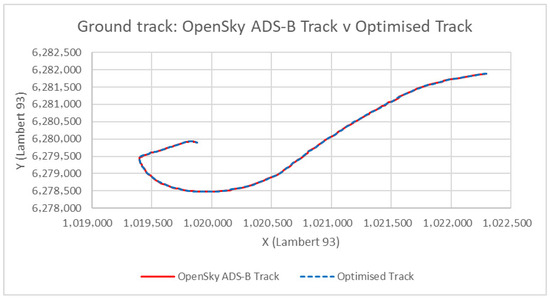
Figure 3.
Example (operation number 186-RT186) of ground track trajectory comparison between OpenSky’s source data and optimised ground track. Note: OpenSky provides coordinates in decimal latitude and longitude which have been converted to Lambert-93.
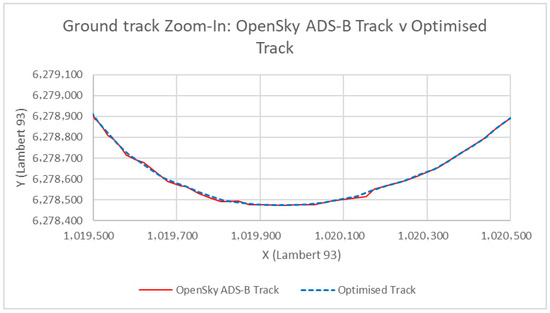
Figure 4.
Zoom in of RT186 illustrating the differences between raw and optimised ground track trajectories.
The procedure of ground track optimisation consisted of the following:
- Detection of implausible movements. Successive positions were compared to identify step lengths and heading changes beyond defined physical limits. Where these occurred, the affected point was shifted to a position interpolated between its neighbours, bringing the movement within a realistic bound.
- Stabilisation of low-speed manoeuvres near heliports. Operations within the heliport or helipad boundaries were treated conservatively, with only small corrections applied. This ensured that hover and taxi movements, which naturally involve low speeds and small displacements, were preserved.
- Smoothing of residual artefacts. Runs of repeated positions were spread slightly to restore continuous progression, and stretches of consistent turning were refitted with arcs constrained to plausible radii (300–5000 m). Local heading discontinuities were straightened by aligning the point with the chord between its neighbours. These adjustments were restricted to metre-scale displacements.
3.3.3. Speed Optimisation
In OpenSky the “velocity” parameter represents ground speed. As a procedural step, true airspeed (TAS) is obtained by correcting ground speed for wind: the wind vector is vertically interpolated from the available levels (10, 80, 120, 180 m) to the aircraft’s barometric altitude and projected onto the ground track direction; the along-track wind component is then removed from ground speed (tailwind raises the ground speed relative to TAS; headwind lowers it). Figure 5 illustrates the resulting separation between ground speed and TAS across headwind and tailwind segments.
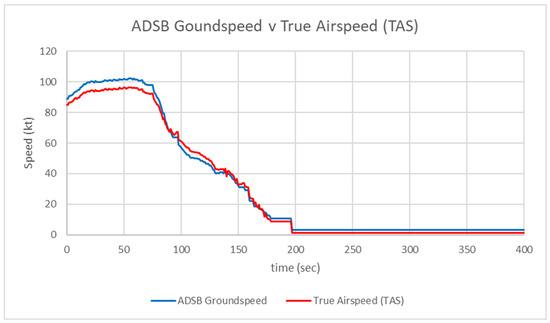
Figure 5.
Comparison between Opensky’s speed profile and true airspeed (TAS)—with wind speed correction.
The speed values provided by ADS-B showed short-term spikes and rapid fluctuations that are inconsistent with helicopter motion (see Figure 5). These fluctuations are inherited by the resulting TAS profile. If untreated, these artefacts would result in unrealistic acceleration profiles.
To address this, speed time series were processed in three steps:
- Filtering and smoothing. A moving median followed by a moving average was applied to reduce short-term fluctuations while preserving overall trends.
- Acceleration limits. Step-to-step changes were checked against fixed numerical thresholds based on rotorcraft capabilities; where exceeded, values were adjusted by interpolation to remain within plausible ranges.
- Distance consistency. A scale factor was applied so that the integrated distance from the smoothed speed profile matched the length of the ground track, ensuring consistency in total duration and distance.
Figure 6 contrasts the wind-corrected true airspeed (TAS; red) with the optimised profile after smoothing and distance-matching factorization (blue); the scale factor of the operation shown is 0.98.
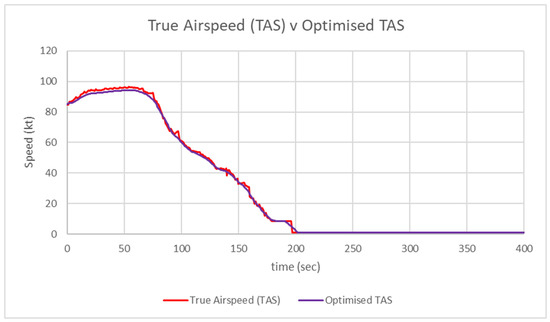
Figure 6.
Comparison between true air speed profile (in red) and the resulting TAS optimisation (in purple).
3.4. Operation and Flight-Mode Assignment
Each operation was categorised as arrival (ARR) or departure (DEP) by comparing the first and last altitudes (first > last ⇒ ARR; otherwise, DEP). Diurnal classes were assigned from local time for Lden: Day (07:00–19:00), Evening (19:00–23:00), Night (23:00–07:00).
Per-second flight “modes” (APP, DEP, FOV, IGH, OGH, TAX, RIDL) were labelled via rule-based logic combining altitude bands, speed regimes, and proximity to pads/corridors, providing NORAH2 with context-aware segments for emission and propagation modelling.
The classification assigns one mode per second by combining altitude above ground level (AGL), ground speed, vertical trend, and proximity to heliports and published helicopter corridors. Proximity is evaluated against geofenced pad polygons assigned to each helicopter pad station (Mandelieu and Port de Cannes).
The criteria applied to assign mode is presented in Table 4.
Table 4.
Mode definitions and classification criteria used to segment rotorcraft trajectories. AGL = Above Ground Level; “pad buffer” is the immediate area surrounding the pad used for classification. Thresholds are in knots and metres AGL.
3.5. NORAH2 Configuration (Inputs, Rotorcraft Representation, Metrics)
The NORAH2 model requires a structured set of inputs describing project geometry, trajectories, aircraft types, environmental conditions, and output metrics. Configuration followed the consultation of the NORAH2 User Manual (D1.2) [40] and the Rotorcraft Noise Modelling Guidance (SC01.D1.5d) [25] for inputs, hemisphere selection, and computation workflow. The following subsections describe the configuration adopted for this study.
3.5.1. Project Coordinate Frame and Origin
All calculations were performed in a local Cartesian frame defined in Lambert-93, consistent with national terrain and land-cover datasets. The origin was set at the Cannes Heliport (Base hélicoptère de la Sécurité Civile, adjacent to Cannes–Mandelieu Airport), with coordinates X = 1,019,635 m, Y = 6,279,647 m, and Z = 3 m AMSL.
3.5.2. Trajectory Input
The Radar_Trajectories.csv file was used as an input. This file contained quality-controlled trajectories from ADS-B processing (Section 3.2), including position, altitude, speed, and operation mode at one-second resolution. ADS-B trajectories do not provide sideslip information, and it cannot be reliably inferred from the available state vectors. The Slip column in Radar_Trajectories.csv was therefore set to 0° for all samples. This choice is recorded here as a modelling assumption; according to NORAH modelling guidance, slip angle primarily affects source directivity during near-ground manoeuvres such as hover, take-off, and landing, while its influence on single-event metrics (LAmax, SEL) for trajectory-based en-route or steadily climbing/descending segments is second-order compared to altitude, speed, and lateral distance. Its influence can be evaluated in a future validation study.
3.5.3. Rotorcraft Type and Representation
Rotorcraft were represented in NORAH2 by directional source hemispheres grouped by class. For types not explicitly catalogued, a proxy was selected on the basis of airframe configuration, number of rotors, number of blades, etc. Certification adjustments were applied using the EASA Rotorcraft Noise Database [41]: the median certification value for each type was compared to that of the selected proxy, and the difference was applied as a regime-specific offset (take-off, overflight, approach).
Table 5 presents the rotorcraft types used in this study with their corresponding certification levels, their NORAH proxy, if not catalogued, and the derived adjustment applied. It summarises the regime-specific level adjustments applied where certification data provided sufficient information to support such corrections. In accordance with NORAH modelling guidance, offsets are only introduced when regime-resolved certification information (approach, flyover, departure) is available (Chapter 8) and can be meaningfully associated with the corresponding operational modes.
Table 5.
Noise certification levels (median) of ICAO rotorcraft types with corresponding NORAH proxy and delta adjustments.
For helicopter classes for which certification data did not provide regime-specific differentiation suitable for this purpose (Chapter 11), no offsetting was applied. Where regime-resolved certification information was available, median certification levels were calculated for each operational regime and helicopter class, and relative level differences were derived. These relative differences were then applied as constant additive offsets to the corresponding NORAH hemispherical source levels. This treatment is intended as a starting point for proxy selection and level adjustment; in application-oriented studies, validation against field measurements should be used to refine the actual level differences between a modelled aircraft and its chosen proxy.
3.5.4. Metrics
The Metrics CSV defines how each noise indicator is assembled from day/evening/night energy and what time span it is normalised to (see Table 6). Each row names a metric (e.g., LAeq24h, Lden, Ldn, Lday, Leve, Lnght, LAeq16h, SELA), specifies weighting factors for the Day, Evening, and Night partitions, and provides T0 [s], the normalisation duration in seconds for the analysis window. Weightings of 1, 3.162, 10 correspond to the standard 0 dB, +5 dB, +10 dB penalties used for evening and night in European indicators (e.g., Lden), while binary entries (1 or 0) select which partitions contribute to indicators like Lday, Leve, or Lnght. The Day/Evening/Night partitions follow the conventional 12 h/4 h/8 h split used in EU practice, and the penalties align with the Environmental Noise Directive definitions for Lden.
Table 6.
Metrics with period weighting and duration of study period in seconds.
The T0 [s] field must equal the total covered seconds for the partitions included in that metric over the entire study period (e.g., 14 days of Day + Evening for LAeq16h; all 24 h periods for Lden). Correct T0 is critical: it is the divisor that converts accumulated acoustic energy into the period-average level; setting T0 shorter or longer than the data coverage will, respectively, inflate or dilute results. In practice, the list of metric names at the end of Case_Options.csv determines which lines from this Metrics file are applied; the engine then aggregates the time-series energy within each partition, applies the stated weightings (penalties), and normalises by T0 [s] to produce the requested indicators. This structure ensures that outputs align with established European definitions while remaining explicitly tied to the study’s actual temporal coverage.
3.5.5. Case Specific Files
Case_Radar_Operations defines the set of rotorcraft movements to be modelled. Each record specifies the ICAO type (“Heli”), the operation category (“OP”, e.g., ARR or DEP), and an operation identifier (“RTID”) that links to the corresponding 4-D trajectory. The Day/Evening/Night flags (D, E, N) indicate which temporal partitions the operation contributes to in the period metrics. When an ICAO type does not have a dedicated NORAH hemisphere, the type is cross-referenced via Substitutes.csv to a NORAH proxy before source modelling proceeds. In effect, Case_Radar_Operations is the run manifest: it declares exactly which operations are in scope, when they count, and which source descriptor (direct or proxy) applies to each.
Table 7 shows an extract of a Case_Radar_Operations.csv file.
Table 7.
Extract from Case_Radar_Operations file.
Case_Run_Options provides the environmental and computational context for the run (Figure 7 shows an example). It supplies the atmospheric inputs used for absorption and propagation (e.g., reference temperature, pressure and humidity), identifies the ground model through the DEM and associated sigma references (flow resistivity for ground impedance classes), and specifies the evaluation grid if not read from a separate grid file. Spatial limits are controlled with parameters such as GRDEXT (grid extension beyond the domain of interest) and DMAX (maximum propagation distance). Receiver height was specified via the HMIC parameter in the Case_Run_Options file and set to 1.2 m above local ground level, with ground elevation defined by the digital elevation model (DEM). Explicit building geometry was not included in the terrain representation; while building heights could in principle be incorporated, meaningful façade-level modelling would require grid resolutions incompatible with town-scale noise mapping and standard computational practice.
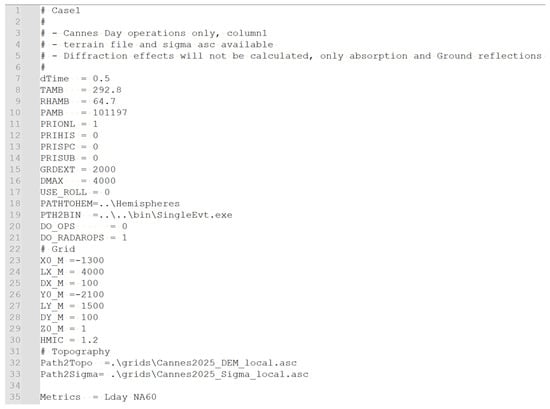
Figure 7.
Example of case-specific Run_Options file.
3.5.6. Outputs
NORAH2 produced two types of output:
- Single-event footprints, listing calculated levels such as SEL and LAmax at receptor points (single event *.onl).
- Multi-event outputs (Metrics) are delivered as both tabular point listings (.onl) and raster surfaces (.grd).
These outputs were subsequently converted to contours and exposure layers. From the grids, Lden and LAeq, 16 h contours were derived, and Number Above metrics (N60, N65, N70) were calculated. These post-processing steps produced the maps and indicators presented in Section 4.
4. Results
4.1. Study Coverage and Operations
Results cover a 14-day window in May 2025 over an 8.3 km × 2.5 km coastal grid centred on Cannes. A total of 556 operations were modelled (275 arrivals, 281 departures), with 465 operations in the Day period, 88 operations in the Evening period, and 3 operations in the Night period recorded in the radar summary (Table 1). Eighty one percent (81%) of operations started or ended in a helipad (Mandelieu or Port de Cannes).
Lden is defined as a long-term indicator averaged over all days of a year with +5 dB/+10 dB penalties for evening/night, as set out under the EU Environmental Noise Directive and related guidance. UK aviation practice defines LAeq, 16 h as the 07:00–23:00 average over the 92-day summer period (16 June–15 September) when reporting conventional contours.
The present results cover two weeks during May 2025. This duration does not meet the standard averaging periods for either Lden (annual) or LAeq, 16 h (92-day summer) and therefore cannot be used to infer long-term exposure. The contours shown should be interpreted as demonstrative outputs of the NORAH2 mapping workflow for the selected window, not as statutory exposure maps or as a basis for health-impact appraisal. Health-oriented interpretation typically relies on long-term indicators (e.g., Lden in the WHO Environmental Noise Guidelines), which require time coverage beyond the present scope.
All cartographic tasks such as plotting, contour smoothing and map composition, were carried out in QGIS (open-source GIS).
4.2. Lden Contour Maps
Modelled Lden surfaces were produced on the receptor grid and rendered as contours on a basemap (Figure 8). Bands plotted in this case study span 45–60 dB(A) in 5 dB steps. The highest levels (55 and 60 dBA) are contained within the helipad area.
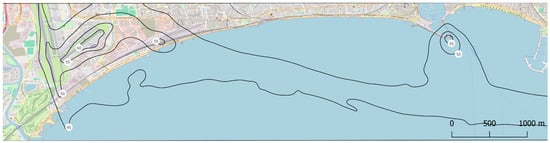
Figure 8.
Cannes, coastal corridor, 12–25 May 2025, Lden (2-week average) contours 45 to 60 dBA (step 5 dB). Basemap tiles © OpenStreetMap; data © OpenStreetMap contributors (ODbL).
4.3. LAeq, 16 h (07:00–23:00) Contour Maps
Modelled LAeq, 16 h (no evening penalties) was contoured in 3 dB steps from 51 to 60 dB(A) (Figure 9). Most contours are within the confines of helipad areas with the 51 dBA contour extending slightly beyond the Mandelieu base.
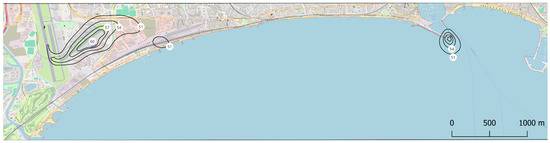
Figure 9.
Cannes, coastal corridor, 12–25 May 2025, LAeq, 16h (2-week average) contours 51 to 60 dBA (step 3 dB). Basemap tiles © OpenStreetMap; data © OpenStreetMap contributors (ODbL).
4.4. Event-Count Maps (N60, N65, N70)
Event-count indicators N60, N65, and N70 quantify how often single-event levels exceeded 60/65/70 dB(A) at each receptor over the study period. The contours show the average daily number of occurrences where the noise level is equal or higher than 60 (Figure 10), 65 (Figure 11) and 70 dBA (Figure 12), over the 2-week study period.
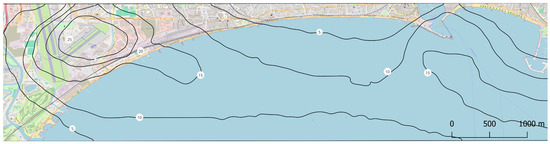
Figure 10.
Cannes, coastal corridor, 12–25 May 2025, N60 contours (step 5). Basemap tiles © OpenStreetMap; data © OpenStreetMap contributors (ODbL).
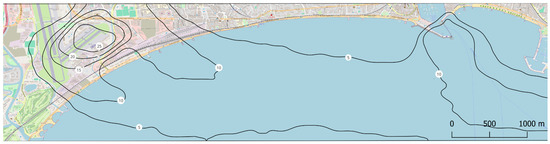
Figure 11.
Cannes, coastal corridor, 12–25 May 2025, N65 contours (step 5). Basemap tiles © OpenStreetMap; data © OpenStreetMap contributors (ODbL).
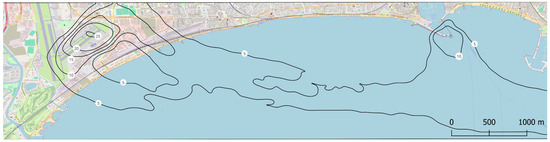
Figure 12.
Cannes, coastal corridor, 12–25 May 2025, N70 contours (step 5). Basemap tiles © OpenStreetMap; data © OpenStreetMap contributors (ODbL).
4.5. Single-Event Footprints (Diagnostics and Use Cases)
NORAH2 also resolves individual operations, enabling event-level analysis in addition to fleet/period aggregates. As an example, the operation with opnum 186 (RTID186), an arrival operation of an EC45 rotorcraft into Mandelieu helicopter base, was mapped to LAmax contours (60–90 dB(A), 10 dB steps) on the study grid (Figure 13). For RTID186, the maximum single-event LAmax within the computational grid is 102.5 dB(A) and occurs within the heliport boundaries, along the arrival flight path.
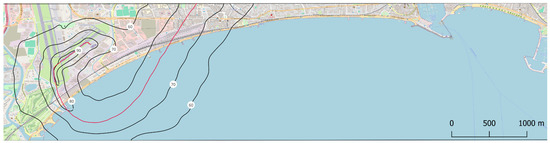
Figure 13.
Cannes, coastal corridor, operation RTID186 LAmax contours 60 to 90 dBA (step 10). Ground track shown in red. Basemap tiles © OpenStreetMap; data © OpenStreetMap contributors (ODbL).
SELA is also available for the same event for energy-based comparison. Typical uses include the following: (i) comparing footprints across different operations or routes; (ii) testing the robustness of assumptions to proxy assignments and level offsets; and (iii) highlighting the localised effect of one operation over overflown neighbourhoods. This event-level capability complements cumulative indicators by isolating the geometry and magnitude of single-flight noise footprint.
5. Discussion
5.1. Principal Findings and Contribution
This study demonstrates a real-case application of NORAH2 for helicopter noise mapping in an urban coastal corridor (Cannes), producing Lden and LAeq, 16 h contours and N60/N65/N70 event-count maps over a uniform receptor grid (Figure 7, Figure 8, Figure 9, Figure 10 and Figure 11). Event-level capability was shown through a representative LAmax footprint (RTID186), illustrating how individual operations can be analysed in addition to period averages (Figure 13). The pipeline, from ADS-B trajectories to NORAH2 inputs and mapped outputs, was executed with sample-preserving conditioning of position, altitude, and speed (Section 3.2), yielding coherent maps and footprints suitable for scenario testing and stakeholder communication.
5.2. Temporal Scope and Interpretation of Indicators
Lden is defined for long-term exposure with evening/night penalties; LAeq, 16 h represents daytime average exposure. The present analysis covers two weeks, which is insufficient to characterise long-term exposure or to support health-impact appraisal, especially given the chosen period of data, but rather acts as a proof of concept. The contours should therefore be interpreted as demonstrative outputs of the modelling workflow for a defined window, not as statutory exposure maps. Statements on health relevance require indicators computed over standard averaging periods (annual Lden; seasonal/annual practice for LAeq, 16 h) and are out of scope for this dataset.
5.3. Suitability of OpenSky ADS-B (Context and This Dataset)
A secondary objective in this study was to determine whether OpenSky ADS-B data are suitable for producing kinematically plausible helicopter operations for NORAH2. For the two-week Cannes dataset, one-second state vectors provided sufficient signal quality to reconstruct operations once the conditioning workflow in Section 3.2 was applied (sample-preserving adjustments to ground track, hypsometric altitude correction with terrain-clearance enforcement, and speed smoothing with distance consistency). The resulting trajectories were consistent with pad elevations, terrain, and expected rotorcraft behaviour, and yielded coherent single-event footprints and period maps.
Data noise typical of ADS-B, such as occasional position jumps, short runs of repeated positions, and small step-to-step speed fluctuations, was present but was mitigated by the stated conditioning without removing samples or altering the operation duration. Within this dataset, the processed outputs indicate fitness for purpose as inputs to NORAH2.
5.4. Methodological Choices and Uncertainties
Ground track conditioning. Horizontal positions can include plateaus, long steps, and sharp heading changes that inflate curvature and bias kinematics. Sample-preserving, metre-scale adjustments were applied in a fixed order (bounds on step length; protection of heliport manoeuvres; de-plateauing; turn smoothing; local heading repair). These constraints limited geometric drift while restoring physical plausibility; timing and sample count were unchanged. Residual uncertainty mainly concerns short manoeuvres that may be partially smoothed; however, the metre-scale limit was chosen to keep this small.
Altitude optimisation. Barometric altitudes deviate from true heights under non-ISA conditions; near sea level, small pressure/temperature biases can leave samples slightly below zero even after ISA correction. In this dataset, ISA adjustment alone produced little change in the count of negative altitudes. Anchoring each operation to surveyed pad elevation and applying a constant vertical shift per operation, followed by a ≥1 m terrain-clearance margin, removed ground-penetration artefacts. Remaining uncertainty is a small bias over complex terrain.
Speed smoothing and distance consistency. Speeds were first smoothed with short moving median and mean windows and a per-second change cap to suppress spikes while retaining trend. Thereafter, a single multiplicative factor per operation was applied so the distance derived from the optimised speed profile matches the original distance and duration of the operation.
Uncertainty arises primarily from the chosen median/mean window lengths and the per-second change cap. Windows set too long can dampen genuine acceleration/deceleration ramps; windows set too short leave residual small-scale variation that propagates to vertical flight-path angle and mode boundaries. A cap set too low clips real ramps; a cap set too high admits isolated spikes, inflating instantaneous acceleration. The distance-matching factor corrects only a small global mismatch introduced by smoothing and does not contribute to local distortions. Under these controls, residual uncertainty is confined to brief manoeuvres, and it should be small in magnitude.
Mode assignment. Noise hemispheres depend on the assigned flight mode; misclassification can therefore affect level estimates. Per-second labels (RIDL, TAX, IGH, OGH, DEP, APP, FOV) were derived from altitude above ground, ground speed, climb/descent trend, and proximity to pads/corridors. Residual uncertainty is concentrated at these boundaries: small changes in thresholds or timing can move a few seconds between modes (e.g., DEP↔FOV, APP↔IGH), with corresponding changes in hemisphere selection and local levels. The criteria used may be refined, and alternative or tighter ranges, potentially adding cues such as vertical-rate windows, could be adopted to further refine labels if validation indicates benefit. With one-second sampling, any mislabelling is short in duration.
Types without dedicated hemispheres were mapped to NORAH classes and, in this study, adjusted using regime-specific uniform level shifts derived from EASA certification medians. This represents a pragmatic starting point but reflects a central tendency rather than the specific noise characteristics of the local operating fleet; if the actual fleet is systematically quieter or noisier than the median assumed for a given class, corresponding bias may arise in predicted levels and event counts. Further refinement is possible by applying adjustments to different speed and angle ranges and, where available, by replacing class medians with aircraft- or type-specific certification data derived from tail-number information. In all cases, validation against measured noise levels remains necessary to refine the effective level differences between a modelled aircraft and its chosen proxy.
5.5. Verification and Validation
In aircraft noise studies, credibility rests on validation, demonstrating agreement between model predictions and independent measurements for the intended use. This is standard practice in the principal frameworks (ECAC Doc 29; FAA AEDT technical guidance), which emphasise precautions to ensure results are valid and comparable to established methods [11,12].
Verification and validation are not unique to rotorcraft. In established frameworks (ECAC Doc 29; FAA AEDT [42]; UK CAA ANCON [43]; EUROCONTROL IMPACT [17]; EASA ANP support [44]), validation against independent measurements is a standard requirement for credible aircraft-noise modelling. Its purpose is to show that model configuration and assumptions reproduce observations within stated tolerances and, when they do not, to support revised assumptions and re-test cycles.
Procedurally, NORAH2 requires the same validation discipline as fixed-wing models: compare predictions against measurements for representative operations and periods; if differences exceed agreed tolerances, documented assumptions must be revised (e.g., flight-procedure parameters, proxy level offsets) and re-tested until alignment is achieved. Guidance under Doc 29 explicitly points to comparing calculated and measured levels and adjusting procedure assumptions where warranted, an approach directly transferable here.
However, validation alone does not confer exposure relevance when the time period is not aligned with reporting norms. ECAC/European practice treats Lden as a long-term indicator (annual basis), and UK practice typically reports LAeq, 16 h for a defined summer period; by contrast, the present analysis covers two weeks. Consequently, even if validated, the average outputs presented in this study (Lden and LAeq, 16 h) remain demonstrative by-products of the NORAH2 workflow, useful to show feasibility, mapping behaviour, and event-level capability, not statutory exposure findings or a basis for health appraisal. Future, decision-oriented studies would need both validation and time period consistent with reporting conventions before results are interpreted for policy or health contexts.
In practical terms, verification of helicopter noise modelling in an urban context would typically rely on a combination of short- and long-term noise measurements at representative locations beneath flight corridors and near heliports. Long-term monitoring provides context on background sound levels and temporal patterns, while targeted short-term measurements during known helicopter operations enable direct comparison of predicted single-event metrics (e.g., LAmax, SEL) with observed values.
Such measurement campaigns are routinely used in fixed-wing aviation noise studies to validate both event-level predictions and aggregated indicators, and the same principles apply to rotorcraft. In this framework, discrepancies between measured and modelled levels are used to refine operational assumptions (e.g., flight profiles, mode assignment, proxy selection, or level offsets) rather than to invalidate the modelling approach itself. While no field measurements were available for the present demonstration, the modelling workflow presented here is explicitly designed to support this type of verification in future, decision-oriented applications.
5.6. Policy and Health Context
Environmental noise is recognised as a risk factor for adverse health outcomes, beyond auditory effects such as hearing loss. The epidemiological and public health literature shows that chronic exposure to environmental noise can contribute to annoyance, sleep disturbance, cardiovascular diseases (e.g., hypertension, ischemic heart disease), metabolic stress, and cognitive impacts in exposed populations [45], and is therefore treated as a public-health concern in European policy frameworks [46].
Aviation noise, as a specific component of transportation noise, has been associated with similar health effects. Large reviews and meta-analyses report relationships between aircraft noise exposure and increased risk of sleep disturbance, community annoyance, and cardiovascular morbidity, including elevations in blood pressure and ischaemic heart disease risk with long-term exposure above guideline levels [47]. These associations underline why organisations such as the World Health Organisation include aircraft noise in environmental noise guidelines aimed at protecting public health [46,47].
Helicopter noise shares many of the acoustic and exposure characteristics of other aviation noise sources (e.g., high maximum levels, variable temporal patterns) but often occurs in dense urban or coastal environments at lower overall traffic volumes. This can result in frequent, high-amplitude events that are not well-captured by traditional annual average indicators alone yet may contribute disproportionately to community annoyance and sleep disturbance. By producing both energy-averaged and event-based indicators, modelling tools can thus better characterise the aspects of helicopter noise that are most relevant to community response and potential health impacts, supporting more informed policy and management decisions.
5.7. Application to Urban Noise Management (Policy and Stakeholder Relevance)
Regulatory alignment and gap-filling. NORAH2 produces standard indicators (e.g., Lden; LAeq, 16 h, Lday, Levening, Lnight, …) consistent with European practice, enabling integration with strategic mapping carried out under the Environmental Noise Directive and CNOSSOS-EU methods. Helicopter activity often sits below statutory mapping thresholds; NORAH2 enables route-level (corridor) mapping of helicopter operations and provides event-count indicators (N60/N65/N70: number of events exceeding 60/65/70 dB(A) at each location), capturing the frequency and intermittency of rotorcraft noise that are not well-represented by annual, airport-centric indicators.
Transparency and communication. Metric outputs and single-event footprints provide plain-language artefacts for public portals and consultation: maps of typical daytime exposure (LAeq, 16 h), long-term indicators (Lden), and frequency maps (NAxx). Publishing inputs (data sources, time windows, processing rules) alongside outputs improves auditability and trust, supporting work by metropolitan observatories and associations and municipal “noise watch” programmes.
Operational scenario testing. The segment/mode framework allows forecast studies prior to policy changes: route alignment or altitude profiles, use of specific pads/heliports, time-of-day restrictions, holding locations, and fleet-mix evolution (including eVTOL). Outputs quantify relative changes in exposure bands and event frequency, supporting proportionate mitigation design and stakeholder negotiation.
Integration with other sources. NORAH2 outputs can be assembled with road/rail/industry layers used in strategic mapping. Event-count layers remain complementary and should be reported alongside energy-average layers. This supports area-wide planning where multiple sources interact (e.g., coastal roads plus rotorcraft corridors).
Complaint handling and monitoring. Single-event footprints and Nxx layers provide a structured way to relate reported disturbances to operations, identify hotspots, and prioritise responses.
Governance and reproducibility. The pipeline is implementable with open data (traffic, terrain, land cover) and documented processing, enabling reproducible analyses that can be re-run for new periods or scenarios. This reduces barriers to adoption by local authorities and environmental noise stakeholders while keeping methods consistent with European reporting practice.
6. Conclusions
This study demonstrates a practical, reproducible workflow for mapping helicopter noise in an urban corridor with NORAH2, driven by OpenSky ADS-B trajectories and public geospatial layers. Outputs comprise Lden, LAeq, 16 h, and event-count metrics (N60/N65/N70) on a uniform grid, complemented by single-event footprints that resolve individual operations.
A process has been described whereby ADS-B data for relevant helicopter operations can be transformed into representative trajectory data for noise modelling purposes.
For local authorities and urban noise stakeholders, the approach enables corridor-level mapping where rotorcraft activity concentrates, provides event-count indicators that reflect frequency and intermittency alongside energy averages, and supports scenario exploration (routes, pad use, time-of-day, fleet mix) with transparent inputs and settings suitable for communication with residents and stakeholders. When configured over standard periods, results can be integrated with strategic mapping under European practice.
Extending coverage to seasonal/annual periods and undertaking measurement-based validation would be the natural next steps for policy applications.
Author Contributions
Conceptualization, M.G.C.G. and K.B.; Methodology, M.G.C.G. and K.B.; Software, M.G.C.G.; Formal analysis, M.G.C.G.; Investigation, M.G.C.G.; Resources, M.G.C.G.; Data curation, M.G.C.G.; Writing—original draft, M.G.C.G. and K.B.; Writing—review & editing, M.G.C.G. and K.B.; Visualization, M.G.C.G.; Supervision, K.B.; Project administration, K.B. All authors have read and agreed to the published version of the manuscript.
Funding
This research received no external funding.
Data Availability Statement
Data available on request.
Acknowledgments
The authors thank the OpenSky Network and its global community of volunteer feeders for providing open access to ADS-B/Mode-S state-vector data used in this study. Their open infrastructure and data availability made this work possible. Grateful acknowledgement is made to the OpenStreetMap community for open map data and to terrestris GmbH & Co. KG for providing the OpenStreetMap WMS basemap used in the figures. NORAH2 (NORAH version 2) software prototype and noise hemispheres data were provided by the European Union Aviation Safety Agency (EASA) and used under the NORAH2 terms and conditions.
Conflicts of Interest
Author Miguel Gabriel Cebrián Gómez was employed by the company Environmental Analytics. The remaining author declares that the research was conducted in the absence of any commercial or financial relationships that could be construed as a potential conflict of interest.
References
- European Commission. Directive 2002/49/EC Relating to the Assessment and Management of Environmental Noise; The Official Journal of the European Union: Luxembourg, 2002; pp. 12–25. [Google Scholar]
- European Commission. Common Noise Assessment Methods in Europe (CNOSSOS-EU): JRC Reference Report; Publications Office of the European Union: Luxembourg, 2012; Available online: https://publications.jrc.ec.europa.eu/repository/handle/JRC72550 (accessed on 22 September 2025).
- European Commission. Commission Directive (EU) 2015/996 Establishing Common Noise Assessment Methods According to Directive 2002/49/EC; The Official Journal of the European Union: Luxembourg, 2015. [Google Scholar]
- International Civil Aviation Organization (ICAO). Annex 16, Environmental Protection, Volume I: Aircraft Noise, 8th ed.; International Civil Aviation Organization (ICAO): Montreal, QC, Canada, 2017. [Google Scholar]
- European Union Aviation Safety Agency (EASA). Environmental Research—Rotorcraft Noise. 2025. Available online: https://www.easa.europa.eu/en/research-projects/environmental-research-rotorcraft-noise (accessed on 23 September 2025).
- Schaefer, M.; Strohmeier, M.; Lenders, V.; Martinovic, I.; Wilhelm, M. Bringing up OpenSky: A large-scale ADS-B sensor network for research. In Proceedings of the 13th IEEE/ACM International Symposium on Information Processing in Sensor Networks (IPSN), Berlin, Germany, 15–17 April 2014; pp. 83–94. [Google Scholar]
- Murphy, E.; King, E.A. Strategic environmental noise mapping: Methodological issues concerning the implementation of the EU Environmental Noise Directive and their policy implications. Environ. Int. 2010, 36, 290–298. [Google Scholar] [CrossRef] [PubMed]
- Licitra, G.; Ascari, E.; Fredianelli, L. Prioritizing process in action plans: A review of approaches. Curr. Pollut. Rep. 2017, 3, 151–161. [Google Scholar] [CrossRef]
- Kephalopoulos, S.; Paviotti, M.; Anfosso-Lédée, F.; Van Maercke, D.; Shilton, S.; Jones, N. Advances in the development of common noise assessment methods in Europe: The CNOSSOS-EU framework for strategic environmental noise mapping. Sci. Total Environ. 2014, 490, 671–697. [Google Scholar] [CrossRef] [PubMed]
- European Civil Aviation Conference. Report on Standard Method of Computing Noise Contours around Civil Airports (Doc 29), 3rd ed.; European Civil Aviation Conference: Neuilly-sur-Seine, France, 2005. [Google Scholar]
- European Civil Aviation Conference. ECAC.CEAC Doc 29, Volume 1: Applications Guide for Computing Noise Contours Around Civil Airports, 4th ed.; European Civil Aviation Conference: Neuilly-sur-Seine, France, 2016; Available online: https://www.ecac-ceac.org/images/documents/ECAC-Doc_29_4th_edition_Dec_2016_Volume_1.pdf (accessed on 22 September 2025).
- ECAC. ECAC.CEAC Doc 29, Volume 2: Recommended Method for Calculating Aircraft Noise Exposure Around Civil Aerodromes, 4th ed.; European Civil Aviation Conference: Neuilly-sur-Seine, France, 2016; Available online: https://www.ecac-ceac.org/images/documents/ECAC-Doc_29_4th_edition_Dec_2016_Volume_2.pdf (accessed on 22 September 2025).
- European Civil Aviation Conference. ECAC.CEAC Doc 29, Volume 3 Part 1: Verification of Model Implementations, 4th ed.; European Civil Aviation Conference: Neuilly-sur-Seine, France, 2016; Available online: https://www.ecac-ceac.org/images/documents/ECAC-Doc_29_4th_edition_Dec_2016_Volume_3_Part_1.pdf (accessed on 22 September 2025).
- UK Civil Aviation Authority. CAP1149: Noise Monitor Positions and Use in Validating ANCON. 2024. Available online: https://www.caa.co.uk/our-work/publications/documents/content/cap1149/ (accessed on 26 September 2025).
- Federal Aviation Administration. Aviation Environmental Design Tool (AEDT), Version 3g Technical Manual. 2024. Available online: https://aedt.faa.gov/3g_information.aspx (accessed on 26 September 2025).
- SESAR Joint Undertaking. SESAR 2020—Environment Impact Assessment Guidance. 2019. Available online: https://www.sesarju.eu/sites/default/files/documents/transversal/SESAR%202020%20-%20Environment%20Impact%20Assessment%20Guidance.pdf (accessed on 26 September 2025).
- EUROCONTROL. Integrated Aircraft Noise and Emissions Modelling Platform (IMPACT). 2022. Available online: https://www.eurocontrol.int/platform/integrated-aircraft-noise-and-emissions-modelling-platform (accessed on 26 September 2025).
- EASA. STAPES: System for AirPort Noise Exposure Studies—Final Report. 2011. Available online: https://www.easa.europa.eu/sites/default/files/dfu/2009-STAPES-System%20for%20AirPort%20noise%20Exposure%20Studies-Final%20Report.pdf (accessed on 26 September 2025).
- Gulding, J.; Fleming, G.G. Heliport Noise Model (HNM) User’s Guide (Version 1); Federal Aviation Administration: Washington, DC, USA, 1988. [Google Scholar]
- Fleming, G.G.; Rickley, E.J.; Roof, C.J. HNM, Heliport Noise Model: Version 2.2 User’s Guide, U.S. DOT Volpe National Transportation Systems Center/FAA. 1994. Available online: https://rosap.ntl.bts.gov/view/dot/8828 (accessed on 29 September 2025).
- Conner, D.A.; Page, J.A. The Rotorcraft Noise Model (RNM). In Proceedings of the AHS International Technical Specialists" Meeting on Advanced Rotorcraft Technology and Life Saving Activities, Utsunomiya, Japan, 11–13 November 2002; Available online: https://ntrs.nasa.gov/citations/20030003730 (accessed on 29 September 2025).
- DELTA Acoustics & Electronics. Nord2000: Comprehensive Outdoor Sound Propagation Model—Part 2: Propagation in an Atmosphere with Refraction, DELTA/Nordic Council of Ministers. 2006. Available online: https://forcetechnology.com/-/media/force-technology-media/pdf-files/projects/nord2000/nord2000-comprehensive-outdoor-sound-propagation-model---part-2-propagation-in-an-atmosphere-with-re.pdf (accessed on 29 September 2025).
- van Oosten, N.; Meliveo, L.; Tuinstra, M.; Olsen, H. The New EU Helicopter Noise Model NORAH (Noise of Rotorcraft Assessed by a Hemisphere-Approach). In Proceedings of the Euronoise 2018, Crete, Greece, 27–31 May 2018. [Google Scholar]
- Olsen, H.; Tuinstra, M.; van Oosten, N. NOISE—SC03.D3: NORAH 2.0 Validation; Royal Netherlands Aerospace Centre (NLR) for the European Union Aviation Safety Agency (EASA): Amsterdam, The Netherlands, 2024; Available online: https://www.easa.europa.eu/en/downloads/139664/en (accessed on 17 June 2025).
- Olsen, H.; Tuinstra, M.; van Oosten, N. NOISE—SC01.D1.5d: Rotorcraft Noise Modelling Guidance; Royal Netherlands Aerospace Centre (NLR) for the European Union Aviation Safety Agency (EASA): Amsterdam, The Netherlands, 2024; Available online: https://www.easa.europa.eu/en/downloads/132005/en (accessed on 17 June 2025).
- Aalmoes, R.; Lania, H.A.; Choi, J. Determination of a Human Dose–Response with Respect to Single Events of Urban Air Mobility-Type Vehicles; European Union Aviation Safety Agency (EASA): Cologne, Germany, 2021; Available online: https://www.easa.europa.eu/en/downloads/137148/en (accessed on 17 June 2025).
- Beagle, J.; Rizzi, S.A.; Boucher, M.; Boyd, D. A Psychoacoustic Test for Urban Air Mobility Vehicle Sound Quality, SAE Technical Paper 2023-01-1107. 2023. Available online: https://humansystems.arc.nasa.gov/publications/Beagult_2023_01_1107.pdf (accessed on 10 September 2025).
- Tracy, T.; Boucher, M.; Christian, A.; Krishnamurthy, S.; Rizzi, S.A.; Begault, D.; Shepherd, K. An Annoyance Model for Urban Air Mobility Vehicle Noise in the Presence of Ambient Sound, NASA. 2024. Available online: https://ntrs.nasa.gov/citations/20240003592 (accessed on 10 September 2025).
- INSEE. Populations Légales 2022—Commune de Cannes (06029). 2022. Available online: https://www.insee.fr/fr/statistiques/8643952?geo=COM-06029 (accessed on 5 September 2025).
- Mandard, S. Sur la Côte d’Azur, L’incessant Ballet des Hélicoptères Exaspère les Riverains. 2023. Available online: https://www.lemonde.fr/en/m-le-mag/article/2023/05/14/on-the-riviera-the-incessant-buzz-of-helicopters-is-here-to-stay_6026616_117.html (accessed on 5 September 2025).
- Macias-Valadez, D.; Bullet, R.; Santerre, R.; Larochelle, S.; René, B. Improving vertical GPS precision with a GPS-over-fiber architecture and real-time relative delay calibration. GPS Solut. 2012, 16, 449–462. [Google Scholar] [CrossRef]
- Open-Meteo. Historical Weather API. 2025. Available online: https://open-meteo.com/en/docs/historical-weather-api (accessed on 15 September 2025).
- Institut National de l’Information Géographique et Forestière (IGN). BD ALTI® 25 m—Modèle Numérique de Terrain. 2023. Available online: https://geoservices.ign.fr/bdalti (accessed on 28 January 2025).
- Copernicus Land Monitoring Service (CLMS). CORINE Land Cover (CLC) 2018, Version 2020_20u1. 2020. Available online: https://land.copernicus.eu/pan-european/corine-land-cover/clc2018 (accessed on 22 August 2025).
- Schaefer, M.; Lenders, V.; Martinovic, I. OpenSky Report 2016: Data Sources and Data Quality. 2016. Available online: https://www.semanticscholar.org/paper/OpenSky-report-2016%3A-Facts-and-figures-on-SSR-mode-Schafer-Strohmeier/eb3dc6d238f25d7c725e7d6efa94f560946d51d1 (accessed on 5 September 2025).
- Strohmeier, M.; Schäfer, M.; Lenders, V.; Martinovic, I. Realities and challenges of nextgen air traffic management: The case of ADS-B. IEEE Commun. Mag. 2014, 52, 111–118. [Google Scholar] [CrossRef]
- Schäfer, A. Assessing the Integrity of Crowdsourced Mode S and ADS-B Data. In Proceedings of the 37th Digital Avionics Systems Conference (DASC), London, UK, 23–27 September 2018; Available online: https://ieeexplore.ieee.org/document/8569833/authors#authors (accessed on 5 September 2025).
- International Civil Aviation Organisation. ICAO Annex 10-Aeronautical Telecommunications-Volume IV-Surveillance Radar and Collision Avoidance Systems, Fifth Edition, July 2014. Available online: https://store.icao.int/en/annex-10-aeronautical-telecommunications-volume-iv-surveillance-radar-and-collision-avoidance-systems (accessed on 10 September 2025).
- Yadav, M.K. Aircrafts altitude measurement using pressure information. WSEAS Trans. Circuits Syst. 2010, 9, 507–516. Available online: https://www.wseas.us/e-library/transactions/circuits/2010/89-895.pdf (accessed on 15 December 2025).
- Diez, A.; Olsen, H.; Meliveo, L. NORAH2 User Manual (Research Report Deliverable D1.2). European Union Aviation Safety Agency (EASA). 2024. Available online: https://www.easa.europa.eu/en/research-projects/environmental-research-rotorcraft-noise (accessed on 23 September 2025).
- European Union Aviation Safety Agency (EASA). Rotorcraft noise database, Issue 49. 2025. Available online: https://www.easa.europa.eu/en/downloads/16971/en (accessed on 17 June 2025).
- Federal Aviation Administration (FAA). AEDT 3f Technical Manual. 2023. Available online: https://aedt.faa.gov/Documents/AEDT3f_TechManual.pdf (accessed on 10 September 2025).
- Ollerhead, J.B.; Rhodes, D.P.; Viinikainen, M.S.; Monkman, D.J.; Woodley, A.C. The UK Civil Aviation Noise Contour Model ANCON: Improvements in version 2. R&D Report 9842. UK Civil Aviation Authority (CAA). Available online: https://www.caa.co.uk/publication/download/12420 (accessed on 5 September 2025).
- European Union Aviation Safety Agency (EASA). Aircraft Noise and Performance (ANP) Data. Available online: https://www.easa.europa.eu/en/domains/environment/policy-support-and-research/aircraft-noise-and-performance-anp-data (accessed on 10 September 2025).
- Basner, M.; Babisch, W.; Davis, A.; Brink, M.; Clark, C.; Janssen, S.; Stansfeld, S. Aviation Noise Impacts: State of the Science. Noise Health 2017, 19, 47–50. Available online: https://pmc.ncbi.nlm.nih.gov/articles/PMC5437751/ (accessed on 15 December 2025).
- World Health Organization. Environmental Noise Guidelines for the European Region; WHO Regional Office for Europe: Copenhagen, Denmark, 2018. Available online: https://www.who.int/europe/publications/i/item/9789289053563 (accessed on 15 December 2025).
- Orikpete, O.F.; Leton, T.G.; Momoh, O.L.Y. Exploring the perception and impact of helicopter noise. Sci. Afr. 2021, 13, e00943. [Google Scholar] [CrossRef]


Disclaimer/Publisher’s Note: The statements, opinions and data contained in all publications are solely those of the individual author(s) and contributor(s) and not of MDPI and/or the editor(s). MDPI and/or the editor(s) disclaim responsibility for any injury to people or property resulting from any ideas, methods, instructions or products referred to in the content. |
© 2025 by the authors. Licensee MDPI, Basel, Switzerland. This article is an open access article distributed under the terms and conditions of the Creative Commons Attribution (CC BY) license.