Abstract
Based on the relevant theories of structural dynamics, this study fully considers the coupling effects between subsystems resulting from the design of inward and outward vibration stiffness parameters in a two-stage vibration isolation system. A dynamic transmission characteristics model of the two-stage vibration isolation system in response to external vibration environments has been established. The theoretical derivation of the impact of the external vibration environment on the core IMU components of laser inertial systems has been completed. Utilizing a method for calculating the dynamic coupling coefficients of the two-stage vibration isolation system, this research provides a theoretical basis for the parameter design and improvement of the vibration isolation system used in laser inertial products. Guided by this theory, a two-stage vibration isolation system was designed, ensuring a rational distribution of output frequencies and the root mean square (RMS) acceleration responses of the IMU components across the entire frequency range. Finally, flight tests were conducted, and the results demonstrate that the two-stage vibration isolation system, designed based on this dynamic transmission characteristics model, can effectively mitigate the normal jitter of the laser gyroscope while achieving significant attenuation of the RMS acceleration response of the IMU components across all frequency ranges, thereby ensuring the output precision of the inertial products.
1. Introduction
The triaxial inertial navigation system is a critical component for aerospace vehicles such as aircraft and missile carriers [1], primarily utilized for navigation and attitude measurement of the vehicle. The triaxial laser inertial measurement unit (IMU) is a highly precise inertial measurement device; however, it is subjected to broad-frequency, high-magnitude vibrations and shocks in operational environments. These conditions directly induce fluctuations in the optical path of the ring laser gyroscope (RLG) [2,3], and vibrations on the platform can cause misalignment of the RLG’s mirrors and beam splitters, thereby affecting the output accuracy of the triaxial laser IMU [4].
It is worth noting that, in addition to mechanical vibration, the stability of laser systems is also susceptible to interference from optical reflection phenomena. Reflux may cause problems such as laser frequency drift and a reduced signal-to-noise ratio, especially in dynamic environments where structural micro displacement caused by vibration may exacerbate the retroreflection effect. In recent years, researchers have significantly reduced the intensity of backscatter by optimizing optical device designs such as oblique angle multimode interference beam splitters [5] and low reflectivity silicon nitride dual channel mode interference couplers [6]. Although this study focuses on mechanical isolation design, reducing structural displacement caused by vibration can also indirectly alleviate the interference of retroreflection on laser systems, providing a potential research direction for optical, mechanical collaborative optimization.
Additionally, to mitigate the lock-in effect of the RLG [7,8,9], mechanical dithering technology is employed in engineering applications, making the RLG itself a source of vibration. Consequently, the operational frequency of the internal vibration isolator must be carefully considered during the design process to ensure proper dithering of the RLG. Therefore, the design of the internal vibration isolation system is a critical and challenging aspect of the triaxial laser inertial product design [10,11,12,13].
The external vibration isolation system [14,15,16,17] can better isolate the triaxial laser IMU from external mechanical environmental influences, ensuring the normal operation of the indexing mechanism and axis system. It provides a favorable mechanical working environment for the inertial instruments and other electronic components of the inertial navigation product, guaranteeing stable and reliable performance of the triaxial laser IMU under high overload and high-magnitude vibration conditions. This meets the requirements for dynamic frequency characteristics and dynamic measurement accuracy. Hence, the triaxial laser IMU structure adopts a dual-level vibration isolation design, incorporating both internal and external vibration isolation systems [18,19,20]. The presence of these two levels of vibration isolation systems leads to coupling between the internal and external vibration isolation systems, presenting a significant challenge in the design of the dual-level vibration isolation system. This paper derives the transfer function of the dual-level vibration isolation system and conducts experiments on the product to ensure that the triaxial laser IMU exhibits excellent dynamic accuracy.
2. Dynamic Transfer Model of Dual-Level Vibration Isolation System
Figure 1 presents the design parameter model of a dual-level vibration isolation system for a specific model.
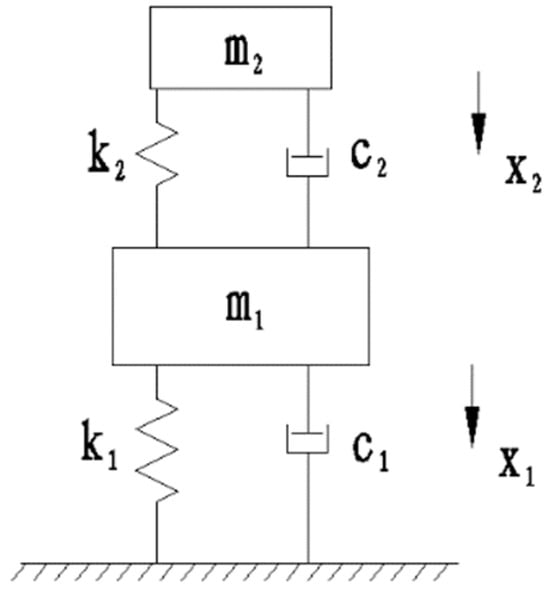
Figure 1.
Design parameter model of a dual-level vibration isolation system for a specific configuration.
In the parameter model of the dual-level vibration isolation system depicted in Figure 1, m1 and m2 represent the masses of the vibration-isolated components for the primary and secondary vibration isolators, respectively. The stiffness and damping coefficients of the primary vibration isolation system are denoted as k1 and c1, while those of the secondary vibration isolation system are represented as k2 and c2.
In a dynamic mechanical environment, the external input acceleration excitation is denoted as , the velocity excitation as , and the displacement excitation as . Under dynamic conditions, the absolute displacement of the mass associated with the primary vibration isolator is , while the absolute displacement of the mass associated with the secondary vibration isolator is . Consequently, the differential equations of motion for the vibration isolation system can be expressed as:
Assuming the steady-state solution of the system is expressed as:
Substituting Equation (2) into Equation (1) yields:
Consequently, the frequency response function of the absolute acceleration response of the two-stage vibration-isolated masses to the input acceleration from the external environment is derived as:
The frequency response function of the displacement response of the two-stage vibration-isolated masses to the input acceleration from the external environment is expressed as:
According to classical vibration theory, the relationship between the output spectral density of the product and the input spectral density can be expressed by Equation (6) as follows:
In Equation (6), represents the spectral density of the output, denotes the spectral density of the external input, and is the frequency response function of the output to the input. The mean square value of the inertial product’s response is calculated as follows in Equation (7):
In practical engineering applications, it is essential to separately consider the influence of damping in the two-stage vibration isolation system on the product output. During the design process of the two-stage vibration isolation system, the factors affecting the output frequency response function include , , , , and . For ease of analysis, let:
Ultimately, the frequency response functions for the isolated masses of the primary and secondary vibration isolators are obtained as follows:
where:
Finally, the spectral density functions for the primary and secondary vibration isolation stages can be expressed as:
3. Design of Parameters for the Two-Stage Vibration Isolation System
3.1. Parameters of the Two-Stage Vibration Isolation System
For laser inertial products, it is crucial to focus on the peak acceleration response and the root mean square (RMS) value of the acceleration response of the IMU component under the influence of external random vibration environments. For specific frequency points, the peak acceleration response reflects the stiffness and amplification factor of the vibration isolation system. For the full frequency range of vibration responses, the RMS value of the acceleration response indicates the damping and overall vibration isolation performance of the system. Additionally, for laser inertial products, it is essential to ensure that the IMU component does not resonate within the frequency range of 360 Hz to 450 Hz, thereby preventing any adverse effects on the dithering of the laser gyroscope.
Based on practical engineering experience, the principle of quality stiffness matching, and the need to avoid overlap between resonance frequency and laser gyroscope jitter frequency (360–450 Hz), this article selects three sets of stiffness parameters for comparative analysis of system response under different stiffness ratios. The stiffness combination of parameter 1 aims to reduce the attenuation level of the entire machine after passing through the vibration reduction system by less than 3 g. Taking parameter 1 as the reference, the stiffness (axial, radial) of the external vibration reduction system of parameter 2 should be consistent with parameter 1, and the stiffness (axial, radial) parameters of the internal vibration reduction system should be adjusted. The internal damping system stiffness (axial, radial) of parameter 3 should be consistent with parameter 1, and the external damping system stiffness (axial, radial) parameters should be adjusted. By comparing and analyzing the effects of three sets of parameters on the overall system performance, the parameters with reasonable stiffness matching and the best attenuation effect are selected for internal and external vibration reduction systems. The detailed parameters are as follows:
Based on the structural design weight of the inertial measurement unit (IMU), three sets of internal and external vibration isolators are selected, each with different stiffness ratios. The detailed parameters are shown in Table 1.

Table 1.
Parameters of the two-stage vibration isolation system.
Based on the acceleration frequency response function given in Equation (5), a mathematical model was established in MATLAB 2018b. Utilizing the parameters of the two-stage vibration isolation system listed in Table 1, the frequency–amplitude response characteristic curves under three different parameter sets were obtained for the two-stage vibration isolation system, as shown in Figure 2.
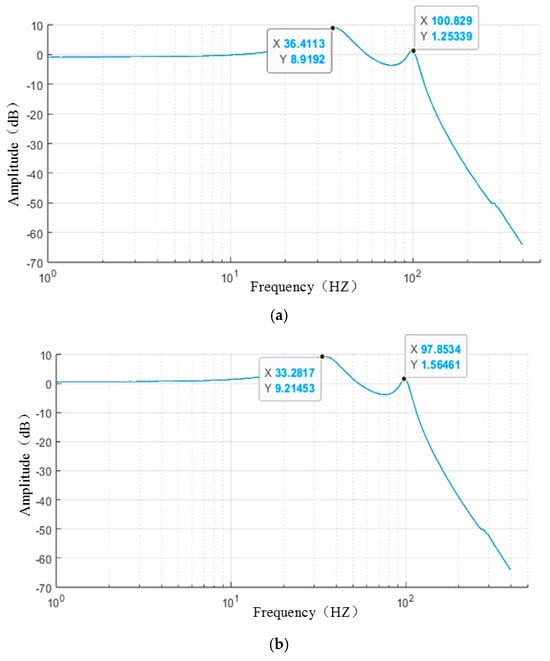
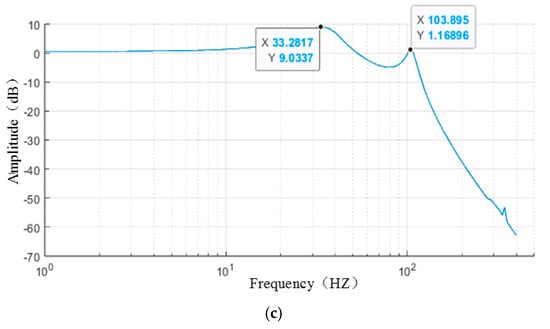
Figure 2.
Rigidity parameter 1 frequency response curve: (a) X direction; (b) Y direction; (c) Z direction.
As shown in Figure 2, Figure 3 and Figure 4, the two-stage vibration isolation system exhibits a low-frequency bimodal spectrum due to its transmission characteristics. According to the parameters in Table 1, the primary peak corresponds to the resonance peak of the outer vibration isolation system, while the secondary peak corresponds to the resonance peak of the inner vibration isolation system. Under stiffness parameter 1, the maximum response amplitude of the outer vibration isolation system is 9.21 dB, and that of the inner vibration isolation system is 1.56 dB. Under stiffness parameter 2, the maximum response amplitude of the outer vibration isolation system is 11.4 dB, while the inner vibration isolation system reaches a maximum of 3.50 dB. Under stiffness parameter 3, the maximum response amplitude of the outer vibration isolation system is 14.2 dB, compared to 6.72 dB for the inner vibration isolation system. Therefore, under stiffness parameter 1, the response amplitude of the two-stage vibration isolation system is the lowest, indicating that the combination of inner and outer vibration isolation system stiffness is reasonably optimized, leading to effective attenuation performance.
Figure 3.
Rigidity parameter 2 frequency response curve: (a) X direction; (b) Y direction; (c) Z direction.
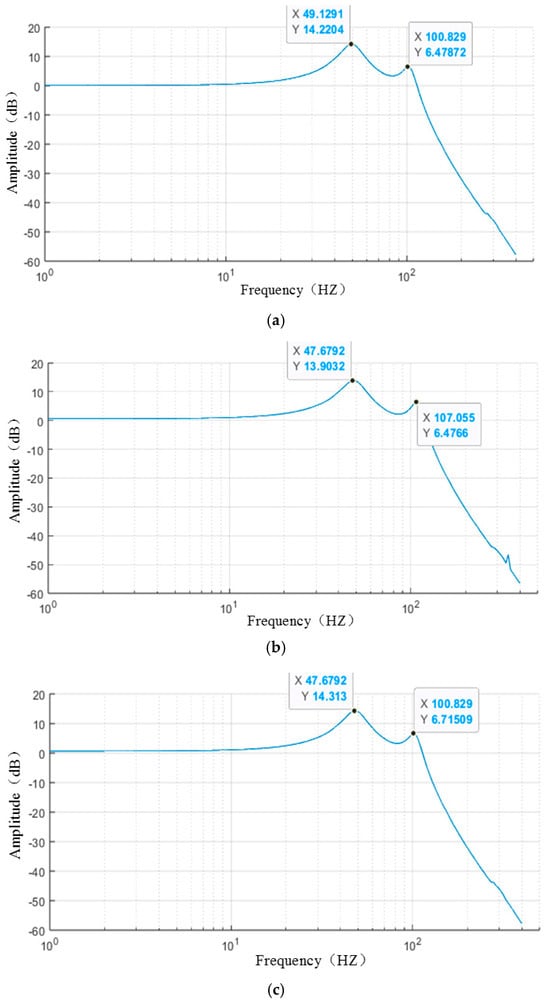
Figure 4.
Rigidity parameter 3 frequency response curve: (a) X direction; (b) Y direction; (c) Z direction.
3.2. Calculation of Dynamic Coupling Coefficients in the Two-Stage Vibration Isolation System
The selection of mass and stiffness parameters in the two-stage vibration isolation system determines the degree of interaction between subsystems. An interaction analysis of the subsystems within the two-stage vibration isolation system is necessary. Based on the model of design parameters for the two-stage vibration isolation system, generalized mass coefficients β11 and β22, generalized stiffness coefficients α11 and α22, and elastic coupling coefficients α12, α23, and γ are introduced, alongside the natural angular frequency parameters n1 and n2 of the subsystems, to compute the coupling coefficients representing the interactions among the subsystems. The dynamic interactions between the subsystems can be expressed through the dynamic coupling coefficients as follows:
where:
Generalized Mass:
Generalized Stiffness:
Elastic Coupling Coefficient:
Generalized Dimensionless Elastic Coupling Coefficient:
Natural Angular Frequency of Subsystems:
The coupling coefficients of the two-stage vibration isolation system under three different design parameters are calculated using Equation (9), as presented in Table 2.
Table 2.
Three sets of rigidity parameters under the two-level vibration reduction system coupling coefficient.
The calculation results in Table 1 demonstrate that the maximum dynamic coupling coefficient of the two-stage vibration reduction system under stiffness parameter 1 is 2, which is significantly smaller than the values of 25.84 and 18.38 observed for stiffness parameters 2 and 3, respectively. This indicates that the inner and outer vibration reduction systems under stiffness parameter 1 exhibit relatively independent motion dynamics. The rational design of stiffness parameter 1 effectively prevents coupling interactions between the inner and outer systems from influencing the sensitive angular velocity and acceleration measurements of the inertial measurement unit (IMU).
4. Numerical Calculation of the Dynamic Transmission of Random Vibration in a Two-Stage Vibration Isolation System
The external vibration spectrum of a certain type of laser inertial product is shown in Figure 5 below.
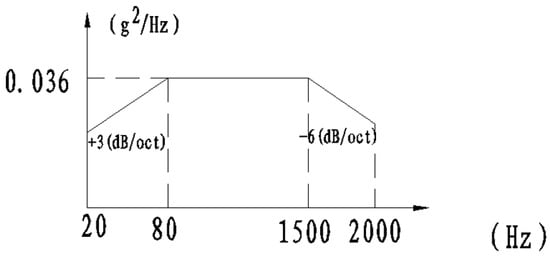
Figure 5.
External vibration spectrum type input conditions of inertial product-Simulation input.
The total root mean square value is 8.1 g, and the loading directions are the x, y, and z directions.
Substitute the above vibration conditions and the stiffness parameter 1 in Table 1 into Equation (8). The responses of the IMU component in three directions of this type of laser inertial measurement unit (IMU) under the external input conditions are calculated and shown in Figure 6 as follows.
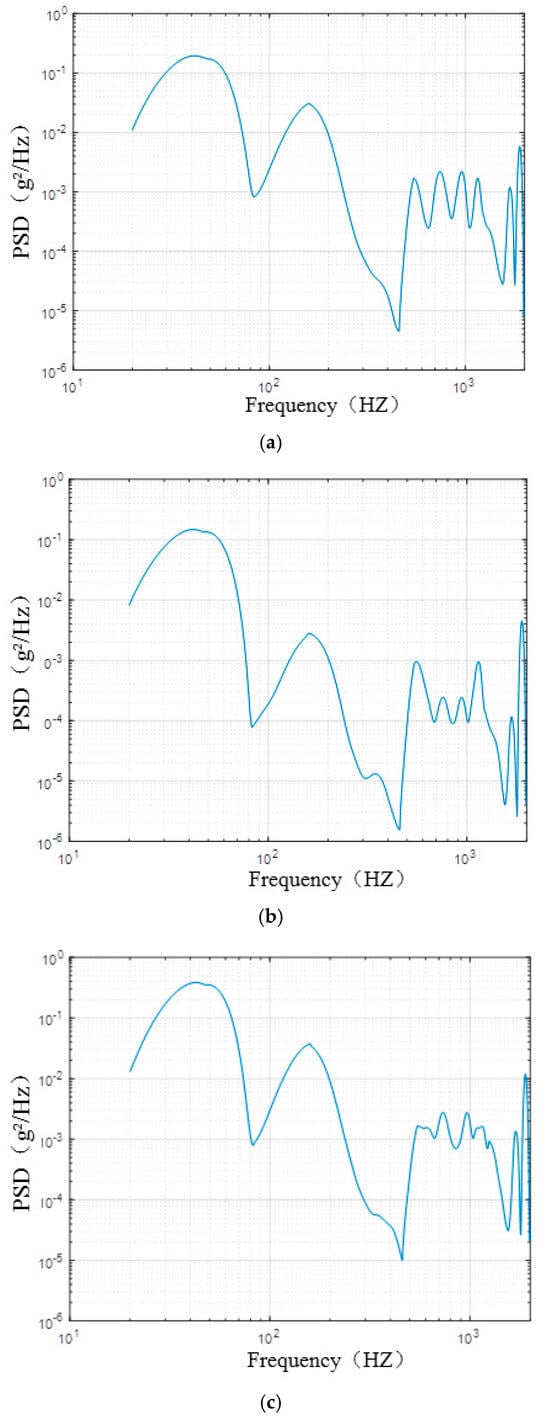
Figure 6.
Calculation curve of random vibration response of laser habit group: (a) X direction; (b) Y direction; (c) Z direction.
For the laser IMU, its product structure has good stiffness and relatively small high-frequency responses. The key point in the design of the vibration isolation system should be to reduce the vibration responses in the full frequency band, provide a good mechanical environment for the IUM component, and ensure that each inertial device operates in a favorable mechanical environment. As can be seen from Figure 6, under the excitation of the external input conditions, the output frequency of the vibration isolation system of this type of laser IMU is far from that of the laser gyroscope. At the same time, the vibration response level of the IMU component in the full frequency band is relatively small, and the vibration isolation system significantly attenuates the external input excitation, indicating that the vibration isolation system with these parameters has a good attenuation effect.
5. Finite Element Simulation Calculation of Random Vibration in a Two-Stage Vibration Isolation System
Finite element simulation technology is an important means of modern structural pre-design [21,22,23,24]. With the help of engineering simulation technology, structural designers can conduct multi-physical field simulation analyses on parts and components in the early stages of product development. They can fully simulate the stress distribution and deformation of structural components under different test conditions, evaluate the environmental adaptability of structural components, expose product defects fully during the development stage, reduce design flaws, and minimize the errors of new products during the development stage.
The geometric structure of the laser IMU is relatively complex. The established geometric model should ensure the consistency of the computational model with the real object in terms of structure, material, and size, as well as the computational efficiency of the model. Therefore, the chamfers, holes, threads, etc., of the laser IMU are omitted. The laser IMU contains a large number of parts, and the assembly relationship is also relatively complex. If all of them are imported into the finite element analysis software according to the actual situation, it will cause many unnecessary problems for the analysis, such as material assignment, contact condition setting, boundary condition setting, etc. Therefore, during the finite element analysis process, the shaft-related parts are simplified, and printed circuit boards, etc., are replaced by simulated mass blocks [25,26]. This not only simplifies the structure of the established model but also makes it more convenient to operate in the finite element analysis software.
To verify the rationality of the simplified model, this paper compares the sixth natural frequency differences between the complete model and the simplified model under constrained conditions, as shown in Table 3. According to Table 3, the natural frequency difference error between the complete model and the simplified model is less than 10%, indicating that features such as chamfers and holes have a small impact on the overall response, thus proving the rationality of the simplification.
Table 3.
Comparison of natural frequency differences between complete and simplified models.
The external vibration isolation system and the internal vibration isolation system of a certain type of laser IMU are shown in Figure 7 and Figure 8 below.
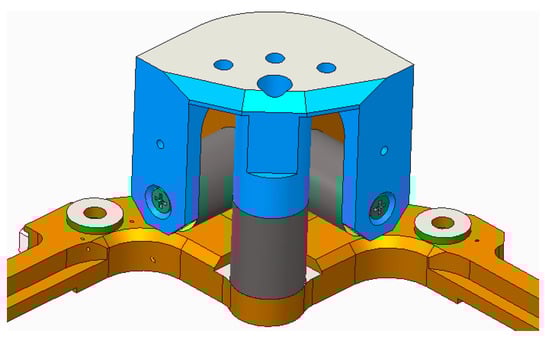
Figure 7.
External vibration reduction system.
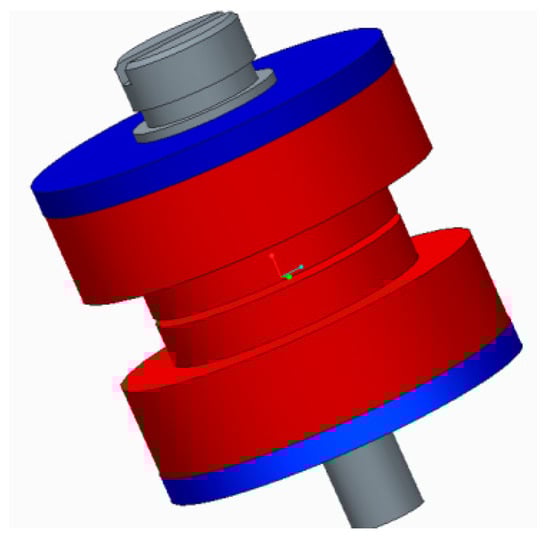
Figure 8.
Internal vibration reduction system.
In the finite element simulation analysis software, the damping elements of the external vibration isolation system and the internal vibration isolation system are set as elastomeric materials [27,28,29,30,31,32]. In this paper, the stiffness values of the external vibration isolation system and the internal vibration isolation system are measured through experiments, and the Mooney–Rivlin constitutive equation is used to fit the characteristic parameters of the first- and second-stage vibration isolation systems [26,33]. The specific fitting curves are shown in Figure 9 as follows.
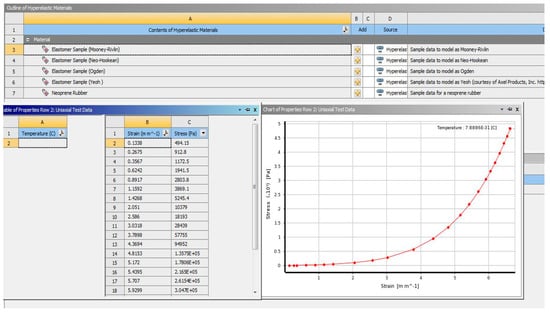
Figure 9.
Extract system material fitting curve.
After completing the material fitting of the vibration isolation system, according to the actual working conditions of the product, the external constraints and internal connections of the product are reasonably set. At the same time, the external environmental excitation conditions in Figure 5 are loaded into the finite element model of the laser IMU, and then the finite element simulation analysis can be started. During the simulation analysis process, measurement probes are set on the IMU component to measure the root mean square value of the full-frequency acceleration response of the IMU component. Finally, the finite element simulation calculation results of the IMU component in three directions are shown in Figure 10 and Table 4 as follows.
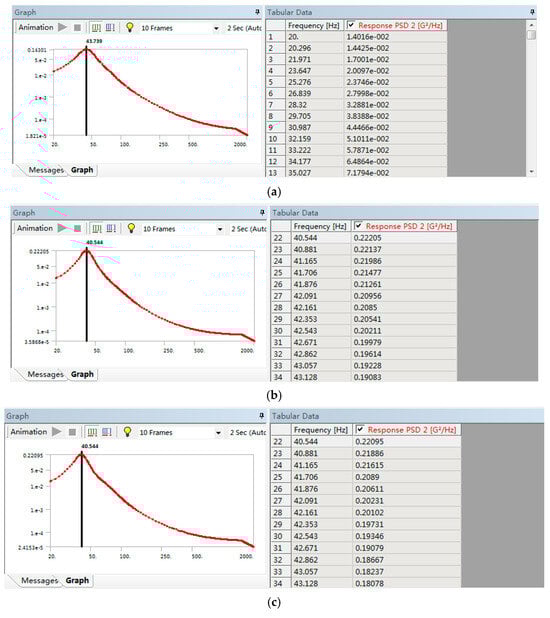
Figure 10.
Laser INS random vibration finite element response calculation curve: (a) X direction; (b) Y direction; (c) Z direction.
Table 4.
Finite element simulation output results.
According to the calculation results in Figure 10, under the external input excitation, the vibration response level of the IMU component in the full frequency band of this type of vibration isolation system is 1.9–2.1 g. The vibration isolation system attenuates the external input excitation, indicating that the vibration isolation system with these parameters has a good attenuation effect.
6. Experimental Verification and Analysis
The laser inertial measurement unit (IMU) of this model and its vibration isolation system were installed on a vibration test bench through vibration fixtures. Sensors were pasted on the IMU components to measure the actual vibration responses of the IMU components.
The bonding of product test sensors (2 control sensors, 1 measuring sensor) is shown in Figure 11.
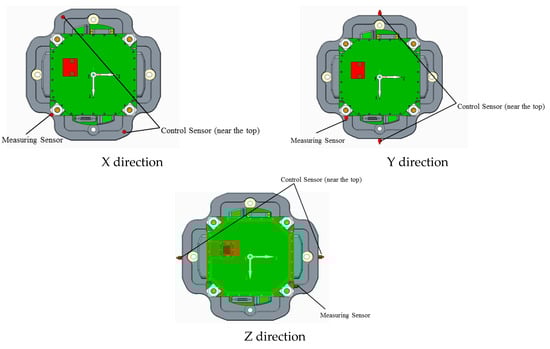
Figure 11.
Schematic diagram of sensor adhesion for three-axis vibration test of inertial measurement unit.
The vibration test selects the random vibration identification test conditions of a certain model of missile equipment as input, as shown in Table 5.
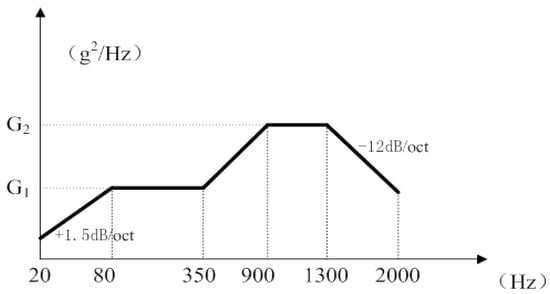
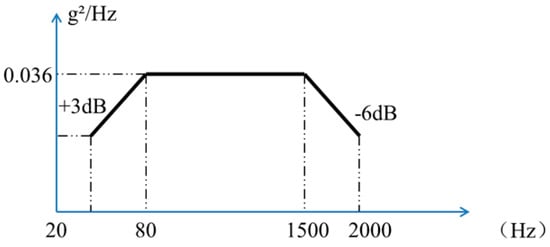
Table 5.
Single machine precision vibration test conditions.
Figure 13.
External vibration spectrum type input conditions of inertial product.
Figure 12.
External vibration spectrum type input conditions of inertial product-Experimental input.
Table 5.
Single machine precision vibration test conditions.
| Frequency (Hz) | Flight Profile | IMU Installation RMS (g) | Control Point Spectrum Shape | Spectral Density | Duration (s) | Loading Direction | ||
|---|---|---|---|---|---|---|---|---|
| G1 | G2 | |||||||
| 20–2000 | powered phase | powered phase 1 | 8.1 | Figure 12 | 0.04 | - | 240 | Three directions |
| reentry | reentry 1 | 2.65 | Figure 13 | - | - | 1100 | ||
| reentry 2 | 5.30 | - | - | 50 | ||||
| reentry 3 | 10.6 | 0.04 | 0.09 | 350 | ||||
6.1. Analysis of Ground Test Results
The test responses of the IMU components are shown in Figure 14.
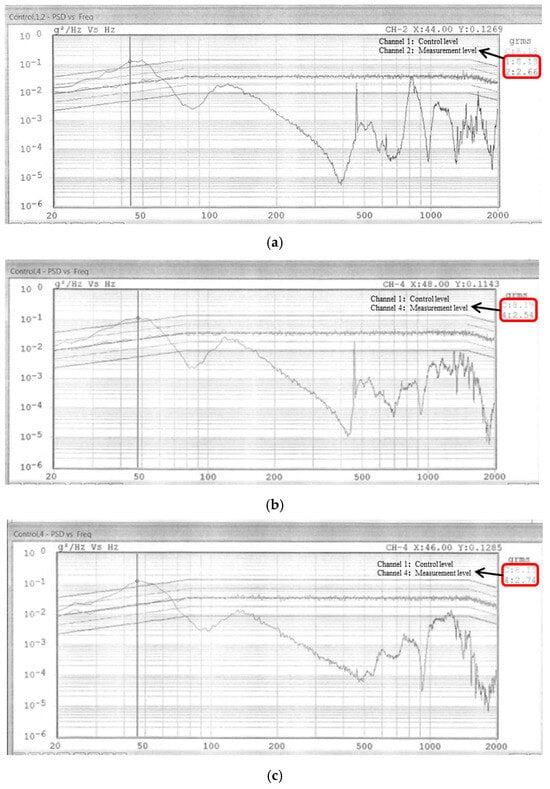
Figure 14.
Response results of the inertial measurement unit of the two-stage damping system. (a) X direction; (b) Y direction; (c) Z direction.
The experimental results show that under a random vibration test with an input load of 8.1 g, the inertial measurement device is attenuated by a two-stage damping system, resulting in a two-stage damping of 2.5–2.8 g at the installation location of the inertial measurement device. The resonance point frequency of the damping system is in the range of 44–48 Hz, effectively avoiding resonance frequency and excitation gyroscope jitter frequency (360–450 Hz).
At the same time, in order to fully verify the effectiveness of the two-stage vibration isolation system, this paper conducted random vibration tests on a single-stage vibration reduction system of a certain type of laser inertial measurement unit. The test results are shown in Figure 15. From Table 6, it can be seen that although the input conditions of the two systems are not consistent, the two-stage damping system has a smaller attenuation level compared to the single-stage damping system under a larger vibration level condition (8.1 g) and a 6.06 g input condition. This means that the two-stage damping system provides a better mechanical environment for the inertial measurement unit and has higher damping efficiency.
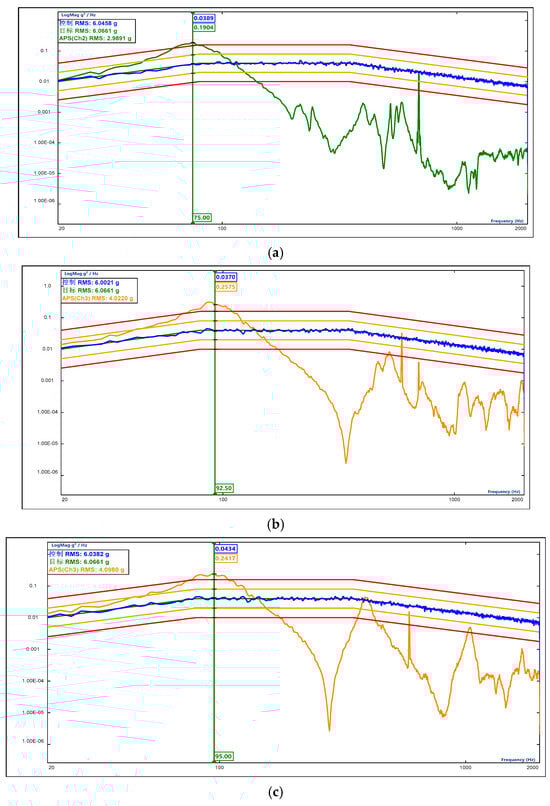
Figure 15.
Response results of inertial measurement unit in single-stage vibration reduction system. (a) X direction; (b) Y direction; (c) Z direction. The Chinese character ‘控制’ means control, and the Chinese character ‘目标’ means goal.
Table 6.
Comparison of attenuation levels after vibration between single-stage and two-stage vibration reduction systems.
6.2. Analysis of IMU Output Data
By conducting vibration navigation tests on the inertial measurement unit, the vibration of the active and reentry phases was carried out according to the vibration spectrum. The navigation results are shown in Table 7 and Figure 16, Figure 17 and Figure 18 (due to space limitations, the results of the X-direction experiment are presented). Figure 16 shows the output additional angle curves of three gyroscopes vibrating in the X direction of the inertial measurement unit; Figure 17 shows the output velocity error curves of three accelerometers vibrating in the X direction of the inertial measurement unit; Figure 18 shows the vibration navigation position error curve after navigation calculation by the inertial measurement unit.
Table 7.
Vibration navigation results.
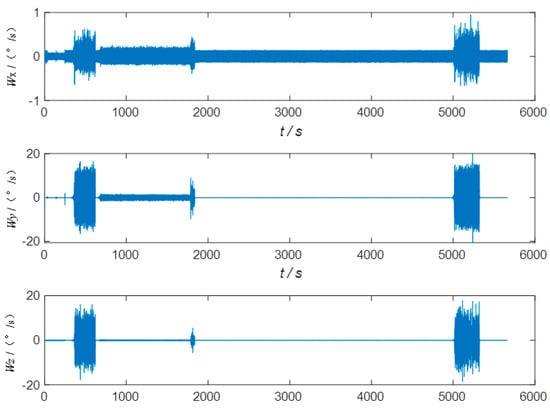
Figure 16.
Inertial measurement unit in X-direction additional angle curve.
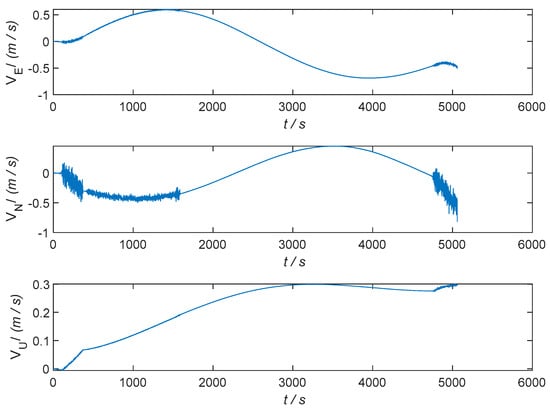
Figure 17.
Inertial measurement unit X-direction vibration navigation velocity error curve.
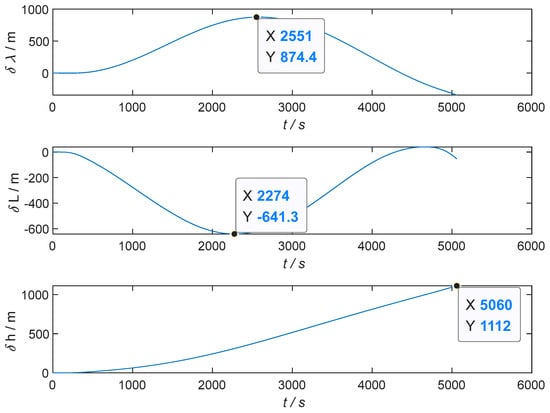
Figure 18.
Inertial measurement unit X-direction vibration navigation position error curve.
According to the precise vibration navigation results, the additional angular velocities in the X, Y, and Z directions all meet the requirements. The maximum accuracy of three-way vibration navigation is 2647 m, which meets the requirements of the indicators. During the flight, the attitude of the carrying equipment was accurately tested, ensuring the successful completion of the flight test.
6.3. Transient Impact Test Verification
To enhance the robustness of this study and investigate the response of a two-stage damping system under transient impact, this paper conducted transient impact test verification on the inertial measurement unit based on the outline test requirements.
The half-sine impact test bench, based on the test input conditions in Table 8 and Figure 19 and the output response on the platform, is shown in Figure 20, Figure 21 and Figure 22.
Table 8.
Semi-sine shock test conditions.
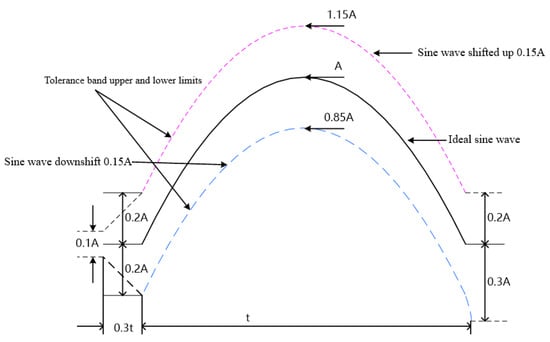
Figure 19.
Semi-sine shock pulse waveform and tolerance.
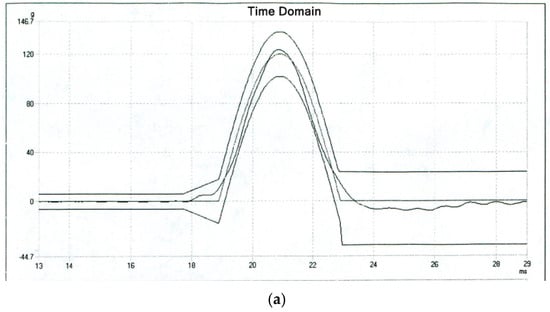
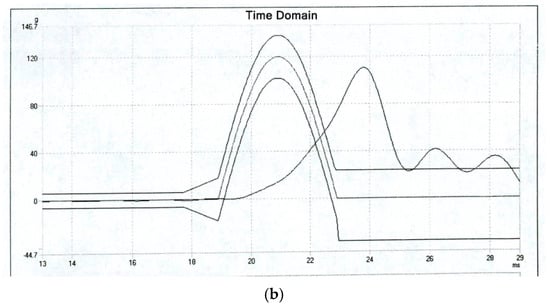
Figure 20.
(a) X-direction impact input; (b) X-direction impact table body response output.
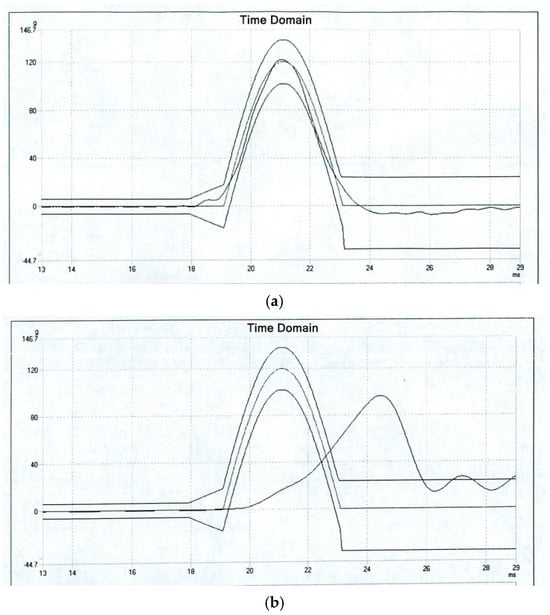
Figure 21.
(a) Y-direction impact input; (b) Y-direction impact table body response output.
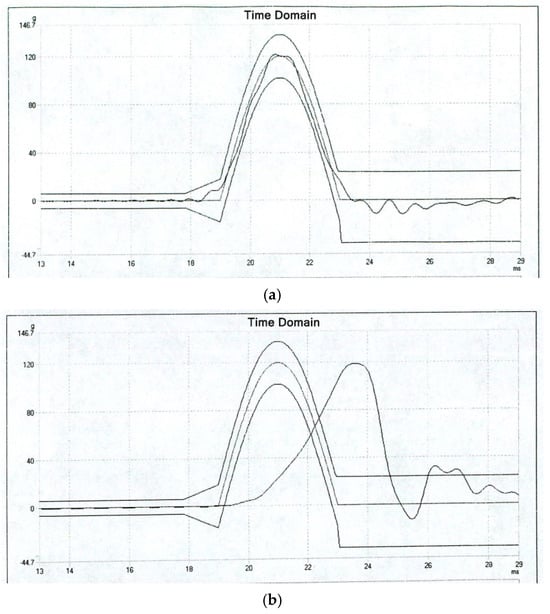
Figure 22.
(a) Z-direction impact input; (b) Z-direction impact table body response output.
According to the input conditions in Figure 20a, Figure 21a and Figure 22a, a half-sine impulse test was conducted. Data were collected based on the output of the laser gyroscope signal from the hybrid inertial measurement system and the angle measurement sensors of the inner and outer frames. The X, Y, and Z test data are shown in Table 9 below.
Table 9.
Data output of inertial measurement system for three-way impact test.
According to Table 9, it can be seen that during the impact tests conducted on the product in the X, Y, and Z directions, the laser gyroscope worked normally, the hybrid laser system function was normal, and the angular velocity change of the platform corresponding to each impact direction was less than 12°/s. The maximum angle change of the inner and outer frames was 0.107°, indicating that the system structure has the ability to withstand large overloads and mechanical environments under a high number of levels and has good environmental adaptability and reliability.
7. Conclusions
Based on the theory of structural dynamics, this paper fully considered the influence of the damping of the vibration isolation system and the differences in the axial and radial stiffness of the vibration isolators on the IMU components. A dynamic transfer characteristic model of the two-stage vibration isolation system of laser inertial products with respect to the external vibration environment was established. At the same time, numerical calculations, finite element analyses, and experimental verifications were carried out on the dynamic responses of the IMU components, and the following conclusions were drawn:
Based on the theory of structural dynamics, a transfer function of the two-stage vibration isolation system of laser inertial products with respect to the external vibration environment was established. The numerical calculation results of this transfer function are consistent with the results of finite element simulation analysis and real-world experimental verification, indicating that the transfer function can well reflect the mechanical transfer model of the two-stage vibration isolation system. In the subsequent design of the two-stage vibration isolation system for laser inertial products, this transfer function can provide guidance for the parameter design of the vibration isolation system.
Based on the calculation method of the coupling coefficient of the two-stage vibration isolation system, for the two-stage vibration isolation system of laser inertial products, the stiffness and damping of the inner and outer vibration isolation systems need to be reasonably matched according to the mass of the part to be isolated. The dynamic coupling coefficient should not be greater than 2 to ensure the relatively independent movement of the inner and outer vibration isolation systems, avoid coupling effects, achieve control of the working frequency of the vibration isolation system, and keep the resonance frequency of the vibration isolation system away from the dither frequency of the laser gyro, thus ensuring the normal dithering of the laser gyro.
Based on the dynamic transfer characteristic model of the two-stage vibration isolation system of laser inertial products, the root mean square value of the acceleration response of the IMU components in the full frequency band was controlled. The vibration of the external environment was effectively attenuated. The random vibration with an external root mean square value of 8.1 g was attenuated to 2.5–2.8 g, achieving an ideal vibration isolation effect, providing a good working environment for the IMU components, and ensuring the output accuracy of inertial products.
Based on the transfer function of the two-stage vibration reduction system for laser inertial products, a certain model of two-stage vibration reduction system was designed, and flight tests were conducted. The tests showed that after attenuation by the vibration reduction system, the additional angular velocity output of the laser gyroscope met the specifications. The maximum accuracy of three-way vibration navigation is 2647 m, which meets the requirements of the indicators. This vibration reduction system effectively attenuates the influence of the external environment on inertial instruments such as gyroscopes and accelerometers, ensuring the successful completion of flight tests.
Author Contributions
Conceptualization, B.Z. and C.H.; Methodology, B.Z., C.H., X.W., H.C., P.Y., Z.G. and S.Z.; Software, B.Z.; Validation, C.H., H.C. and Z.G.; Formal analysis, B.Z. and X.W.; Investigation, P.Y. and S.Z.; Resources, C.H., H.C., P.Y. and X.L. is not mentioned in author contribution part; Data curation, B.Z., X.W. and S.Z.; Writing – original draft, B.Z. and X.W.; Writing – review & editing, C.H. and H.C.; Visualization, X.W. and Z.G.; Supervision, C.H., H.C. and X.L. is not mentioned in author contribution part; Project administration, C.H. and P.Y.; Funding acquisition, C.H. All authors have read and agreed to the published version of the manuscript.
Funding
The author sincerely thanks the National Natural Science Foundation of China for its general project on the prediction method of remaining life of highly heterogeneous inertial measure-ment devices under limited data (62373368) and the National Natural Science Foundation of China for its major research instrument development project on the integration of health man-agement microsystems for key equipment of reusable launch vehicles (62227814).
Data Availability Statement
The original contributions presented in this study are included in the article. Further inquiries can be directed to the corresponding author.
Conflicts of Interest
The authors declare no conffict of interest.
References
- Tazartes, D. An historical perspective on inertial navigation systems. In Proceedings of the International Symposium on Inertial Sensors and Systems, Laguna Beach, CA, USA, 25–26 February 2014; IEEE: Piscataway, NJ, USA, 2014; pp. 1–5. [Google Scholar]
- Gao, B.; Li, S. Laser Gyroscope; National University of Defense Technology Press: Changsha, China, 1984. [Google Scholar]
- Chow, W.W.; Gea-Banacloche, J.; Pedrottil, M. The ring laser Gyro. Rev. Mod. Phys. 1985, 57, 61–104. [Google Scholar] [CrossRef]
- Li, B. Design and Dynamic Characteristics Study of Vibration Reduction System for Laser Gyroscope Strapdown Inertial Unit. Master’s Thesis, National University of Defense Technology, Changsha, China, 2008. [Google Scholar]
- Jonathan, M.; Dror, M. A Two-Channel Silicon Nitride Multimode Interference Coupler with Low Back Reflection. Appl. Sci. 2022, 12, 11812. [Google Scholar]
- Ioudashkin, E.; Malka, D. High-Performance O-Band Angled Multimode Interference Splitter with Buried Silicon Nitride Waveguide for Advanced Data Center Optical Networks. Photonics 2025, 12, 322. [Google Scholar] [CrossRef]
- Guan, Z. Application of Linear Control Theory in Inertial Navigation Systems; Science Press: Beijing, China, 1984; pp. 1–12. [Google Scholar]
- Haykin, S. Principles of Adaptive Filter; Electronic Industry Press: Tokyo, Japan, 1998; pp. 1–56. [Google Scholar]
- Yu, J. Kalman Filter and Its Application in Inertial Navigation; Northwestern Polytechnical University Press: Xi’an, China, 1984; pp. 1–2. [Google Scholar]
- Wang, K.; Gu, Q.; Zhong, D. Wait Research on Vibration Elimination of Machine Shake Laser Gyroscope Foundation. Chin. J. Inert. Technol. 2002, 10, 62–65. [Google Scholar]
- Yang, L.; Rui, X.; Ma, L. Dynamics Modeling and Simulation of Laser Gyroscope Strapdown Inertial Navigation Vibration Reduction System. Chin. J. Inert. Technol. 2008, 16, 301–305. [Google Scholar]
- Ning, D.; Sun, S.; Wei, L.; Zhang, B.; Du, H.; Li, W. Vibration reduction of seat suspension using observer based terminal sliding mode control with acceleration data fusion. Mechatronics 2017, 44, 71–83. [Google Scholar] [CrossRef]
- Capriglione, D.; Carratù, M.; Catelani, M.; Ciani, L.; Patrizi, G.; Singuaroli, R.; Pietrosanto, A.; Sommella, P. Development of a test plan and a tested for performance analysis of MEMS-based IMUs under vibrationconditions. Measurement 2020, 158, 107734. [Google Scholar] [CrossRef]
- Liu, H. Strapdown Inertial Navigation Vibration Reduction System. Chin. J. Inert. Technol. 1995, 3, 29–33. [Google Scholar]
- Tan, T.; Chiasson, D.P.; Hu, H.; Shull, P.B. Influence of IMU position and orientation placement errors on ground reaction force estimation. J. Biomech. 2019, 97, 109416. [Google Scholar] [CrossRef]
- Song, L.; Zhang, C.; Chao, D. An elastic deformation measurement method for helicopter based on double-IMUs/DGPS TRAMS. Measurement 2013, 46, 1704–1714. [Google Scholar]
- Zang, C. Analysis of the IMU precision’s influence on the loop of deeply-coupled GNSS/INS navigation system in high-dynamic environment. Optik 2016, 127, 11379–11385. [Google Scholar]
- Wang, H.; Wu, B.; Zhang, M.; Li, C. Design and Application of Laser Strapdown Inertial Navigation Vibration Reduction System. Aerosp. Control. 2007, 25, 81–89. [Google Scholar]
- Xie, Y.; Lei, Y.; Zhou, J.; Tang, G. Optimization of Structural Parameters of Inertial Navigation Vibration Reduction System. Aerosp. Control. 2005, 32, 39–45. [Google Scholar]
- Yao, J.; Fu, J.; Liu, D. Research on Vibration Coupling Characteristics of Strapdown Inertial Navigation System. Tactical Missile Control. Technol. 2005, 49, 55–58. [Google Scholar]
- Huang, L.; Wang, S.; Yan, Z.; Zhou, B. Research on Integrated Control Vibration Reduction in Inertial Technology. Chin. J. Inert. Technol. 1998, 6, 15–18. [Google Scholar]
- Li, H. Application of Finite Element Analysis Technology in Automotive Wheel Hub Design. Equip. Manuf. Technol. 2021, 4, 143–146. [Google Scholar]
- Moaveni, S. Finite Element Analysis—ANSYS Theory and Application; Yu, O.; Song, W.; Tiecheng, W., Translators; Electronic Industry Press: Tokyo, Japan, 2003. [Google Scholar]
- Logan, D.L. The Basic Course of Finite Element Method, 3rd ed.; Wu, Y.; Wu, Y., Translators; Electronic Industry Press: Tokyo, Japan, 2011; p. 71. [Google Scholar]
- Yin, Y.; Zhang, B.; Du, X.; Jia, M. Finite Element Simulation Modeling Method for Fiber Optic Gyroscope Inertial Navigation System with Shock Absorber. Aerosp. Precis. Manuf. Technol. 2007, 43, 23–30. [Google Scholar]
- Yang, S.; Mi, X.; Wang, X.; Li, D.; Liu, W.; Liu, X. Design Method of Inertial Navigation Vibration Reduction Device Based on Rubber Equivalent Dynamic Modulus. Chin. J. Inert. Technol. 2019, 27, 695–700. [Google Scholar]
- Shang, L.; Zhang, H.; Zhao, X. Dynamics modeling and nonlinear characteristics analysis of inertial small systems. Chin. J. Inert. Technol. 2021, 29, 126. [Google Scholar]
- Liu, H.; Hu, X.; Hu, X. Experimental Study on Dynamic Vibration Characteristics of a Rubber Shock Absorber. Spec. Rubber Prod. 2020, 41, 44. [Google Scholar]
- Shoyama, T.; Fujimoto, K. Direct measurement of high-frequency viscoelastic properties of pre-deformed rubber. Polym. Test. 2018, 67, 399. [Google Scholar] [CrossRef]
- Han, D.; Song, X.; Xue, D. Experimental Study on Nonlinear Dynamic Characteristics of Rubber Shock Absorbers. J. Vib. Eng. 2008, 21, 102. [Google Scholar]
- Huhara, H. Anti Vibration Rubber and Its Applications; Mou, C., Translator; China Railway Press: Beijing, China, 1989. [Google Scholar]
- Yao, J. Comparison of Different Isolation Modes in Strapdown Inertial Unit Systems. Strength Environ. 2009, 36, 19–27. [Google Scholar]
- Tu, Y.; Yang, G.; Cai, Q.; Wang, L.; Yin, H. Dynamical analysis and experimental verification of deviation angles caused by rubber dampers deformation in high precision mechanically dithered RLG dual-axis RINS. Mech. Syst. Signal Process. 2019, 126, 553–567. [Google Scholar] [CrossRef]
Disclaimer/Publisher’s Note: The statements, opinions and data contained in all publications are solely those of the individual author(s) and contributor(s) and not of MDPI and/or the editor(s). MDPI and/or the editor(s) disclaim responsibility for any injury to people or property resulting from any ideas, methods, instructions or products referred to in the content. |
© 2025 by the authors. Licensee MDPI, Basel, Switzerland. This article is an open access article distributed under the terms and conditions of the Creative Commons Attribution (CC BY) license (https://creativecommons.org/licenses/by/4.0/).