Abstract
The increase in global air traffic volumes has significant economic and ecological impacts. A key factor in this context is the development of the noise situation around airports. However, assessing the development of the noise situation at multiple airports simultaneously and in detail requires comprehensive calculations. Therefore, there is a strong need for a simple method to evaluate how the growth of air traffic affects the noise impact around airports, especially under considerations of different what-if scenarios. This can be achieved by assigning a noise-equivalent value to each aircraft that represents its noise impact. These noise points indicate how many movements of a reference aircraft would be required to produce approximately the same noise impact as one movement of the aircraft under consideration. The concept allows for an easy and quick assessment of aircraft noise by summing such noise points, because, as shown in this study, the noise point sum can directly be related to a change in noise levels and contour area. This article presents a promising method for determining noise points and applies it to aircraft groups from a recently proposed database of the German aircraft noise calculation method AzB. The noise point concept is verified at various airports, demonstrating its effectiveness in representing noise situations and developments. The differences of analyzed contour areas obtained via noise calculations and via the noise point concept remain below 3.6% over a generic 30-year forecast.
Keywords:
aircraft noise; noise assessment; noise prediction; noise development; noise point; AzB; AzB21; AIRNAF; PLATON 1. Introduction
In the vicinity of airports, aircraft noise is the most significant environmental problem. This problem is aggravated by the fact that long-term forecasts predict an annual increase in air traffic of approximately 3.6% to 4.2% [,,,]. This increase will result in an increase in aircraft movements and/or in aircraft sizes at most airports. This development hampers the fulfillment of ambitious noise goals and recommendations, such as 65% noise reduction compared to the capabilities of typical new aircraft in 2000 in Flightpath2050 [] or the recommendation of Day–Evening–Night levels below 45 dB by the WHO [] for nearby residents. To analyze the development of the aircraft noise situation (note that the term noise situation in this study generally refers to noise in the vicinity of airports. The measurable descriptor depends on the practitioner, e.g., contour area or number of highly annoyed people) globally, national and international airports must be considered simultaneously, which requires comprehensive calculations and extensive and specific input data; see, e.g., [].
Most relevant for the development of the noise situation is the development of the number of aircraft movements and the composition of operating aircraft types. Local details, such as route structure or the distribution of operations on routes, play a subordinate role in the analyses of the global development of the noise situation. To achieve noise reductions, it is of decisive importance whether the increase in noise impact due to an increase in aircraft movements and higher aircraft weights can be overcompensated by technical innovations. For this reason, it makes sense to evaluate the development of the aircraft noise situation using the concept of “noise points”. In this concept, each aircraft type is assigned a noise point that adequately describes its noise impact. If the noise points of all aircraft movements at an airport are summed, the resulting value provides a measure of the aircraft noise situation and can describe the development of the noise situation at an airport. The concept can thus be used, for example, to assess the noise development at an airport or to assess the noise of different what-if scenarios. For example, in the projects DEPA 2070 [] and the successor DEPA-ext (ongoing) [] conducted by the German Aerospace Center (DLR), different aviation scenarios, up to 2070, are analyzed. Among others, these scenarios consider the introduction of innovative technologies and potential bottlenecks, e.g., in production. The impacts on the environment, economy, and society were assessed in DEPA 2070. Additionally, DEPA ext will incorporate the assessment of aircraft noise through the noise point concept. The noise point concept enables a simple evaluation of the long-term development of noise exposure in the vicinity of airports across various potential development pathways without requiring detailed operational input.
Naturally, noise points can be defined in different ways depending on the purpose and scope of applications, as well as the available data. In this study, a method to determine noise points is conceptualized and applied to the proposed aircraft groups of the German AzB method [], also known as AzB21 []. The aim here is that the sum of noise points shall adequately represent a selected noise contour area and, more importantly, its development. Ready-to-use tables of noise points are provided for the proposed aircraft groups of AzB21 []. The method can also be applied to other aircraft groups or aircraft types. The application of this concept is demonstrated with different traffic scenarios. The concept is verified by comparing the obtained results of the noise point concept with calculated values from detailed aircraft noise calculations.
The presented study is part of the DLR-project DEPA-ext [] and builds upon findings from the DLR-projects DEPA 2070 [] and FluiD-21 [].
1.1. Literature Review
Assigning a value to an aircraft that represents its noise impact is the basis of well-known methods aimed at limiting noise around airports.
A prominent example is the “Quota Count” system at London’s Heathrow, Gatwick, and Stansted airports [], which has also been adopted among others at airports in Madrid, Brussels, Aberdeen, and Warsaw. The “Quota Count” system is used to limit noise at night. In the “Quota Count” system, each aircraft is assigned a value according to its certification levels for approach and departure according to Table 1. The departure level used for this table is an average of the levels at the flyover and sideline certification points, i.e.,
whereas the approach level used for this table is corrected for a smaller propagation distance at the approach certification point compared to the departure certification points by an empirical value of 9 dB, i.e.,
The “Quota Count” provides means of limiting noise impact by specifying an allowed sum, known as the “Noise Quota”. In the case of London’s airports, the “Noise Quota” is specified by the British Department for Transport.

Table 1.
“Quota Count” classification; see, e.g., [].
With regard to the study of aircraft noise development, Rhodes and Hopewell [] used this quota count classification to study the aircraft noise development at regional airports in the United Kingdom. The basis for this study was the relationship demonstrated therein that the contour area of a continuous sound level is approximately proportional to sound intensity, i.e., , where is the sound exposure level in dB of a single event. Similarly to the “Quota Count” system, this study used the values at the certification points. For a better representation of the approach operations, a correction of 11 dB was used instead of the correction of 9 dB as used in the “Quota Count” system.
In Denmark, a “TDENL-method” (Total Day Evening Night Level), which consists of “TSEL” levels (Total Sound Exposure Level), has been used for many years in order to ensure that noise developments around an airport do not exceed limits set by the authorities []. The TSEL value for each aircraft is determined via noise calculations within a certain area and energetic summation of the noise levels for each grid cell within this area, i.e.,
where A is the area of one grid cell, and m2 is a reference area. The TDENL value of a traffic scenario can then be determined by summing the TSEL values as follows:
where j refers to an aircraft type, and N refers to the total number of movements during day (index D), evening (index E), and night (index N). The weighting factors of 3.16 and 10.0 are applied to account for a noise penalty of 5 dB and 10 dB during evening and night periods, as required for the calculation of the Day–Evening–Night level (see, e.g., [,]). In principle, the development of the TDENL can be used to scale a reference LDEN-calculation and corresponding contours.
Within the DLR-project FluiD-21 [], the noise impact of three transport policy measures was investigated. These measures were as follows: (1) movement limits, (2) weight limits, (3) technical restrictions, and combinations of these. In order to investigate the effect on noise impact, two simple noise point definitions were also analyzed. In the first variant, the noise points were defined for each aircraft as the ratio of an contour area to the contour area of a reference aircraft, i.e.,
In the second variant, the noise points were formed from the arithmetic mean value of the at three selection emission points and a corresponding reference value of a reference aircraft, i.e.,
where the parameter q is ultimately set to 3 so that two movements of one aircraft type are equivalent to one operation of an aircraft that is 3 dB louder. The noise points were applied at three generic airports. This showed that the sum of those noise points, which were determined on the basis of the contour areas (first variant A), represents the development of the dB contour area well. An in-depth verification or adjustment of the noise points based on real airports did not take place in this study. These noise points were also applied by Grimme and Schmid [] at the Amsterdam-Schiphol Airport but not compared with a detailed noise calculation. Within the DLR-project DEPA 2070 [], the method of Schmid et al. [] was refined, and its was applicability checked against detailed noise calculations at 10 airports.
For the approximation of changes in contour areas, the Federal Aviation Administration (FAA) developed the Area Equivalent Method (AEM) []. This method assists in determining the need for a detailed noise calculation for an Environmental Impact Statement (EIS), i.e., if the approximated change in contour area as determined with AEM exceeds 17 %, an EIS is required. The AEM is based on contour area approximations for each aircraft type (approach and departure combined) via
where a is the contour area of a single movement, and b is a scaling parameter that specifies the change in contour area relative to the number of movements N for this aircraft. With these approximations, the change in the contour area of a traffic scenario can be estimated. However, the use of this method requires permission from FAA’s Office of Environment and Energy.
1.2. Objective of our Work and Outline
Noise point methods are often based on an assumption about the growth of contour areas with increasing noise levels. Even if not stated explicitly, the noise point definition typically already implies such an assumption. A well-known non-analytical, i.e., empirical, relation is that contour areas grow by about 20% if noise increases by 1 dB (see, e.g., []). In this study, the objective is to develop a method of determining noise points that does not require this sort of assumption. Only when explicitly approximating contour areas is such an assumption introduced and analyzed in detail.
The presented study is based on data from the German “Instructions on the Calculation of Noise Protection Areas” (AzB) [] (with a proposed revised data basis [], known as AzB21), which is described in Section 2. In Section 3, the methodology of determining noise points is described thoroughly. The determination of the noise point sum and corresponding derived quantities for traffic scenarios, e.g., contour areas, are then described in Section 4. One key aspect of this publication is that ready-to-use tables are provided for the AzB21 aircraft groups. With these provided noise points, traffic scenarios and noise developments at all airports can easily be assessed. Finally, the application of the noise point concept is demonstrated in Section 5. By comparing approximations with calculated results, the concept is verified.
2. Tools and Methods
The noise calculation used in this study is based on the method of the German “Instructions on the Calculation of Noise Protection Areas” (AzB) []. This method is of high relevance in Germany due to its prescription for the calculation of noise protection zones by the “Act for Protection against Aircraft Noise” []. In addition, the AzB is almost always used in Germany for aircraft noise calculations in the airport context. It is based on aircraft groups rather than individual aircraft types and is therefore advantageous for long-term prognosis, which is the main application of the noise points designed in this study. Another major advantage of the AzB groups is that an aircraft can always be assigned to a group. Therefore, even aircraft for which no acoustic data is available can be considered.
The current AzB database was published in 2008 and is based on evaluations from the 1990s []. Therefore, modern, quieter aircraft with turbofan engines with a high bypass ratio are only inadequately included in in the regular version. To consider modern aircraft as well, a proposed revised data basis, known as AzB21 [], is used in this study. The current AzB database and the AzB21 database are derived from measurements at permanently installed sound-monitoring systems around airports in Germany and are well verified.
The grouping scheme of the current AzB database and the revised AzB21 database is based on the principles of “acoustic equivalency” and “noise significance” (also see ECAC Doc 29 [], Volume 1). The principle of “acoustic equivalence” states that two aircraft types are acoustically equivalent if the maximum sound pressure levels and single event levels generated by them on the ground are comparable over most of the flight path, i.e., they generate comparable noise footprints for maximum sound pressure levels and single event levels. Acoustically equivalent aircraft can therefore be grouped together and can be described by a single representative aircraft. A good grouping is characterized by the fact that the level of the standard deviation of measured noise levels for a group cannot be reduced by further subdividing the group. The principle of “noise significance” states that the total noise at an airport can usually be determined by only a few aircraft. Such noise-significant aircraft must be modeled as accurately as possible. When modeling non-noise-significant aircraft, on the other hand, less stringent requirements can be placed on the grouping.
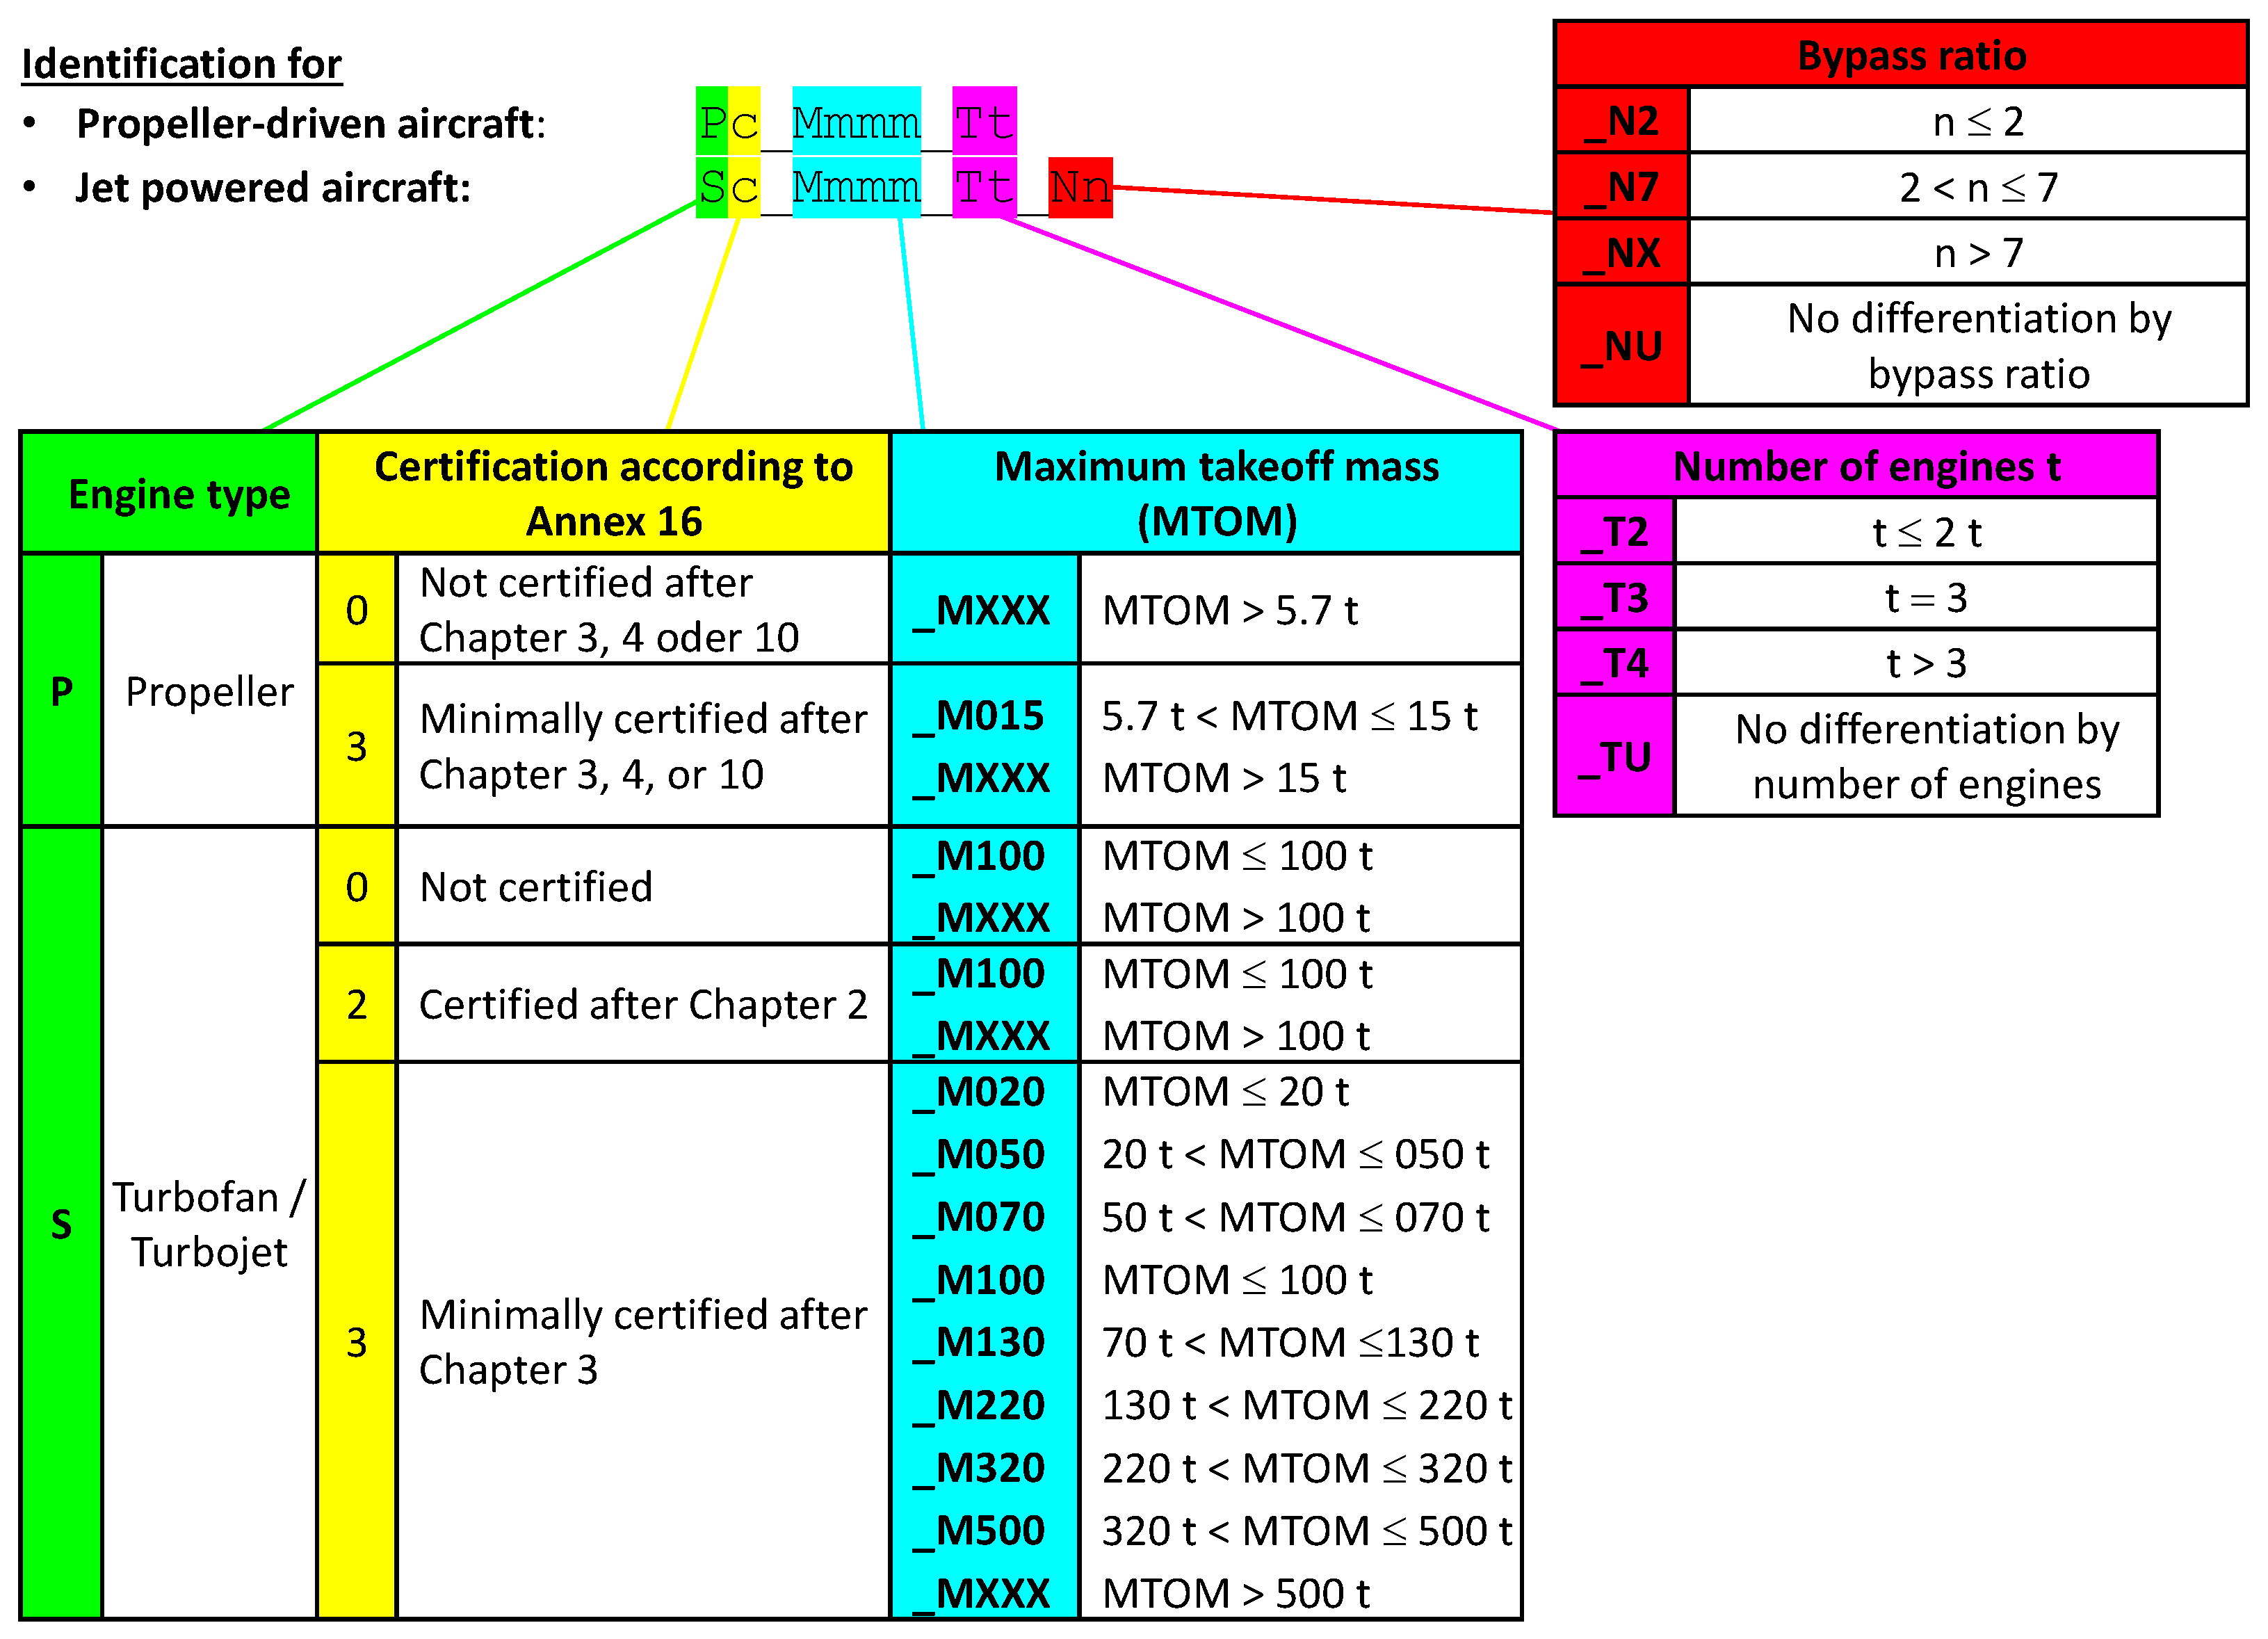
The aircraft groups of AzB21 [] are developed based on a differentiation between engine type (propeller or turbofan), certification, maximum takeoff mass (MTOM), number of engines, and bypass ratio. The resulting aircraft groups of the AzB21 database are summarized in Figure 1. In total, the grouping scheme of the AzB21 database leads to 44 aircraft groups, for which details can be found in []. To give some examples, Airbus A320 (MTOM: 78 t) is assigned to the AzB21 group “S3_M130_T2_N7”, a Boeing B747-400 (MTOM: ≈400 t) is assigned to the AzB21 group “S3_M500_T4_N7”, and any Bombardier CRJ (MTOM: ≈24–42 t) is assigned to the AzB21 group “S3_M050_TU_N7”. Note that aircraft belonging to category P0 and S0 are not considered in this study due to their irrelevance at most airports.

Figure 1.
Identification scheme of revised AzB aircraft groups [].
Each aircraft group consists of one data sheet for approach (labelled with an additional “-L” to the group name) and one or two data sheets for departure (labelled with an additional “-SA” for takeoff weights below 85% MTOM and “-SB” for takeoff weights above 85% MTOM). Most relevant in each data sheet of these “aircraft classes” is the spectrum, the coefficients describing the directivity, and the fixed-point-profile.
All noise calculations in the presented study were carried out using the DLR-internal software v0.9.0 framework AIRNAF (Aircraft Noise Analyses Framework), in which, amongst others, the AzB method and the underlying databases are implemented. AIRNAF is also part of the DLR process chain PLATON [], which enables noise studies without large personnel costs (see, e.g., []). Within this process chain, traffic forecasts, flight path simulations, and aircraft noise calculations are considered and connected via defined interfaces.
3. Conception of Noise Points
A traffic scenario typically consists of multiple aircraft types that operate on various routes. The equivalent continuous sound level for a traffic scenario is determined by summing all occurring single-event sound exposure levels within a time period T: that is,
where s, and N is the total number of movements. If is constant, e.g., because only a single aircraft operates on a straight track originating from a single runway, then the equation can be simplified to
Thus, the equivalent continuous sound level only scales with the number of movements N within time T. The change in equivalent continuous sound level can be written as
where is the number of movements of the baseline traffic scenario. If, for example, the number of movements could be reduced by 10%, the equivalent continuous sound level would change by dB.
This simple relation, however, cannot be applied to traffic scenarios. The reason is that even though the distribution on routes can usually be assumed constant, the fleet mix will most definitely change because older aircraft are being retired and replaced by modern ones. To make this simple equation applicable, a possible solution is to replace each movement of an aircraft type by an equivalent number of movements of a reference aircraft type. As a result, the fleet mix of the original traffic scenario can be reduced to only one aircraft type. The previous equation then becomes
where is the number of movements for aircraft type g, and is the corresponding number of equivalent movements. Figure 2 shows a simple example that visualizes the idea behind the concept. In the following, the equivalent number of movements is simply referred to as noise point P, i.e., .

Figure 2.
Visualization of the noise point concept. Converting the original aircraft movements to a total number of equivalent movements allows the estimation of the corresponding noise reduction in future traffic compared to baseline traffic without noise calculations.
Since all aircraft types have their own operational and acoustical characteristics, the reduction in aircraft movement to an equivalent number of movements of a reference aircraft type can only be an approximation. Therefore, a noise point can be determined with various methods, and none are exact. For the development of the herein presented method, the objective was, on the one hand, to develop a noise point sum of a traffic scenario that reflects the noise situation and its development as accurately as possible. On the other hand, the objective was to introduce assumptions (e.g., for the approximation of contour areas) as late as possible. Several methods have been analyzed by the authors in course of projects FluiD-21 [] and DEPA 2070 [] and the ongoing project DEPA-ext. The most promising method, especially when considering the aircraft noise calculation method commonly used in Germany, is presented here.
This noise point of the presented method is determined based on equal contour areas. As such, the noise point can be defined as follows:
- A noise point Pg represents how many movements of a reference
- aircraft are needed to produce the same noise impact with a
- pre-selected contour area as one movement of aircraft g.
In the following, noise points are, in the first step, determined for AzB groups (which comprise one approach and one or two departure data sheets) in Section 3.1. In the second step, the noise points are then separated into individual noise points for approach and departure (known as AzB class) (see Section 3.2). Finally, how time-of-day-dependent weighting can be considered when using noise points is described in Section 3.3.
3.1. Determination of Noise Points for AzB Groups
In order to determine the noise points based on contour areas, it is advantageous to use an average sound exposure level contour from a mix of approach and departure operations rather than evaluating approach and departure separately. This is carried out because the contours of approach and departure operations significantly overlap in traffic scenarios and assessing both individually would falsify the noise points. For specific applications, it may be required to differentiate between approach and departure operations. For such cases, the combined noise points can be separated into individual noise points for approach and departure, which is described in Section 3.2. Note that this separation is based on the combined noise points and that, due to the methodology, it is not possible to determine the individual noise points first.
A simple airport layout is chosen here, i.e., a single 3 km long runway oriented in the east/west direction. To obtain a realistic sound exposure level contour from a mix of approach and departure operations, an operation direction distribution of 70% west and 30% east is used, which is typical in Germany. The number of approach and departure operations are equally set to 50%. Thus, the following four cases need to be calculated for each AzB group:
- Approach, operating direction west;
- Approach, operating direction east;
- Departure, operating direction west;
- Departure, operating direction east.
Note that for departure, only the “-SB” variant (>85% MTOM) is considered here. To obtain a single averaged for AzB group g, these four cases are averaged energetically via
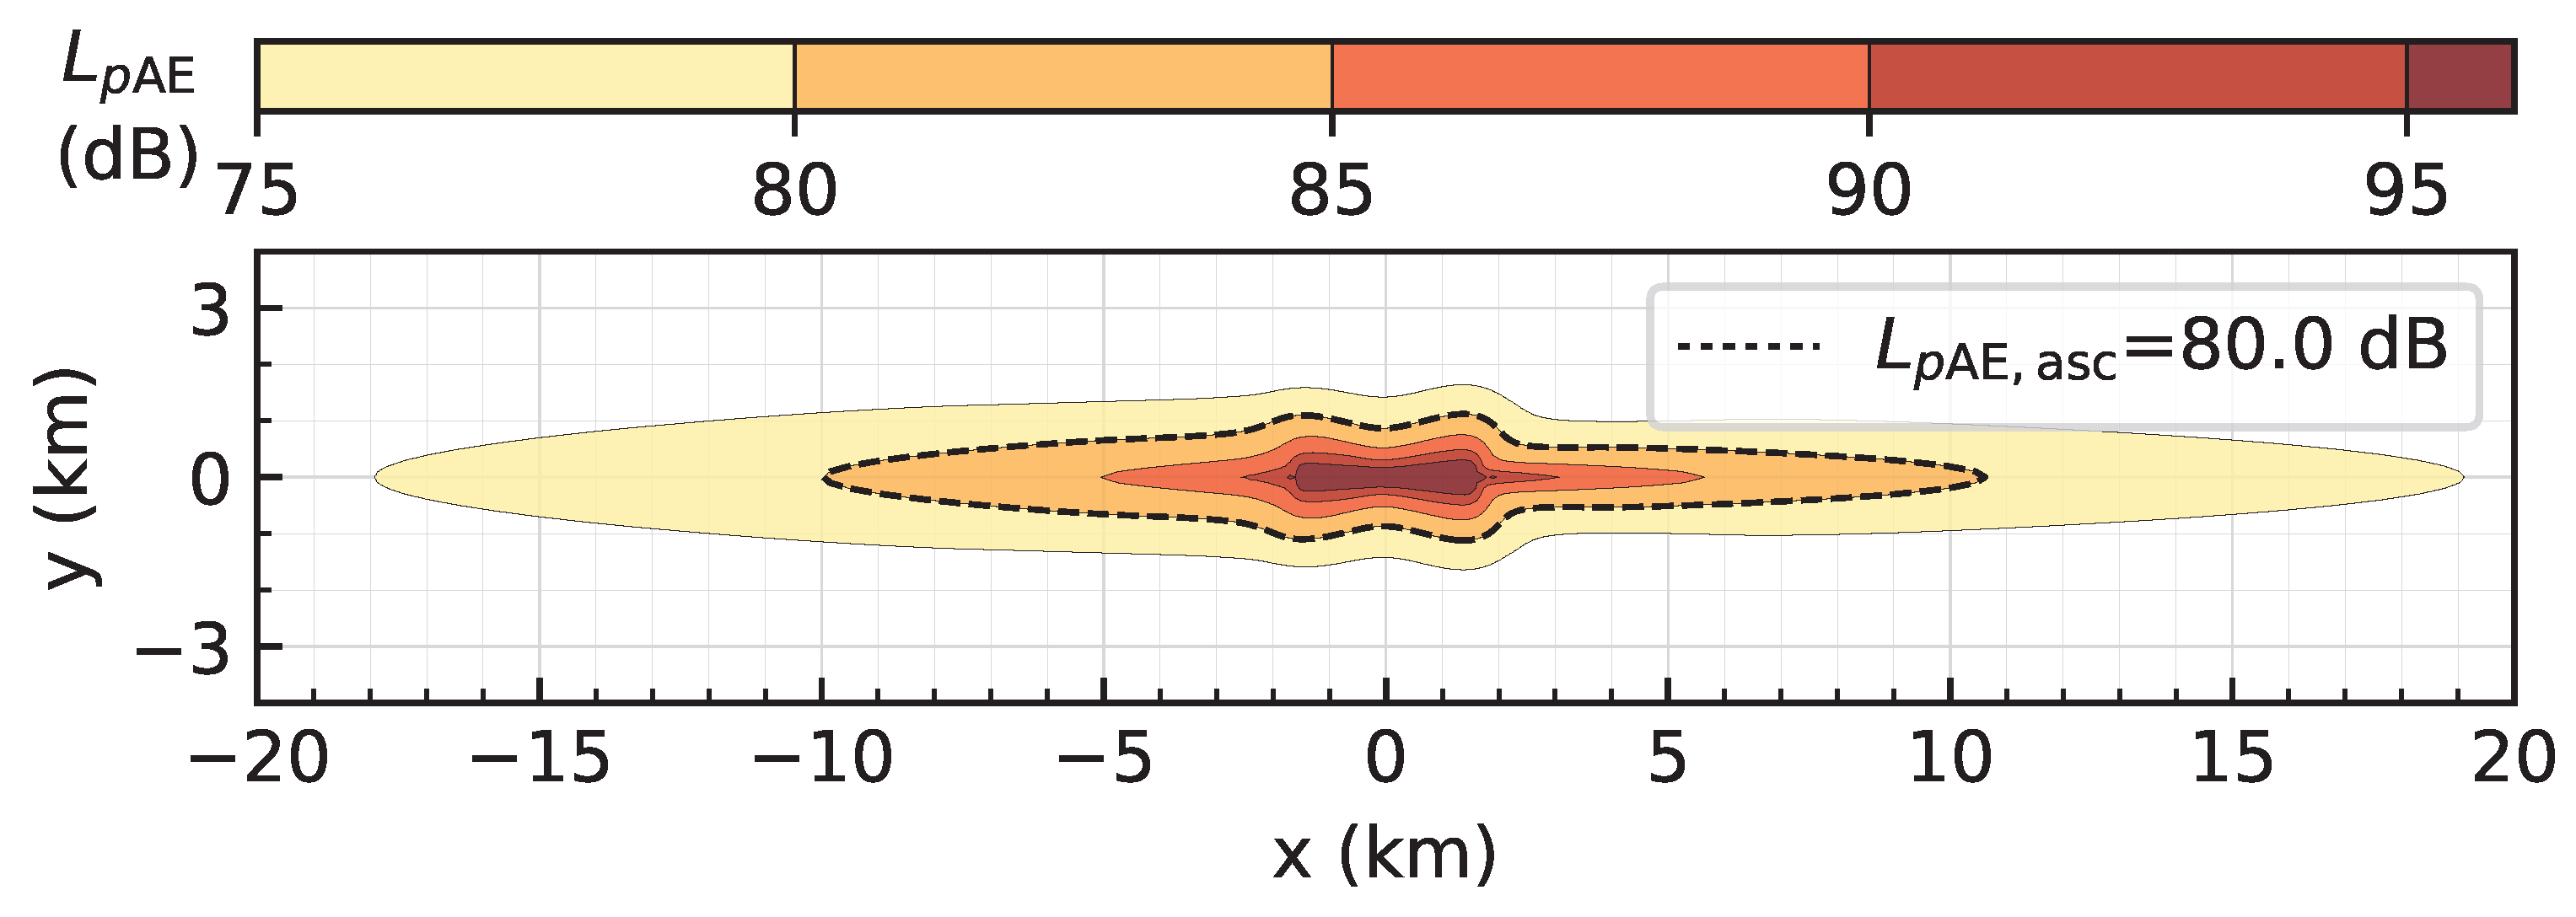
In the following, the AzB group S3_M130_T2_N7 is used as the reference group. This group was selected because it is the noise-dominant group at most German airports. This group includes, among others, the aircraft types of the A320 family and B737-700 to -900 []. Furthermore, the selected reference contour value is 80 dB because this value creates a footprint that is approximately the size of typical noise protection areas at most German airports.
The noise contour computed with AIRNAF for the selected reference AzB group is shown in Figure 3. Highlighted with a dashed line is the contour line for the reference value of 80 dB, which gives the reference contour area of km2.

Figure 3.
Averaged contour for the reference AzB group S3_M130_T2_N7 using a weighting of 70% west and 30% east operation directions, as well as equal weightings of approach and departure. Highlighted with a dashed line is the contour line for the reference value of 80 dB, which gives the reference area of km2.
The following three steps are then performed for each AzB group. Firstly, the averaged is determined as described in the previous paragraph for each AzB group g. Secondly, the value, which gives the same contour area as the reference contour area of 24.2 km2, is determined iteratively. This value is now referred to as associated sound exposure level because it is directly associated with the reference area. The values of each aircraft group are summarized in Table 2 (second column).
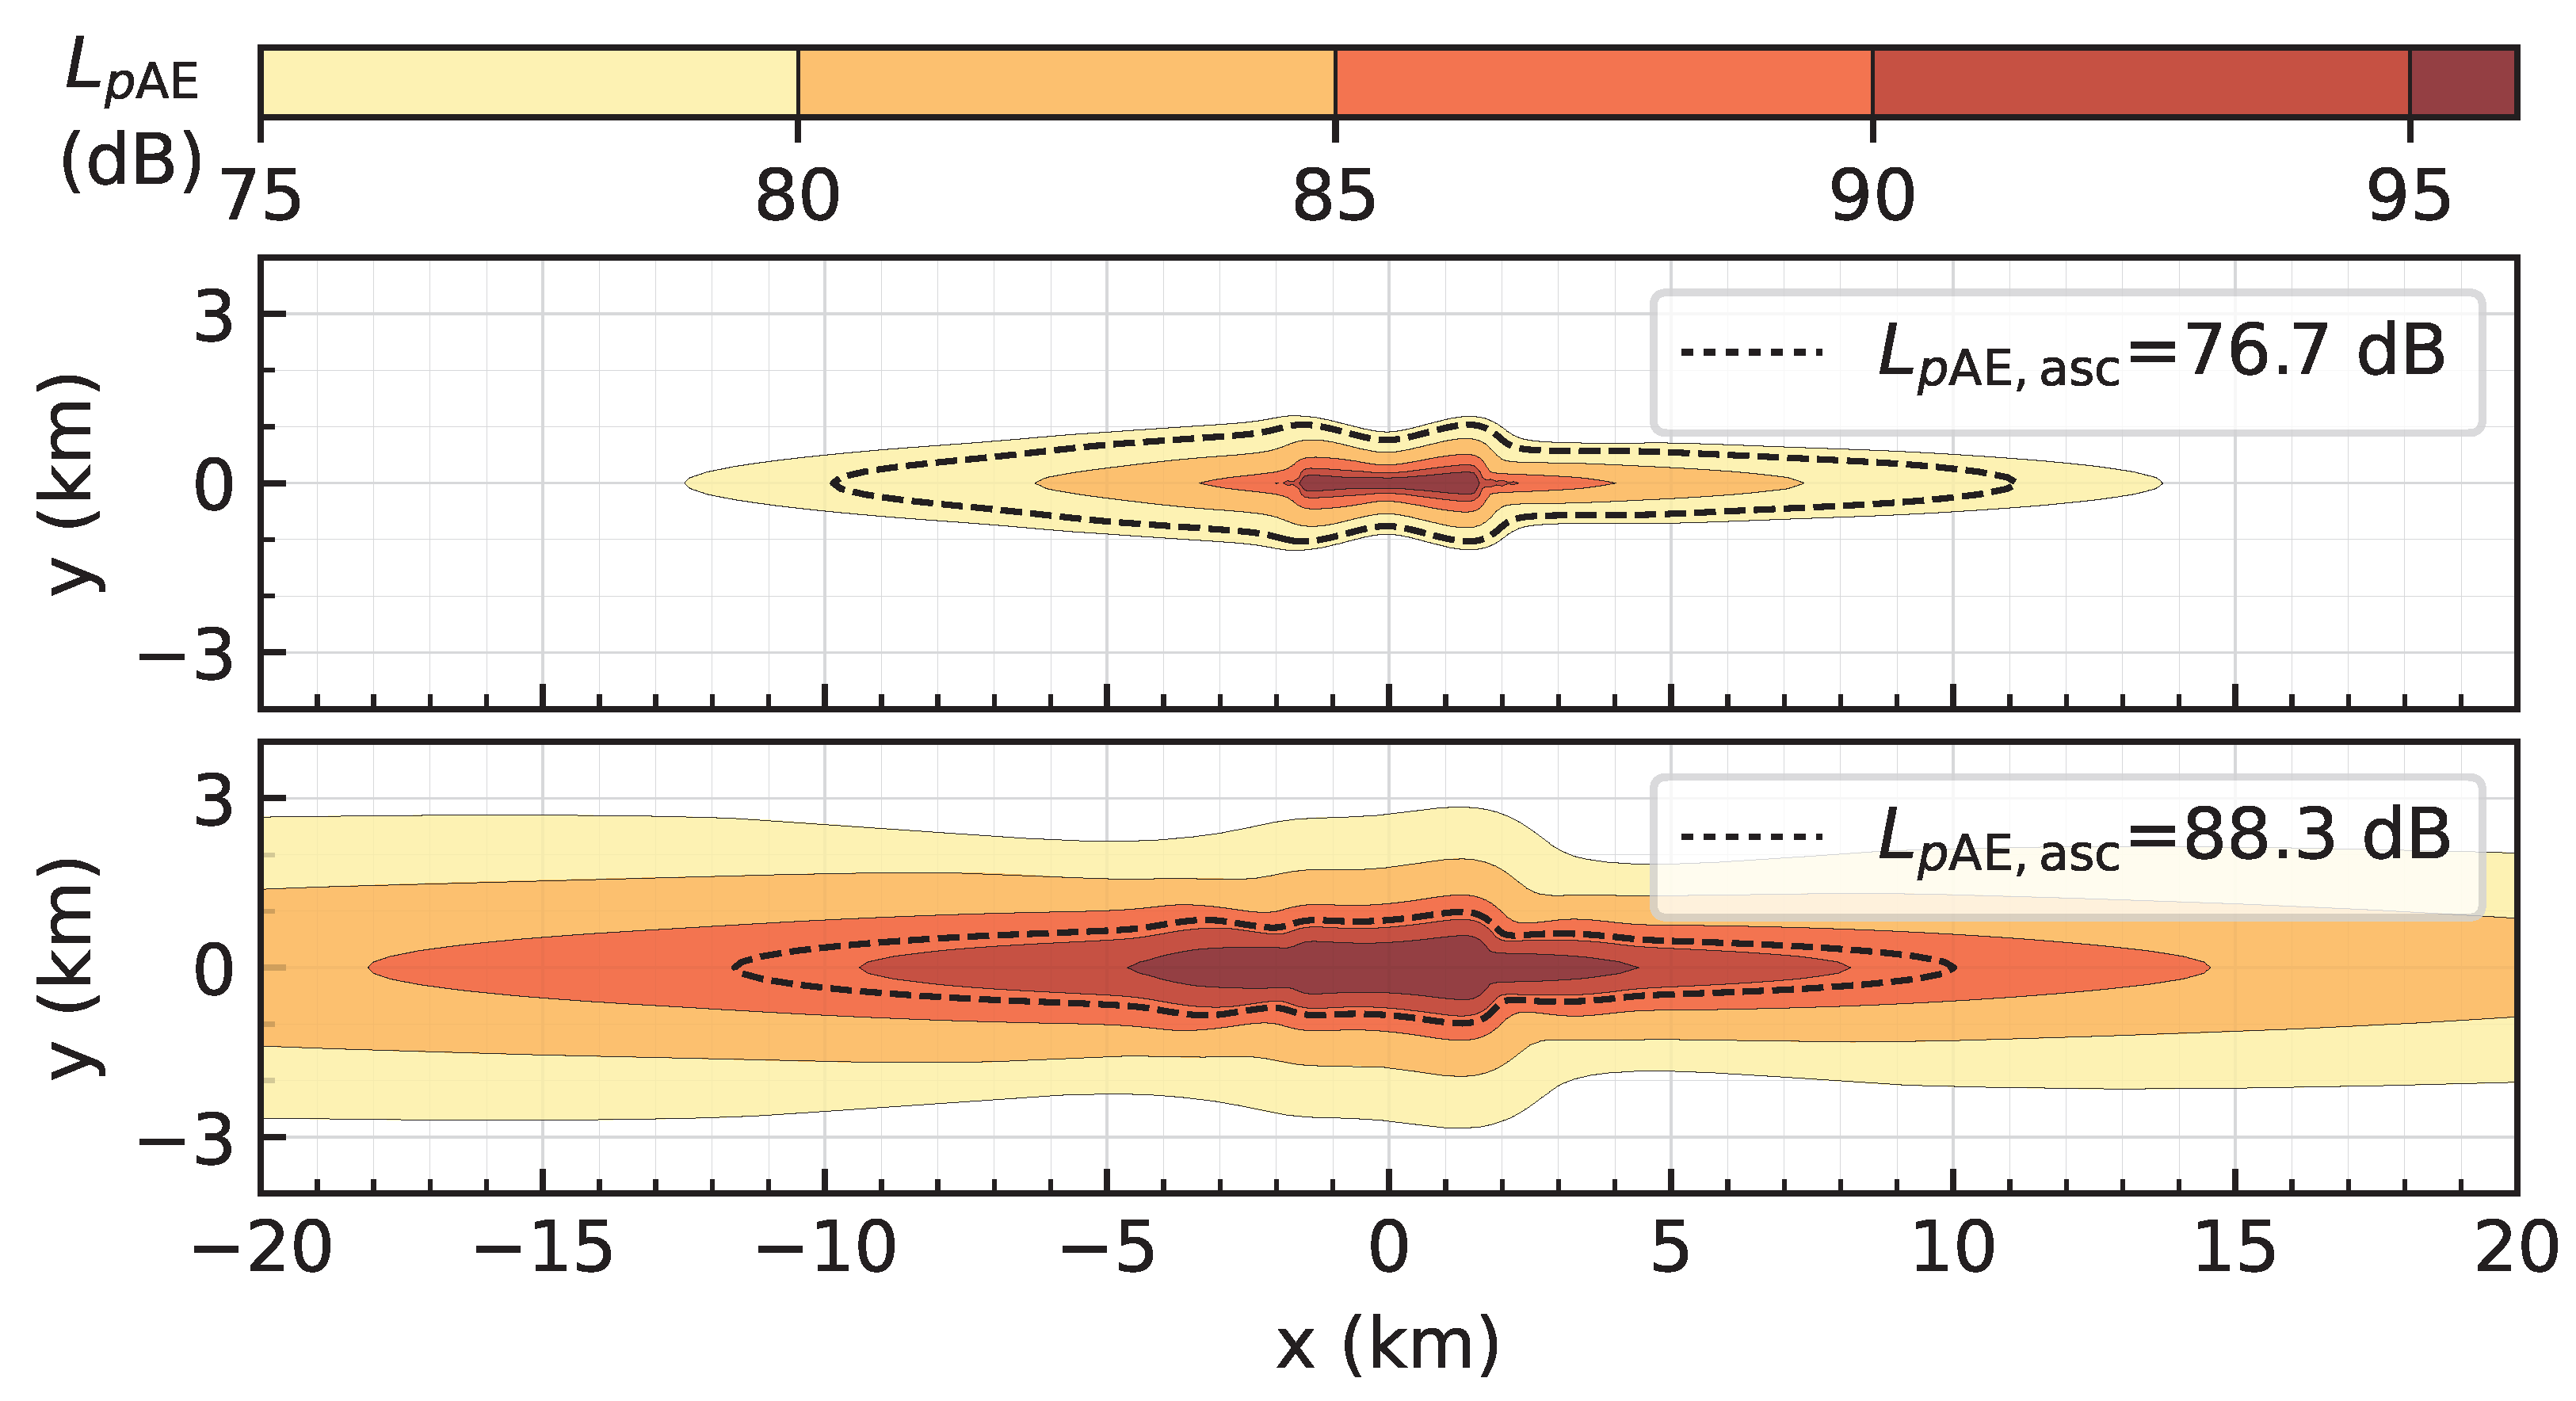
Two examples are shown in Figure 4 using the AzB groups S3_M050_TU_N7 and S3_M500_T4_N7. The associated sound exposure levels are 76.7 dB for S3_M050_TU_N7 and 88.3 dB for S3_M500_T4_N7. The corresponding contour lines are shown as dashed lines in Figure 4.

Figure 4.
Examples of averaged contours using a weighting of 70% west and 30% east for operation directions, as well as equal weightings of approach and departure. Highlighted with a dashed lines is the contour, which has the same area as the reference area of 24.2 km2. The corresponding noise level is referred to as the associated sound exposure level . Two AzB groups are shown: (top) S3_M050_TU_N7; (bottom) S3_M500_T4_N7.
Finally, the noise point , i.e., the equivalent number of movements, can then be determined with a third step for each AzB group g via
where dB is the selected reference value of 80 dB. For example, if the associated sound exposure level of an AzB group is 3 dB higher compared to the reference level, the noise point would equal 2. This means that one movement of this AzB group could be replaced by two movements of the reference AzB group.
The resulting noise points of all aircraft groups are summarized in Table 3 (second column). As can be seen, the noise point of the reference aircraft group S3_M130_T2_N7 equals 1. This is advantageous because the noise point sums at most German airports approximately equals the number of movements.
Note that, using the described method, any other aircraft group could be selected as reference. In this case, it is important to note that as long as the reference contour area remains the same, the associated levels of all aircraft groups also remain unchanged. Only the reference level would need to be updated to equal the associated level of the new reference aircraft group. Consequently, the noise points would scale by a constant factor as well.

Table 2.
Associated sound exposure level for which the contour area of the respective AzB group yields the reference area of 24.2 km2. Also, the contour areas of for approach (L) and departure (SA and S/SB) in km2 are listed.
Table 2.
Associated sound exposure level for which the contour area of the respective AzB group yields the reference area of 24.2 km2. Also, the contour areas of for approach (L) and departure (SA and S/SB) in km2 are listed.
AzB Group | Area (L) | Area (SA) | Area (S/SB) | |
---|---|---|---|---|
P3_M015_TU | 71.3 | 13.33 | / | 8.81 |
P3_MXXX_TU | 74.8 | 15.37 | / | 6.67 |
S3_M020_TU_NU | 75.2 | 5.70 | / | 17.04 |
S3_M050_TU_N7 | 76.7 | 8.26 | / | 14.52 |
S3_M050_TU_NX | 74.2 | 13.27 | / | 9.99 |
S3_M070_TU_N7 | 79.6 | 7.93 | / | 15.39 |
S3_M070_TU_NX | 76.2 | 12.60 | / | 9.30 |
S3_M100_TU_N2 | 86.0 | 1.05 | / | 22.04 |
S3_M130_T2_N7 | 80.0 | 6.96 | 13.41 | 15.65 |
S3_M130_T2_NX | 77.4 | 9.27 | 10.67 | 12.33 |
S3_M220_T2_N7 | 83.0 | 6.85 | 13.70 | 16.43 |
S3_M220_T4_N7 | 86.0 | 6.88 | / | 16.43 |
S3_M320_T2_N7 | 83.7 | 5.85 | 14.29 | 16.94 |
S3_M320_T2_NX | 80.1 | 9.65 | 10.73 | 13.15 |
S3_M320_T3_N7 | 86.6 | 6.73 | 11.00 | 16.67 |
S3_M320_T4_N7 | 85.2 | 3.46 | 16.31 | 19.99 |
S3_M500_T2_NX | 83.0 | 9.04 | 11.53 | 14.52 |
S3_M500_T4_N7 | 88.3 | 5.03 | 15.52 | 19.03 |
S3_M500_T4_NX | 86.8 | 6.21 | 13.72 | 17.12 |
S3_MXXX_T4_NX | 85.1 | 6.44 | 13.47 | 16.56 |

Table 3.
Noise points for AzB groups and classes. If no differentiation between approach (L) and departure (SA and S/SB) is required, the use of Point (total) is sufficient. Note that one approach operation and one departure operation equals two movements, i.e., .
Table 3.
Noise points for AzB groups and classes. If no differentiation between approach (L) and departure (SA and S/SB) is required, the use of Point (total) is sufficient. Note that one approach operation and one departure operation equals two movements, i.e., .
AzB Group | Point (Total) | Point (L) | Point (SA) | Point (S/SB) |
---|---|---|---|---|
P3_M015_TU | 0.135 | 0.163 | / | 0.108 |
P3_MXXX_TU | 0.303 | 0.422 | / | 0.183 |
S3_M020_TU_NU | 0.329 | 0.165 | / | 0.494 |
S3_M050_TU_N7 | 0.469 | 0.340 | / | 0.598 |
S3_M050_TU_NX | 0.260 | 0.297 | / | 0.224 |
S3_M070_TU_N7 | 0.905 | 0.616 | / | 1.195 |
S3_M070_TU_NX | 0.415 | 0.478 | / | 0.352 |
S3_M100_TU_N2 | 4.021 | 0.365 | / | 7.677 |
S3_M130_T2_N7 | 1.000 | 0.616 | 1.186 | 1.384 |
S3_M130_T2_NX | 0.547 | 0.469 | 0.541 | 0.624 |
S3_M220_T2_N7 | 1.990 | 1.171 | 2.341 | 2.809 |
S3_M220_T4_N7 | 3.988 | 2.304 | / | 5.673 |
S3_M320_T2_N7 | 2.346 | 1.206 | 2.947 | 3.487 |
S3_M320_T2_NX | 1.012 | 0.857 | 0.953 | 1.168 |
S3_M320_T3_N7 | 4.568 | 2.625 | 4.293 | 6.512 |
S3_M320_T4_N7 | 3.288 | 0.971 | 4.573 | 5.606 |
S3_M500_T2_NX | 1.992 | 1.529 | 1.951 | 2.456 |
S3_M500_T4_N7 | 6.684 | 2.797 | 8.625 | 10.572 |
S3_M500_T4_NX | 4.771 | 2.539 | 5.613 | 7.003 |
S3_MXXX_T4_NX | 3.226 | 1.806 | 3.779 | 4.645 |
3.2. Determination of Noise Points for the AzB Classes
Up to this point, only noise points for the AzB groups have been determined, i.e., departure and approach are evaluated simultaneously. In some applications, however, it can be relevant to differentiate between approach and departure. This differentiation is relevant, for example, when the departure and approach of an aircraft happens during different times of the day, and at the same time, a time weighted noise level will be evaluated, e.g., LDEN [,]. In order to differentiate between approach and departure, the previously determined combined noise point must be separated into individual noise points for approach and departure.
The following three steps need to be performed for each AzB class to separate the noise point for approach and departure. Firstly, the averaged is determined for approach and departure separately, i.e.,
which is for approach, and
which is for departure. In these equations, only half a movement is considered each so that .
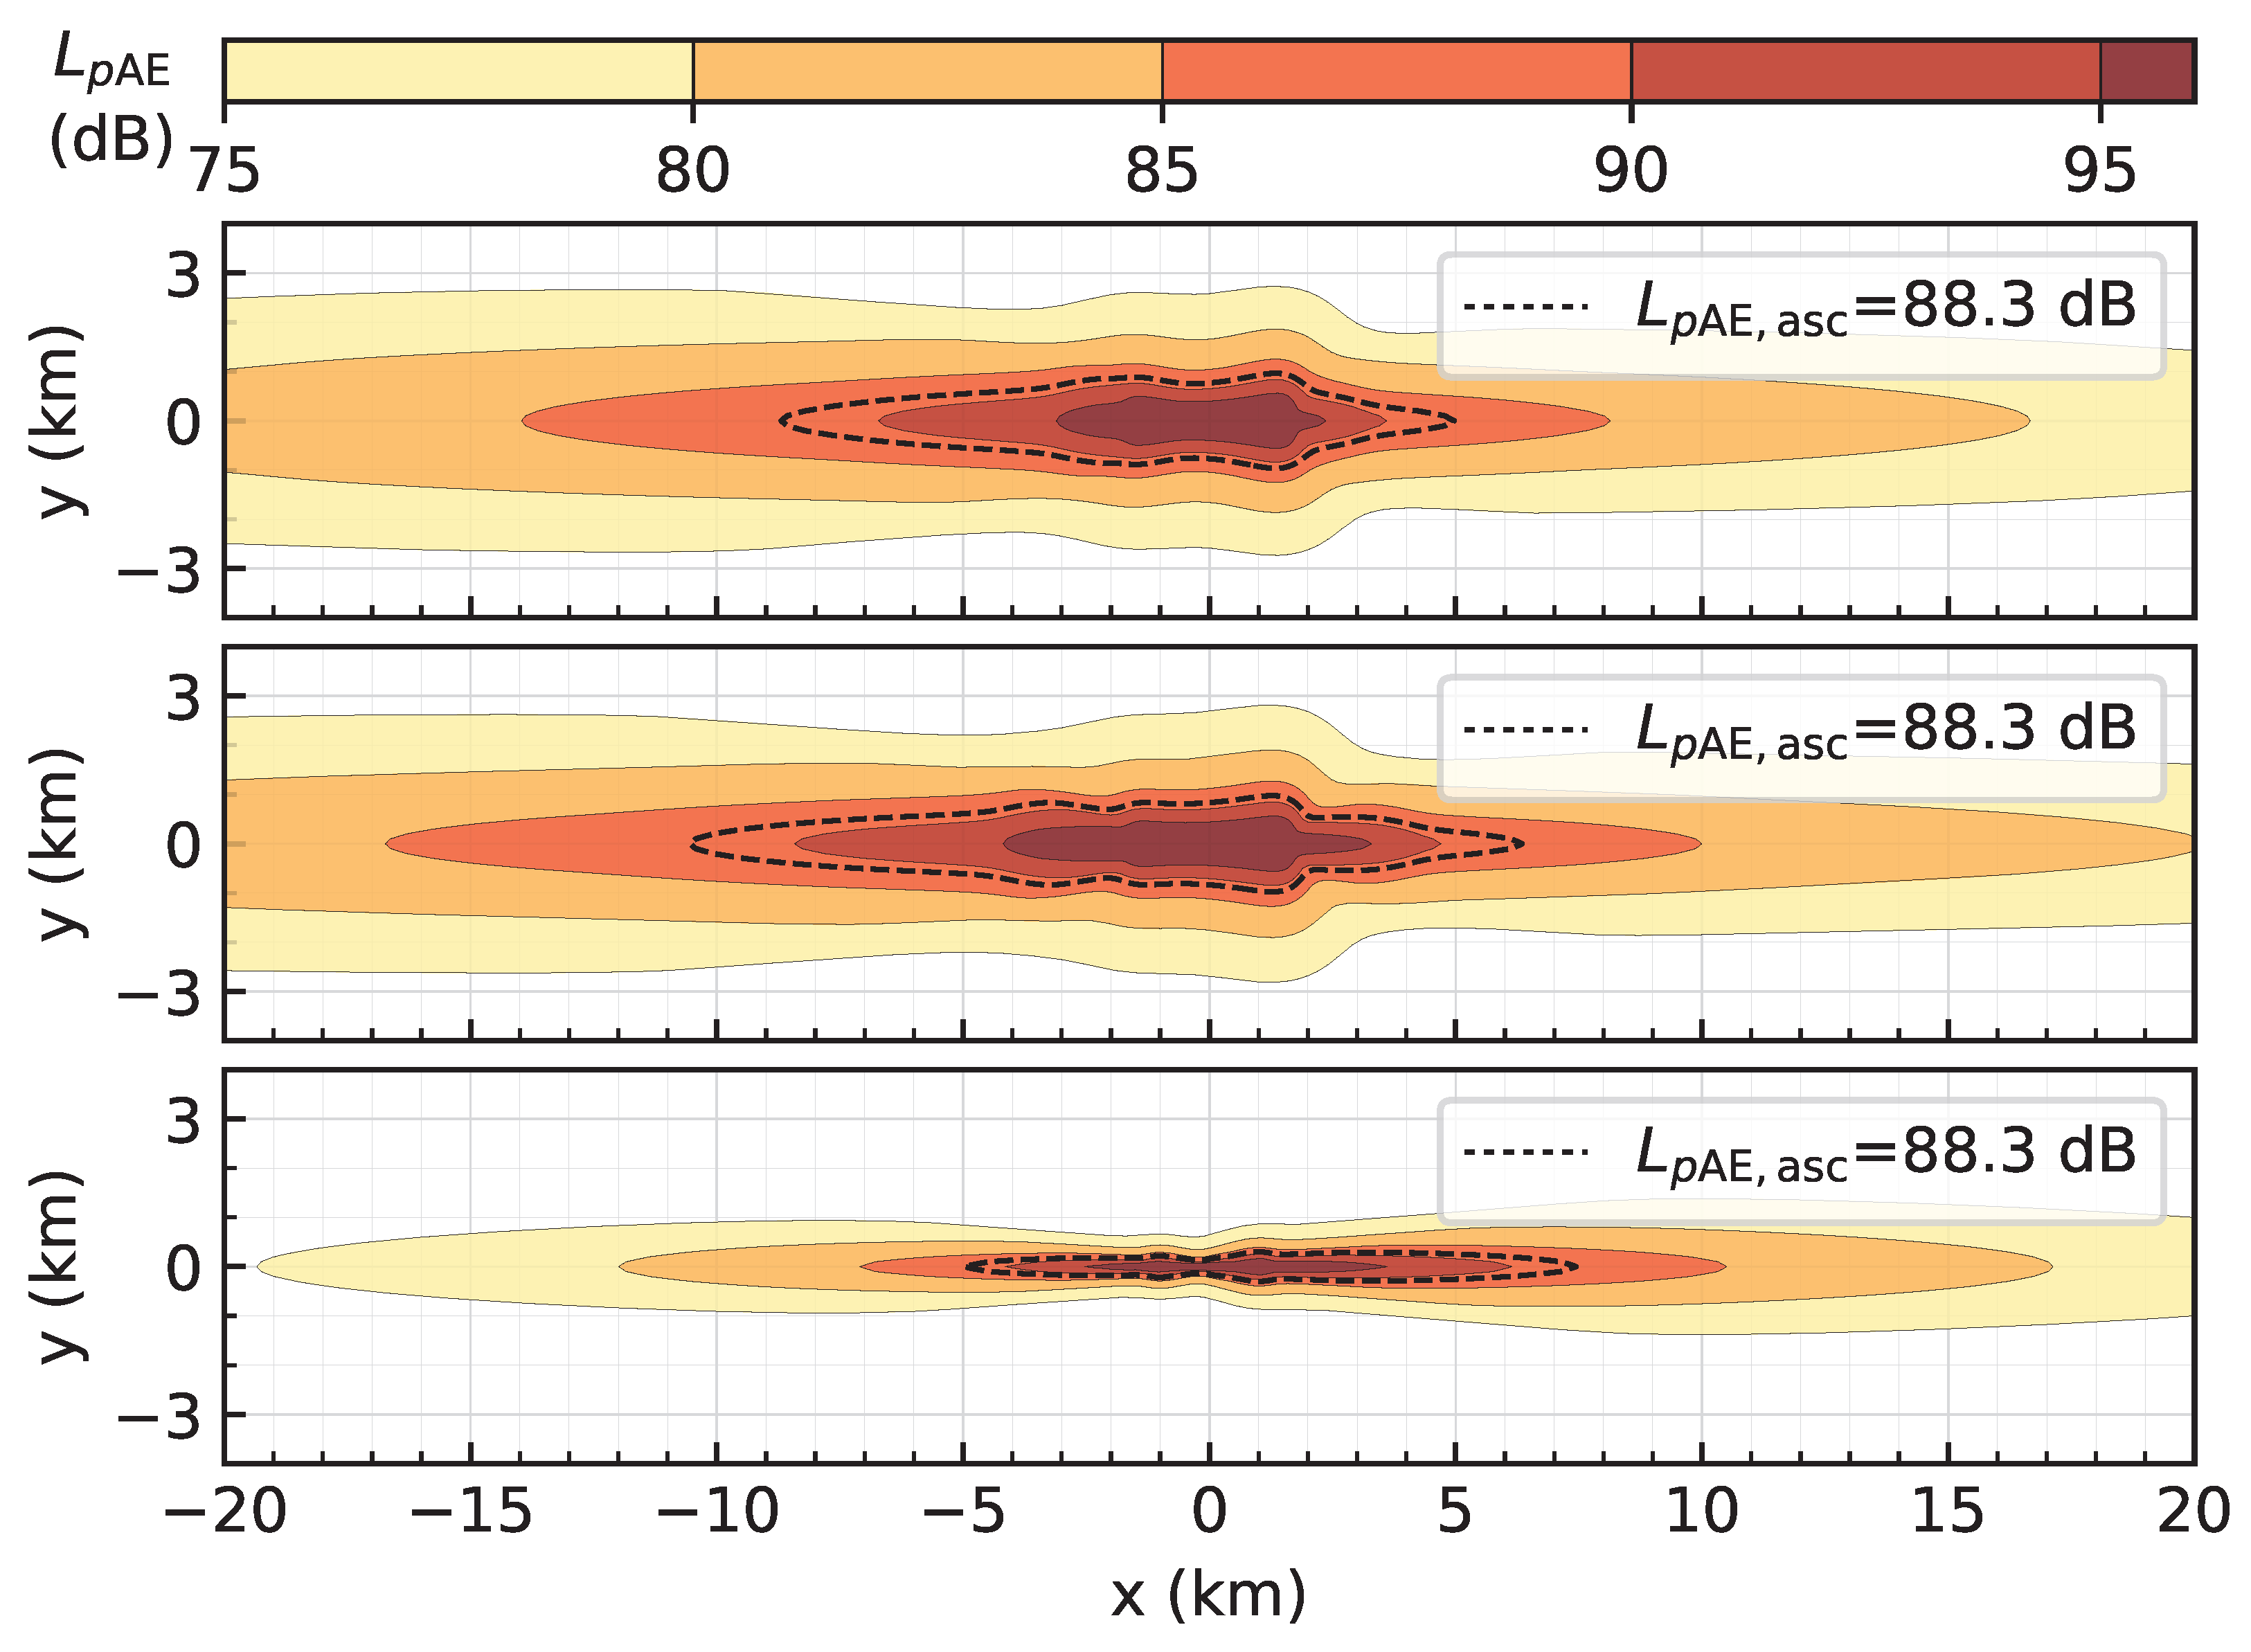
Secondly, the contour area is determined for the value of the AzB group. An example is shown in Figure 5 and Figure 6 for the AzB groups S3_M050_TU_N7 and S3_M500_T4_N7, respectively. The contour areas are determined for dB (S3_M050_TU_N7) and dB (S3_M500_T4_N7), respectively (as determined in the previous paragraph). All areas are summarized in Table 2.

Figure 5.
Averaged contour of AzB group S3_M050_TU_N7 using a weighting of 70% west and 30% east for operation directions. Highlighted with dashed lines are the contour lines for the associated . The shown operations are as follows: (top) departure only; (bottom) approach only.

Figure 6.
Averaged contour of AzB group S3_M500_T4_N7 using a weighting of 70% west and 30% east in operation directions. Highlighted with dashed lines are the contour lines for the associated . The shown operations are as follows: (top) departure only (<85%MTOM); (middle) departure only (>85%MTOM); (bottom) approach only.
Thirdly and finally, the noise point for the AzB class is determined via
where and / refer to respective contour areas of approach and departure. Using a factor of 2 ensures that , i.e., one approach operation and one departure operation equals two movements. The resulting noise points are summarized in Table 3. Note that this table can easily be supplemented with additional aircraft groups or aircraft types using the described methodology. Also note that the noise points were rounded to three decimal places. Increasing the number of decimal places does not improve the assessment of traffic scenarios noticeably.
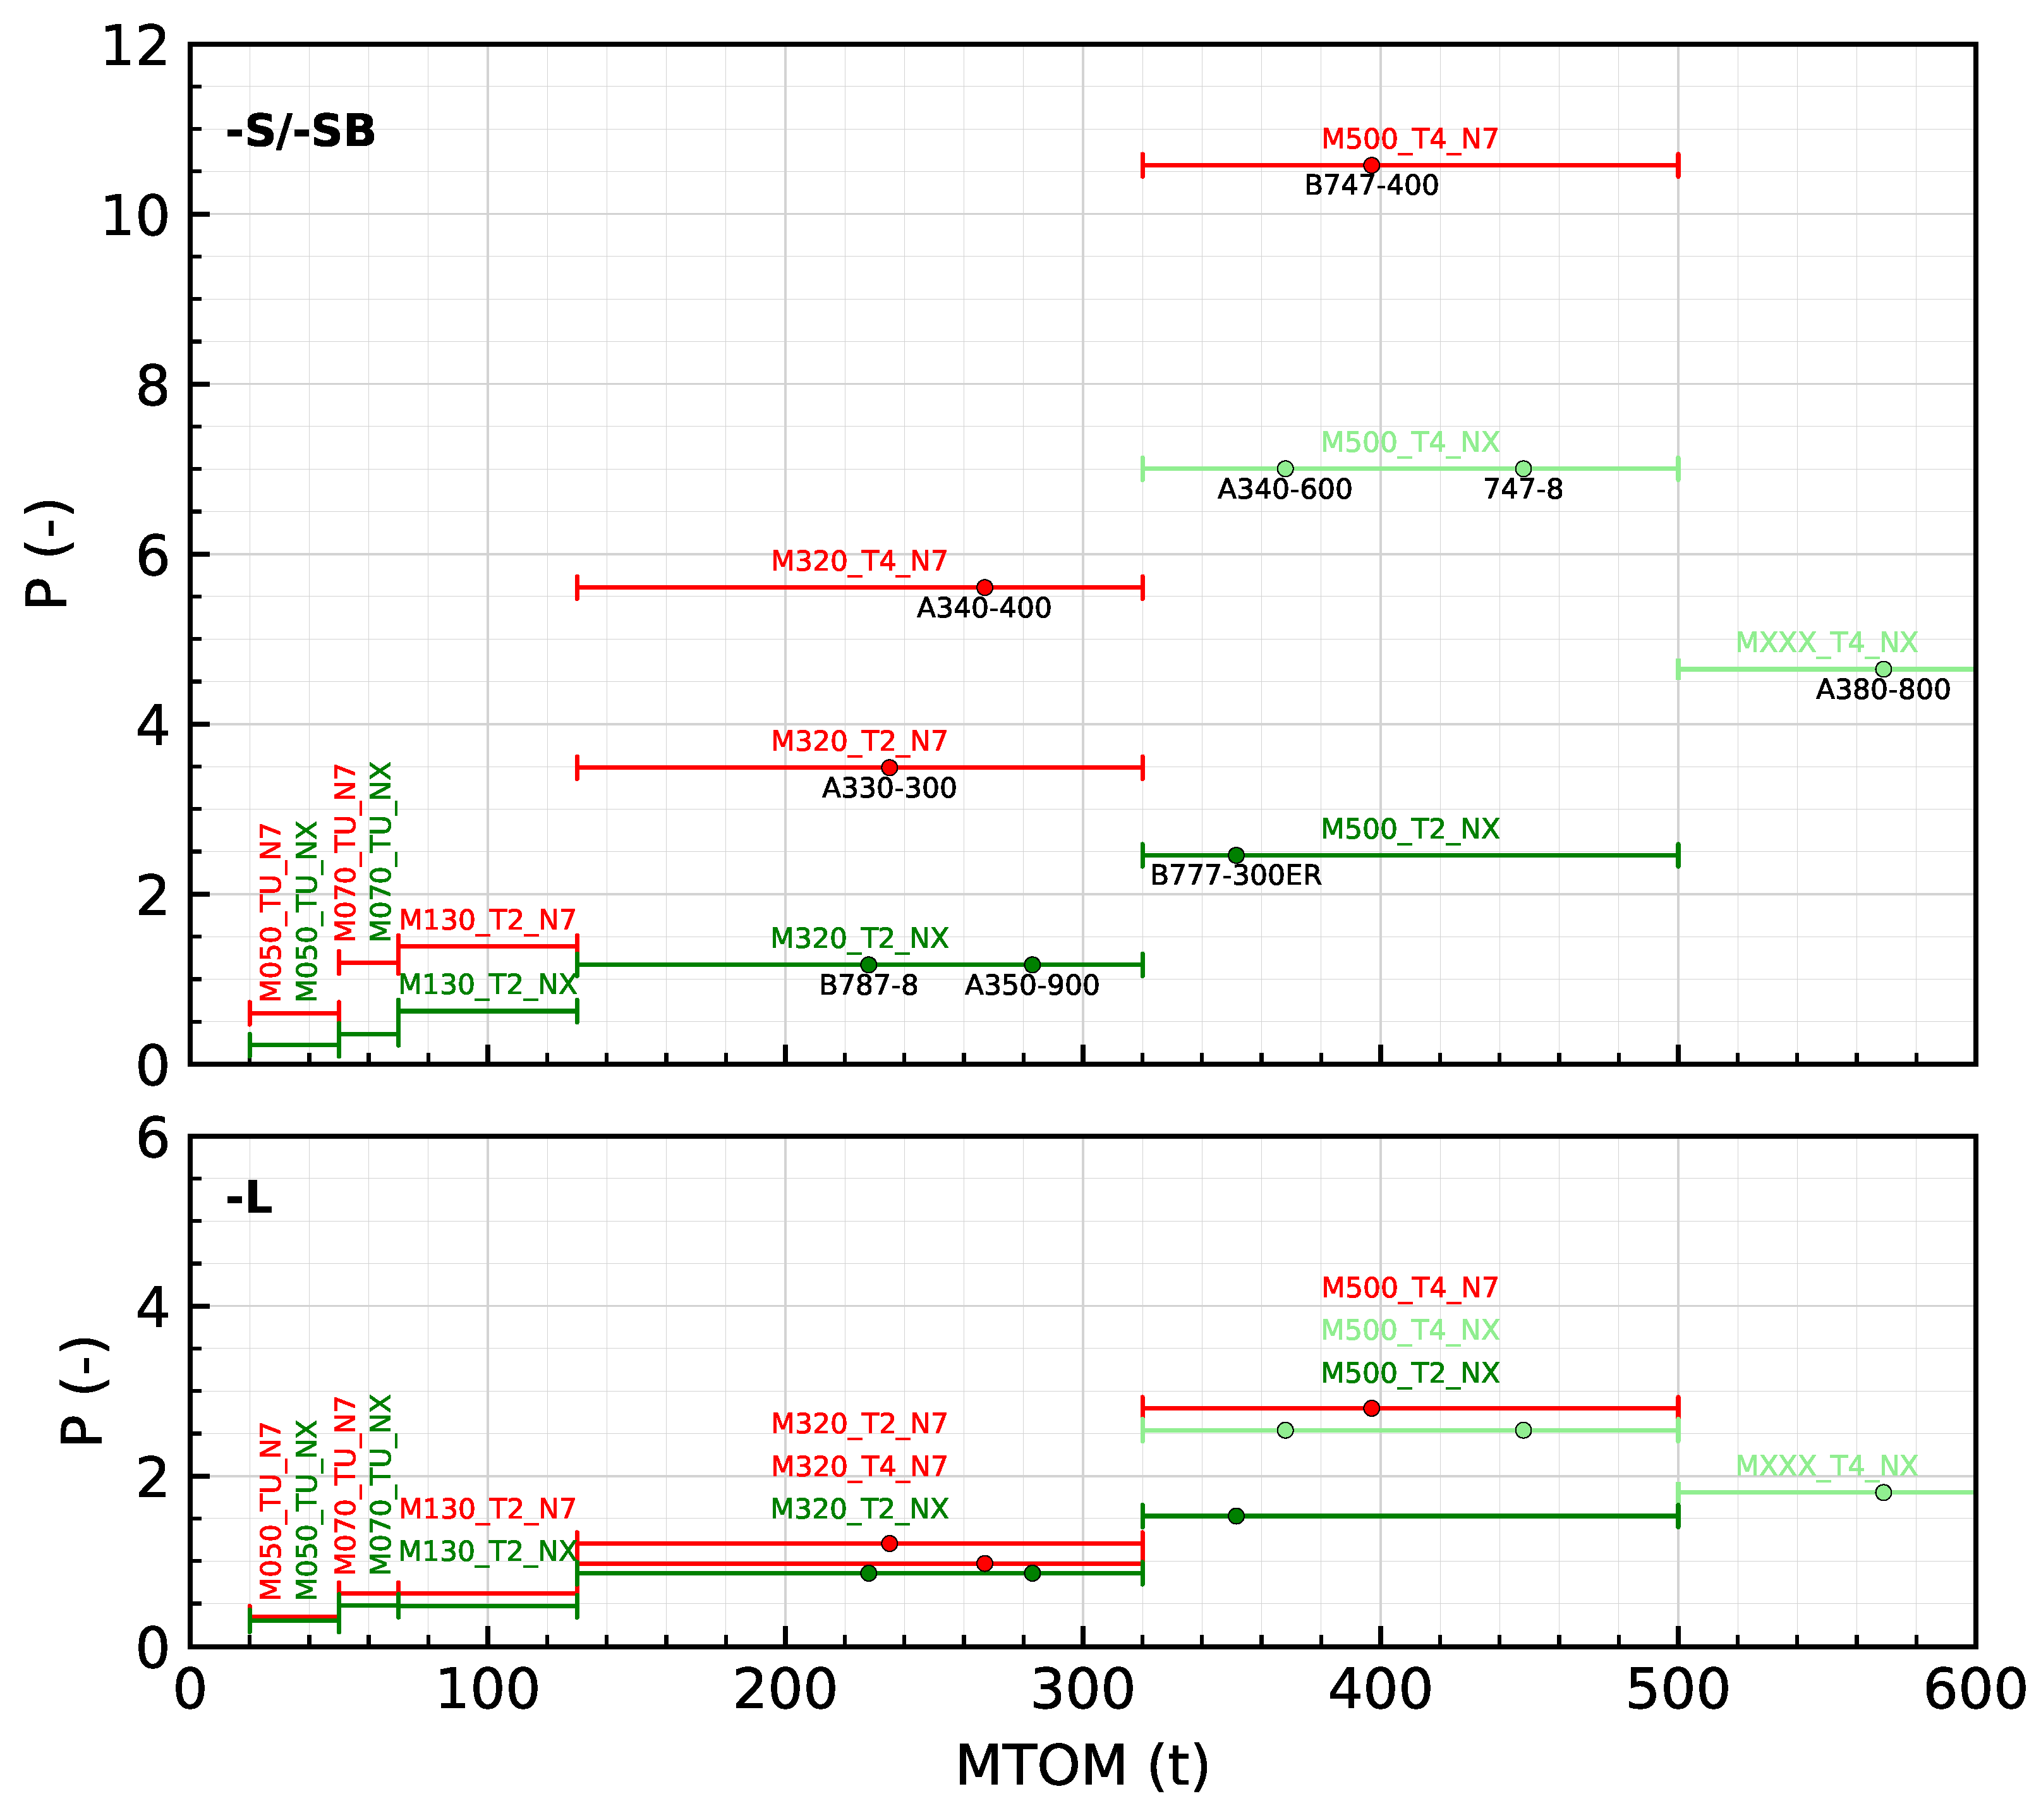
Figure 7 visualizes the resulting noise points as a function of the aircraft weight. Note that an AzB group is always defined for a range of maximum takeoff masses (MTOMs). The AzB groups with bypass ratios less than seven (N7-variants) are shown in red, and those with bypass ratios greater than seven (NX-variants) are shown in green. Aircraft types as examples for the groups are indicated by dots. From the presented data, it can be seen that there is a significant noise benefit at departure for aircraft equipped with modern engine types with bypass ratios greater seven (NX-variants) compared to aircraft equipped with engine types with bypass ratios less than seven (N7-variants). At approach, however, the noise benefit is significantly lower, which implies that other sound sources are relevant as well, e.g., sound from high-lift devices or landing gear.

Figure 7.
Noise points plotted against maximum takeoff mass (MTOM) for selected AzB groups (only S3-variants): (top) noise points for departure (-S/-SB); (bottom) noise points for approach (-L).
3.3. Determination of Weighted Noise Points
In some metrics, the noise levels in the night time or off-peak hours of the day are given a penalty to take into account the higher nuisance perception during quieter hours. A widely used rating level is the LDEN (Day–Evening–Night) [,]. With this rating level, the noise levels in the evening are given a penalty of +5 dB, and at night, they are given a penalty of +10 dB. This form of time-of-day-dependent weighting can also be applied when using noise points, because weighting the levels using additive values is identical to weighting the number of movements by multiplying them by a corresponding factor. This factor is
where is the penalty for time-of-day t, i.e., day, evening, or night. The penalties and weighting factors for the well-known LDEN are listed in Table 4.

Table 4.
Penalties used for calculation of the LDEN.
Correspondingly, time-of-day-dependent noise points can be introduced, i.e.,
4. Determination of the Sum of Noise Points and Derived Quantities
In this section, it is demonstrated how the noise point sum and hereof derived quantities can be used to assess the noise situation or its development at an airport. All quantities described in the following are derived for an A-weighted equivalent continuous sound level for 24 h (). If other related noise metrics are of interest, the following equations can be adjusted accordingly. For better readability, is simply referred to as in the following.
In Section 4.1, the determination of the noise point sum is described. Following that, the ratio of the noise point sum to the number of movements is introduced in Section 4.2 to assess the noise of the traffic mix. Based on the noise point sum, the associated equivalent continuous sound level is approximated in Section 4.3 in order to assess the noise situation in terms of decibels for a reference area of 24.2 km2. The approximation of the associated is then used in Section 4.4 to approximate other contour areas than the reference area.
4.1. Calculation of the Noise Point Sum
The noise point sum is determined by multiplying the number of movements of an aircraft group with its noise point, i.e.,
where is the number of movements for aircraft group g, and is the corresponding noise point from Table 3. This noise point sum represents the total equivalent number of movements. That is, as an approximation, any traffic scenario can be represented by this equivalent number of movements of the reference aircraft type (see also Figure 2).
4.2. Ratio Between Noise Point Sum and Number of Movements
As the noise point sum represents the equivalent number of movements, it can directly be compared to the actual total number of movements. This simple comparison already allows a statement about the traffic mix. The ratio of the noise point sum to the total number of movements is
For example, if only the previously selected reference AzB group S3_M130_T2_N7 operates at an airport, the ratio is exactly 1. If the traffic mix also contains movements of quieter aircraft, the ratio is below 1. Thus, the ratio directly indicates whether the traffic mix is in total quieter or louder compared to an airport where only the reference AzB group operates. Since the reference AzB group S3_M130_T2_N7 dominates the noise situation at most German airports, the ratio here is typically around 1.
4.3. Approximation of the Associated Equivalent Continuous Sound Level
During the conception of noise points in Section 3, the associated single-event sound exposure level was introduced, which is the value that corresponds to the reference contour area of 24.2 km2. This associated level can also be adapted for traffic scenarios at airports using the equivalent continuous sound level. That is, the associated equivalent continuous sound level is the value that corresponds to the reference contour area of 24.2 km2.
Based on the conception of noise points in Section 3, such associated equivalent continuous sound levels can be approximated with the noise point sum. As shown in Equation (9), an equivalent continuous sound level can be calculated easily based on the number of movements for a constant single-event sound exposure level , i.e., a single aircraft. Conveniently, the noise point sum of the traffic scenario represents an equivalent number of movements of a single reference aircraft type. Therefore, the noise point sum can be directly inserted into Equation (9), i.e., . Furthermore, the reference dB of this aircraft can be used, noting that this reference area directly led to the reference contour area of 24.2 km2. Thus, similarly to Equation (9), the associated equivalent continuous sound level is approximated as
For example, if the noise point sum of a traffic scenario is = 315,360 in a year (with T = 31,536,000 s), the noise impact would be approximately equivalent to one operation of the reference aircraft per 100 s. Thus, the associated equivalent sound level is approximately
If the number of movements doubles, the noise point sum would double as well, and therefore, would increase by 3 dB (because dB). The contour area of 63 dB of this doubled traffic scenario is again exactly the same as the contour area of 60 dB of the original traffic scenario, i.e., 24.2 km2.
Naturally, Equation (23) only provides an approximation of the associated equivalent continuous sound level. Differences compared to the actual associated equivalent continuous sound level can be expected due to two reasons. Firstly, the presented equation assumes that the contour shape of each aircraft type is identical. However, each aircraft type has a slightly different contour shape. Secondly, the airport layout and route structure is likely to be more complex compared to the simple case based on which the noise points were determined. Those described differences are demonstrated with two examples. Both examples use a traffic scenario with a total number of movements of 200,000 per year and an aircraft distribution as follows:
- 15% S3_M070_TU_N7,
- 30% S3_M130_T2_N7,
- 30% S3_M130_T2_NX,
- 10% S3_M320_T2_N7,
- 10% S3_M320_T2_NX, and
- 5% S3_M500_T2_NX.
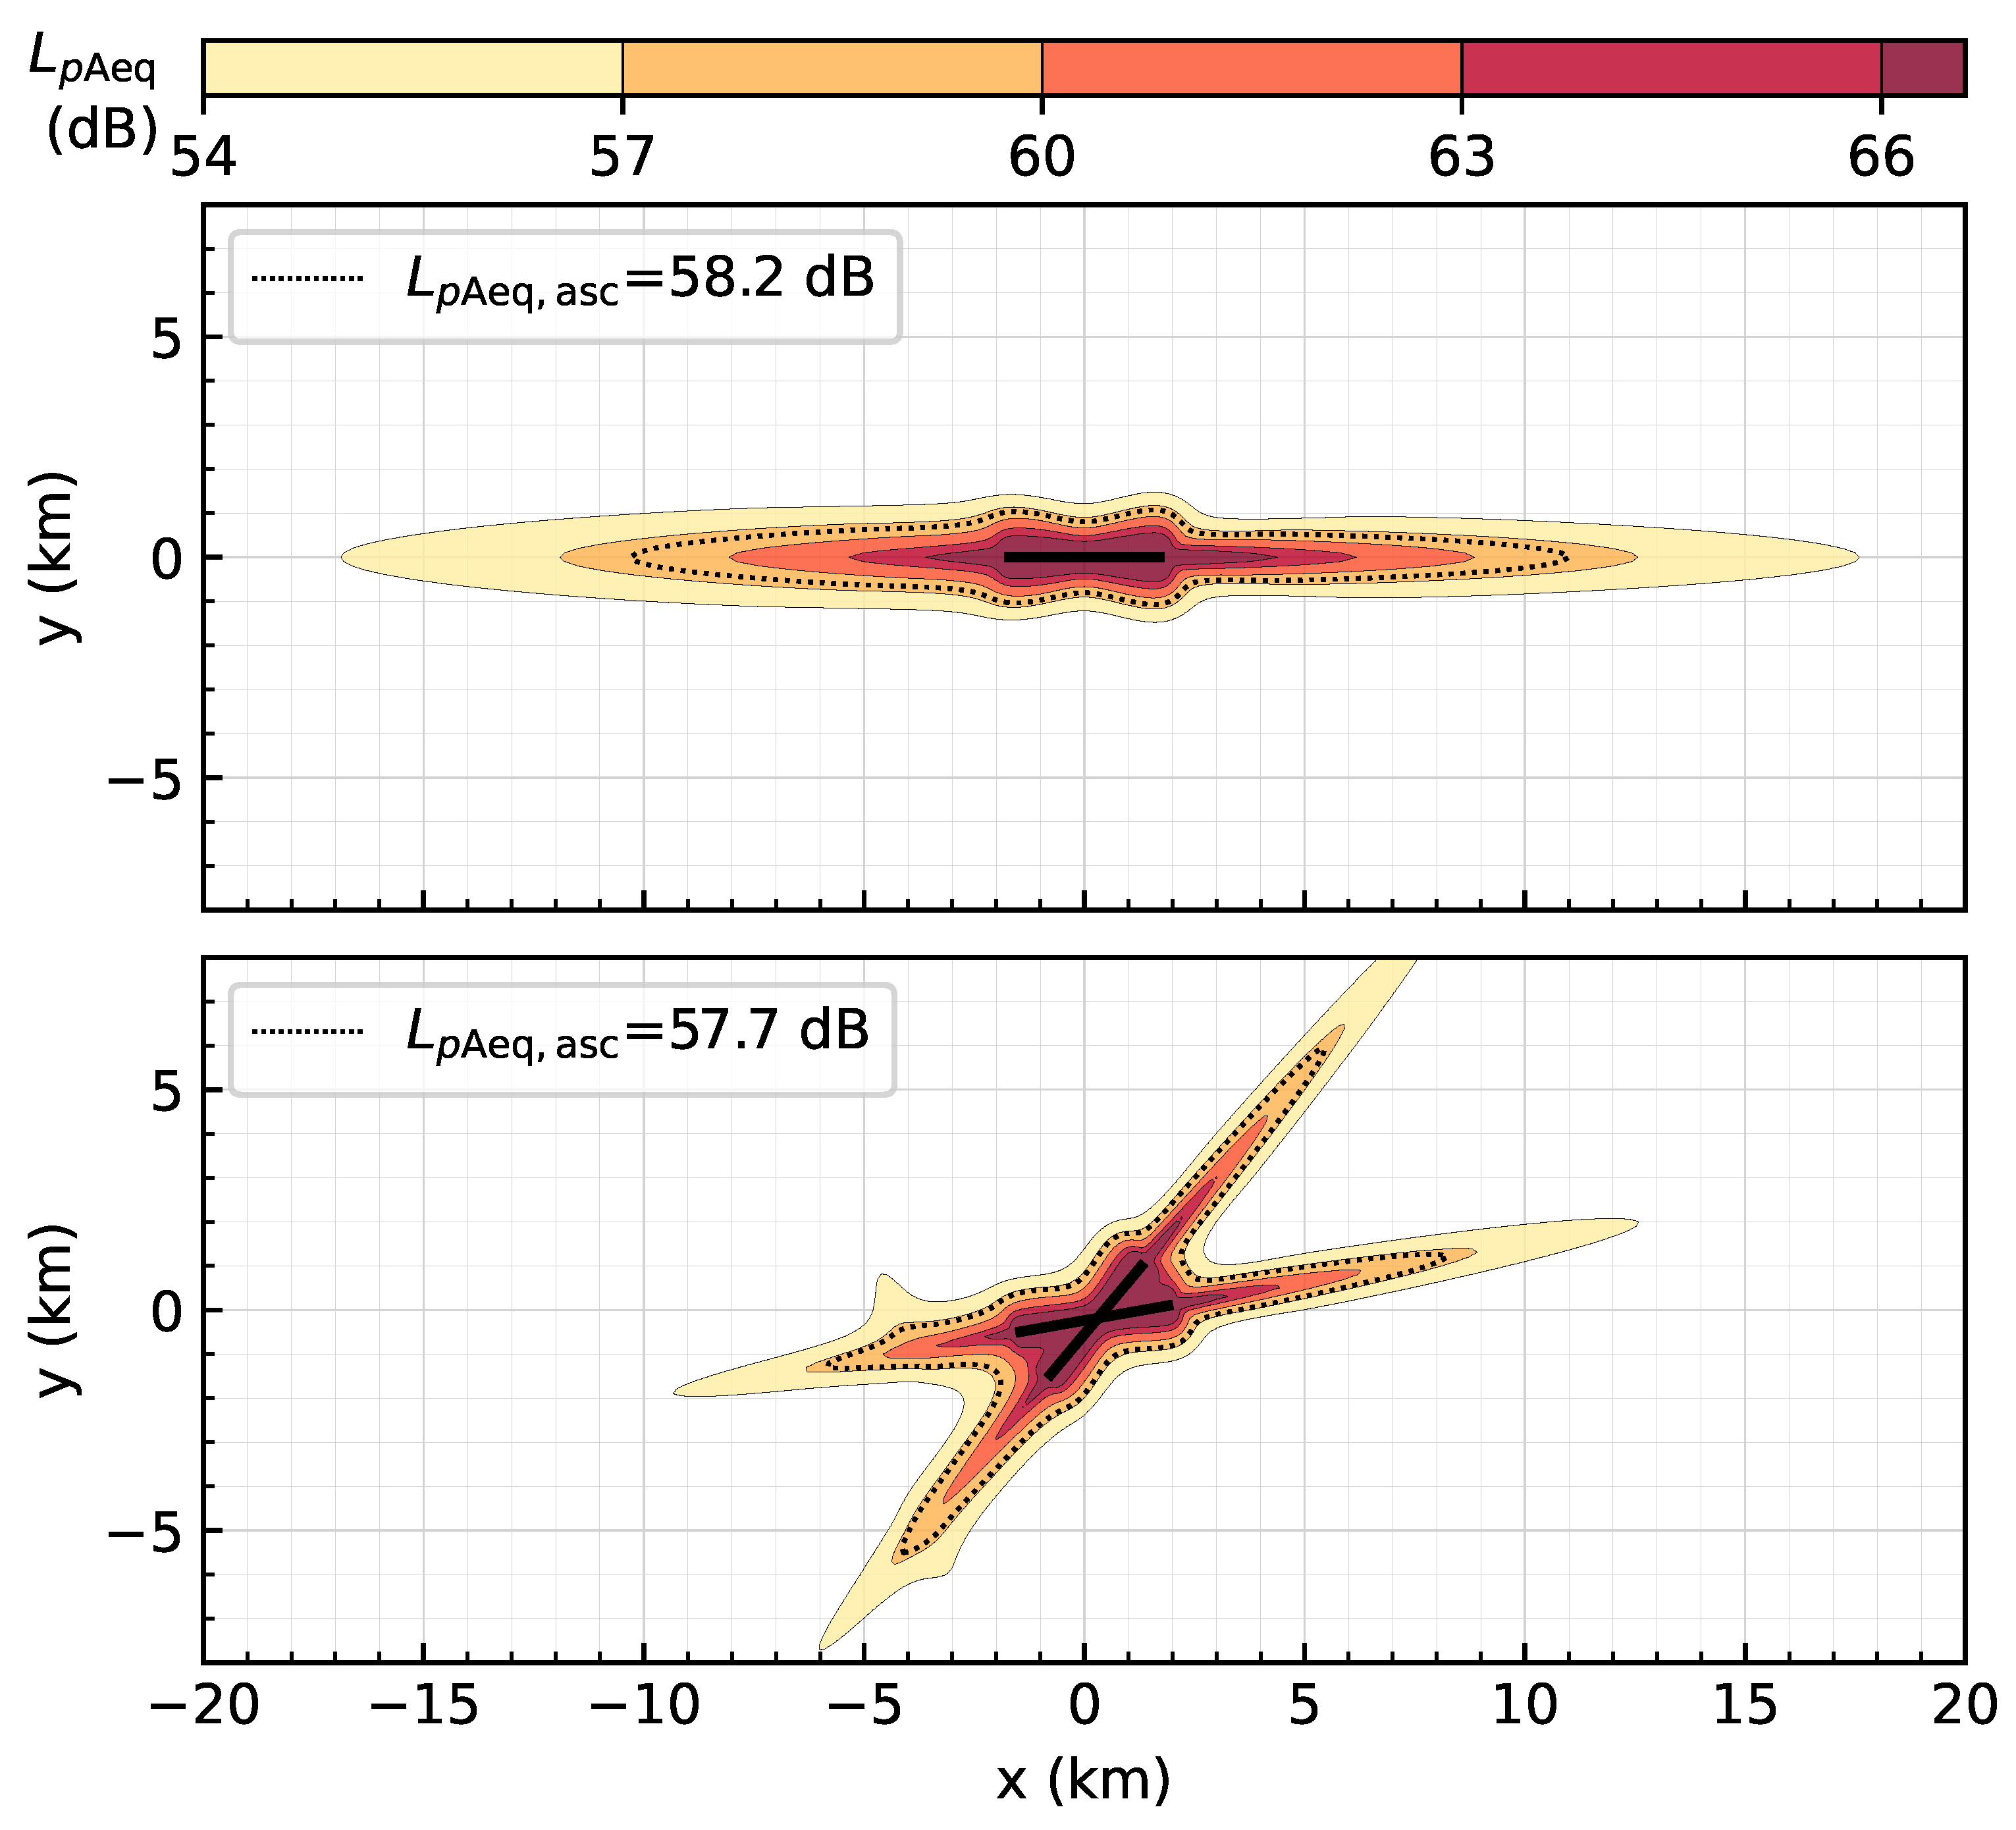
In the first example (case 1), only a single runway with straight routes is used. This example demonstrates the influence of different aircraft types and their contour shapes. In the second example (case 2), the same traffic is used at an airport with two crossed runways, which in addition demonstrates the influence of more complex runway and route structures. The calculated noise contours of the respective cases are shown in Figure 8. The contour lines of the approximated are shown as dashed lines. As the traffic for both cases is identical, the approximated is 58.16 dB for both cases. In case 1, the calculated is 58.15 dB and is thus almost equal to the approximated . However, in case 2, the calculated is 57.68 dB and thus significantly lower.

Figure 8.
Calculated contours for a generic traffic scenario with 70% east/south operating direction and 30% west/north operating direction and 200 000 movements. Distribution of AzB groups: 15% S3_M070_TU_N7, 30% S3_M130_T2_N7, 30% S3_M130_T2_NX, 10% S3_M320_T2_N7, 10% S3_M320_T2_NX, and 5% S3_M500_T2_NX. Two generic airports are shown: (top) case 1 with simple runway/route structure; (bottom) case 2 with crossed runways.
From case 1, it can be concluded that the influence of different aircraft types and their contour shape on the approximation of the associated is negligible. In contrast, case 2 shows that the runway and route structure has a more substantial impact on the approximation of the associated .
In summary, the associated equivalent continuous sound level can be approximated well, especially for simple runway and route structures, because the noise points have also been derived at a simple airport. Despite some differences at the more complex airports, the associated equivalent continuous sound level can be useful to quantify the noise impact and, in particular, the change in noise impact in terms of decibels.
4.4. Approximation of Contour Areas
In the previous section, how to approximate an associated equivalent continuous sound level was described, i.e., the noise level for which the contour area equals the reference area of 24.2 km2. However, during noise assessment, contours of several noise levels are typically considered. Therefore, in order to also approximate the contour areas of other noise levels, a relationship between contour areas and noise levels needs to be derived.
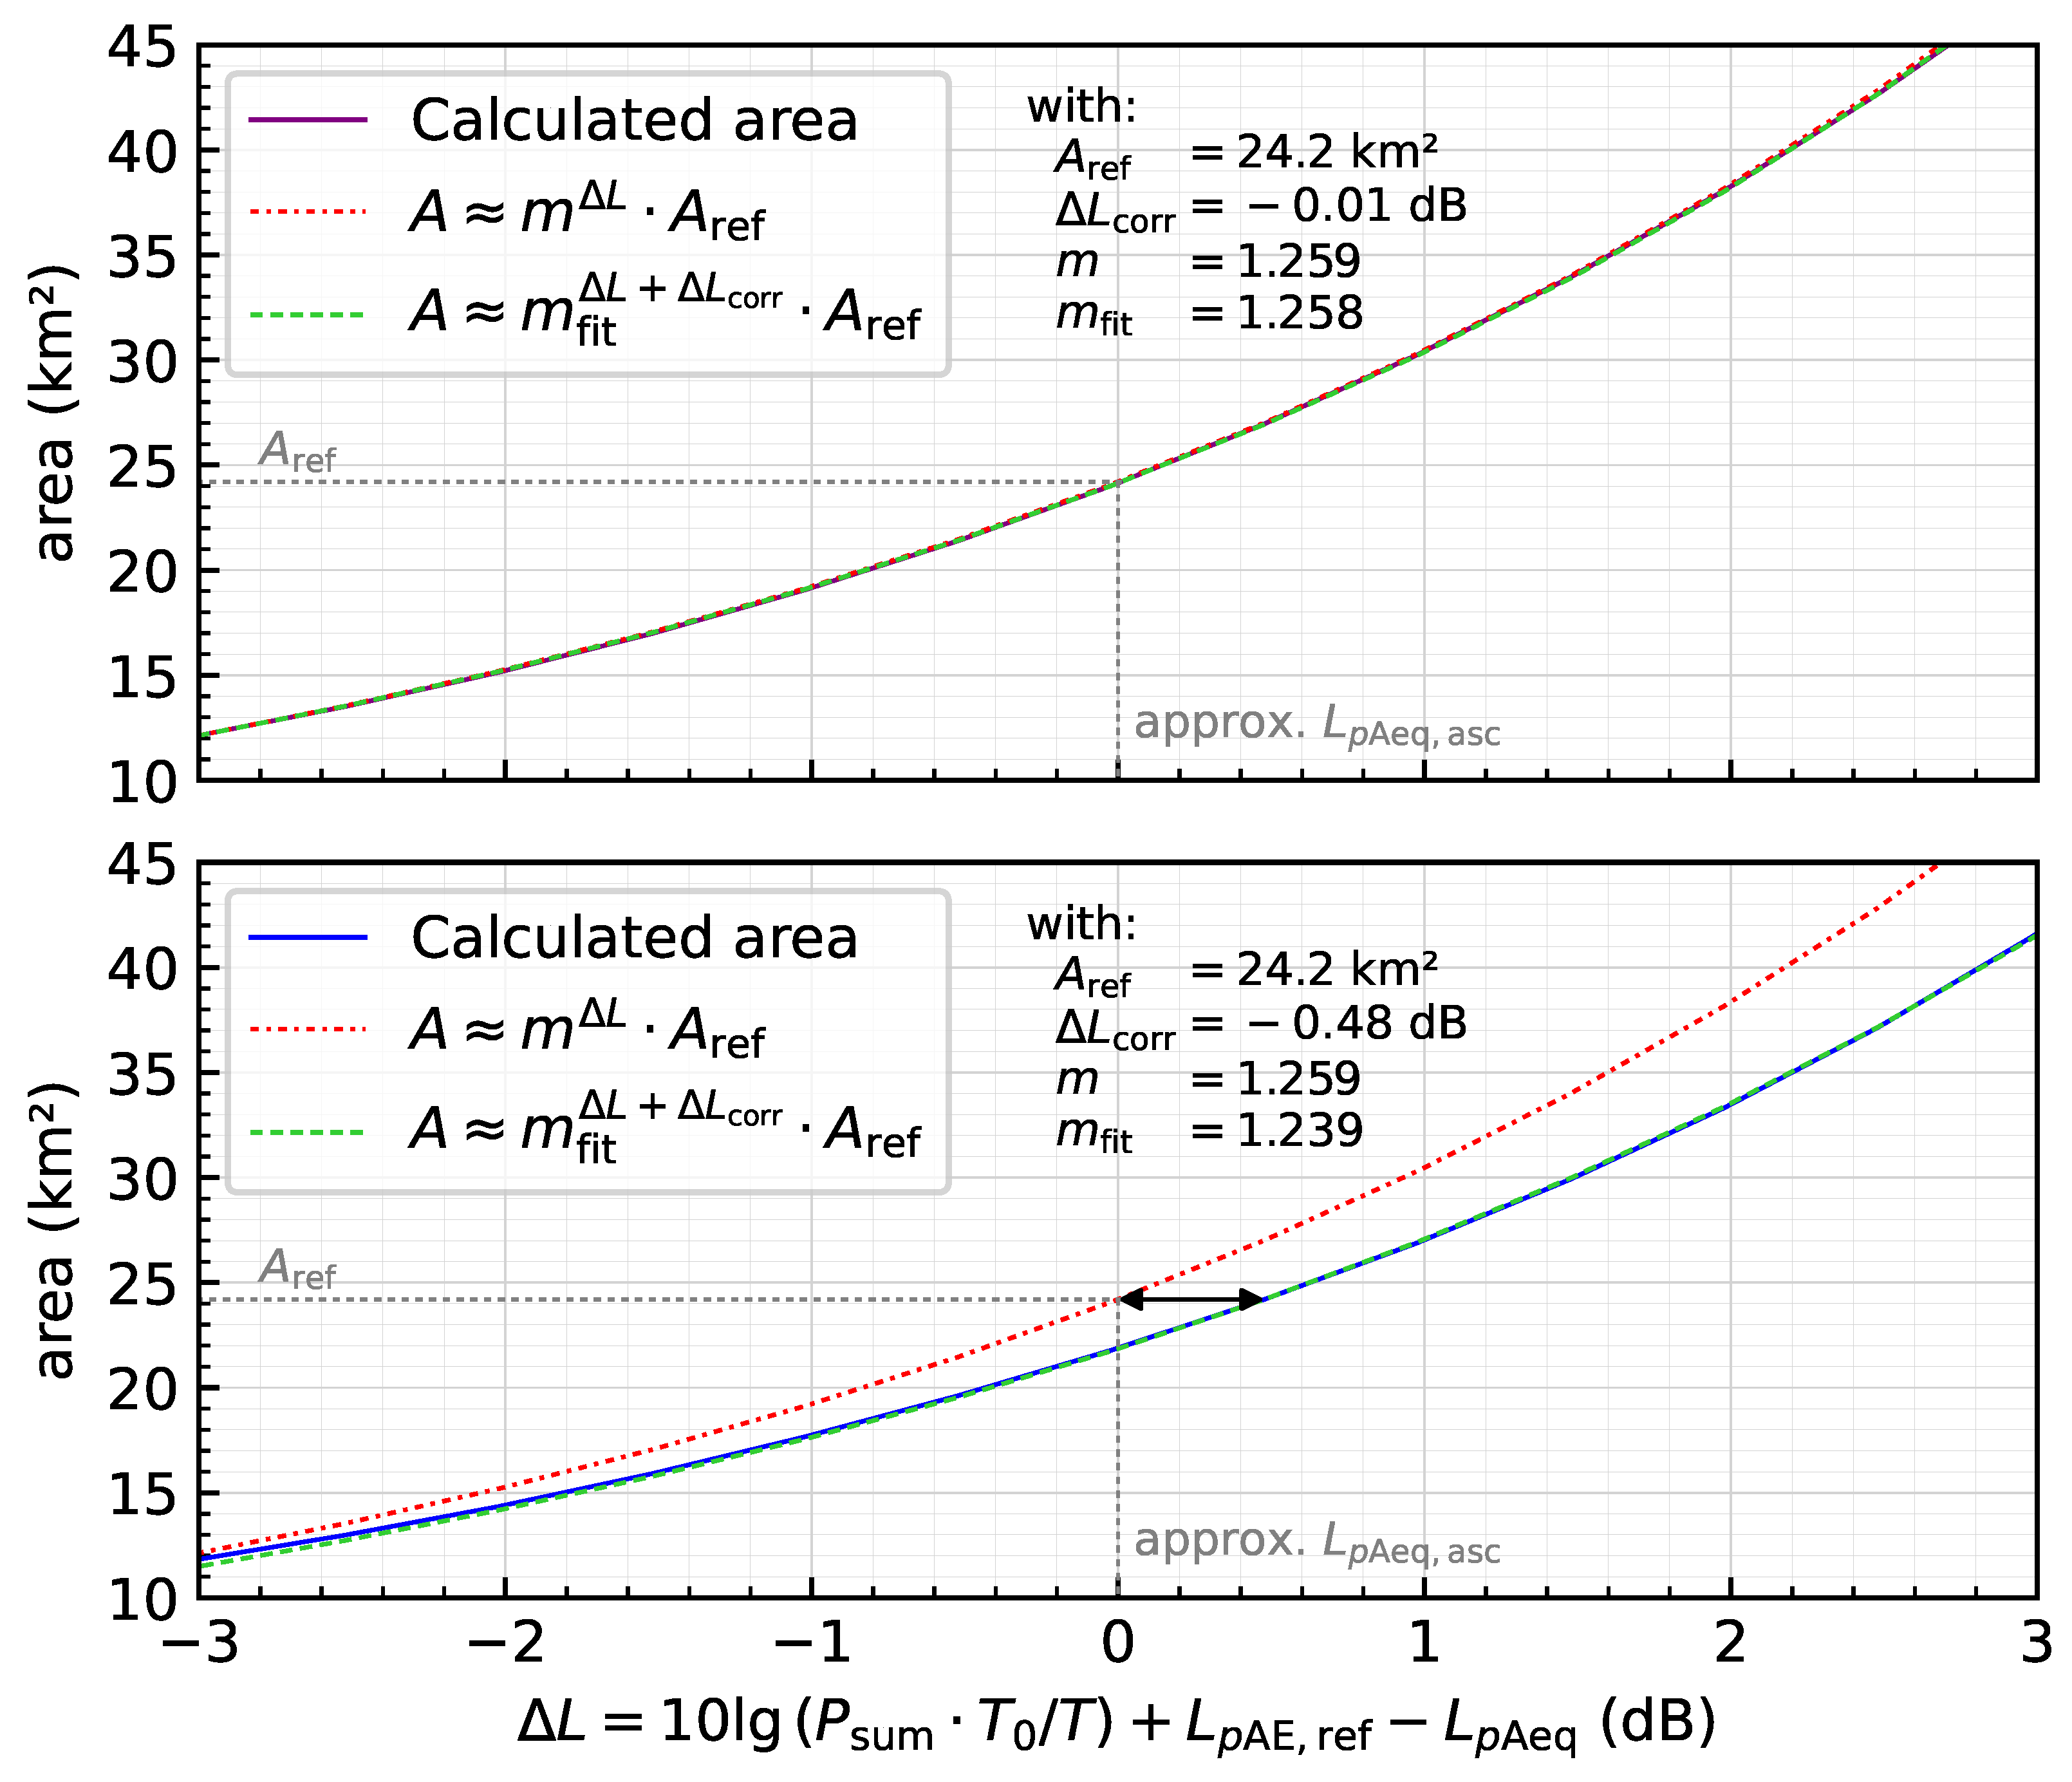
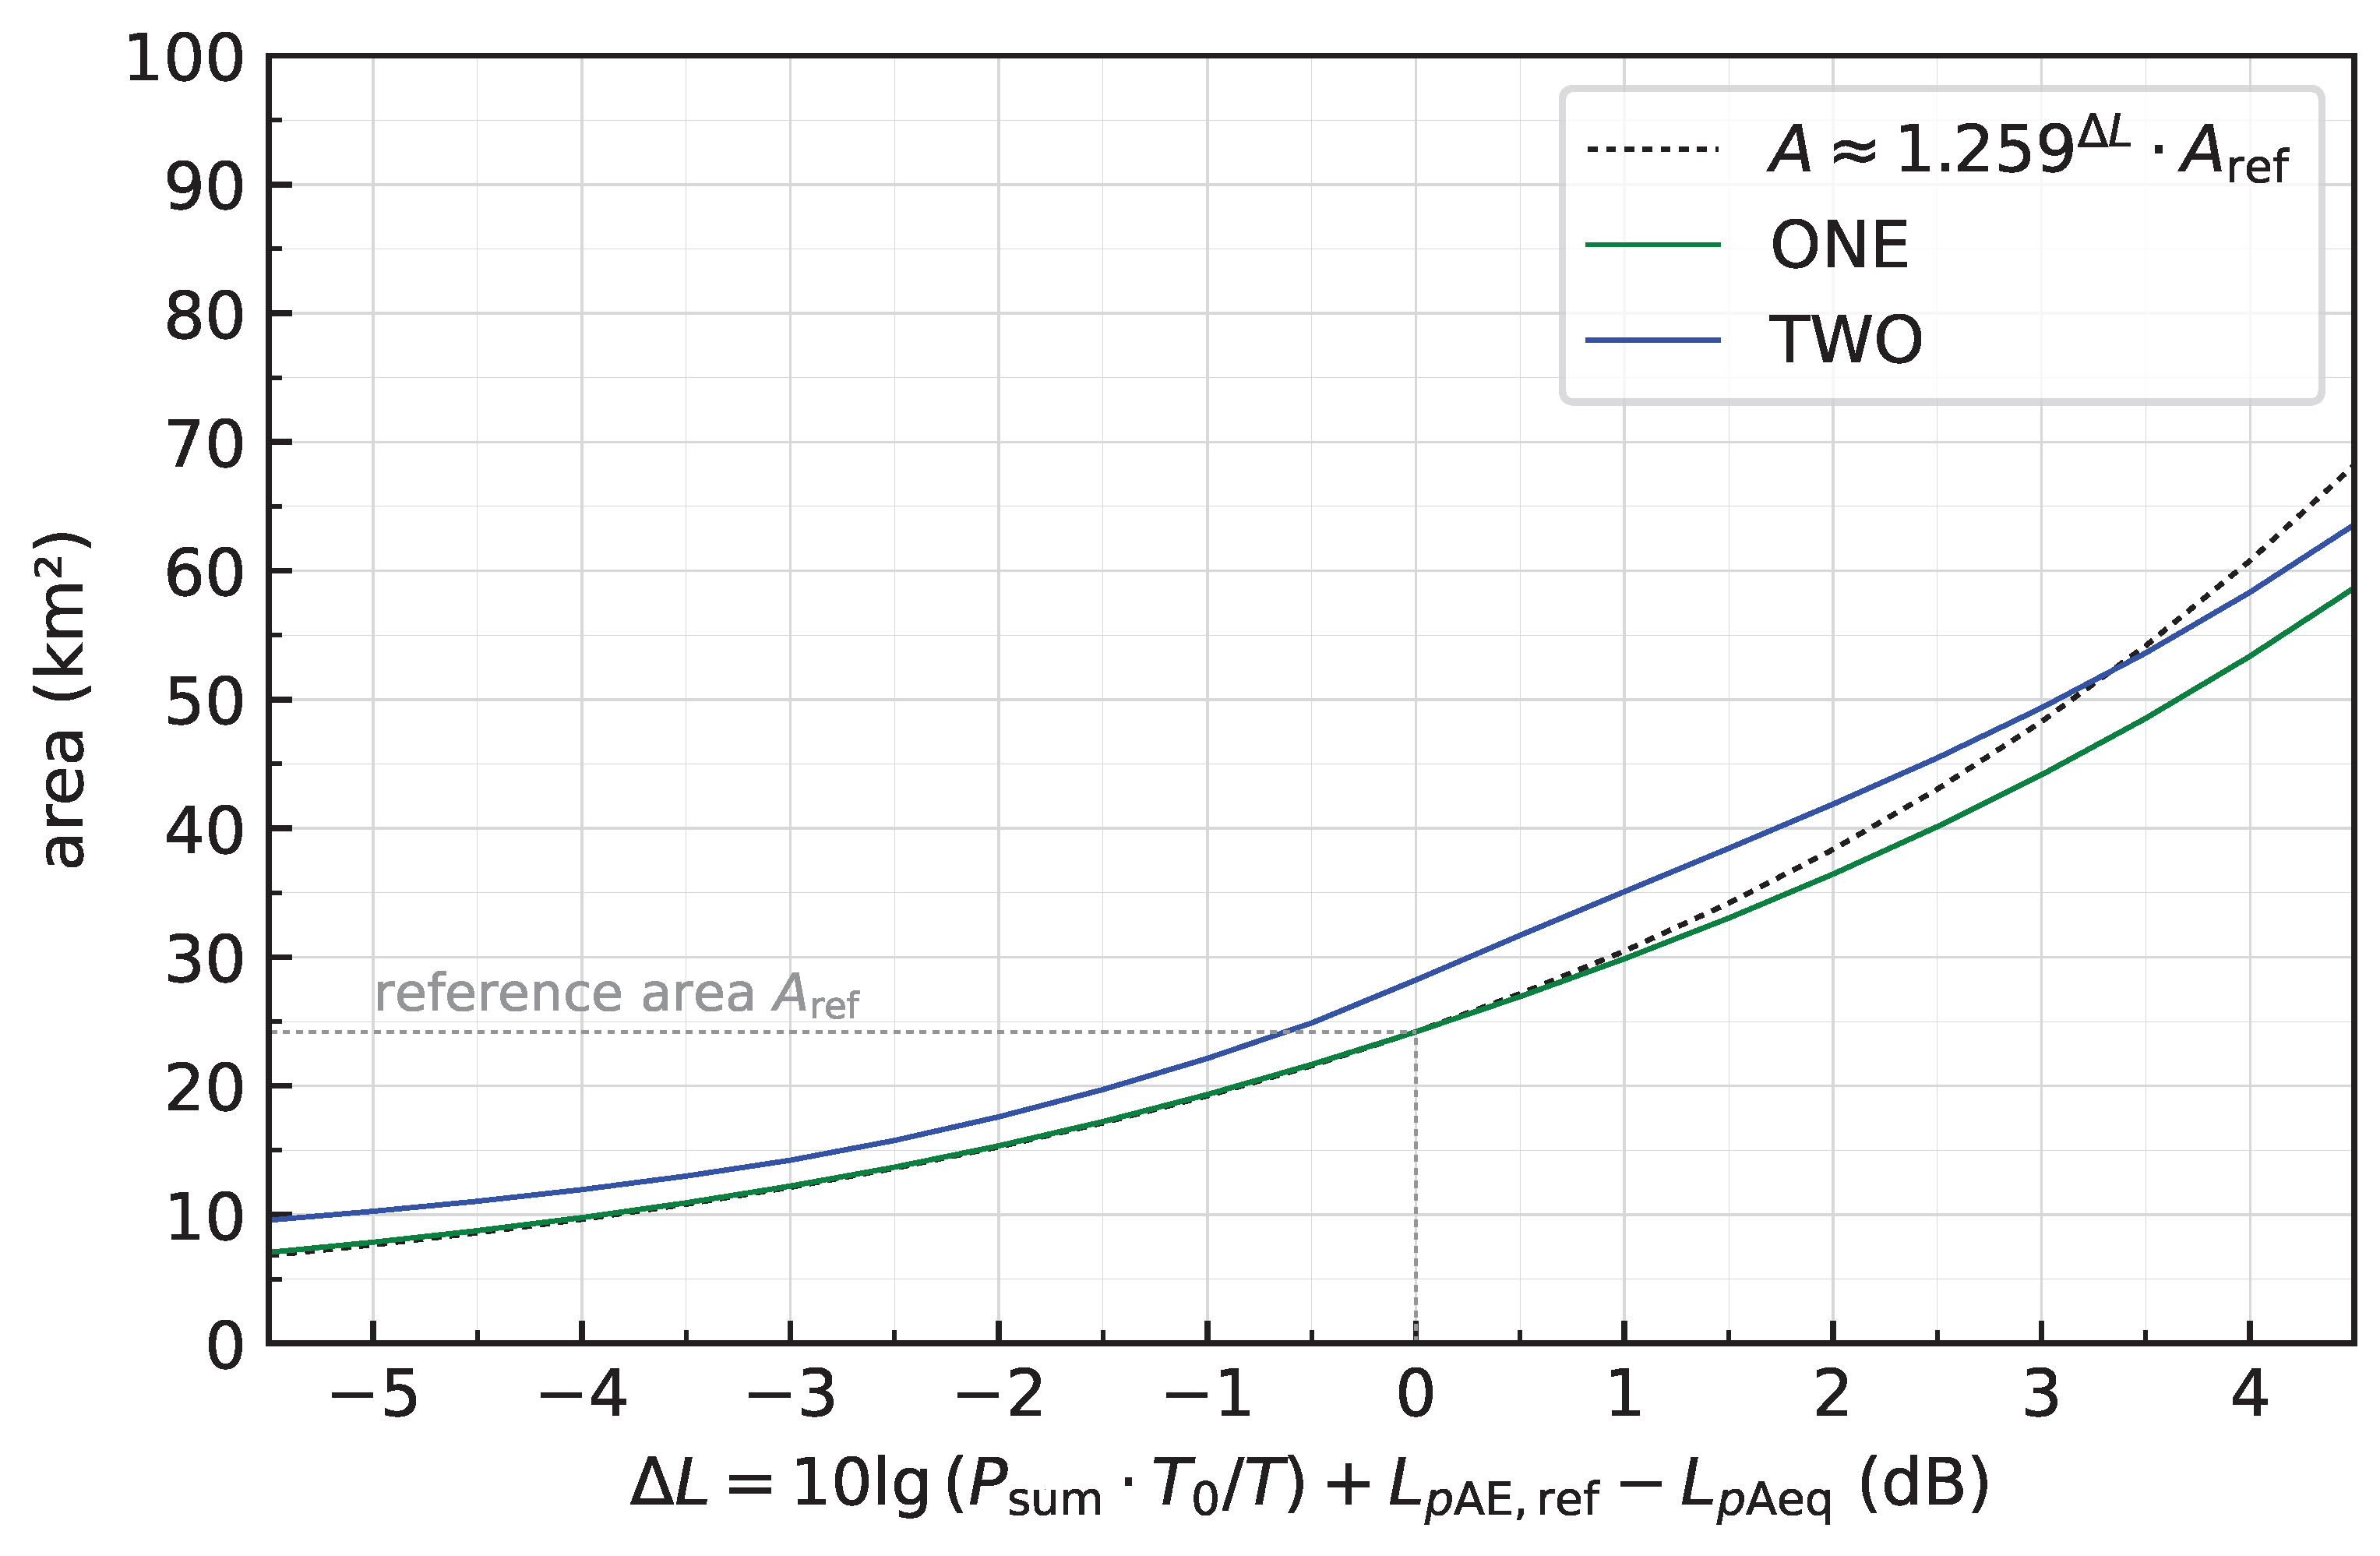
Naturally, the contours of higher noise levels are close to the airport and enclose smaller areas, whereas the contours of lower noise levels are further away from the airport and enclose larger areas. For the two cases A and B from Figure 8, the calculated contour areas are plotted as a function of the noise level in Figure 9. As discussed previously, the approximated (indicated with dashed gray lines) does not necessarily match the calculated . For case 1, shown as a purple line, the calculated is almost identical to the approximated . However, for case 2, shown as a blue line, the calculated differs from the approximated . Nonetheless, it can be seen that the contour areas grow approximately exponentially in both cases. In case 1, the contour area changes at about 25.8% per decibel, whereas it changes at about 23.9% per decibel in case 2. In general, this exponential relationship can be written as
where m is the base of the exponential function and therefore describes how extensive the area changes. In the shown cases, the bases are (case 1) and (case 2).

Figure 9.
Calculated contour area as a function of noise level (contour value) from Figure 8. The dashed gray line shows the reference area . Per definition, it intersects with the associated equivalent continuous sound level . The approximated is about 0.01 dB higher than the actual for case 1 and about 0.48 dB higher for case 2. In case 1, the contour area changes at about 25.8% per decibel, whereas it changes at about 23.9% per decibel in case 2.
Using the previously approximated associated equivalent continuous sound level , the equation becomes
where per definition equals the reference area . Inserting the approximation of from Equation (23) gives
The equation shows that the contour area can be approximated if the base m is known. The equation also shows that for a constant contour value , the contour area increases if the exposure increases (i.e., due to a change in noise point sum ). Vice versa, it shows that for a constant noise exposure value, the contour area decreases if a higher contour value is considered. Both of these effects are complementary.
If only the change in contour area for the same contour value of two different traffic scenarios at the same airport is of interest, the change in contour area can be written in a simplified way:
where the logarithm rule was applied to change bases.
As shown in the previous example (Figure 8 and Figure 9), the base m of Equations (27) and (28) differs from case to case. It depends on the airport’s layout, the route structure, operating conditions, operating aircraft types, the area of interest, and others. In the remainder of this section, two approaches of how to work with Equations (27) and (28), and the base m are described. In principle, there are two different approaches depending on whether the runway and route structures are simple or complex.
4.4.1. Simple Airport
The base m of Equations (27) and (28) is not a constant value but needs to be determined for each airport individually. However, to obtain an order of magnitude, it can be sufficient to select a reasonable value, especially if the airport and route structures are comparatively simple. In the past, values in the range from (see, e.g., [,]) through (see, e.g., []) up to (see, e.g., [,]) were used. The special case of refers to a linear relationship between contour areas and sound intensities, i.e., . In this special case, Equations (27) and (28) simplify into
and
where the logarithm rule is applied in both equations to change bases.
These simple equations already provide satisfactory results for simple airports, i.e., single runway with straight tracks. For example, the base m for case 1 in Figure 9 almost exactly matches the special case of . Also, the associated equivalent continuous sound level is approximated well. For more complex airports, as in case 2, however, the special case of does not apply anymore. It can be expected that deviations increase the more the contour value differs from the associated . In case 2, the deviation increases for lower values see Figure 9). Nonetheless, as will be shown in Section 5, the special case for simple airports is still suitable for complex airports to assess relative noise developments.
4.4.2. Complex Airport
To increase accuracy when using Equation (27) at complex airports, airport calibration can be performed by taking the individual runway and route structure into account. In principle, there are two methods for the additional calibration.
The first method makes use of the fact that Equation (27) only depends on its exponent, i.e.,
Part describes the approximated associated equivalent continuous sound level, and is the noise level for which the contour area is determined. As described previously, these two parts of are complementary, i.e., a change in due to a change in noise point sum is equal to a change in the contour value . Thus, if traffic and corresponding noise calculations at an airport are available, the contour area can be tabulated as a function of . Once the contour areas are determined and tabulated, they can be used for other traffic scenarios at the same airport (assuming constant route structure and operation directions), thereby increasing the accuracy significantly for complex airports. Values of in between the tabulated values can be determined via interpolation.
As an example, the calculated contour areas of the previously introduced examples of case 1 and case 2 (see Figure 8) are tabulated in Table 5. The table also includes the approximated contour areas determined with the simplified Equation (29), i.e., . The tabulated values are visualized in Figure 10. Note that the values of case 1 and case 2 match the values shown previously in Figure 9 but with a different x-axis.


Figure 10.
Calculated contour area from Figure 8 as a function of : (top) case 1; (bottom) case 2. The red dashed lines show the approximated contour area using the simplified equation, i.e., . The green dashed line shows the fitted curve, i.e.,, where m and were fitted to the calculated contour areas.
The value of dB refers to the case where the contour value is the same as the approximated associated equivalent continuous sound level. At simple airports, like in case 1, the value of dB closely corresponds to a contour area of of 24.2 km2, i.e., the reference contour area. In case 2, however, the contour area is different due to the complexity of the airport. In this case, the application of the previously shown simplified equation with would overestimate the contour areas.
The second method simply fits a function through the data. For this, an additional corrective term and a fitted base must be considered, i.e.,
In this equation, can be directly determined since it is the difference between the approximated and calculated associated equivalent continuous sound level. The base can be determined via curve fitting.
In contrast to the first method, this calibration only consists of two parameters. However, depending on the runway and route structure, small deviations can occur because, naturally, the growth in contour area does not exactly match an exponential relationship. Similarly to the first method, once the calibrated values are determined, they can be used for other traffic scenarios at the same airport.
The fitted curves of the previously shown examples of case 1 and case 2 are depicted as green dashed lines in Figure 10, together with their calibrated values of and .
In summary, both methods can increase the accuracy of the approximated contour area. Nonetheless, it needs to be kept in mind that the calibration is based on a single calculation. If the actual route structure or the distribution on these routes changes, the calibration becomes less effective. Also, it must be kept in mind that the noise point sum itself is already an approximation.
In the remainder of this study, only the first method is considered.
5. Verification and Demonstration of the Noise Point Concept
To verify and demonstrate the applicability of the noise point concept, the noise points from Section 3 are applied to selected pre-existing traffic scenarios and compared with calculated values. Traffic scenarios from two different DLR-projects are selected for two purposes. Firstly, simulated traffic scenarios for different German airports from the project ELK [] are evaluated. The application of the noise points to these airports verifies that the concept is consistent across multiple airport sizes and structures. Secondly, predicted traffic scenarios between 2020 and 2050 for generic airports from the project FluiD-21 [] are evaluated. With these traffic scenarios, it can be demonstrated that a temporal development of the noise situation can be well described with the noise point concept.
In the following sections, only the information and results relevant for the application of the noise point concept are presented. For further information on the background, data, and corresponding analyzes, see [] (ELK) and [] (FluiD-21). Also, if applicable, all values mentioned in the following are specified for one year. Note that in the following, ’approximation’ refers to the use of noise points, whereas ’calculation’ refers to actual detailed noise calculations.
5.1. Airports from Project ELK
The following paragraph gives a brief description of the airports and traffic scenarios from the project ELK. Following that, the application of the noise point concept focuses on the three previously introduced quantities: (1) the ratio of noise point sum and number of movements; (2) the approximation of the associated as a measure of the noise impact; and (3) the approximation of contour areas. Steps (2) and (3) are performed using the special case of without any airport calibration.
5.1.1. Airport Description
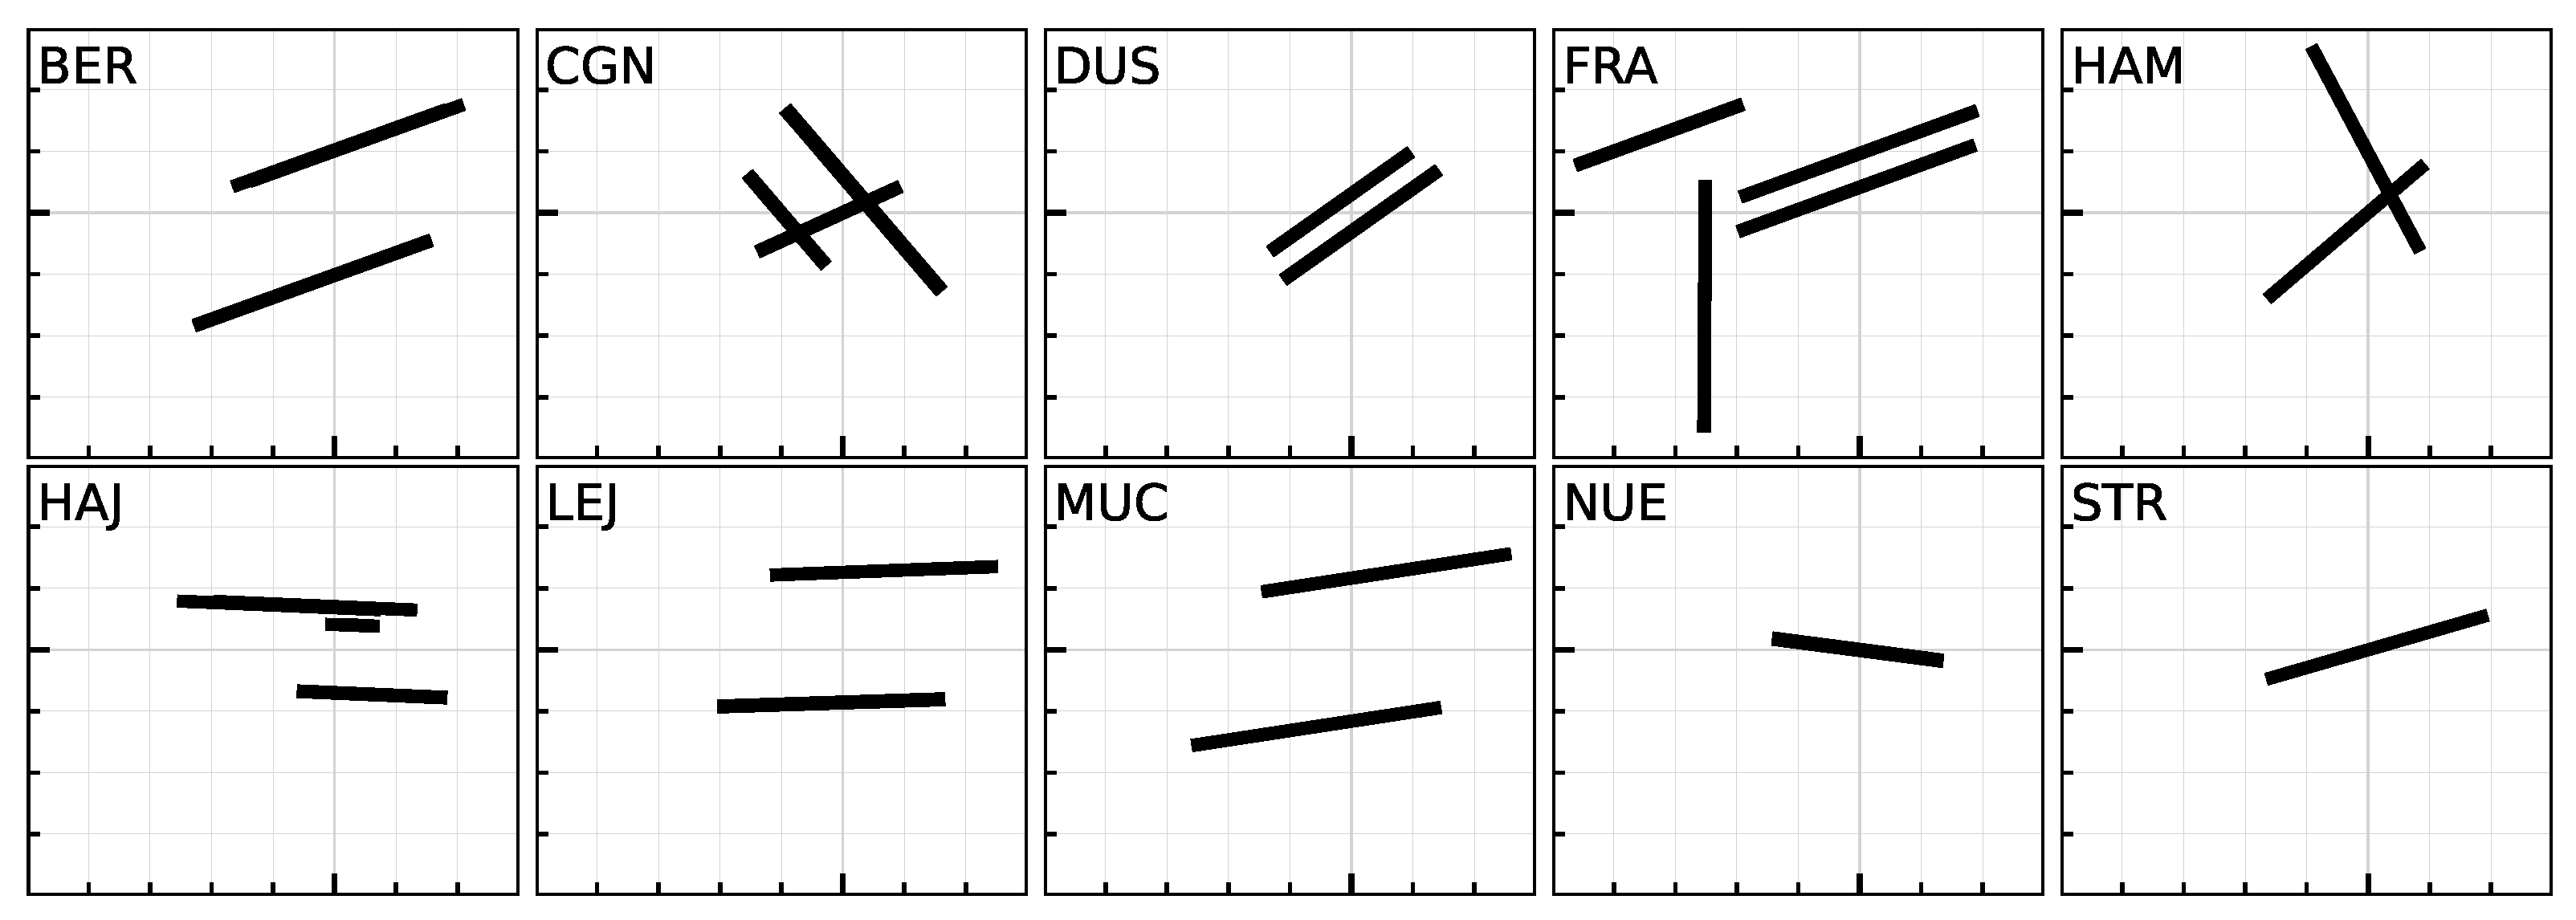
Among others, the noise emission for ten German airports for the years 2019 and 2030 was determined in project ELK []. In order to be able to investigate the noise impact of airport scenarios quickly with low personnel costs, the process chain PLATON (flight plan to noise) [] was developed in project ELK. In this process chain, a flight plan is predicted at the DLR Institute of Air Transport and then passed to the DLR Institute of Flight Guidance to determine the route for each movement; finally, the data is passed to the DLR Institut of Aerodynamics and Flow Technology for noise calculations. With this process chain, noise predictions can be made purely on simulated data for every airport worldwide. In the following, only the results for the year 2019 are used. The airports are listed together with their IATA-code, number of movements per year, and noise point sum in Table 6. The runway layouts for each airport are sketched in Figure 11.

Table 6.
Number of movements and noise point sum of the airports from the project ELK.

Figure 11.
Runway layout of the German airports analyzed in the project ELK. All airports are displayed with the same scale.
5.1.2. Ratio of Noise Point Sum and Number of Movements
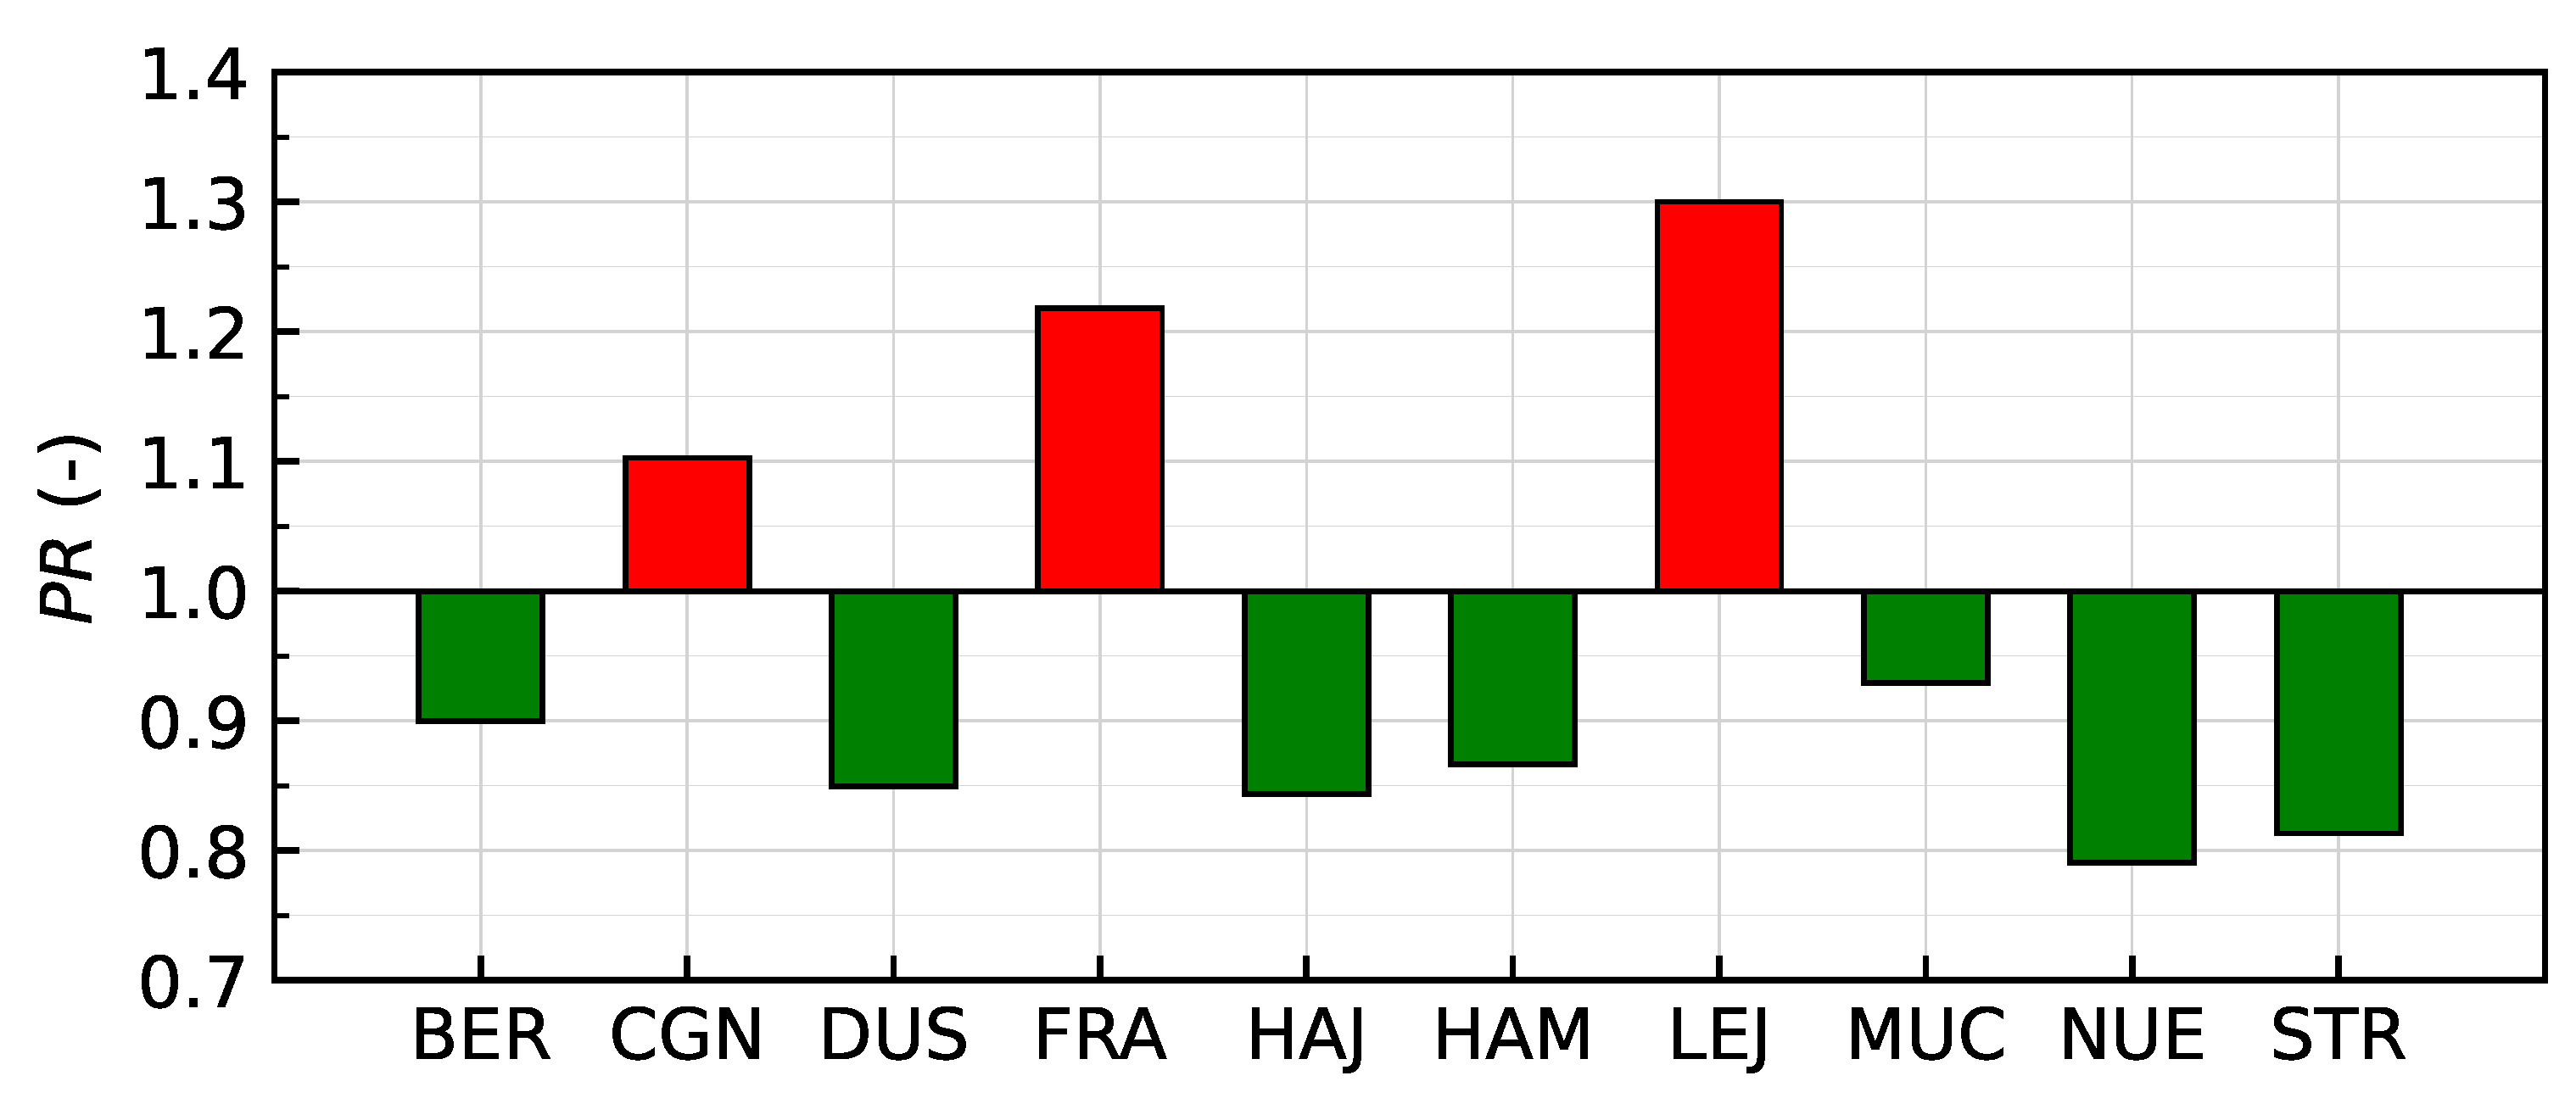
The ratio of the noise point sum , i.e., the equivalent number of movements to the actual number of movements (see Equation (22)), is a measure of how loud the traffic mix at an airport is. This ratio is shown in Figure 12 for the airports from project ELK. The figure shows that, compared to a traffic scenario that is entirely made up of aircraft from the AzB group S3_M130_T2_N7, airports CGN, FRA, and LEJ are comparatively loud (colored in red), whereas the others are comparatively quiet (colored in green). The reason for the high at airports CGN and LEJ is that a significant number of cargo aircraft operate there, which are louder than the selected reference aircraft. At airport FRA, the reason is that a significant number of louder wide-body aircraft are used on intercontinental flights. At the other airports, the number of movements is mainly made up of the reference aircraft and lighter/quieter aircraft.

Figure 12.
Ratio of noise point sum , i.e., the equivalent number of movements, to the actual number of movements at airports from project ELK [].
5.1.3. Approximation of the Associated Equivalent Continuous Sound Level
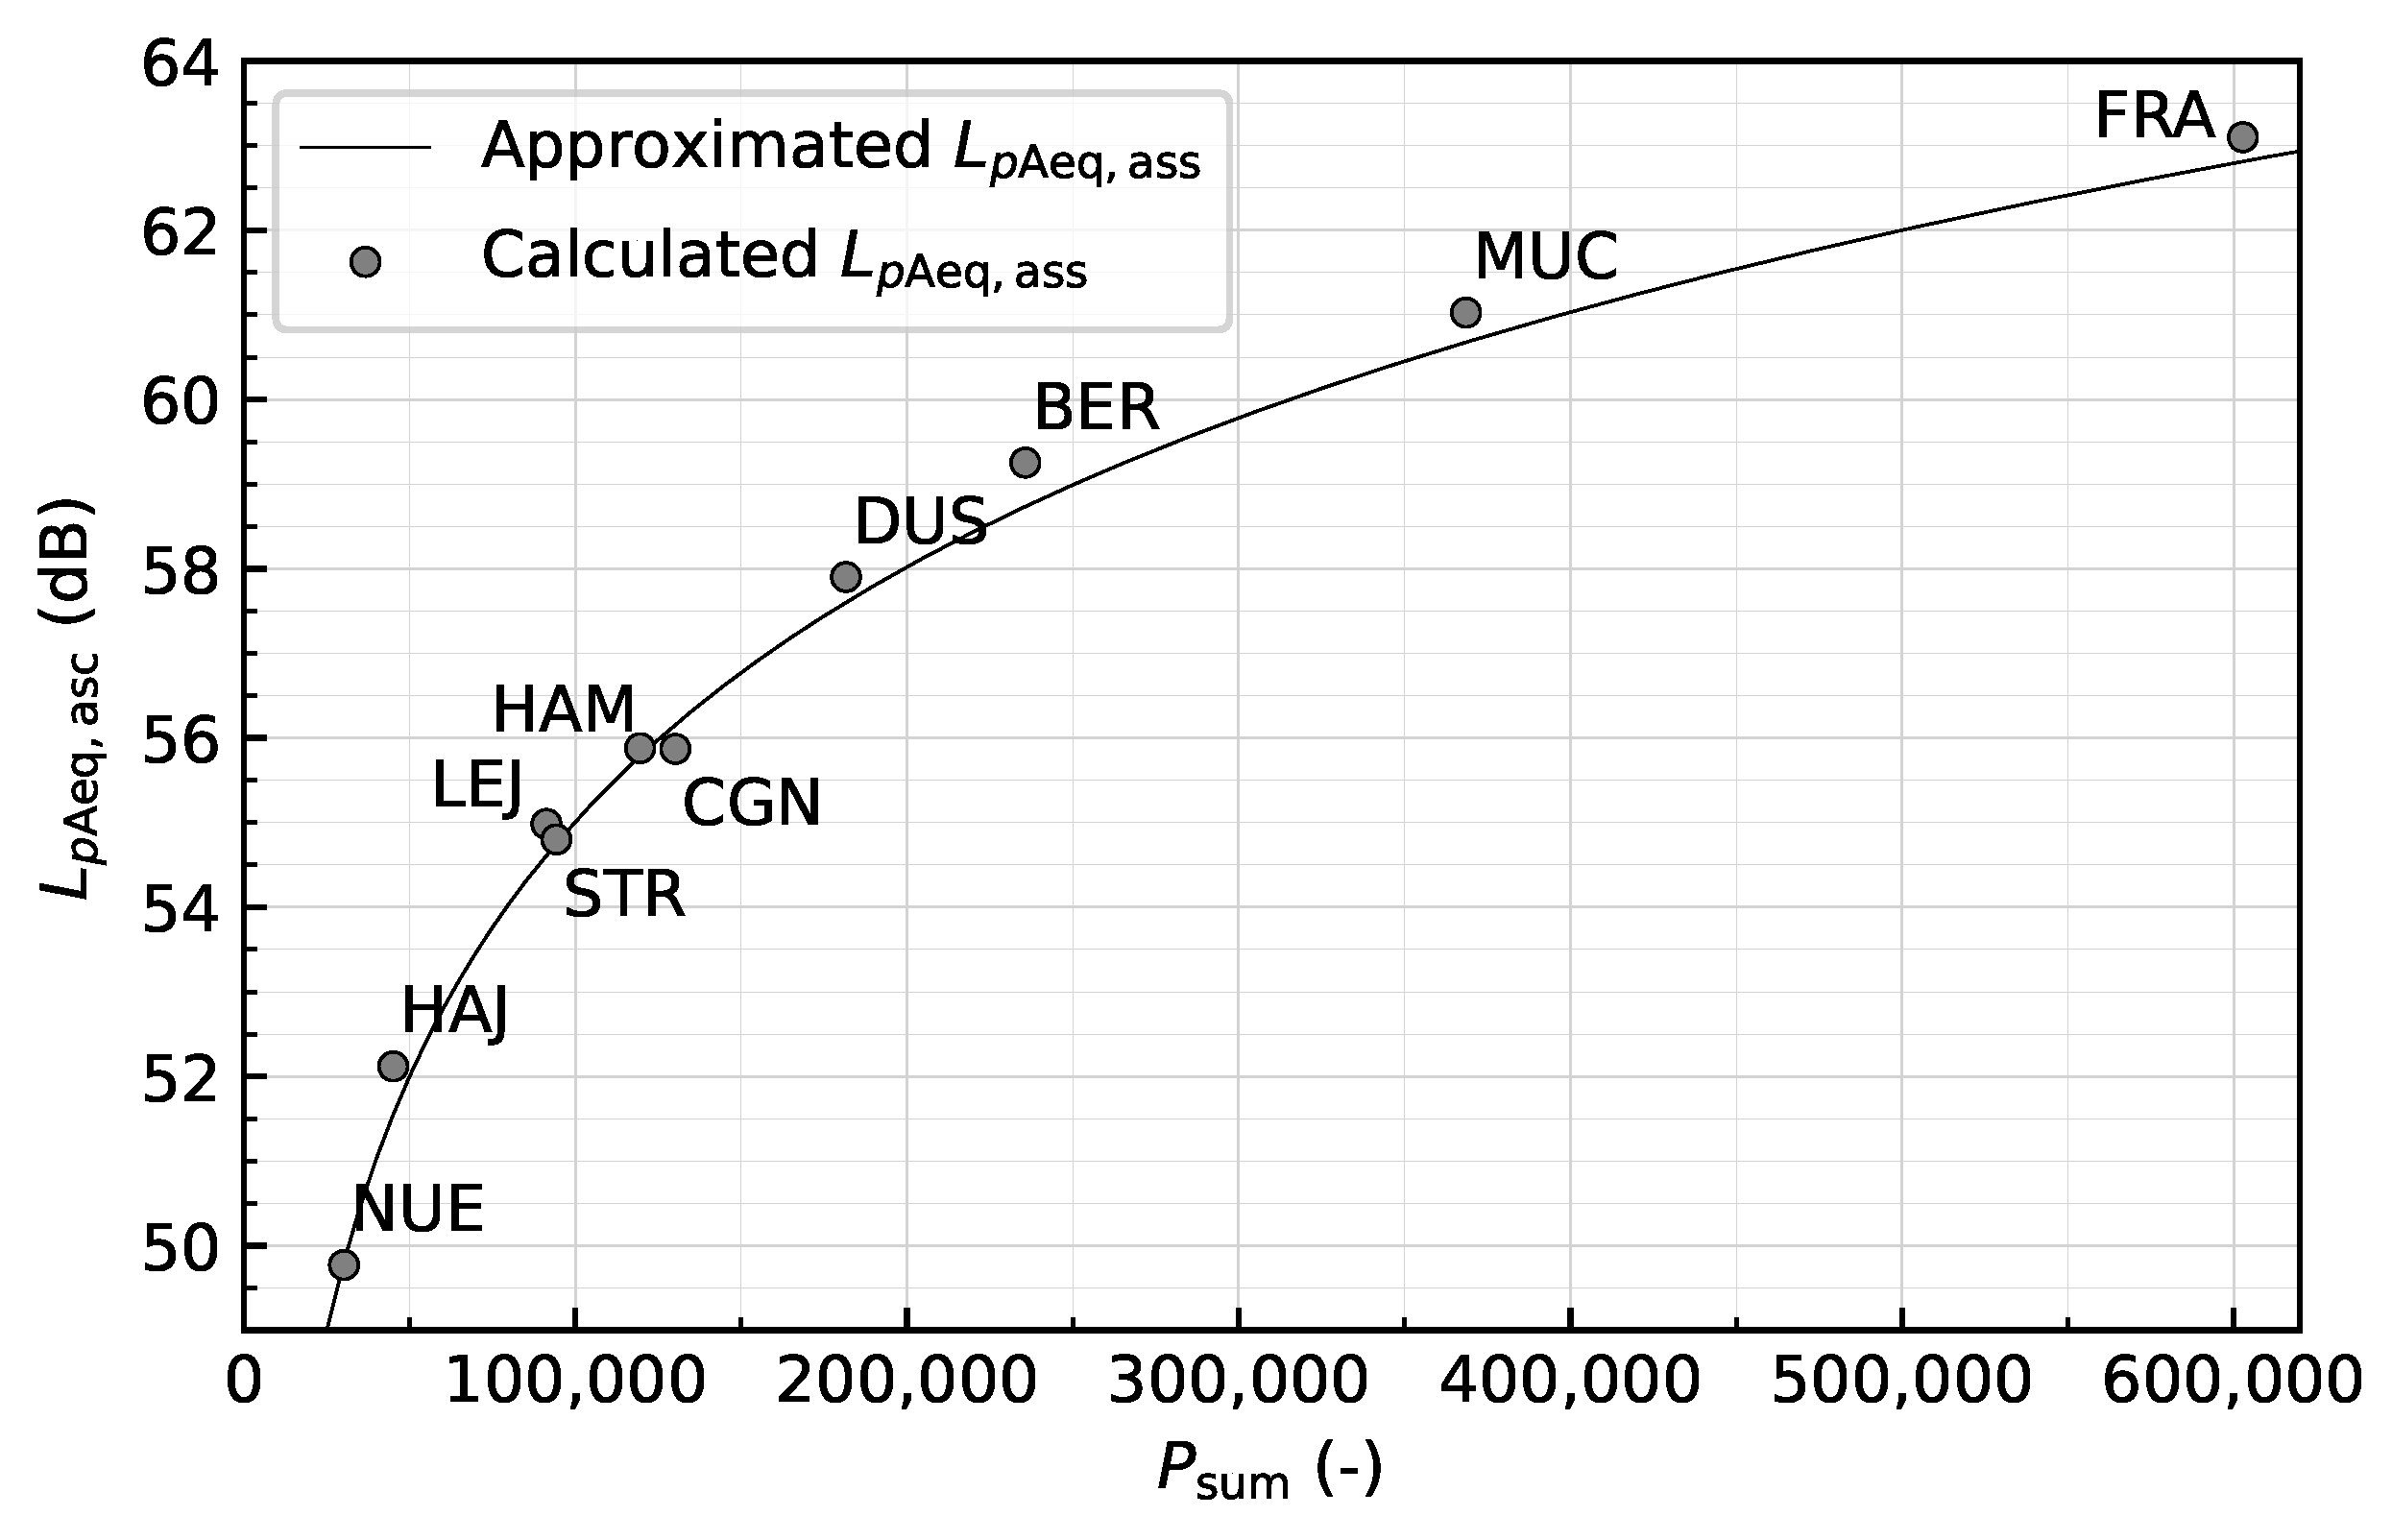
The approximated associated equivalent continuous sound levels (see Equation (27)) using the special case of are compared with the calculated in Figure 13. It can be seen that, even at large airports with multiple routes like BER, MUC, and FRA, the difference between the calculated and approximated is below 0.65 dB. Also, at airports with crossed runway systems, such as HAM and CGN, the differences are small. As expected, the difference is smallest for the airports with only one runway, i.e., NUE and STR, because the noise point system was derived at an airport with a similar runway system.

Figure 13.
Approximated and calculated associated for ten German airports from project ELK []. The approximated associated is determined with Equation (23), i.e., with s, s (seconds in one year), and dB. The calculated associated is determined iteratively from detailed noise calculations.
5.1.4. Approximation of Contour Areas
The calculated and approximated contour areas for three selected contour values are shown in Figure 14. As in the previous section, only the simplified Equation (29) was used here, i.e., . From Figure 14, it can be concluded that the approximation of contour areas works well. However, it is noticeable that the deviations above 30 km2 for the airports BER and MUC are particularly large. The reason for this is explained with Figure 15. Since the runways at DUS lie close to one another, the contour lines look similar to the contour lines at a simple airport with only one runway. In contrast to DUS, the results of BER and MUC differ, even though they also have two parallel runways. The reason is that since the two runways at BER and MUC are spaced farther apart than at DUS, the noise contours remain separate, i.e., each runway has its own contour. These contours merge into a single one at noise levels below approximately 60 dB.

Figure 14.
Approximated and calculated contour areas for ten German airports from project ELK []. The approximated area is determined with the simplified Equation (29), i.e., with s, s (seconds in one year), dB, and km2. Note that, in this case, the shown relation between area and noise point sum is linear/proportional, i.e., .

Figure 15.
contours from project ELK [] for the year 2019 for the following: (top) airport BER; (middle) airport DUS; (bottom) airport MUC.
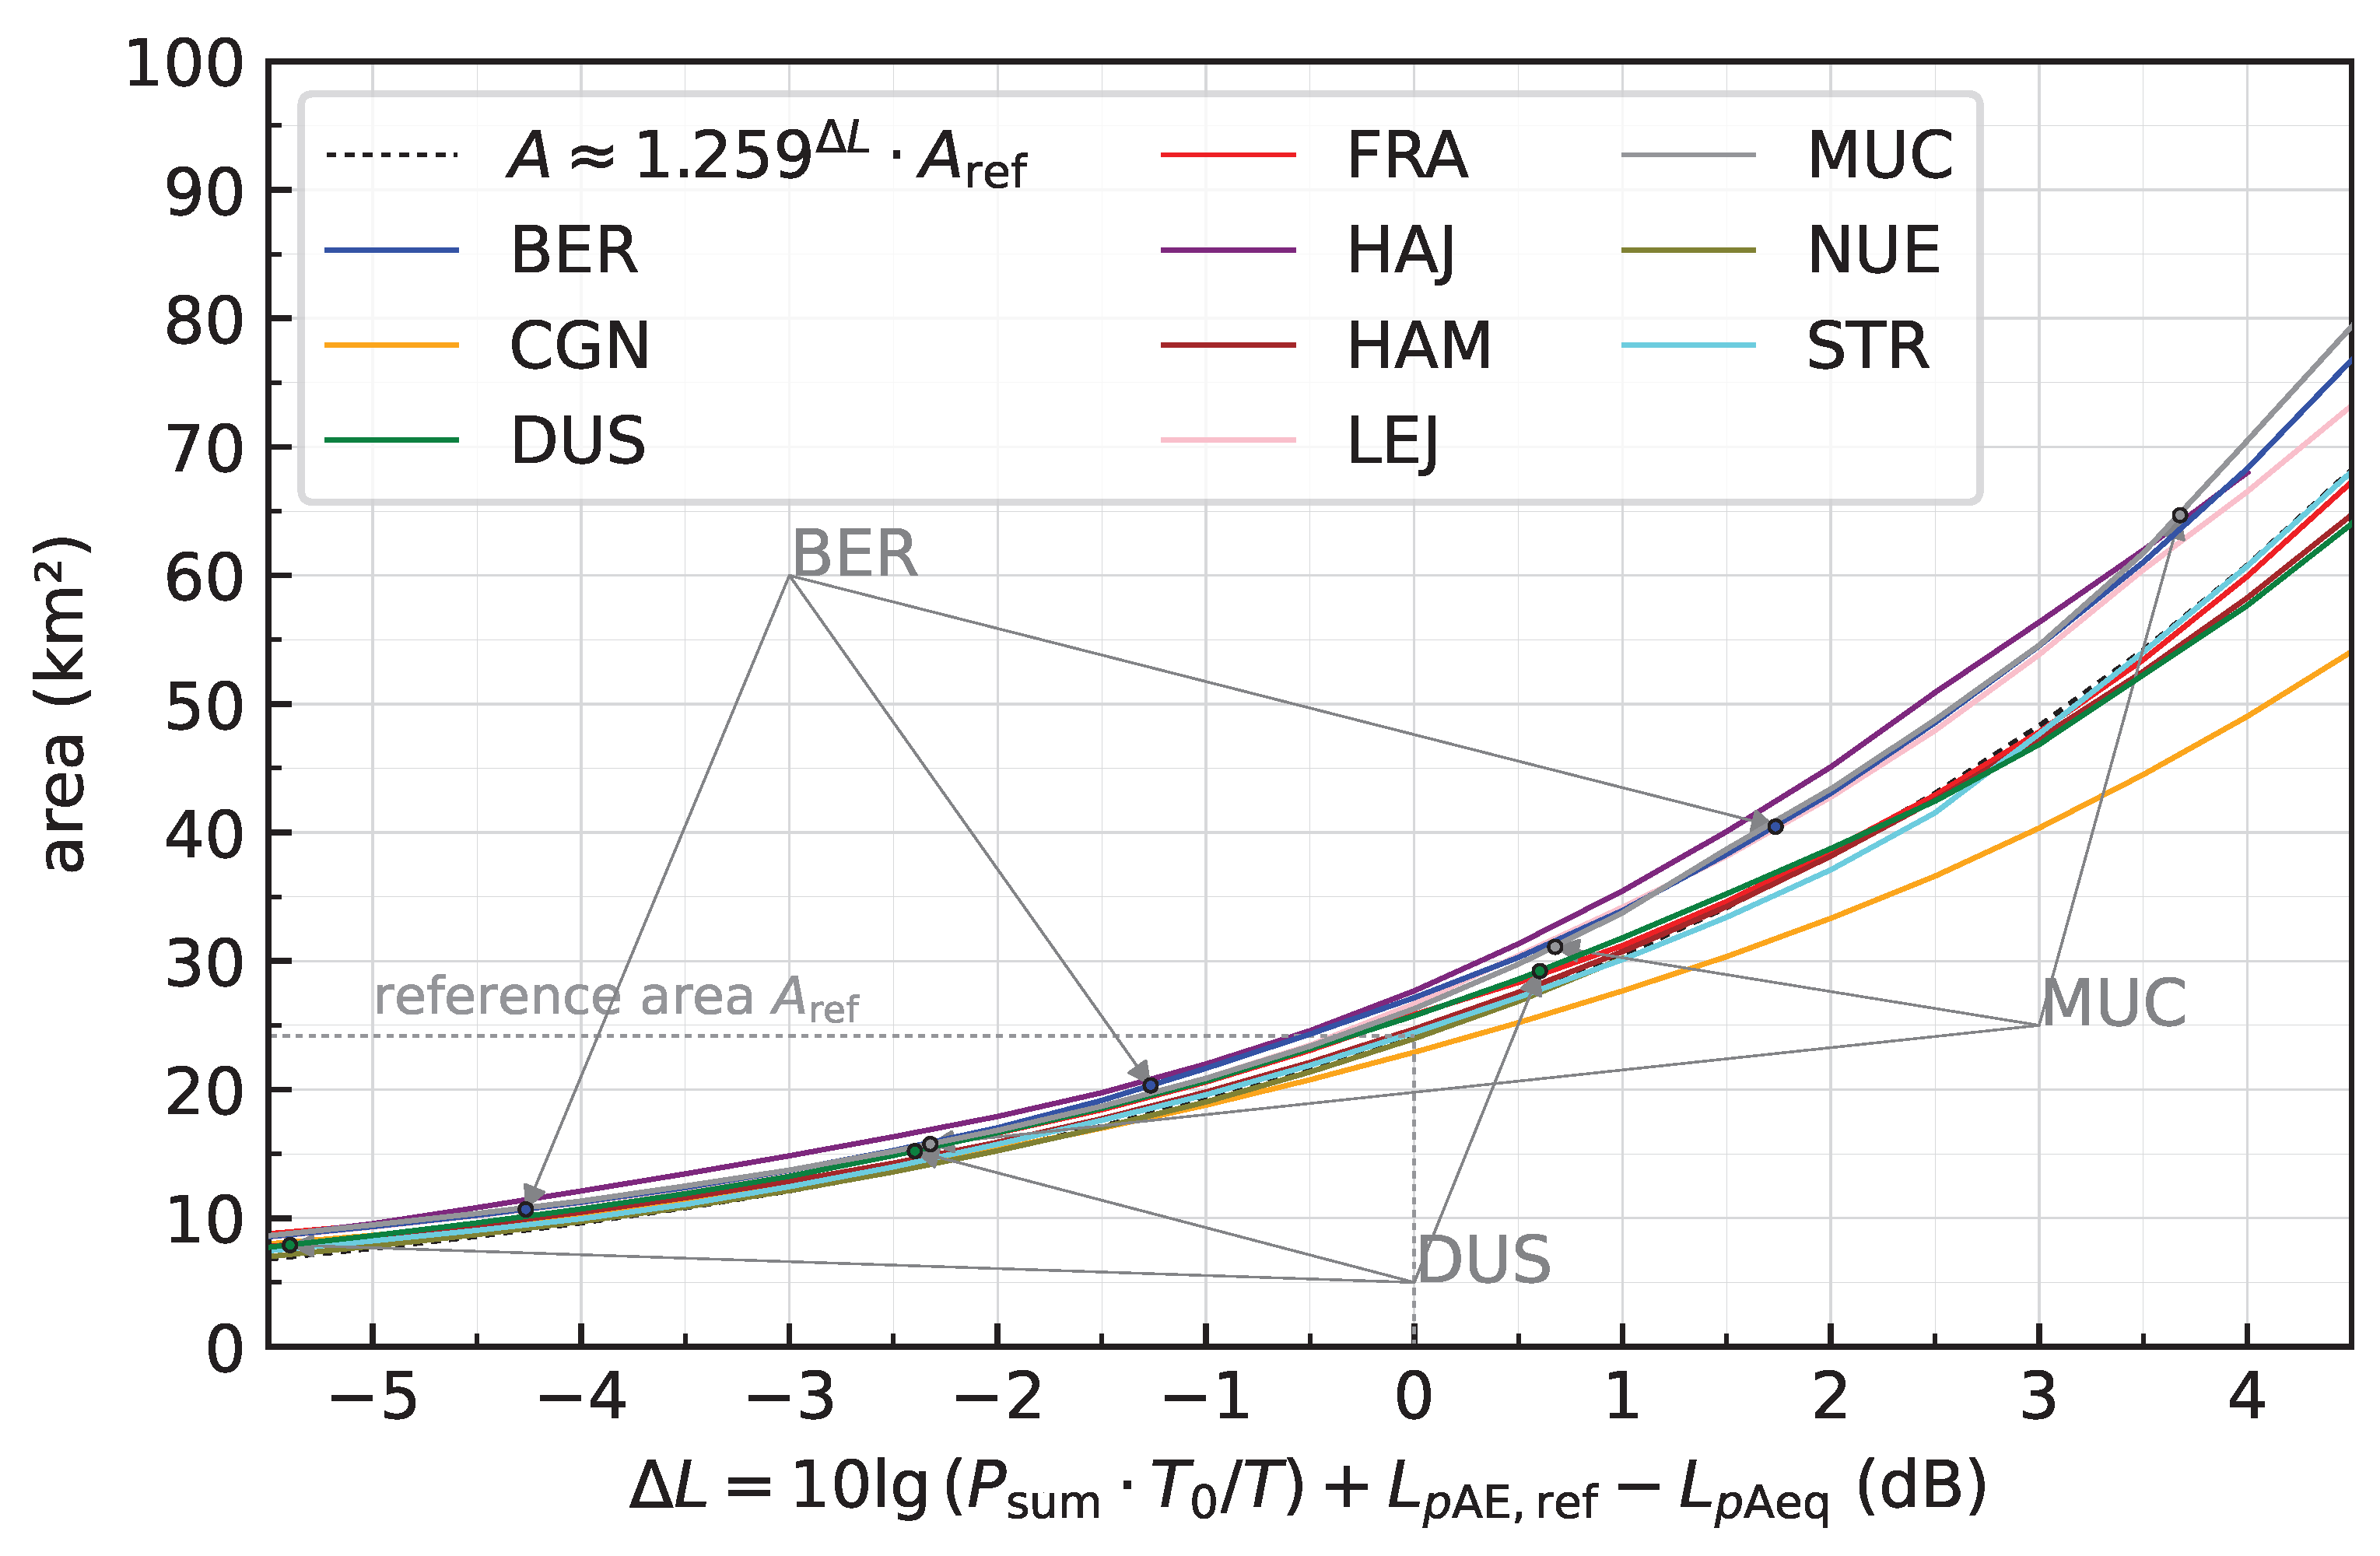
For the approximation of the contour areas of other traffic scenarios at these airports, the performed calculations can be used for calibration, which will mitigate potential deviations. For such an airport calibration, the areas are plotted against in Figure 16. The special case of is also shown in the figure. As can be seen from this figure, the contour areas for airports DUS, FRA, HAM, NUE, and STR correspond closely to the special case. In contrast, the contour areas of airports BER, CGN, HAJ, MUC, and LEJ deviate from the special case. Therefore, an airport calibration with one of the two methods described in Section 4.4.2 is advantageous at these airports if contour areas from other traffic scenarios are analyzed.

Figure 16.
Calculated contour area plotted against for the ten German airports from project ELK []. The simple approximation of is shown as a dashed line. The value pairs for three selected airports for 57 dB, 60 dB, and 63 dB from Figure 14 are marked with arrows.
The value pairs for BER, DUS, and MUC for 57 dB, 60 dB, and 63 dB from Figure 14 are marked with arrows. Also shown in this figure is the simple approximation of contour areas using Equation (29). Note that the difference between the marked points and the simple approximation with is identical to the difference already shown in Figure 14 because the data is the same.
5.2. Airports from Project FluiD21
In the following, generic airports and the temporal development of the number of movements from project FluiD-21 [] are briefly described. Following this, the application focuses on the following: (1) the temporal development of the ratio of the noise point sum and the number of movements; (2) the temporal development of the approximated associated equivalent continuous sound level as a measure of noise impact; (3) the relative temporal development of the approximated contour areas; (4) the absolute temporal development of the approximated contour areas, including airport calibration. In addition, in step (5), how well a complete noise contour can be approximated is analyzed with the noise point concept.
5.2.1. Airport Description
Various future traffic scenarios at two generic airports (referred to as ONE and TWO) have been analyzed in project FluiD-21 [] in order to assess the aircraft noise situation in the 21st century. The analyzed time period went from 2019/2020 to 2050 in steps of 5 years. Besides a baseline scenario, multiple what-if scenarios have been analyzed. In this study, however, only the results of the baseline scenarios are used. Note that the results in FluiD-21 were produced before the COVID-19 pandemic, and the traffic scenarios do not apply anymore. Nonetheless, the noise point concept can be verified with these results.
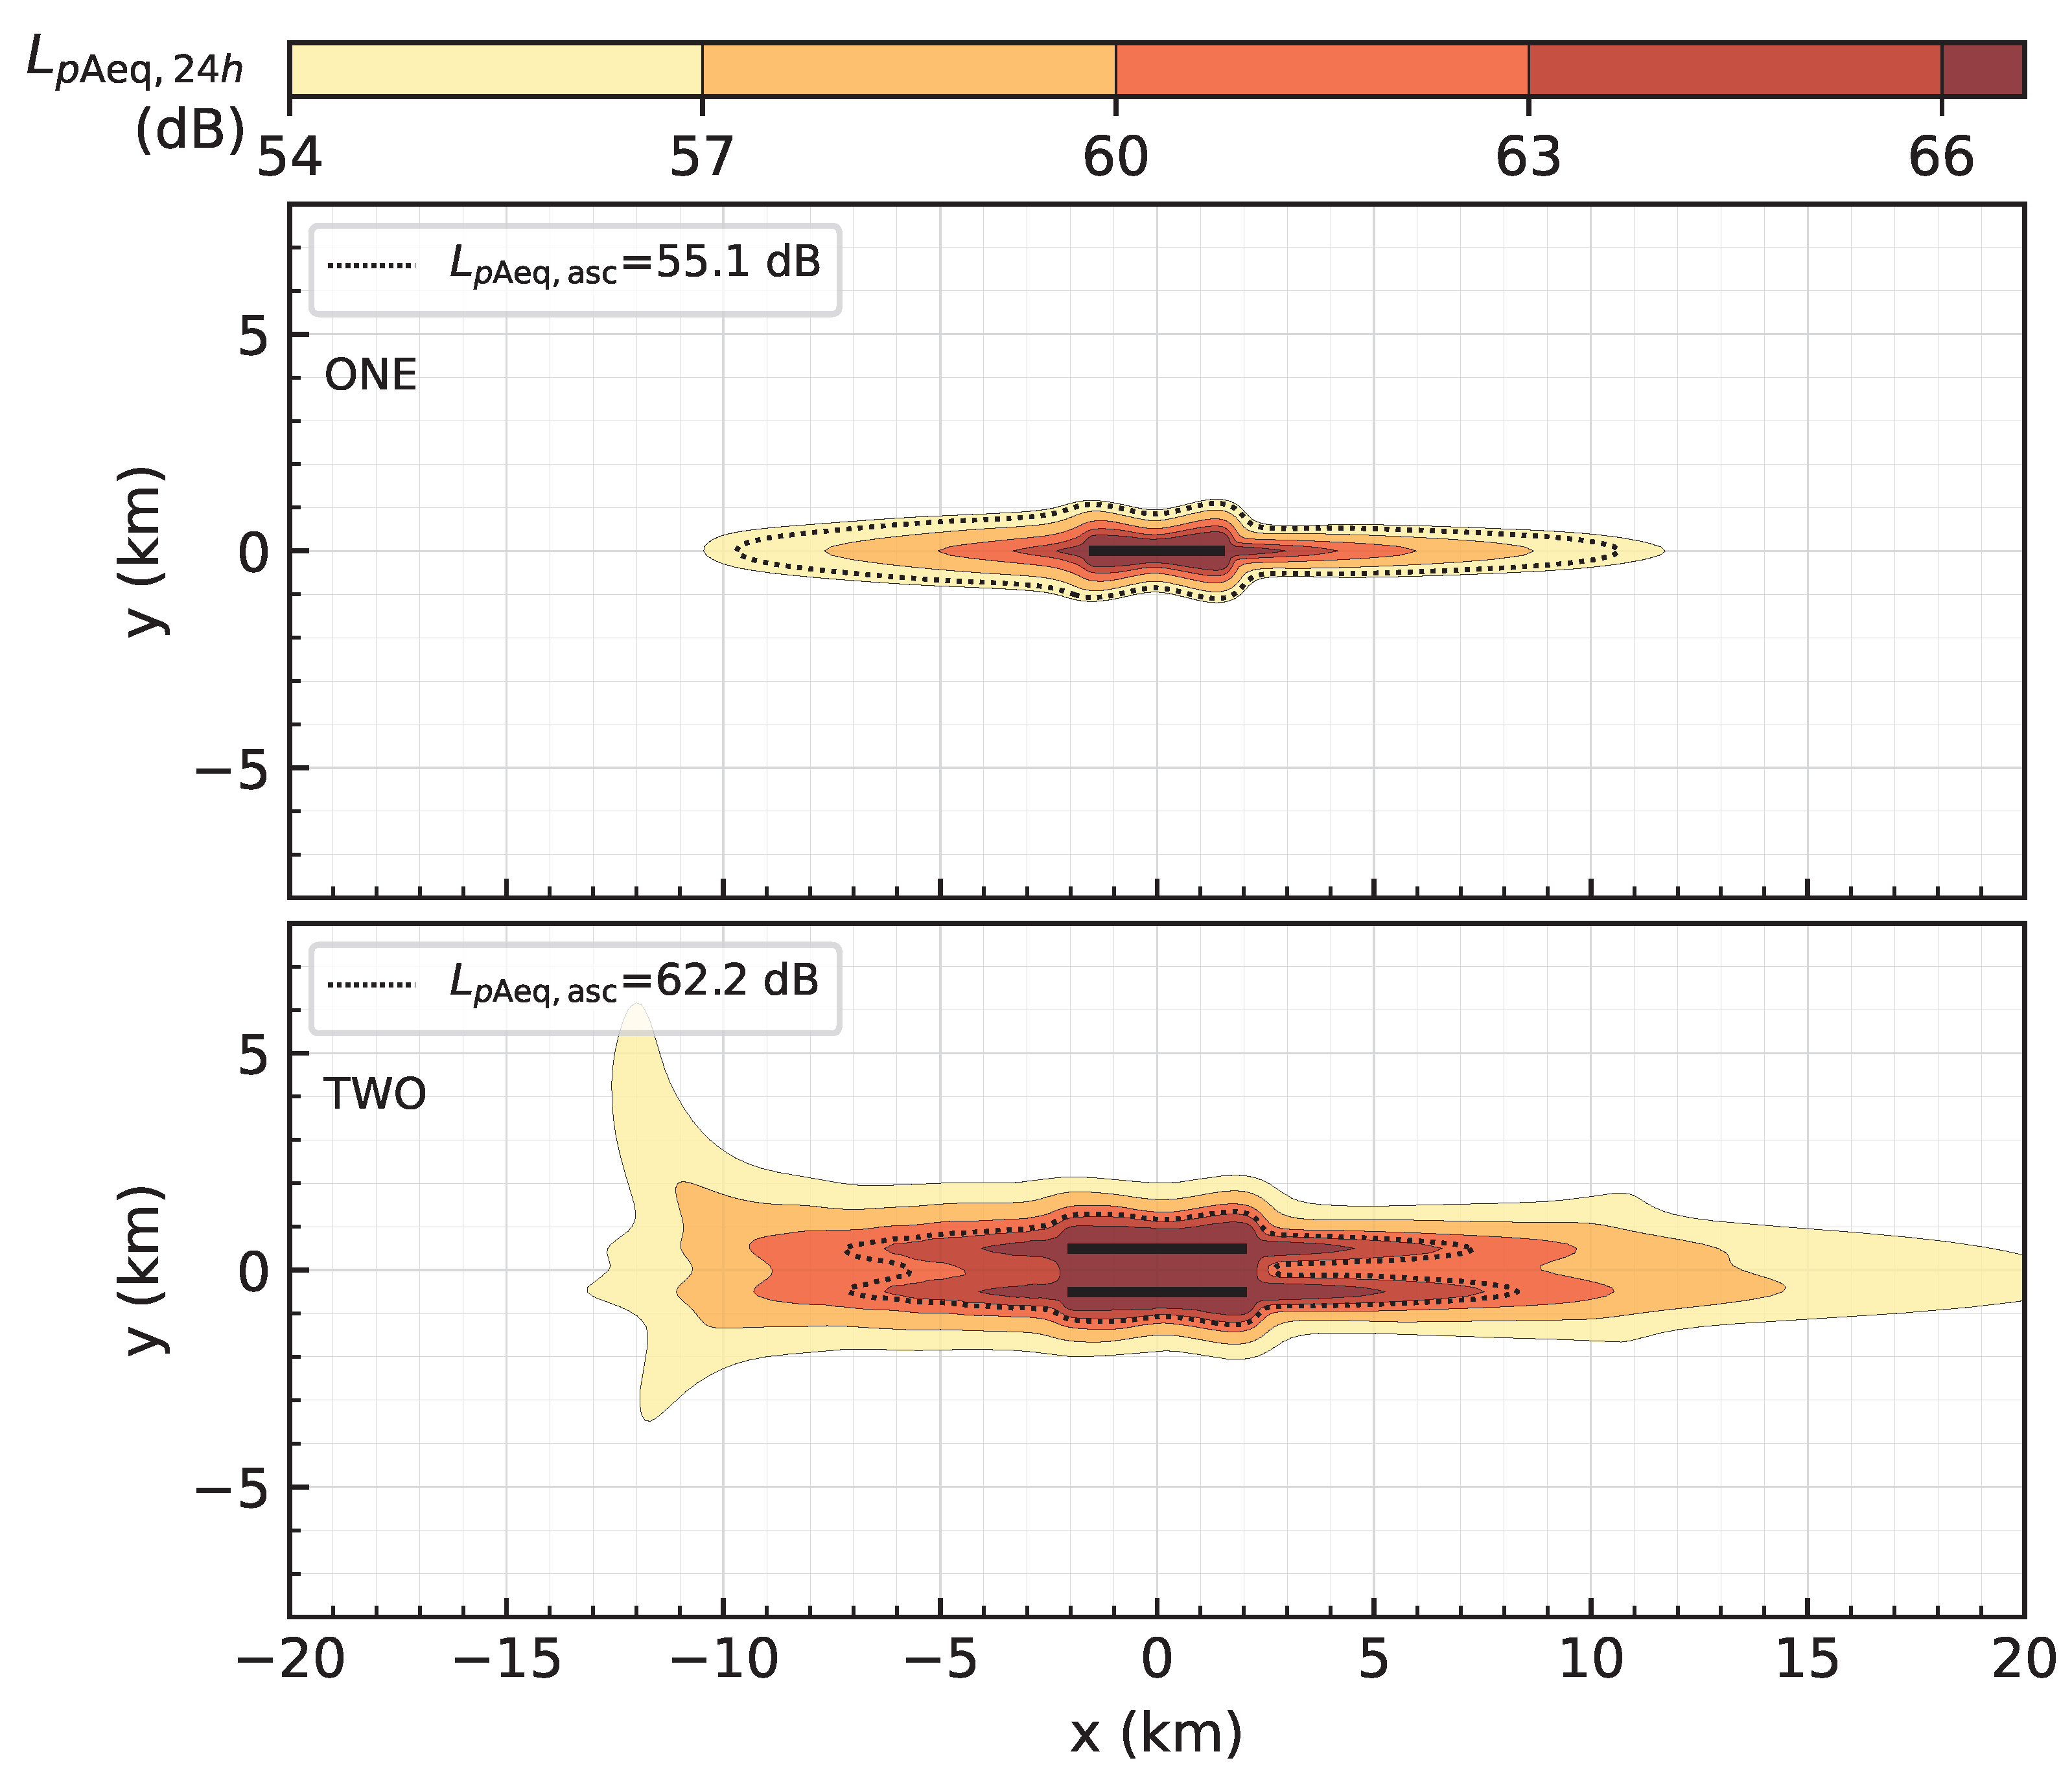
The smaller airport (ONE) has a single runway with 121,000 movements per year in 2020, whereas the larger airport (TWO) has two parallel runways with 459,000 movements per year in 2020 (see Table 7). The airport layouts, together with the for the year 2020, are shown in Figure 17. The associated for which the contour area matches the reference area of 24.2 km2 is 55.1 dB and 62.3 dB for ONE and TWO, respectively, which are drawn as black dashed lines.

Table 7.
Generic airports from project FluiD-21 [].

Figure 17.
Airport layouts from project FluiD-21 [] together with for the year 2020: (top) airport ONE; (bottom) airport TWO.
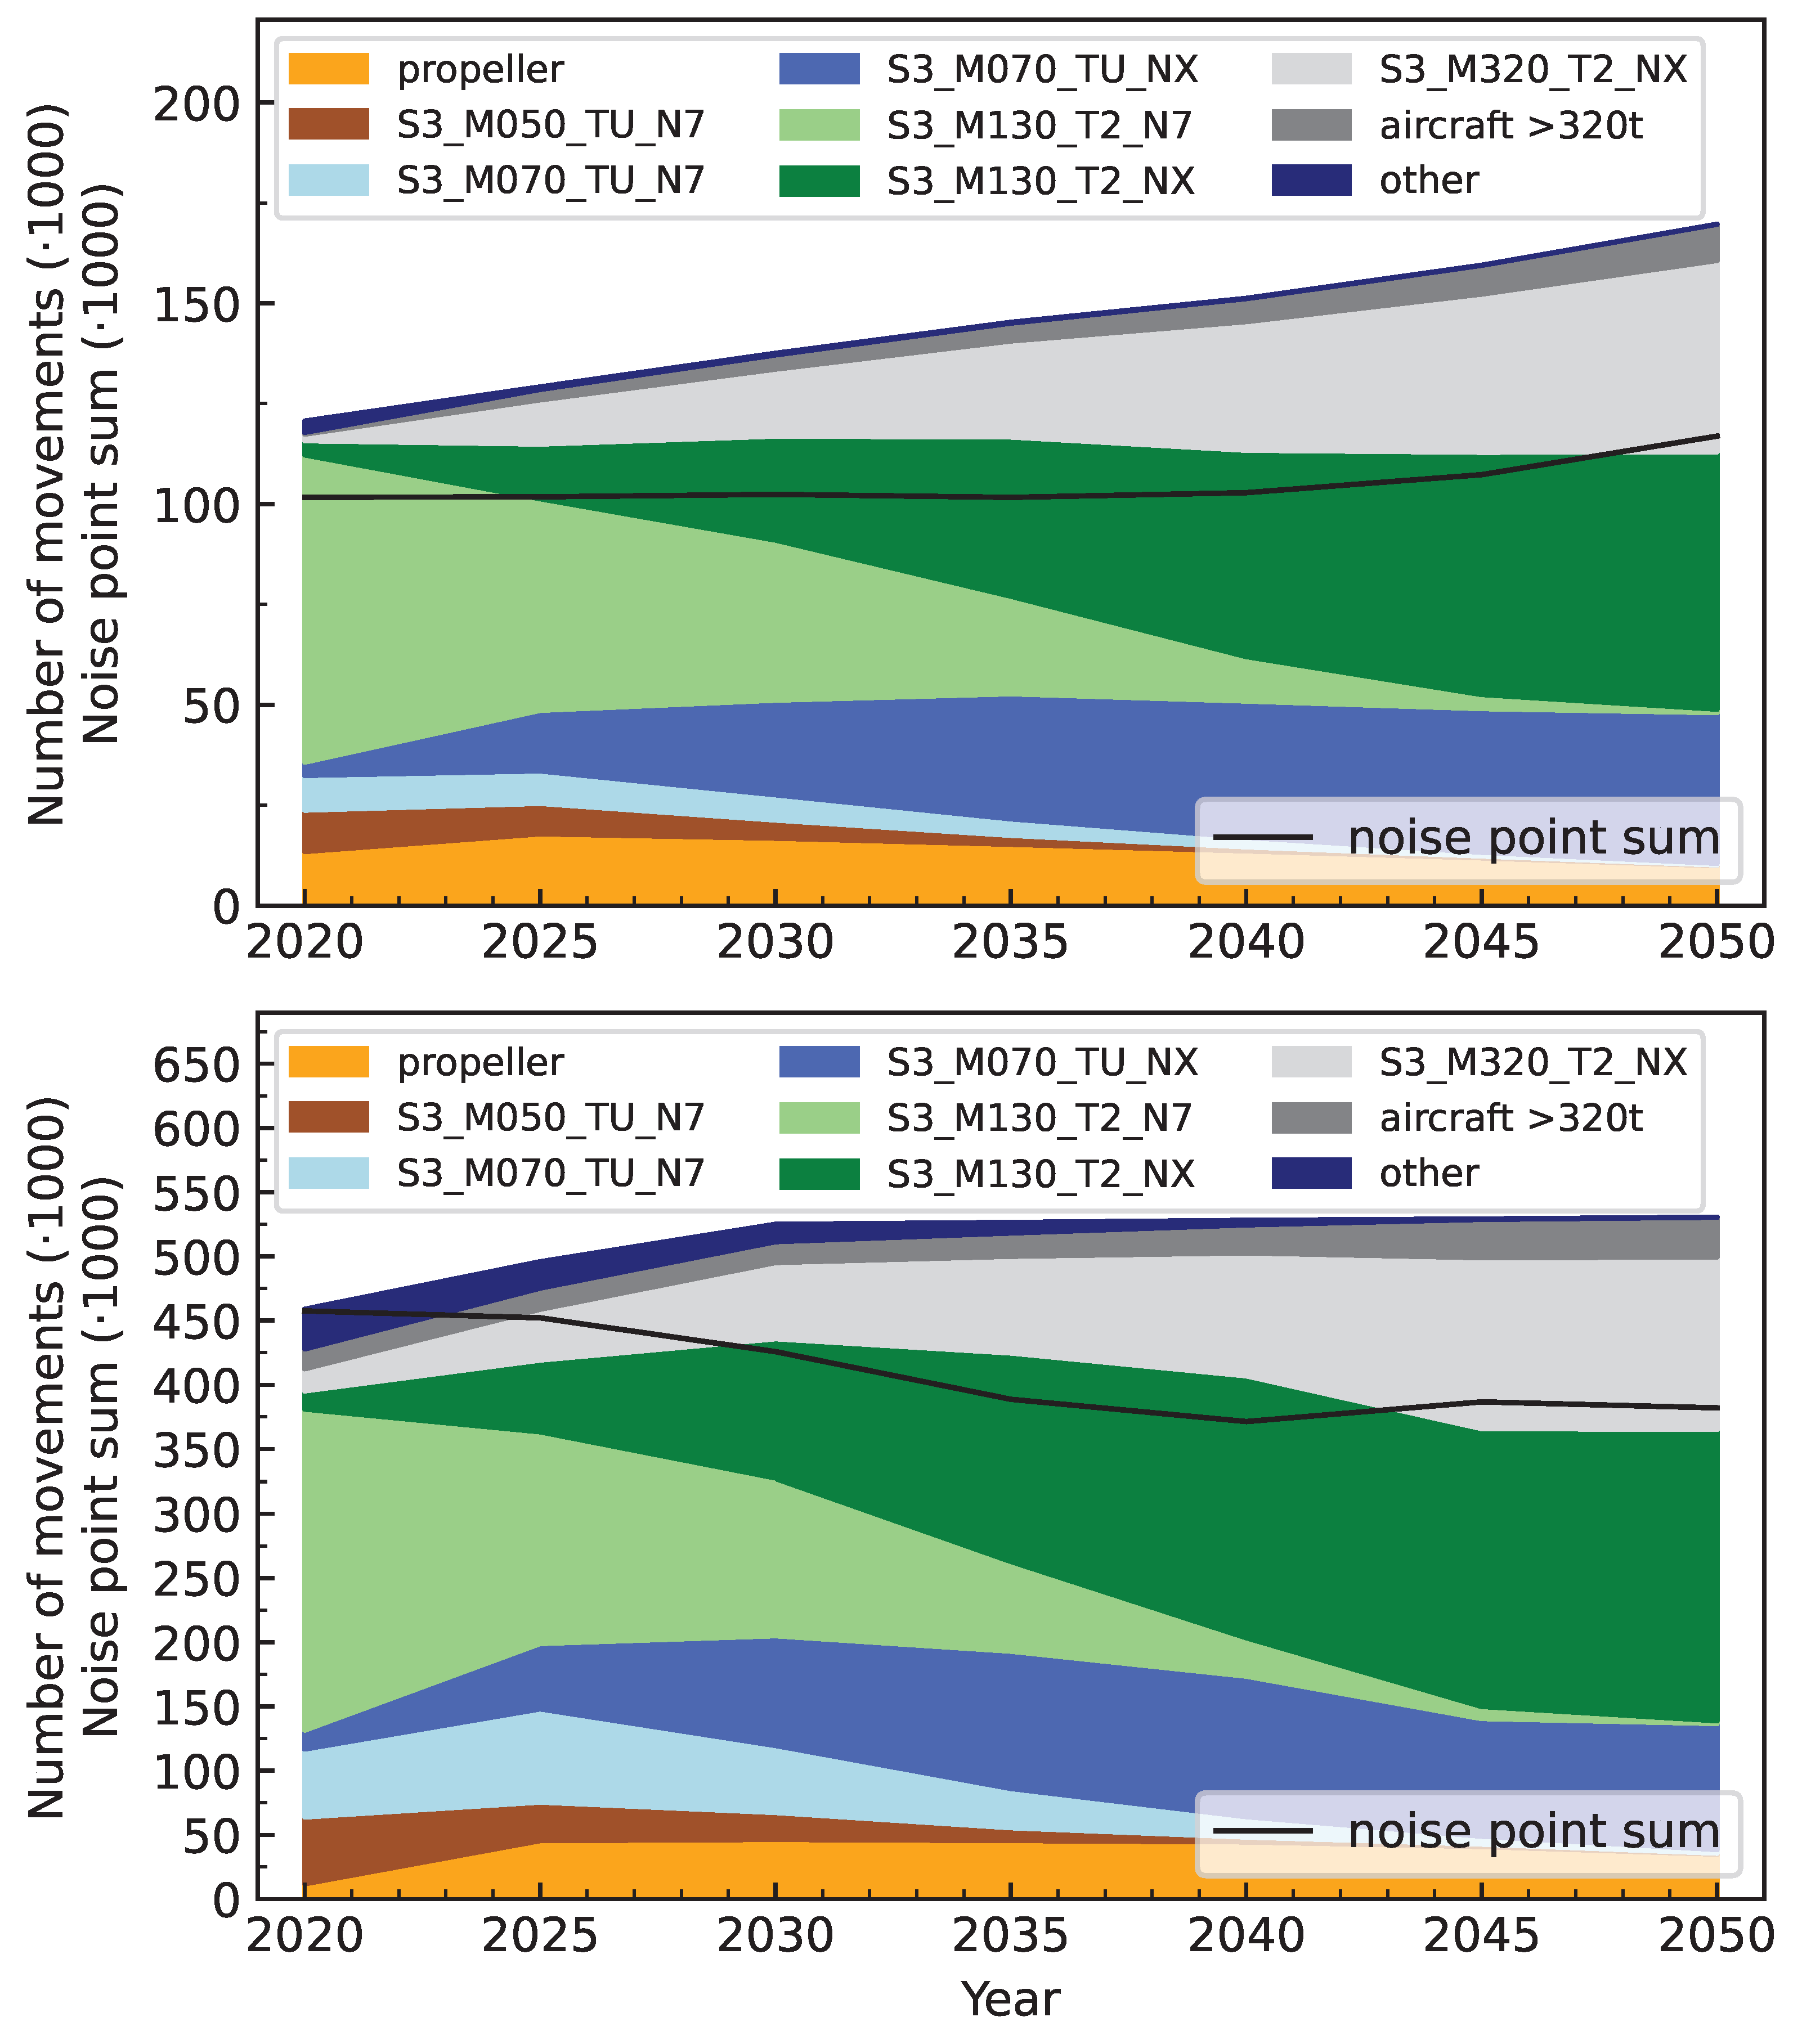
The development of the number of movements per aircraft group and the development of the noise point sum at airport ONE are shown in Figure 18 (top) between 2020 and 2050. The highest number of movements is from aircraft with maximum takeoff masses between 70 t and 130 t (aircraft groups S3_M130_T2_N7 and S3_M130_T2_NX). A shift from the conventional engines with bypass ratios less than seven (N7-variants) to engines with bypass ratios greater than seven (NX-variants) can be seen clearly. Additionally, the number of movements of heavier modern aircraft in the range of 220 t and 320 t (aircraft group S3_M320_T2_NX) significantly increases.

Figure 18.
Development of the number of movements for selected AzB21 groups and the development of the noise point sum at airports from project FluiD-21 []: (top) airport ONE; (bottom) airport TWO.
Similarly, the number of movements per aircraft group and the noise point sum at airport TWO is shown in Figure 18 (bottom) between 2020 to 2050. Up until 2030, the number of movements and the percentage of modern aircraft increase. The airport reaches its capacity limit at 2030 such that the total number of movements stays almost constant while aircraft are further replaced by modern, mainly heavier, aircraft. Beyond 2040, most aircraft will be replaced by modern aircraft. However, the number of movements for modern aircraft between 220 t and 320 t (M320_NX-variants) still increases.
5.2.2. Temporal Development of the Ratio of Noise Point Sum and Number of Movements
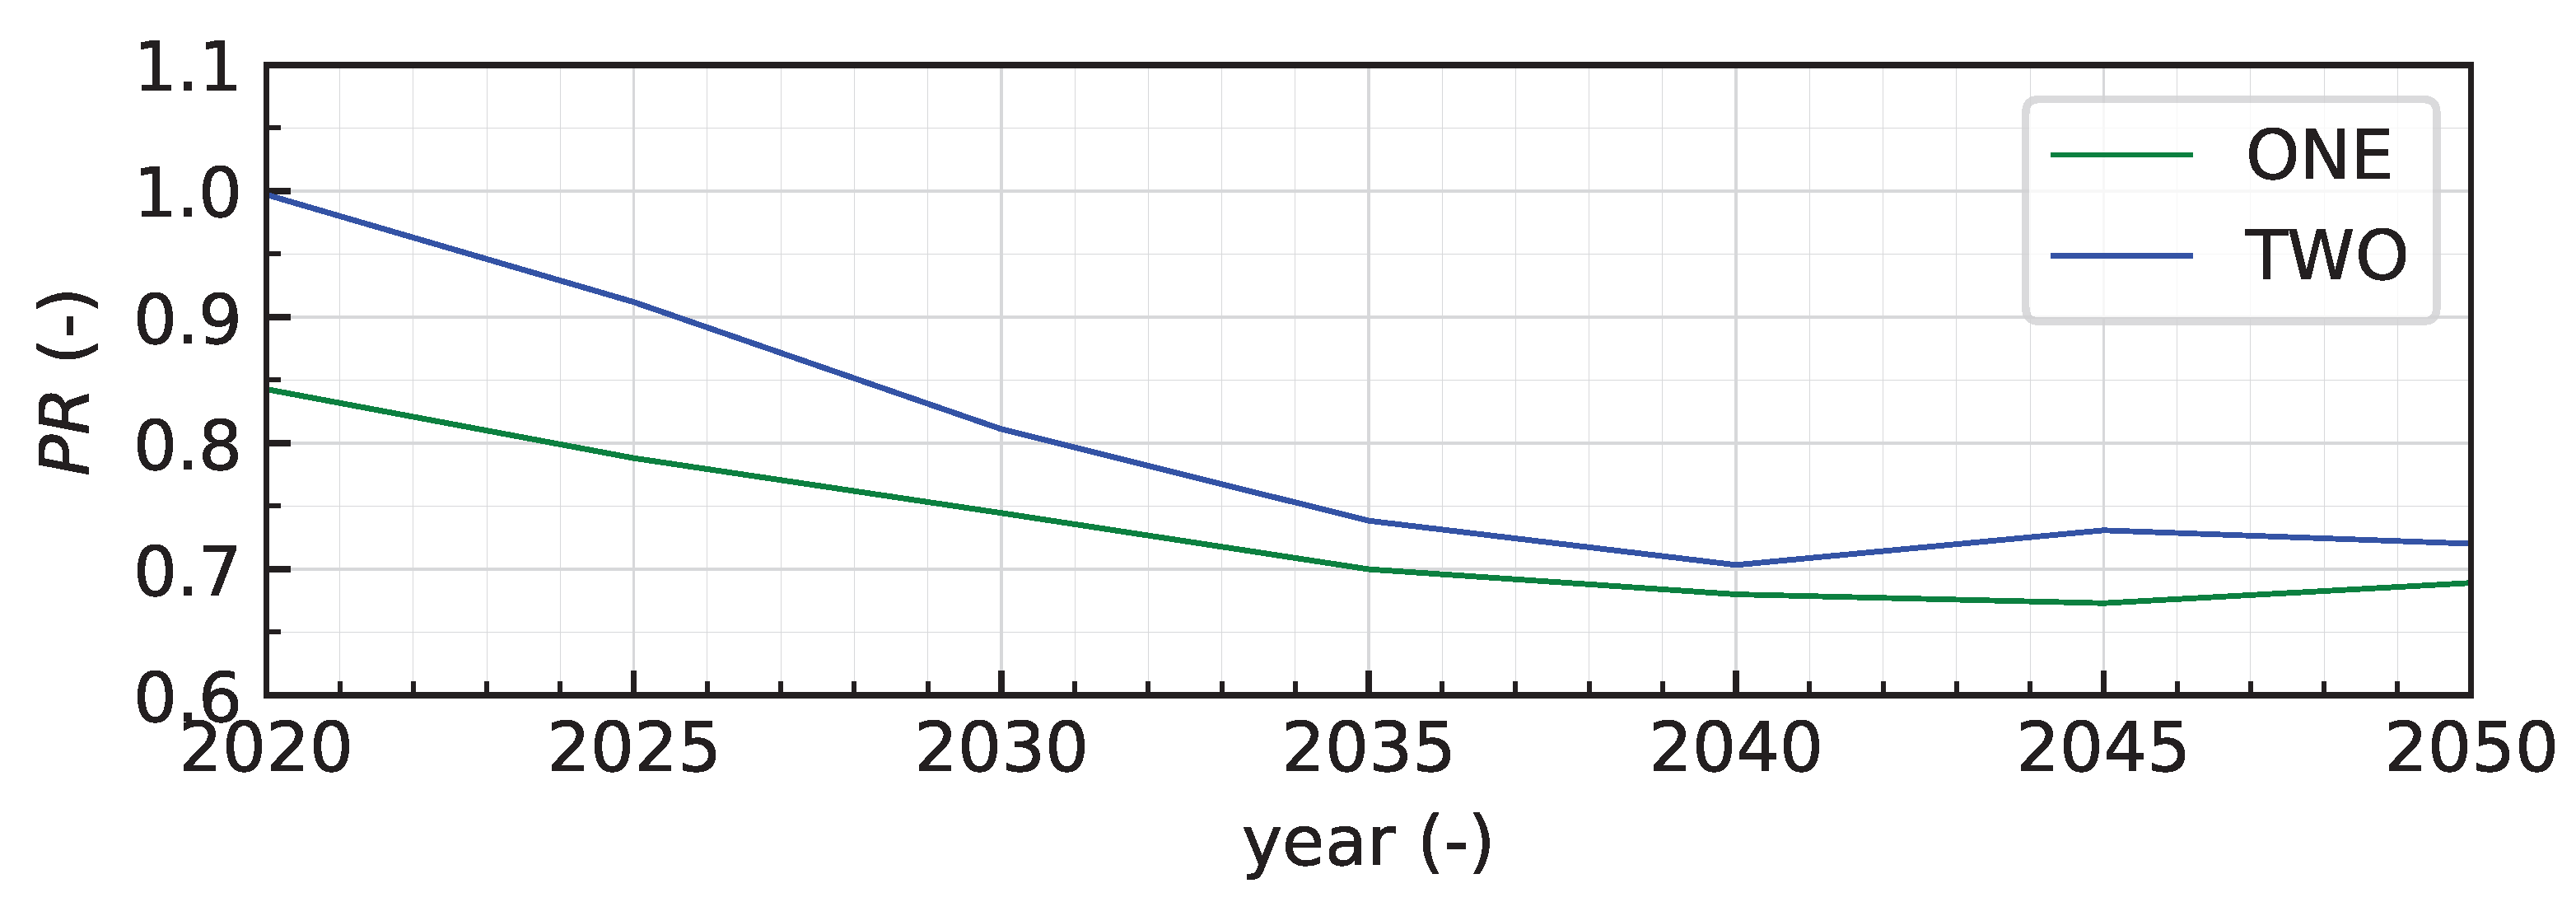
The temporal development of the ratio of the noise point sum to the actual number of movements for both airports from the project FluiD-21 is shown in Figure 19. Since larger aircraft are used at airport TWO (mainly due to intercontinental flight movements), is generally larger at airport TWO than at airport ONE. By continuously replacing older, louder aircraft with modern, quieter aircraft, the for both airports decreases.

Figure 19.
Temporal development of the ratio of the noise point sum to the actual number of movements for both airports from project FluiD-21 [].
5.2.3. Temporal Development of the Approximated Associated Equivalent Continuous Sound Level
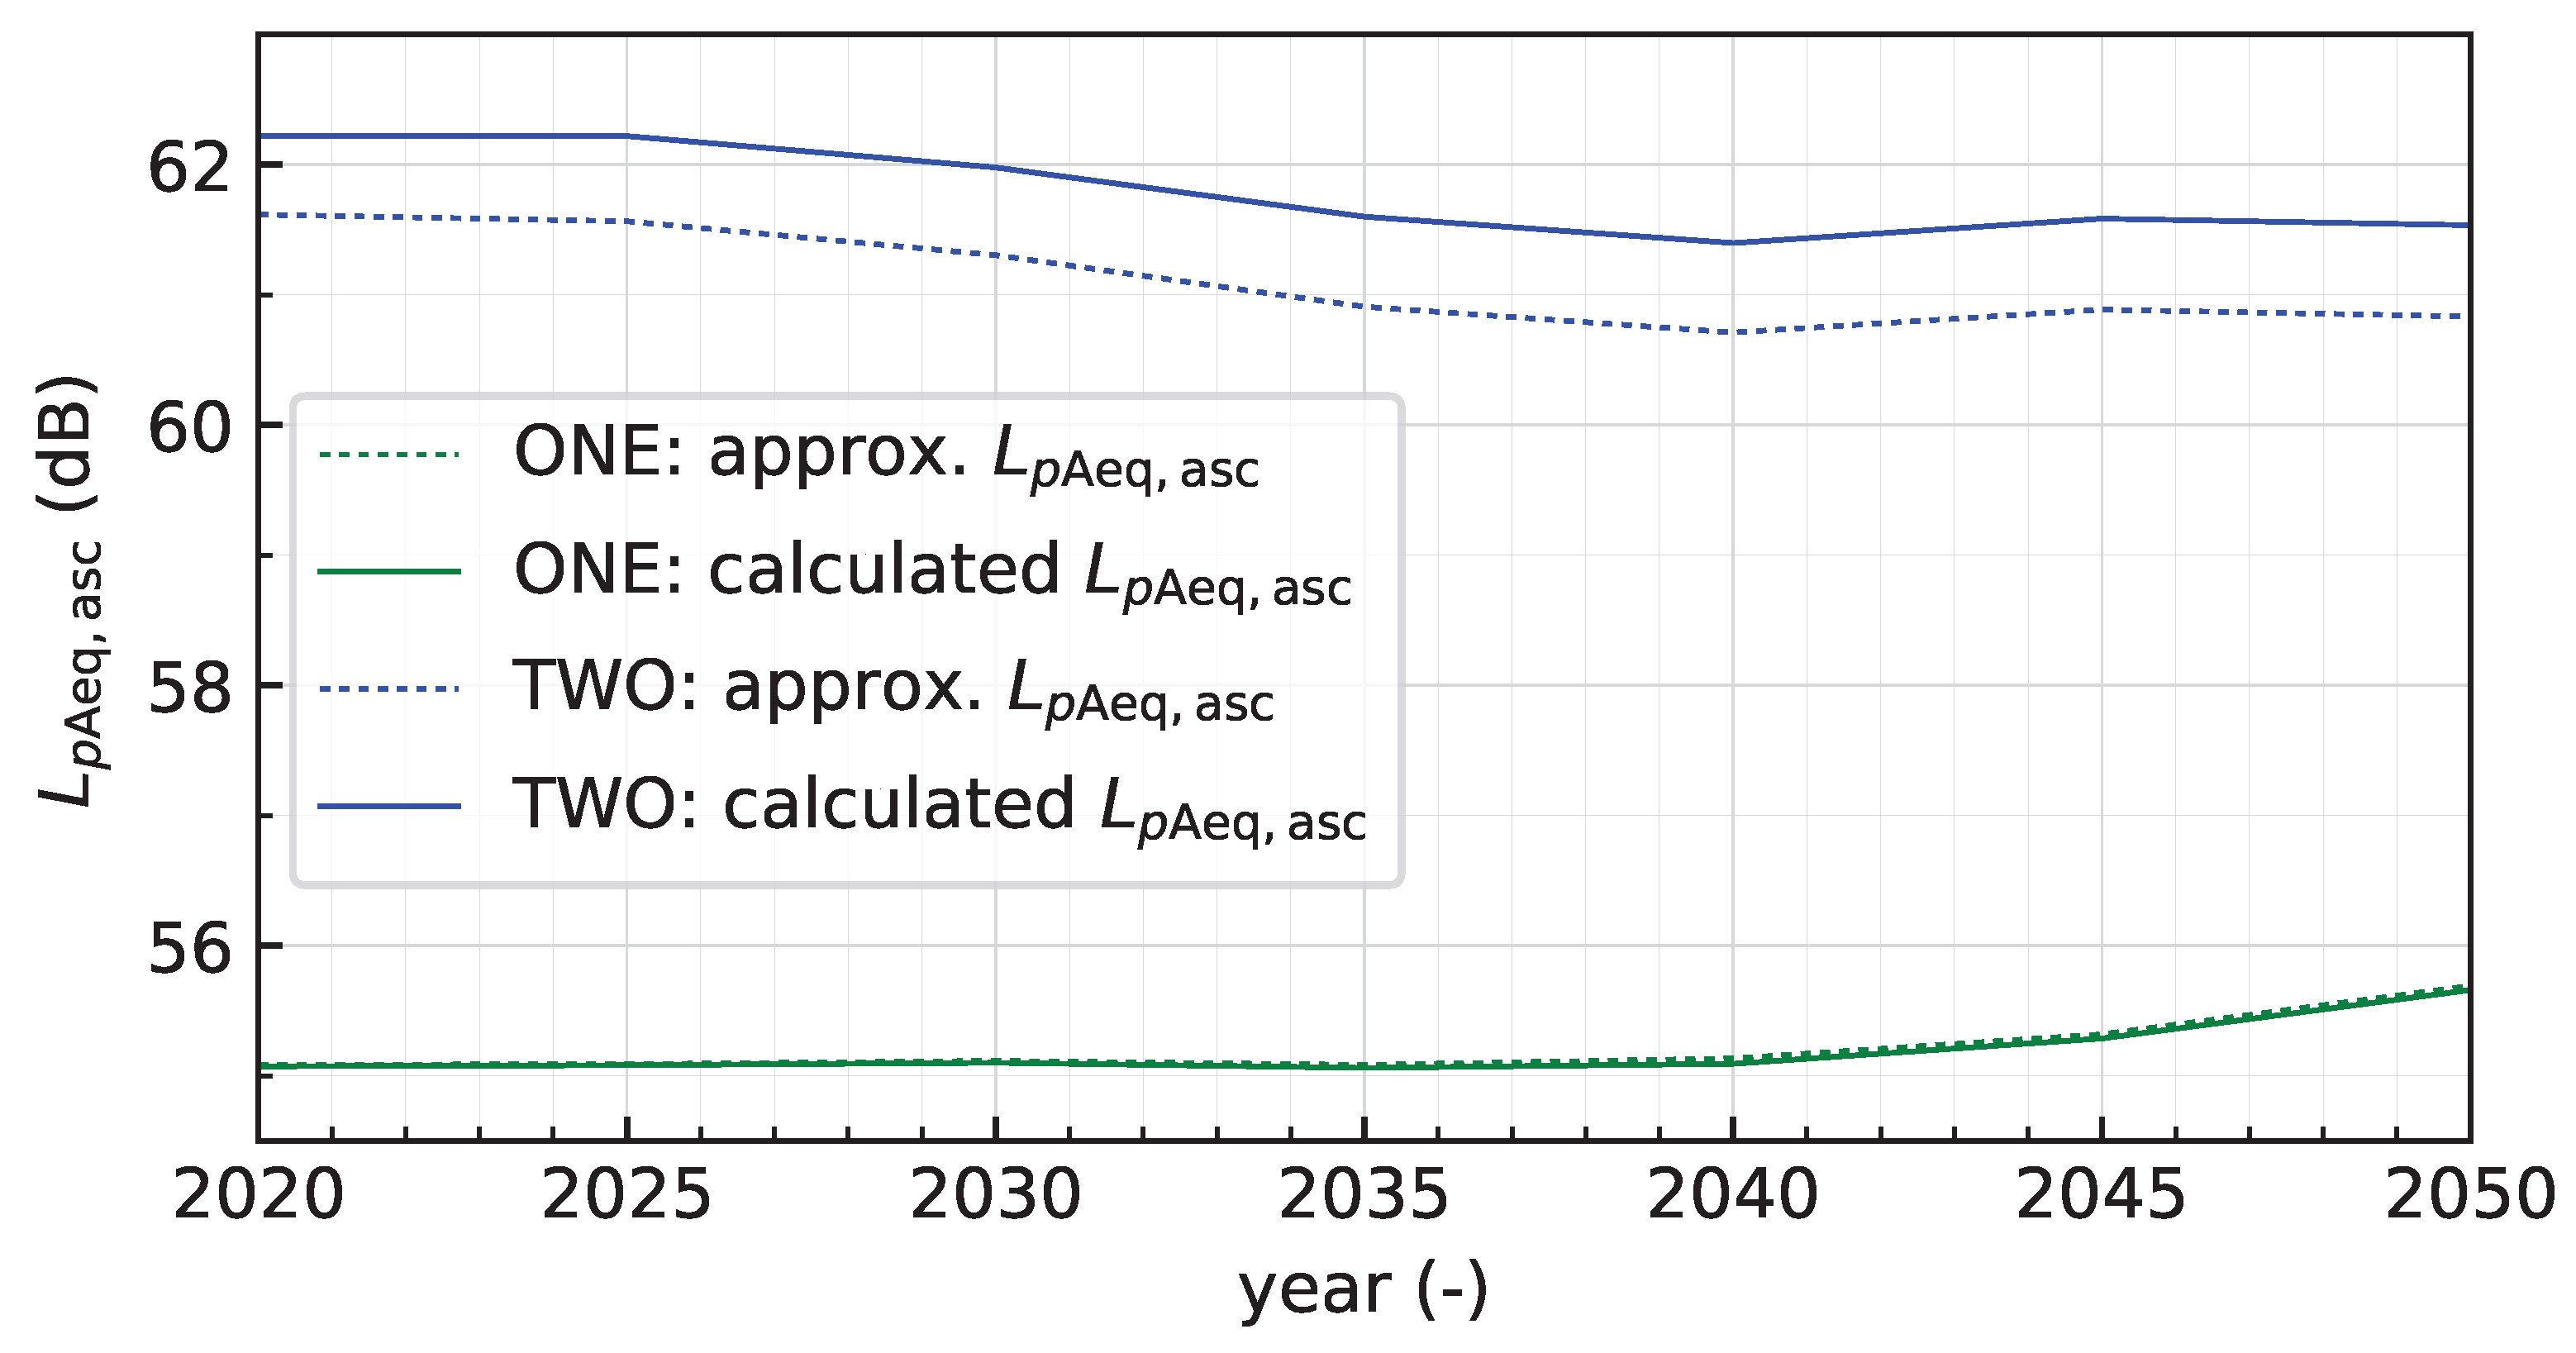
As a measure for noise impact, the temporal development of the approximated associated equivalent continuous sound level is shown in Figure 20. As expected, the associated can be approximated well at airport ONE due to its simple runway and route structure. At the airport TWO, however, there is an almost constant offset. The reason for this offset is similar to the effect described previously for complex airports. The relative development, however, matches well.

Figure 20.
Temporal development of the approximated and calculated associated from project FluiD-21 [] using Equation (23), i.e., with s, s (seconds in one year), and dB.
5.2.4. Relative Temporal Development of the Approximated Contour Areas
Probably most relevant for the application of the noise point concept is the approximation of the relative temporal development of the contour area. This temporal development can be assessed for different contour values. In Figure 21, the calculated and approximated relative developments of the 55.1 dB contour area (ONE) and the 62.2 dB contour area (TWO) are shown, which are the calculated and associated of the year 2020 (see Figure 20). The approximated relative development is based on Equation (30), i.e., . As can be seen from this figure, the relative temporal development of these contour areas is matched well by approximation. The maximum differences between the approximated and calculated changes in contour areas are about %.

Figure 21.
Relative temporal development of the approximated and calculated area for airport ONE and TWO from project FluiD-21 []. The approximated development is determined with the simplified Equation (30), i.e., . The shown contour areas are determined for the calculated , which is 55.1 dB for airport ONE and 62.2 dB for airport TWO.
5.2.5. Absolute Temporal Development of the Approximated Contour Areas
Using the described equations, the absolute contour areas can be approximated as well. Besides a simple area approximation using Equation (29), the benefit of applying an airport calibration with the first method described in Section 4.4.2 is demonstrated as well. In this case, the calibration is performed based on a reference calculation from the year 2020. The data used for calibration is shown in Figure 22.

Figure 22.
Calculated contour area plotted against for airport ONE and TWO from project FluiD-21 []. This graph allows the determination of the area for a given noise point sum at both of these airports. The simple approximation of is shown as a dashed line.
The calculated, approximated, and calibrated contour areas for both airports from project FluiD-21 for contour values of 57 dB, 60 dB, and 63 dB are shown in Figure 23. Overall, it can be seen that the absolute area can be approximated well for the ONE-airport even without additional calibration. For the TWO-airport, there is a deviation for the simple approximation of the contour area without calibration. With additional calibration, however, the contour areas are matched well, especially for the smaller areas at 60 dB and 63 dB. For 57 dB, the difference between calibrated and calculated area in the year 2050 is about 2 km2, i.e., about 3.6%.

Figure 23.
Calculated, approximated, and calibrated areas for airport ONE and TWO from project FluiD-21 [] for contour values of 57 dB, 60 dB, and 63 dB. The approximated area is determined via the simplified Equation (29), i.e., with s, s (seconds in one year), dB, and km2. The calibrated contour area is determined with the first method described in Section 4.4.2 via data from Figure 22 using the noise point sum.
5.2.6. Approximation of Noise Contours of Future Traffic Scenarios
In the previous part of this section, it was demonstrated that the noise point concept can be applied to assess airport noise and its development. Among others, it was shown that the noise impact in terms of the associated equivalent continuous sound level approximately changes with . Here, it is briefly demonstrated that noise contours of future traffic scenarios can be approximated with the same methodology. That is, by providing the calculated equivalent continuous sound levels of a traffic scenario on a grid, the equivalent continuous sound levels of a future traffic scenario at each grid point k can be approximated via
Figure 24 shows an example application based on airport TWO. In this example, the equivalent continuous sound levels of the year 2050 are approximated based on the levels of the year 2020 and the ratio of noise point sums, i.e., . These approximated levels are compared against the actual calculated levels of the year 2050. It is important to note that since the approximation is based on the year 2020, the characteristics of the year 2020 are inherently adapted to the approximation for the year 2050. As a result, differences in the approximated contour shapes compared to the calculated contour shapes are inevitable. Nonetheless, in areas where noise is dominated by departing aircraft (see north–west and south–east areas), the noise levels match well. In areas where noise is dominated by approaching aircraft (areas in straight extension to the runways), the approximated levels are underestimated. These differences could be reduced to some extent if the approach and departure contours are scaled separately and superpositioned afterwards. Comparing only the associated equivalent continuous sound level, for which the contour line is shown as dashed lines, the of the approximated contours is 61.47 dB and, of the calculated contours, it is 61.54 dB, i.e., the difference is only 0.07 dB.

Figure 24.
Difference between approximated and calculated contours of the TWO-airport in the year 2050, i.e., . The approximated levels were determined via . The dashed lines show the of the approximated contours (61.47 dB) and calculated contours (61.54 dB). Both deviate by only 0.07 dB.
In conclusion, it can be seen that the contour areas can be approximated well with some remaining, but explainable, differences. However, this demonstration is not a typical use case for the noise point concept.
6. Discussion
The presented noise point concept allows the approximation of the aircraft noise situation and the development of aircraft noise in the vicinity of any airport without requiring detailed noise calculations. With this concept, a noise equivalent value is assigned to each aircraft type or aircraft group, which is referred to as a noise point. More precisely, a noise point in this concept is the number of equivalent movements of the reference aircraft. For example, a noise point of 5 would mean that one movement of this aircraft can be replaced by five movements of a selected reference aircraft. If the noise points at an airport are summed according to the number of movements, the noise point sum gives an approximation of the noise situation. The concept is primarily useful when local details are less relevant, e.g., for the global assessment of airport noise developments or for the analyses of different what-if scenarios. The concept of noise points can be applied without profound expertise of aircraft noise, thus making it easily accessible to various stakeholders like economic analysts, policy makers, airport operators, or airlines.
Naturally, there exist different methodologies for determining noise points, e.g., determination based on certification noise levels or from integrating sound intensity over a defined area. All noise point or related definitions are appropriate as long as they fulfill their intended purpose with regard to their application. For the development of the herein presented noise point concept, the purpose was to adequately model the development of a selected noise contour area. For this purpose, noise points in this concept are determined based on the noise level, which results in a specific reference contour area.
The methodology for the determination of these noise points was presented in detail. In this study, noise points were determined for the aircraft groups of the proposed AzB21 database [], and respective ready-to-use tables were provided. Note that the noise points of future aircraft types (see, e.g., [,,]) and other aircraft groups can easily be added to the already provided noise points. Similarly, noise points can be determined for other aircraft noise calculation methods as well, e.g., for ECAC Doc 29 [] or for DIN 45689 [,].
Based on the noise point definition, different quantities can be determined for traffic scenario analyses. The noise point sum is already a good indicator of noise at an airport. By choosing the dominant aircraft group S3_M130_T2_N7 (which covers, e.g., A320 and B737) as reference aircraft, the noise point sum lies in the same order of magnitude as the number of movements. As such, the ratio of the noise point sum to the number of movements indicates whether the fleet mix is comparatively loud or quiet compared to a traffic scenario with only the reference aircraft. Furthermore, the noise point sum also allows the approximation of the “associated equivalent continuous sound level” , for which the contour area equals a reference contour area. Based on this noise level and the associated reference contour area, other contour areas can be approximated as well if the growth of contour area with the noise level is known. For a quick and simple assessment, it can be assumed that the contour area grows linear with sound intensity. To further increase the accuracy of the results and if a calculation at the airport in focus already exists, an airport calibration can be performed to determine how the contour area changes with the noise level for this particular airport.
The application of the concept was demonstrated at selected airports, and approximated and associated levels and contour areas were compared with those from detailed noise calculations. In general, the comparisons show good agreement between the calculated and approximated absolute values at airports with simple layouts, i.e., single runway and mostly straight routes. If airport calibration is performed, absolute values can also be predicted similarly well for more complex airports. Considering the relative developments of the values, the concept provides a close representation of the actual development of both simple and complex airports, even without airport calibration. Potentially, the difference between approximated and calculated values increases if the routes and distribution of movements changes significantly. Also, if much larger or smaller contour areas than the reference contour area are analyzed, the differences may increase. However, it was demonstrated that airport calibration can reduce these differences significantly. For the airport with two runways analyzed in this study, the differences between calculated and approximated contour area remain below 3.6% over a generic 30-year forecast, even for contour areas exceeding twice the size of the reference contour area.
The presented noise point concept and the given noise points are applied in the DLR project DEPA-ext to assess potential aviation noise developments in general and at selected airports. In this project, traffic scenarios for airports up to the year 2070 will be investigated. With the presented noise point concept, the impact on noise can be assessed together with the impact on the environment, economy, and society. These traffic scenarios will also include future aircraft types with additional low-noise technology and new engine types. For those new aircraft types, noise points must be determined accordingly, e.g., with scientific noise prediction tools such asDLR’s Parametric Aircraft Noise Analysis Module (PANAM) [] or NASA’s Aircraft Noise Prediction Program (ANOPP) []. Finally, the aim is to establish the presented noise point concept not only in the DLR but also more broadly, particularly throughout Germany.
Author Contributions
Conceptualization, J.B. and R.S.; methodology, J.B. and R.S.; software, J.B.; validation, J.B.; formal analysis, J.B. and R.S.; writing—original draft preparation, J.B.; writing—review and editing, R.S.; visualization, J.B. All authors have read and agreed to the published version of the manuscript.
Funding
This research received no external funding.
Data Availability Statement
Data is contained within this article.
Acknowledgments
We would like to thank F. Morschek (DLR-FL), W. Grimme (DLR-LV), and M. Gelhausen (DLR-LV) for their close collaboration in projects FluiD-21 and ELK. Without the projects’ data, the verification would not have been possible.
Conflicts of Interest
The authors declare no conflicts of interest.
Abbreviations
The following abbreviations are used in this manuscript:
AIRNAF | Aircraft Noise Analysis Framework, DLR; |
ANOPP | Aircraft Noise Prediction Program, NASA; |
AzB | German “Instructions on the Calculation of Noise Protection Areas”; |
AzB21 | Proposed revised database for the German AzB method; |
BER | IATA code for Berlin Brandenburg airport, Germany; |
CGN | IATA code for Köln/Bonn airport, Germany; |
DEPA | DLR-projects: Development Pathways for Aviation; |
DLR | German Aerospace Center; |
DUS | IATA code for Düsseldorf airport, Germany; |
ECAC | European Civil Aviation Conference; |
ELK | DLR-project: “EmissionslandKarte” (emissions’ map); |
EU | European Union; |
FAA | Federal Aviation Administration; |
FluiD21 | DLR-project: “Entwicklung der Fluglärmsituation in Deutschland im 21. Jahrhundert” |
(Development of aircraft noise in Germany in the 21st century); | |
FRA | IATA code for Frankfurt airport, Germany; |
HAJ | IATA code for Hannover airport, Germany; |
HAM | IATA code for Hamburg airport, Germany; |
IATA | International Air Transport Association; |
LEJ | IATA code for Leipzig airport, Germany; |
MTOM | Maximum takeoff mass; |
MUC | IATA code for München airport, Germany; |
NUE | IATA code for Nürnberg airport, Germany; |
ONE | Code for generic airport with one runway; |
PANAM | Parametric Aircraft Analysis Module, DLR; |
PLATON | Flight plan to noise process chain, DLR; |
STR | IATA code for Stuttgart airport, Germany; |
TWO | Code for generic airport with two parallel runways; |
WHO | World Health Organization. |
Nomenclature
A | Contour area | km2 |
Reference contour area (here: 24.2 km2) | km2 | |
Effective perceived noise level | dB | |
Day-Evening-Night noise level | dB | |
A-weighted single-event sound pressure level | dB | |
Associated A-weighted single-event sound pressure level, i.e., the level for which the contour area equals | dB | |
Reference associated A-weighted single-event sound pressure level, i.e., the level for which the contour area of the reference aircraft group equals | dB | |
Energetically averaged A-weighted single-event sound pressure level | dB | |
A-weighted equivalent continuous sound level | dB | |
Associated A-weighted equivalent continuous sound level | dB | |
Corrective term used for airport calibration | dB | |
Penalty for time-of-day t | dB | |
m | Base of the exponential function describing the approximate change of contour area with change of noise level | - |
Fitted base m used for airport calibration | - | |
N | Number of movements | - |
Number of movements of aircraft group g | - | |
Equivalent number of movements | - | |
Noise point of aircraft group g | - | |
Noise point sum | - | |
Ratio of noise point sum to the total number of movements | - | |
q | Halving parameter | - |
T | Time period, e.g., one year | s |
Reference time of 1s | s | |
Total sound exposure level | dB | |
Total day evening night level | dB | |
Weighting factor for time-of-day t (equivalent to the penalty ) | - |
References
- Airbus Global Market Forecast 2025. Available online: https://www.airbus.com/en/products-services/commercial-aircraft/global-market-forecast (accessed on 7 July 2025).
- Boeing Commercial Market Outlook 2025–2044. Available online: https://www.boeing.com/content/dam/boeing/boeingdotcom/market/assets/downloads/2025-cmo-executive-summary.pdf (accessed on 7 July 2025).
- Embraer Market Outlook 2025. Available online: https://www.embraer.com/media-center/en/?mediatype=NEWS & detail=19679-Embraer-Publishes-Commercial-Aviation-Global-Market-Outlook (accessed on 14 October 2025).
- Joint ACI World-ICAO Passenger Traffic Report, Trends, and Outlook. Available online: https://aci.aero/2025/01/28/joint-aci-world-icao-passenger-traffic-report-trends-and-outlook/ (accessed on 7 July 2025).
- European Commission. Flightpath 2050—Europe’s Vision for Aviation: Maintaining Global Leadership and Serving Society’s Needs; European Union: Luxembourg, 2011. [Google Scholar] [CrossRef]
- World Health Organization. Environmental Noise Guidelines for the European Region; WHO: Geneva, Switzerland, 2018. [Google Scholar]
- International Civil Aviation Organization. Global Trends in Aircraft Noise. Available online: https://www.icao.int/environmental-protection/global-trends-aircraft-noise (accessed on 14 October 2025).
- Leipold, A.; Baier, F.; Bauder, U.; Blinstrub, J.; Buchtal, K.A.; Campillo Borras, E.; Clococeanu, M.; Eckel, G.; Ennen, D.; Flüthmann, N.; et al. Development Pathways for Aviation up to 2070—Study Report; German Aerospace Center: Cologne, Germany, 2025. [Google Scholar]
- German Aerospace Center. DEPA-ext - Exploratory Future Scenarios for a Sustainable Aviation System of Tomorrow. Available online: https://www.dlr.de/en/lv/research-transfer/projects/ongoing-projects/depa-ext (accessed on 7 October 2025).
- Bundesministerium für Umwelt, Naturschutz und Reaktorsicherheit. Bekanntmachung der Anleitung zur Datenerfassung über den Flugbetrieb (AzD) und der Anleitung zur Berechnung von Lärmschutzbereichen (AzB) (Instructions on the Acquisition of Data on Flight Operations (AzD) and the Calculation of Noise Protection Areas (AzB); Bundesministerium für Umwelt, Naturschutz und Reaktorsicherheit: Berlin, Germany, 2008. [Google Scholar]
- Blinstrub, J.; Isermann, U.; Raitor, T.; Schmid, R. Überprüfung und Verbesserung der Berechnungsverfahren beim Fluglärm; Texte 93/2021; Umweltbundesamt (UBA): Dessau-Roßlau, Germany, 2021. [Google Scholar]
- Schmid, R.; Blinstrub, J.; Raitor, T.; Grimme, W.; Gelhausen, M.; Ehmer, H.; Claßen, A.; Müller, L.; Kurz, J.; Schmitz, G.; et al. Entwicklung der Fluglärmsituation in Deutschland im 21. Jahrhundert—FLUID-21—Wissenschaftlicher Abschlussbericht; German Aerospace Center: Göttingen, Germany, 2023. [Google Scholar]
- White, S.; Ollerhead, J.B.; Cadoux, R.E.; Smith, M.J.T. ERCD Report 0205—Quota Count Validation Study: Noise Measurements and Analysis; Civil Aviation Authority: London, UK, 2003. [Google Scholar]
- Rhodes, D.P.; Hopewell, H. Present and Future Noise Exposure at UK Regional Airports; Civil Aviation Authority: London, UK, 2001. [Google Scholar]
- Michelsen, N.; Borglund, P.; Plovsing, B.; Svane, C. The TDENL-Method (Total Day Evening Night Level) - A Tool for Airport Noise Control. In Proceedings of the INTER-NOISE and NOISE-CON Congress and Conference Proceedings, InterNoise88, Avignon, France, 30 August 1988; Institute of Noise Control Engineering: Wakefield, MA, USA, 1988; pp. 891–1322. [Google Scholar]
- European Union. Directive 2002/49/EC of the European Parliament and of the Council of 25 June 2002 Relating to the Assessment and Management of Environmental Noise; European Union: Luxembourg, 2002. [Google Scholar]
- Bundesministerium für Umwelt, Naturschutz und Reaktorsicherheit. Vierunddreißigste Verordnung zur Durchführung des Bundes-Immissionsschutzgesetzes (Verordnung über die Lärmkartierung); Version promulgated on 6 March 2006, BGBl. I; Bundesministerium für Verkehr, Bau und Stadtentwicklung: Berlin, Germany, 2006; p. 516. [Google Scholar]
- Grimme, W.; Schmid, R. Noise points as an instrument to measure (and limit) noise exposure—Empirical findings from Europe 2015–2020. Transp. Res. Procedia 2023, 75, 270–278. [Google Scholar] [CrossRef]
- Federal Aviation Administration Office of Environment and Energy. AEM Aera Equivalent Method Version 2c SP2 User’s Guide; FAA: Washington, DC, USA, 2018. [Google Scholar]
- Bundesministerium für Umwelt, Naturschutz und Reaktorsicherheit. Gesetz zum Schutz gegen Fluglärm (Act for Protection against Aircraft Noise); Version promulgated on 31 October 2007, BGBl. I; Bundesministerium für Umwelt, Naturschutz und Reaktorsicherheit: Berlin, Germany, 2007; p. 2550. [Google Scholar]
- European Civil Aviation Conference. ECAC.CEAC Doc 29—Report on Standard Method of Computing Noise Contours around Civil Airports, 4th ed.; European Civil Aviation Conference: Neuilly-sur-Seine, France, 2016. [Google Scholar]
- Schmid, R.; Blinstrub, J.; Morschek, F.; Kuenz, A.; Gelhausen, M.; Berster, P.; Schiller, A. Moderne Fluglärmberechnung—Die DLR-Prozesskette PLATON. In Proceedings of the DAGA2024, Hannover, Germany, 18–21 March 2024. [Google Scholar]
- Righi, M.; Schulz, A. Impulsprojekt ELK (EmissionsLandKarte) - Inhaltlicher Abschlussbericht; German Aerospace Center: Oberpfaffenhofen, Germany, 2025. [Google Scholar]
- Isermann, U.; Matschat, K.; Müller, E.-A.; Nitsche, V. The Effect of Air Traffic Increase and Phasing-Out of Stage 2 Aircraft on the Noise Exposure around Airports. In Proceedings of the INTER-NOISE and NOISE-CON Congress and Conference Proceedings, InterNoise89, Newport Beach, CA, USA, 4 December 1989; Institute of Noise Control Engineering: Wakefield, MA, USA, 1988; pp. 543–1024. [Google Scholar]
- Bertsch, L.; Pott-Pollenske, M.; Wienke, F.; Kurz, J.; Delfs, J. Retrofit Measures for Aircraft Noise Reduction: Simulation Benchmark and Impact Assessment. J. Aircr. 2025, 62, 191–206. [Google Scholar] [CrossRef]
- Bertsch, L.; Nöding, M.; Jaron, R.; Plohr, M. Contribution Toward Single-Event and Scenario Noise Assessment of Supersonic Business Jets. J. Aircr. 2025, 1–22. [Google Scholar] [CrossRef]
- Guo, Y.; Burley, C.; Thomas, R. On Noise Assessment for Blended Wing Body Aircraft. In Proceedings of the 52nd Aerospace Sciences Meeting, National Harbor, MD, USA, 14 January 2014. [Google Scholar] [CrossRef]
- DIN 45689-1:2020-11; Acoustics—Determination of Aircraft Noise Immission at Airports—Part 1: Calculation Method. DIN Media: Berlin, Germany, 2020. [CrossRef]
- DIN 45689-2:2025-07—Entwurf; Acoustics—Determination of Aircraft Noise Exposure at Airfields—Part 2: Evaluation and Generation of Additional Input Data for Calculation—Trajectory Data and Data Acquisition System. DIN Media: Berlin, Germany, 2025. [CrossRef]
- Bertsch, L. Noise Prediction within Conceptual Aircraft Design; Forschungsbericht 2013-5; German Aerospace Center: Göttingen, Germany, 2013. [Google Scholar] [CrossRef]
- Lopes, L.V.; Burley, C.L. ANOPP2 Users Manual; Technical Report NASA/TM2016219342; NASA: Houston, TX, USA, 2016. [Google Scholar]
Disclaimer/Publisher’s Note: The statements, opinions and data contained in all publications are solely those of the individual author(s) and contributor(s) and not of MDPI and/or the editor(s). MDPI and/or the editor(s) disclaim responsibility for any injury to people or property resulting from any ideas, methods, instructions or products referred to in the content. |
© 2025 by the authors. Licensee MDPI, Basel, Switzerland. This article is an open access article distributed under the terms and conditions of the Creative Commons Attribution (CC BY) license (https://creativecommons.org/licenses/by/4.0/).