Article

Experimental and Machine Learning-Based Investigation on Forced Convection Heat Transfer Characteristics of Al2O3–Water Nanofluid in a Rotating Hypergravity Condition

1
China Aviation Life-Support Research Institute, Xiangyang 441000, China
2
School of Aeronautics, Chongqing Jiaotong University, Chongqing 400074, China
3
Chongqing Key Laboratory of Green Aviation Energy and Power, Green Aviation Technology Research Institute, Chongqing 401135, China
4
Key Laboratory of Aircraft Environment Control and Life Support, Ministry of Industry and Information Technology, Nanjing University of Aeronautics and Astronautics, Nanjing 210016, China
*
Author to whom correspondence should be addressed.
Zufen Luo and Gen Li contributed equally to this work as co-first authors.
Aerospace 2025, 12(10), 931; https://doi.org/10.3390/aerospace12100931 (registering DOI)
Submission received: 27 August 2025 / Revised: 6 October 2025 / Accepted: 10 October 2025 / Published: 15 October 2025
(This article belongs to the Special Issue Advanced Thermal Management in Aerospace Systems)

Abstract

This study experimentally investigates single-phase forced convection heat transfer and flow characteristics of Al2O3-water nanofluids under rotating hypergravity conditions ranging from 1 g to 5.1 g. While nanofluids offer enhanced thermal properties for advanced cooling applications in aerospace and rotating machinery, their performance under hypergravity remains poorly understood. Experiments employed a custom centrifugal test rig with a horizontal test section (D = 2 mm, L = 200 mm) operating at constant heat flux. Alumina nanoparticles (20–30 nm) were dispersed in deionized water at mass fractions of 0.02–0.5 wt%, with stability validated through transmittance measurements over 72 h. Heat transfer coefficients (HTC), Nusselt numbers (Nu), friction factors (f), and pressure drops were measured across Reynolds numbers from 500 to 30,000. Results demonstrate that hypergravity significantly enhances heat transfer, with HTC increasing by up to 40% at 5.1 g compared to 1 g, most pronounced at the transition from 1 g to 1.41 g. This enhancement is attributed to intensified buoyancy-driven secondary flows quantified by increased Grashof numbers and modified particle distribution. Friction factors increased moderately (15–25%) due to Coriolis effects and enhanced viscous dissipation. Optimal performance occurred at 0.5 wt% concentration, effectively balancing thermal enhancement against pumping penalties. Random forest (RF) and eXtreme gradient boosting (XGBoost) achieved R2 = 0.9486 and 0.9625 in predicting HTC, respectively, outperforming traditional correlations (Gnielinski: R2 = 0.9124). These findings provide crucial design guidelines for thermal management systems in hypergravity environments, particularly for aerospace propulsion and centrifugal heat exchangers, where gravitational variations significantly impact cooling performance.

1. Introduction

The rapid advancement of aerospace technology and high-performance thermal management systems has created an urgent need for cooling solutions that can operate effectively under extreme and variable gravitational conditions [1,2,3]. Traditional heat transfer fluids often fail to meet the stringent requirements of modern applications, particularly in environments where gravitational forces deviate significantly from Earth’s standard gravity [4,5]. This limitation has driven researchers to explore innovative working fluids and advanced predictive methods that can accurately capture complex heat transfer phenomena across diverse operating conditions.
Nanofluids, engineered colloidal suspensions of nanoparticles in conventional base fluids, have emerged as a promising solution for enhanced thermal management applications [6,7]. The incorporation of nanoparticles, typically at volume fractions below 5%, can substantially improve thermal conductivity and convective heat transfer coefficients through multiple mechanisms, including Brownian motion, thermophoresis, and the formation of nanolayers at particle-fluid interfaces [8,9,10]. Adio et al. [11] reviewed nanofluids flow boiling and convective heat transfer in microchannels and tubes over the past decade, and found that hybrid nanofluids enhanced boiling heat transfer by 25–45%, with convective coefficients improving by 20–30% in laminar flows at 2–5% concentrations. Ghasemi and Ranjbar [12] studied entropy generation in natural and forced convection of Al2O3-water nanofluid flow in tubes. It was found that nanofluids reduced entropy generation by 10–25% in forced convection, improving overall efficiency at higher volume fractions. Kamran and Qayoum [13] examined the effect of silver doping on forced convection heat transfer of Fe3O4 and Ag-Fe3O4 nanofluids in a heated duct. The results indicated that hybrid nanofluids enhanced thermal performance by 25–40%, with silver doping reducing pressure drops while increasing Nusselt numbers by 20%. Nazari et al. [14] investigated fluid flow and heat transfer of nanofluids inside helical tubes at constant wall temperature. They found that alumina-water nanofluids increased convective heat transfer by 15–35%, with helical geometry amplifying enhancements by 10–20% compared to straight tubes.
Despite extensive research on nanofluid heat transfer at standard gravity, the behavior of these engineered fluids under hypergravity conditions remains poorly understood. Hypergravity, characterized by gravitational accelerations exceeding 1 g, is commonly encountered in rotating machinery, centrifugal pumps, aircraft maneuvers, and aerospace propulsion systems during high-speed maneuvers, intensifying the interplay among buoyancy, inertia, and nanoparticle dynamics [15]. This can trigger stronger secondary flows, redistribute particles, and alter near-wall transport—effects that conventional 1 g-based correlations fail to anticipate [16]. Building on this limitation, predicting nanofluid performance becomes even more challenging when multiple interdependent variables and nonlinear couplings are present. Classical empirical correlations—Dittus-Boelter [17], Gnielinski [18], and Sieder-Tate [19]—offer physical clarity and simplicity but are constrained by fixed functional forms and assumptions of similarity across operating conditions. When applied to variable-gravity environments or non-conventional working fluids, these models can incur significant errors and require laborious re-fitting for each scenario, often without covering the full parameter space [20]. Consequently, there is a clear need for flexible, generalizable predictors.
Recent advances in machine learning provide such a pathway: data-driven methods, especially ensemble learning algorithms like Random Forest and XGBoost, excel at capturing nonlinear relationships and high-order interactions beyond the reach of traditional correlations [21,22,23]. Crucially, these models learn directly from experimental data, enabling accurate prediction even when governing physics are partially characterized or involve emergent, multiscale phenomena [24]. This motivates a hybrid strategy that couples targeted experimentation under hypergravity with ML-based modeling to produce robust, transferable heat transfer predictions. Godasiaei and Chamkha [25] studied TiO2, Al2O3, and Cu–water nanofluids in turbulent flow using machine learning, and they concluded that the Tree Regression achieved 94% accuracy, outperforming XGBoost and support vector regression (SVR) (both 91%). The results demonstrate ML’s superiority over traditional methods for nanofluid heat transfer prediction. Dong et al. [26] employed an artificial neural network (ANN) multilayer perceptron model to optimize mixed convection heat transfer in an elliptical enclosure with a rotating cylinder. They trained a neural network that subsequently produced 700 high-accuracy data points, and found that 0.03 vol.% MWCNT–water nanofluid enhanced the average Nusselt number by up to 46%, with the ANN effectively identifying optimal parameters for heat transfer maximization. Mishra et al. [27] studied Al2O3-Cu-CNT/water nanofluid flow across wedge, plate and cone geometries with thermal radiation. Using an ANN trained on numerical data, they found that cone geometry achieved the highest Nusselt number, with model accuracy (MSE < 0.04) demonstrating ML’s effectiveness for complex thermofluidic systems.
Based on previous literature review, the present study tackles these knowledge gaps through a rigorous, end-to-end investigation of single-phase forced convection in Al2O3–water nanofluids under both normal and hypergravity, spanning 1 g to 5.1 g. The selected gravity range (1 g to 5.1 g) was designed to emulate hypergravity conditions typical of high-speed aerospace maneuvers (2–5 g sustained load factors in aircraft), centrifugal machinery operation (2–4 g at impeller tips), and rocket launch phases (2–5 g during atmospheric flight), while aligning with the operational limits of the centrifugal rotating platform to facilitate precise experimental control and ensure structural integrity, safety, and measurement stability. A custom-built centrifugal facility was employed that decouples and precisely controls the g-level while imposing a constant heat flux boundary in a horizontal tube, thereby isolating gravity effects from thermal and geometric confounders. The experimental matrix systematically maps the roles of gravitational acceleration, nanoparticle mass concentration, and Reynolds number on the convective heat transfer coefficient, Nusselt number, and friction factor across laminar-to-turbulent regimes. Beyond measurement, the study advances prediction. The state-of-the-art machine learning model was developed and validated to forecast nanofluid heat transfer under variable gravity, capturing nonlinear couplings among g-level, flow conditions, and particle loading that elude classical correlations. This dual-pronged approach—high-fidelity experimentation paired with data-driven modeling—yields a robust, generalizable framework for design and optimization of thermal systems operating in extreme acceleration environments, with direct implications for rotating machinery and aerospace thermal management.

2. Experimental System and Reliability Validation

The detailed experimental setup for examining nanofluid convection heat transfer under varying gravity levels can be found in Li et al. [28], which primarily comprised a centrifugal accelerating device, a flow circulation system, and a data acquisition and control system.

2.1. Centrifugal Accelerating Device

As illustrated in Figure 1, by modulating the motor’s electrical frequency, the turntable generated the necessary centrifugal acceleration to replicate hypergravity environments, where elevated rotation speeds directly correlated with higher gravity levels. The selected gravity range (1 g to 5.1 g) was designed to emulate hypergravity conditions typical of high-speed aerospace maneuvers, while aligning with the operational limits of the centrifugal rotating platform to facilitate precise experimental control. During operation, the electric brushes ensured a continuous power supply to the equipment mounted on the turntable.

2.2. Flow Circulation System

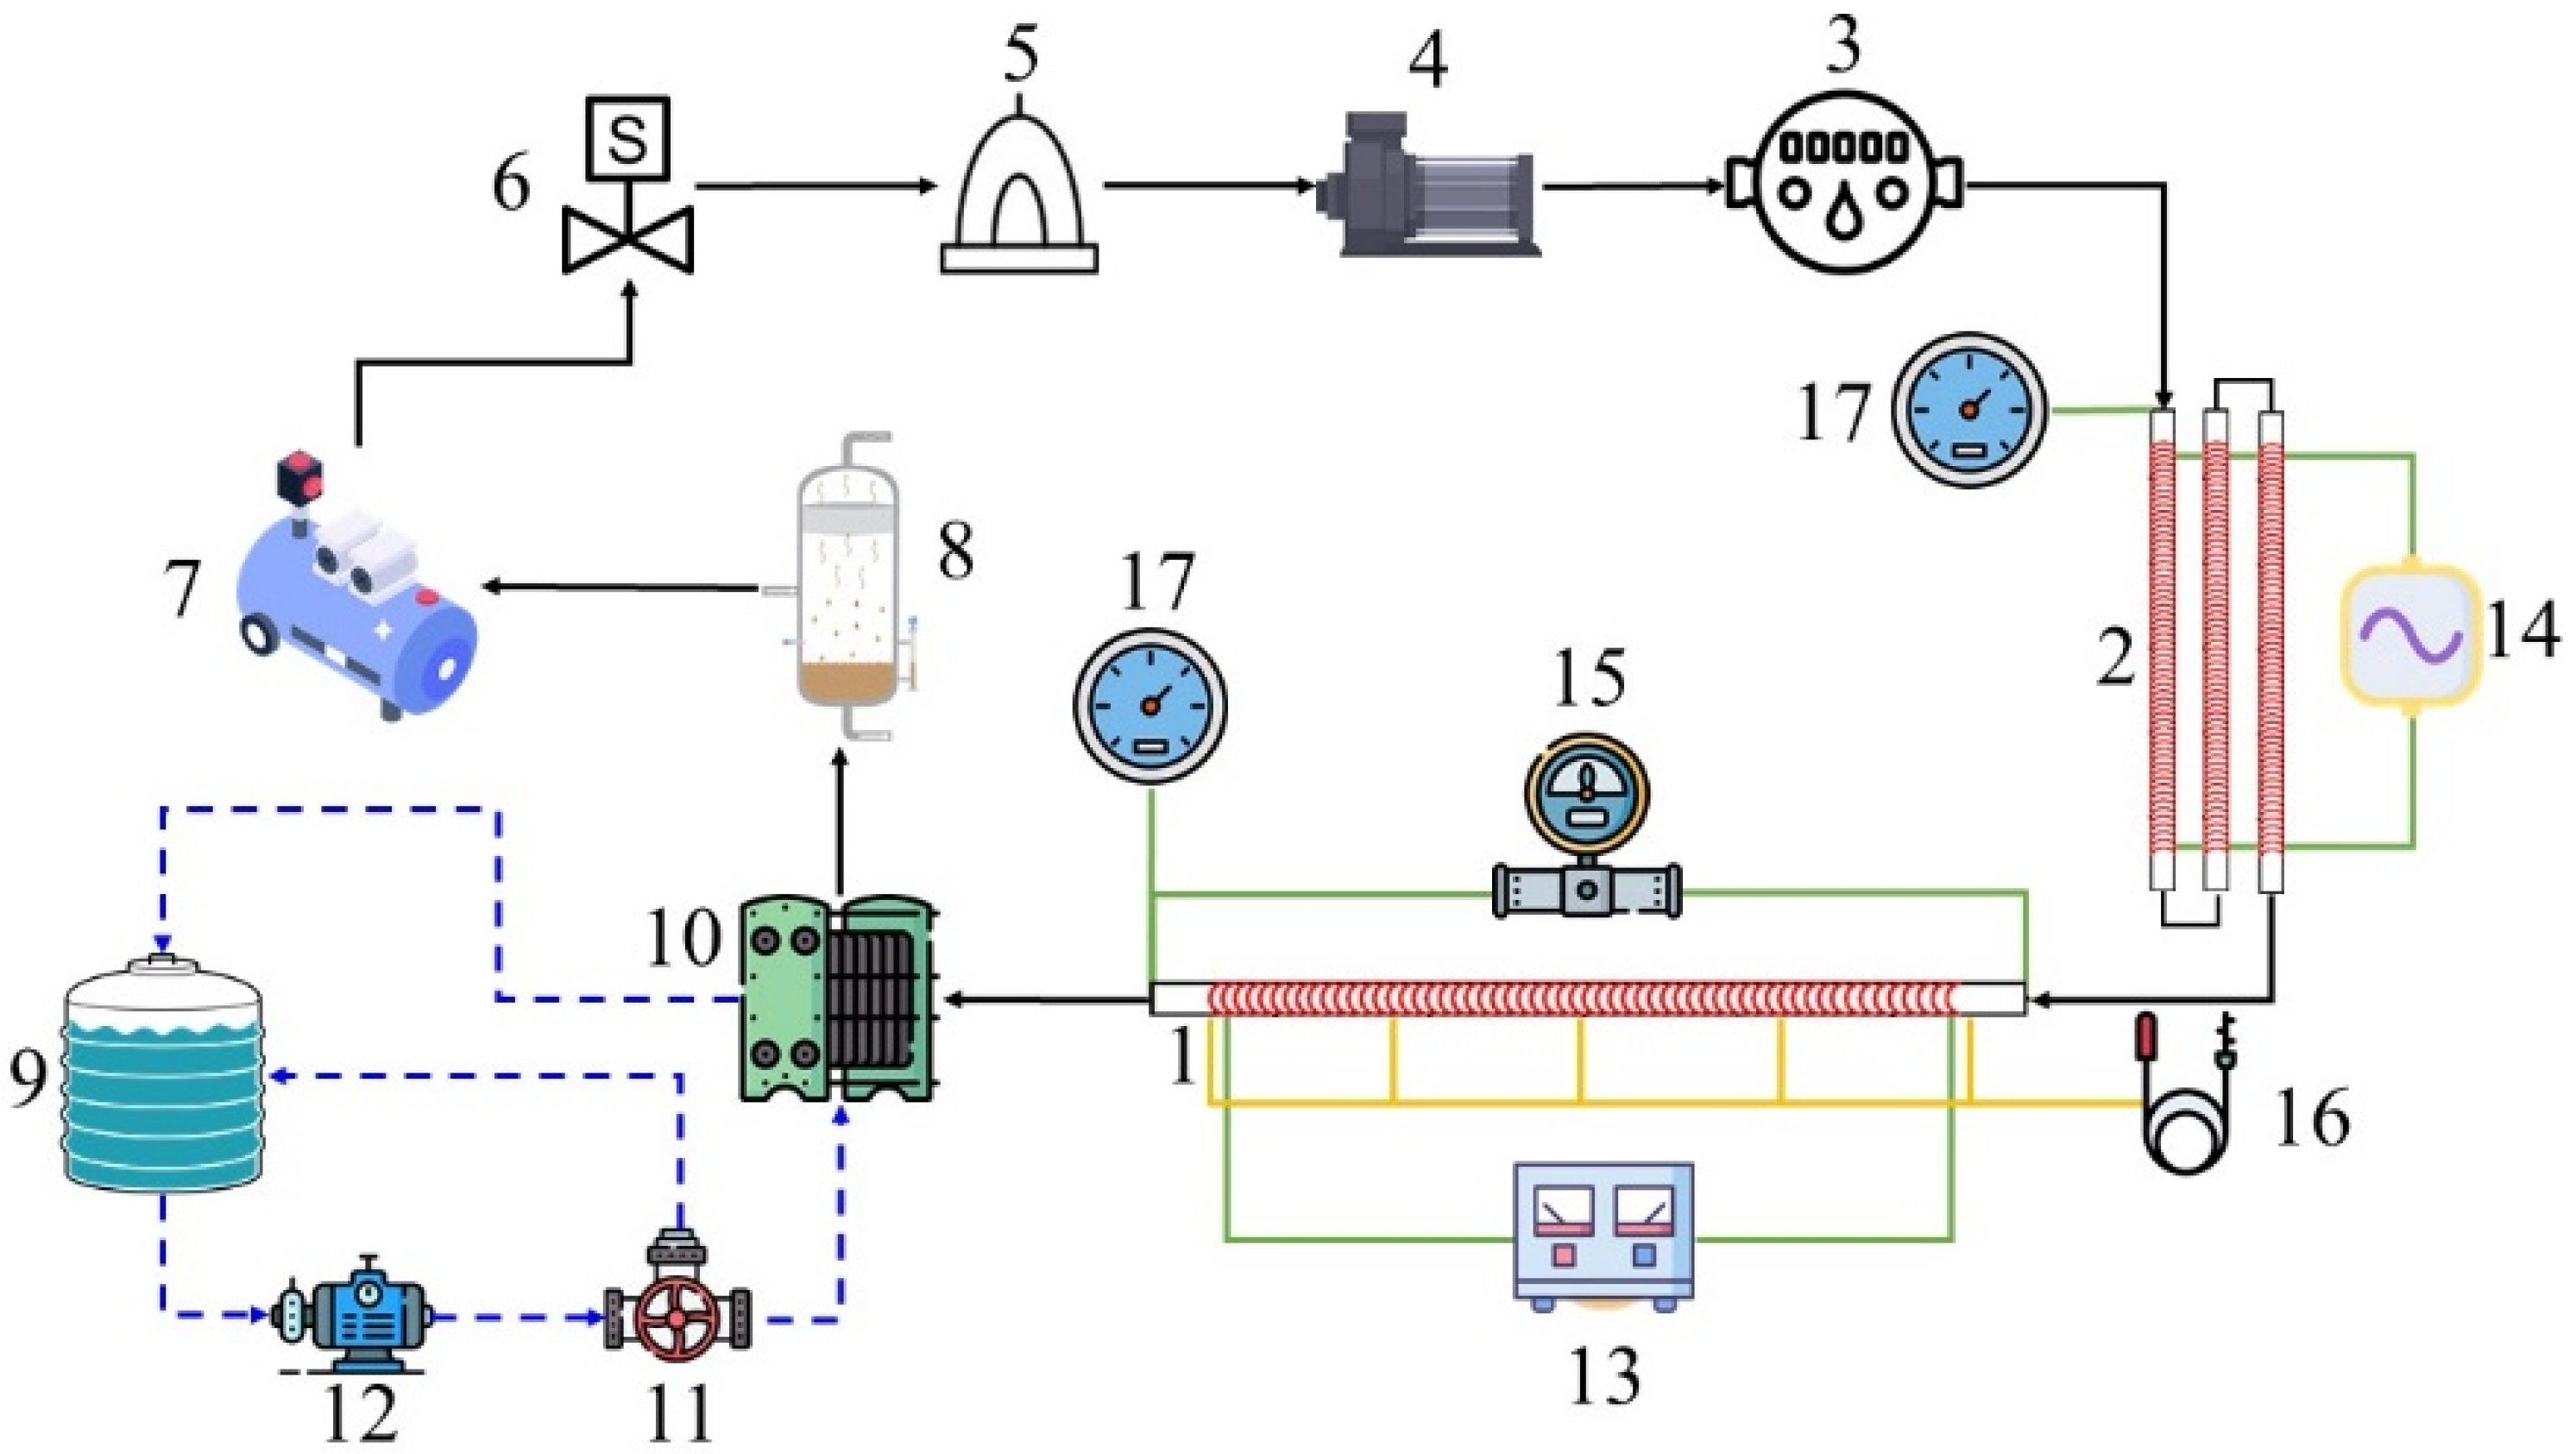
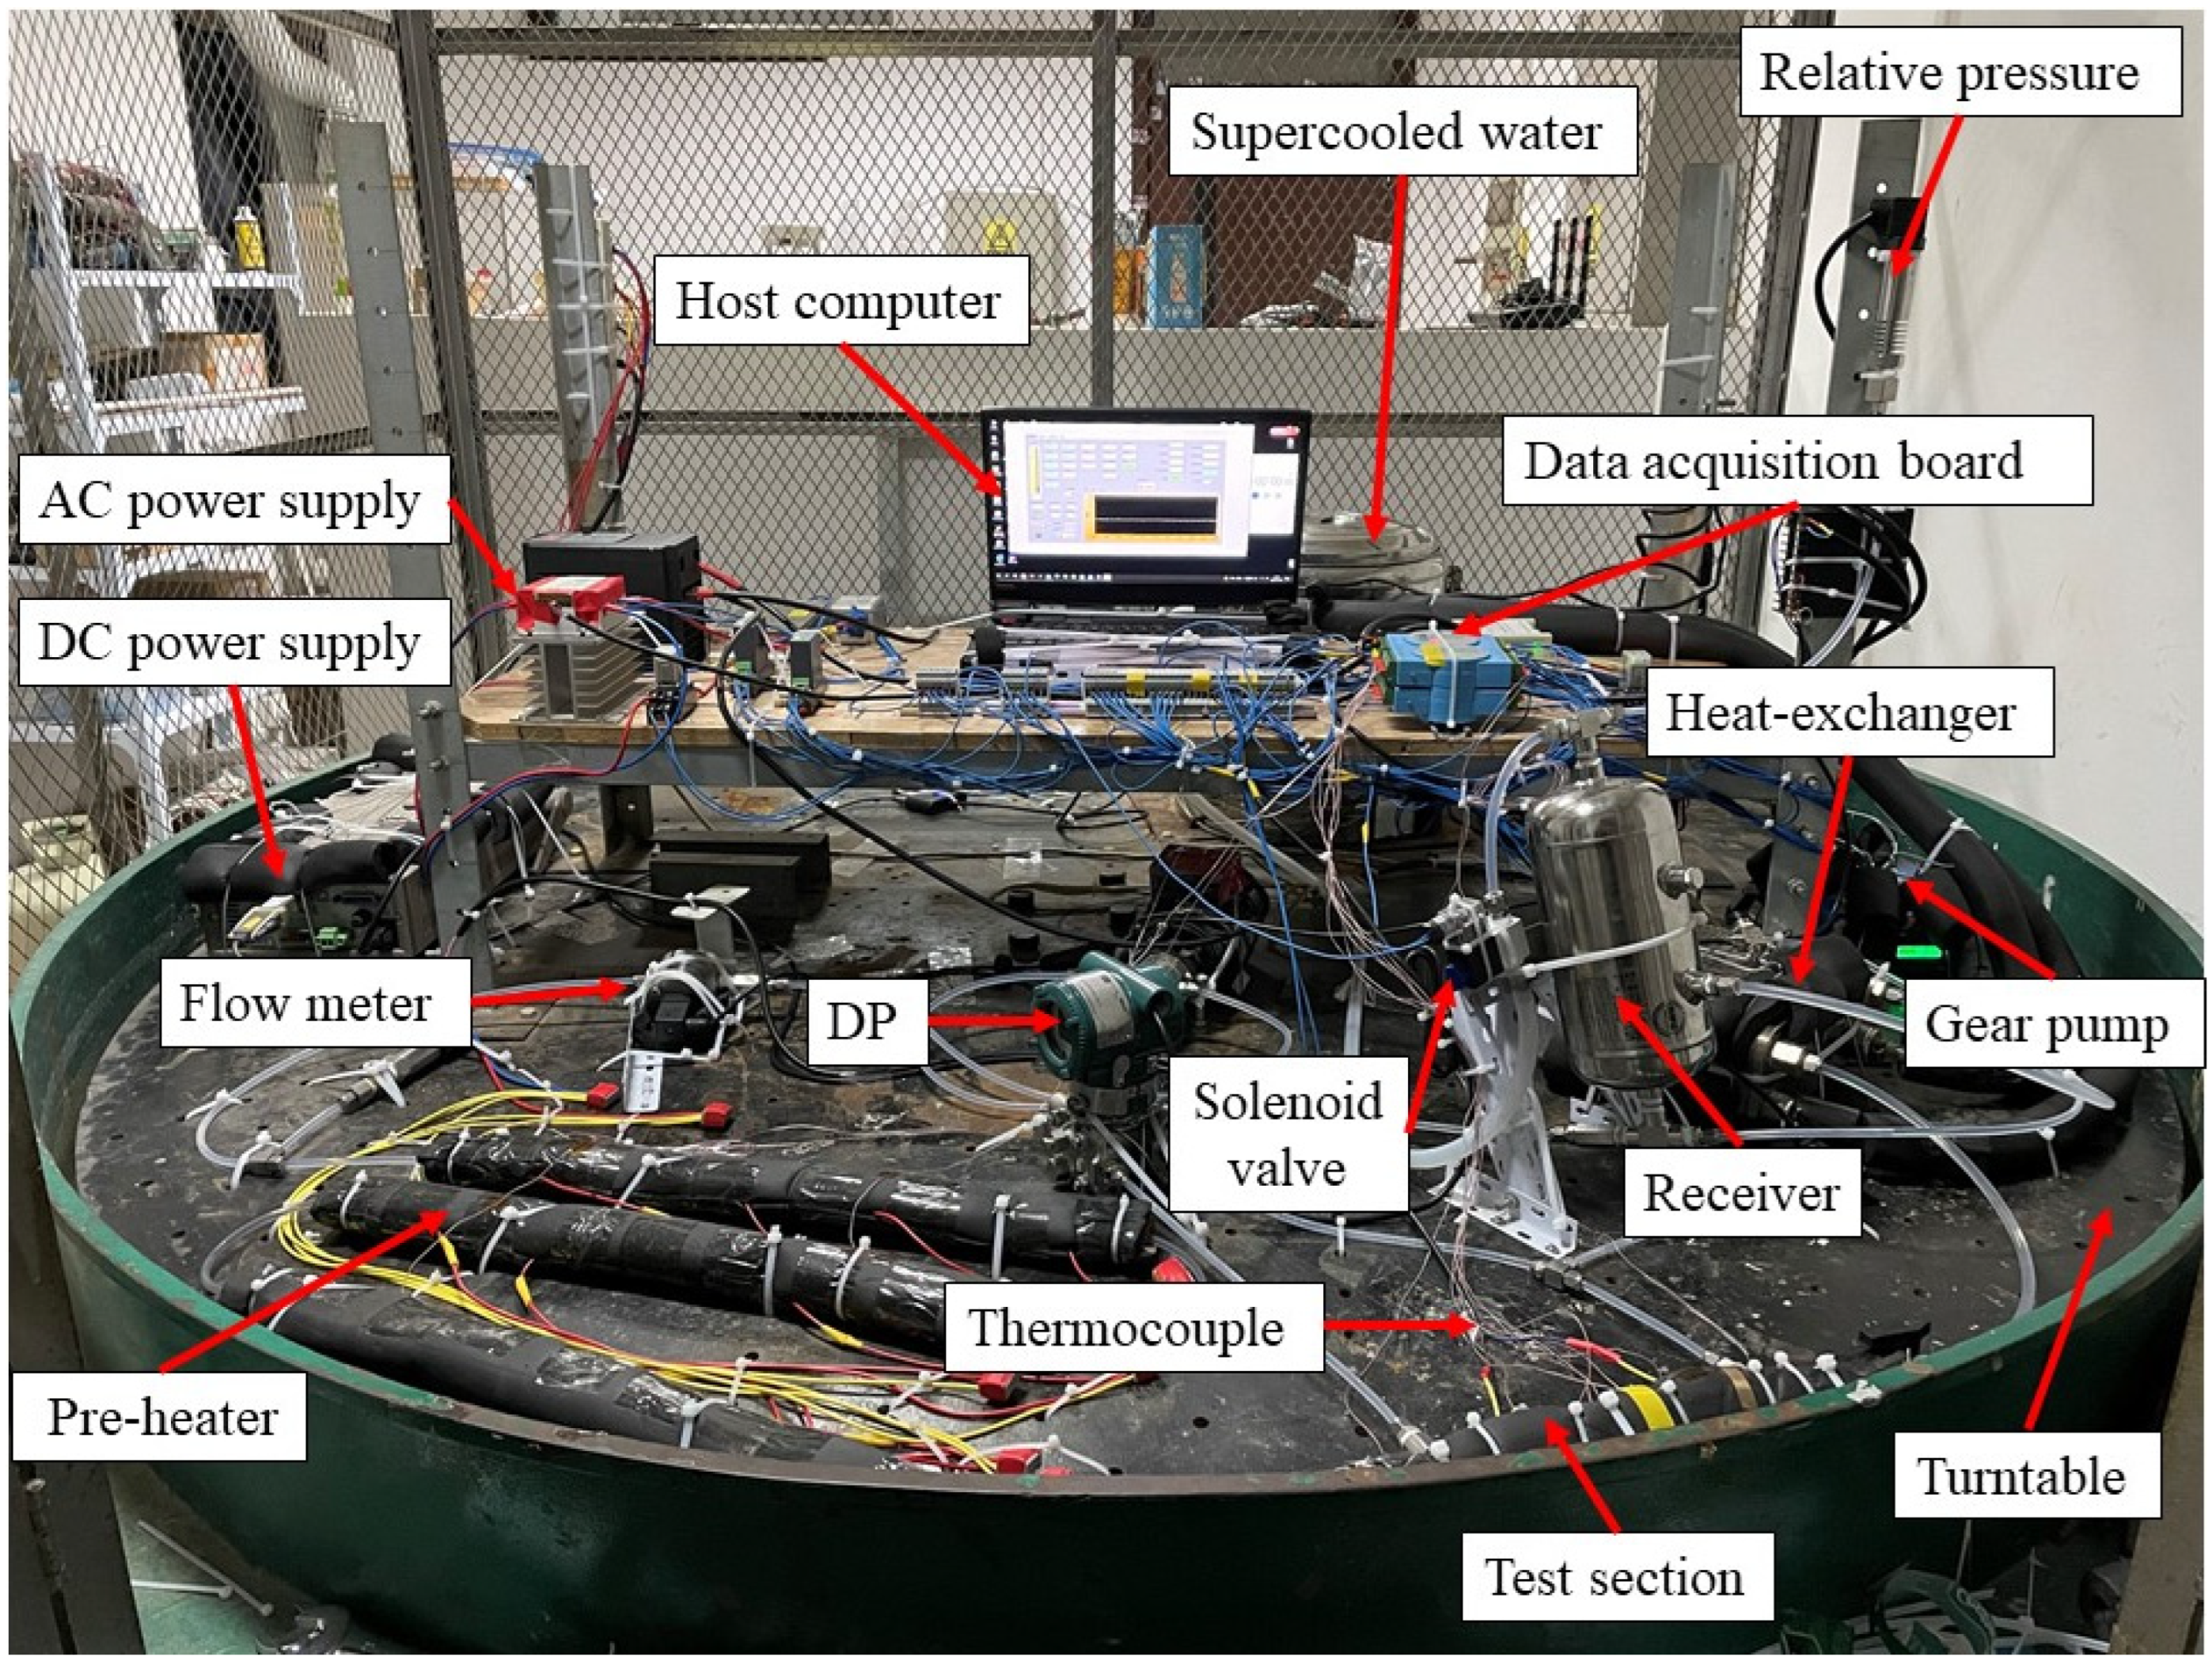
As illustrated in Figure 2 and Figure 3, the flow circulation system comprises two primary loops: a working fluid loop and a cooling fluid loop. Prior to initiating the experiment, the working fluid was introduced into the receiver via the top valve, and the water was propelled by the gear pump through the filter (5), volumetric flow meter, pre-heater, test section, and heat exchanger before returning to the receiver, subsequently. The pre-heater consisted of three 500 mm long straight copper tubes with an inner diameter (ID) of 4 mm, where the working fluid was heated to a specified temperature by modulating the alternating current (AC) power supply (14). The test section featured a 200 mm-long straight copper tube with an ID of 2 mm and an outer diameter (OD) of 4 mm, in which the incoming working fluid from the pre-heater was further heated to achieve the desired temperature or enthalpy level via adjustments to the direct current (DC) power supply (13). Upon exiting the test section, the fluid was routed to the heat exchanger for condensation through heat exchange with supercooled water (9) in the cooling loop, then passed through the separator (8) before re-entering the receiver.
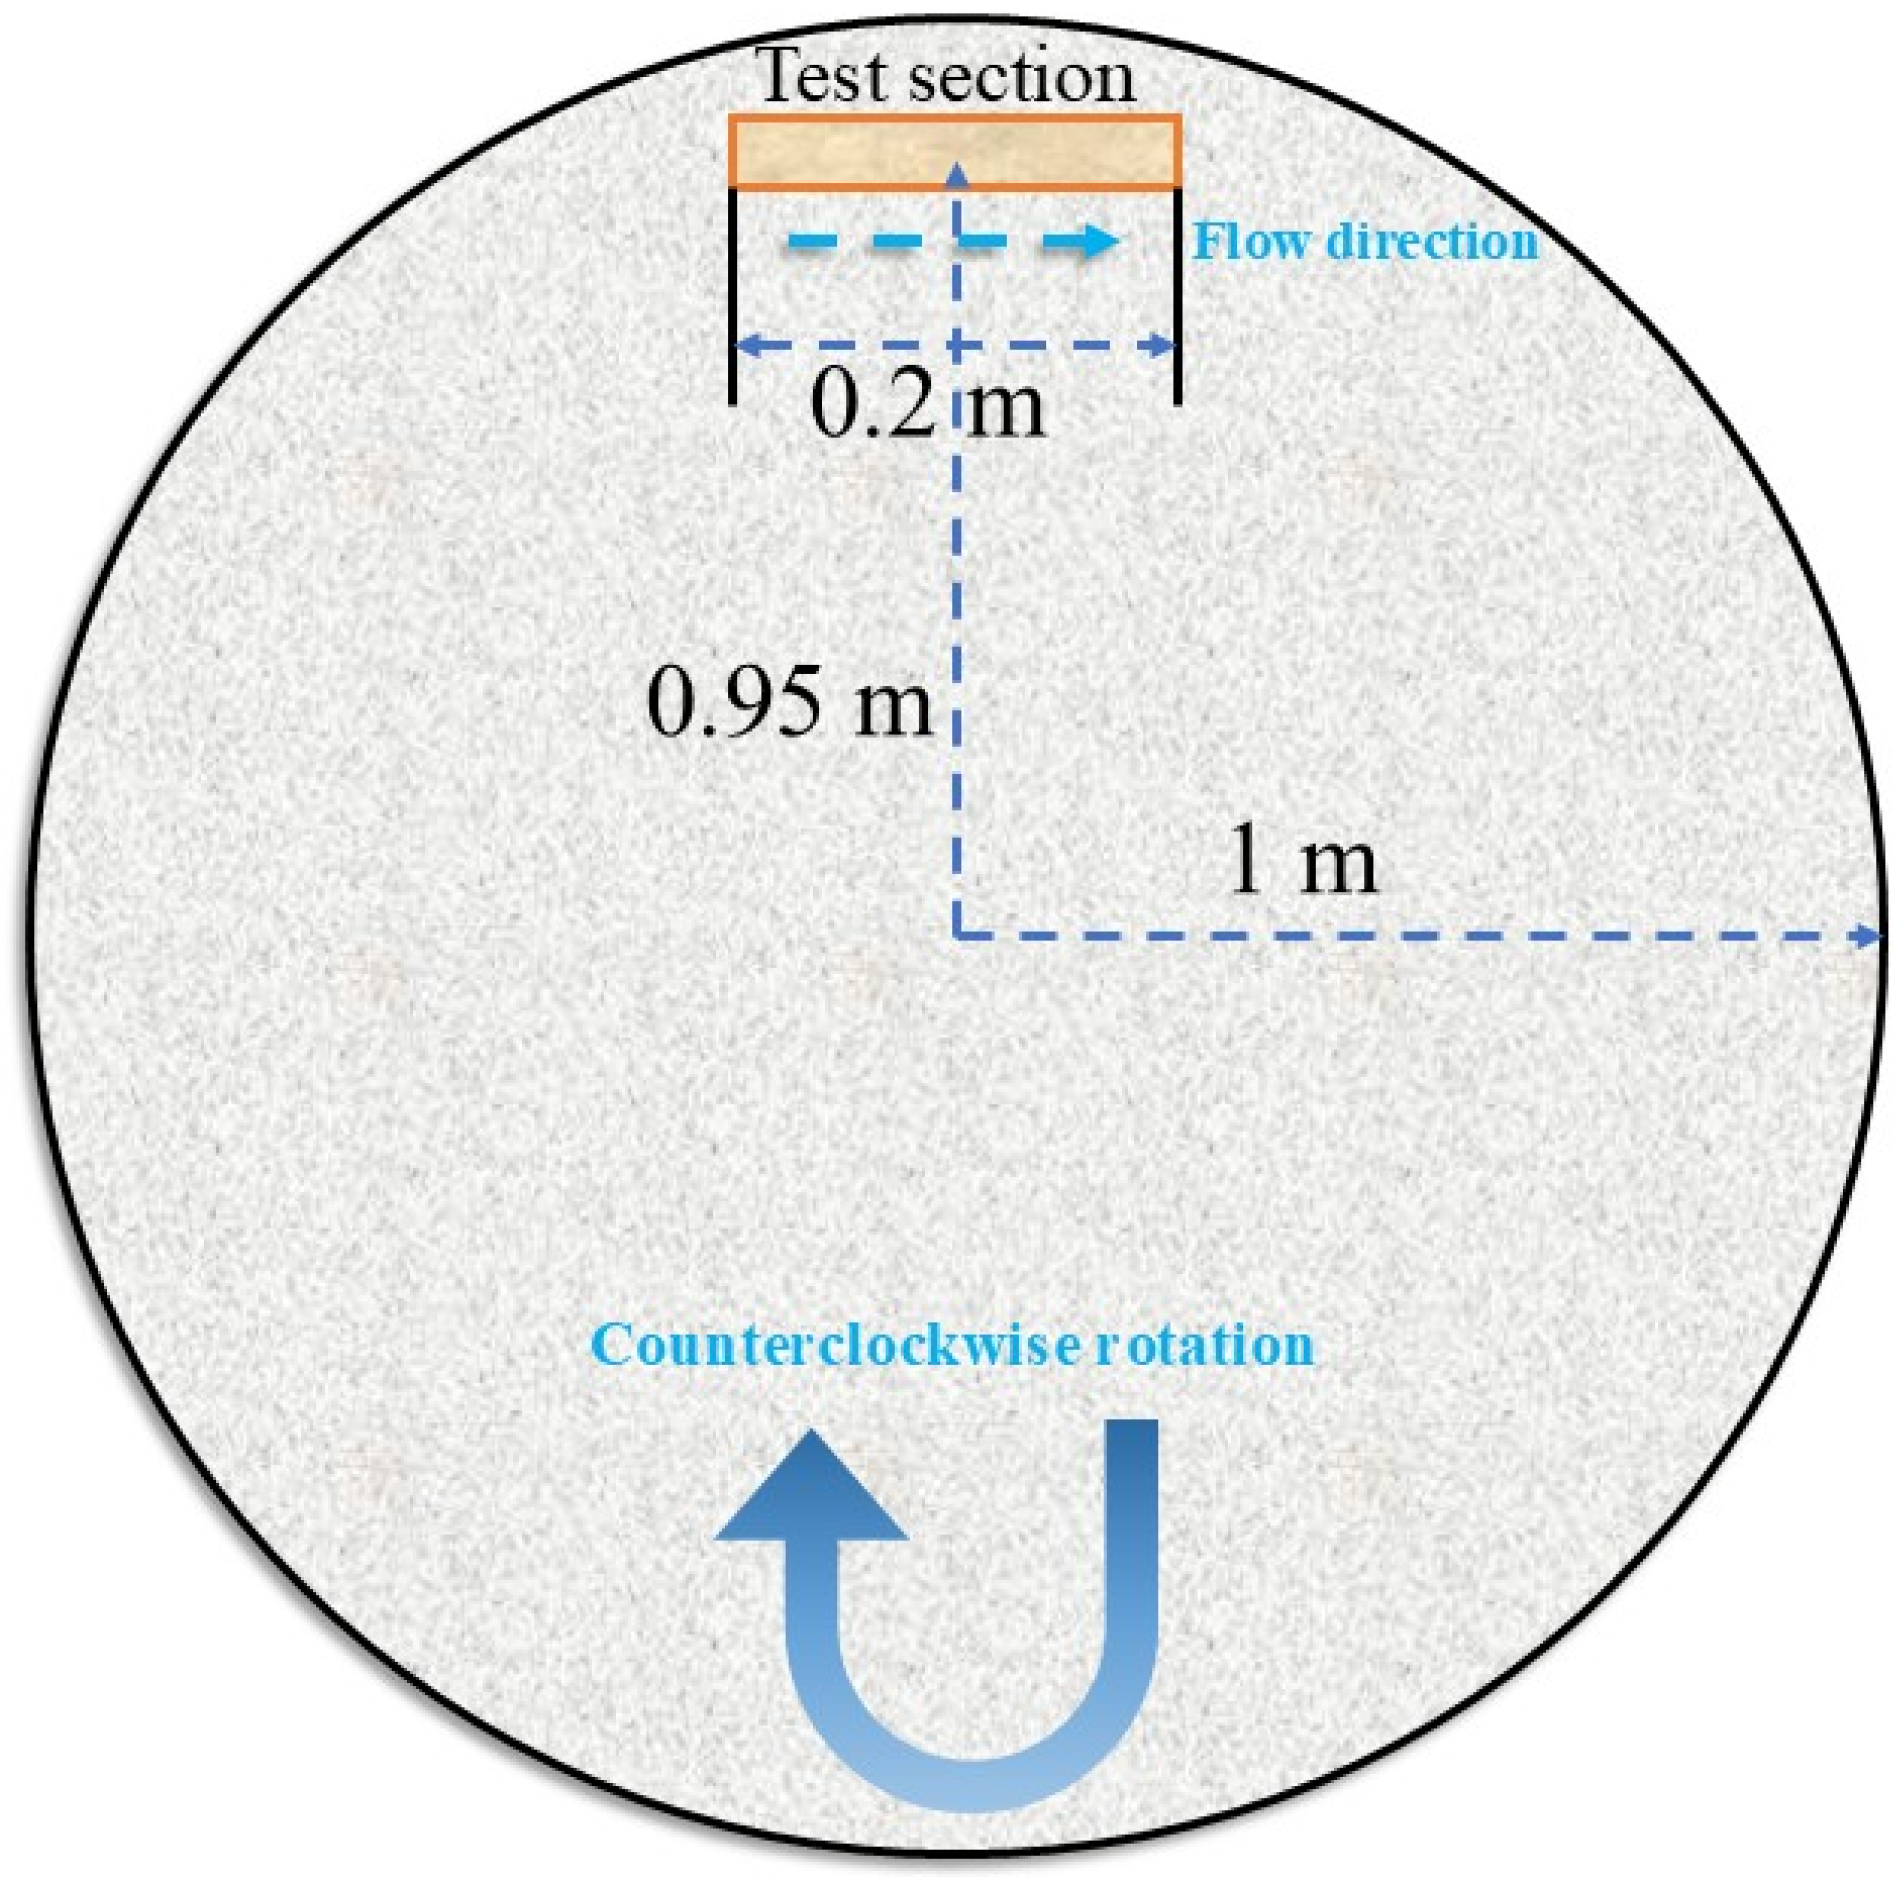
As depicted in Figure 4, the test section was horizontally mounted on the turntable at a radial distance of 950 mm from the central axis, with the water flow oriented from left to right and the turntable rotating counterclockwise. This configuration ensured uniform centrifugal acceleration vectors perpendicular to the test section along the flow direction.
To ensure uniform heat flux in the test section, the outer wall was initially coated with a 1 mm thick layer of thermally conductive insulating silicone glue with a thermal conductivity of 8 W/(m·K) and volume resistivity of 1014 Ω·cm. A nickel–chromium (Ni-Cr) wire was then meticulously wound around the tube’s exterior to serve as the primary heating element, electrically connected to a DC power supply for precise control of power input. Subsequently, an additional layer of thermally conductive insulating silicone glue was applied, followed by wrapping with rubber-plastic thermal insulation cotton to further reduce external heat losses, as illustrated in Figure 5 (longitudinal and cross-sectional views depicting the copper tube, thermocouples, thermal insulation layer, Ni-Cr wire, and insulation layer). Five evenly spaced measurement stations along the 200 mm tube each featured four symmetrically positioned thermocouples, embedded in machined pits on the tube wall and secured with a low-melting-point Ga-In eutectic alloy to minimize contact thermal resistance and ensure thermal continuity.

2.3. Data Acquisition and Control System

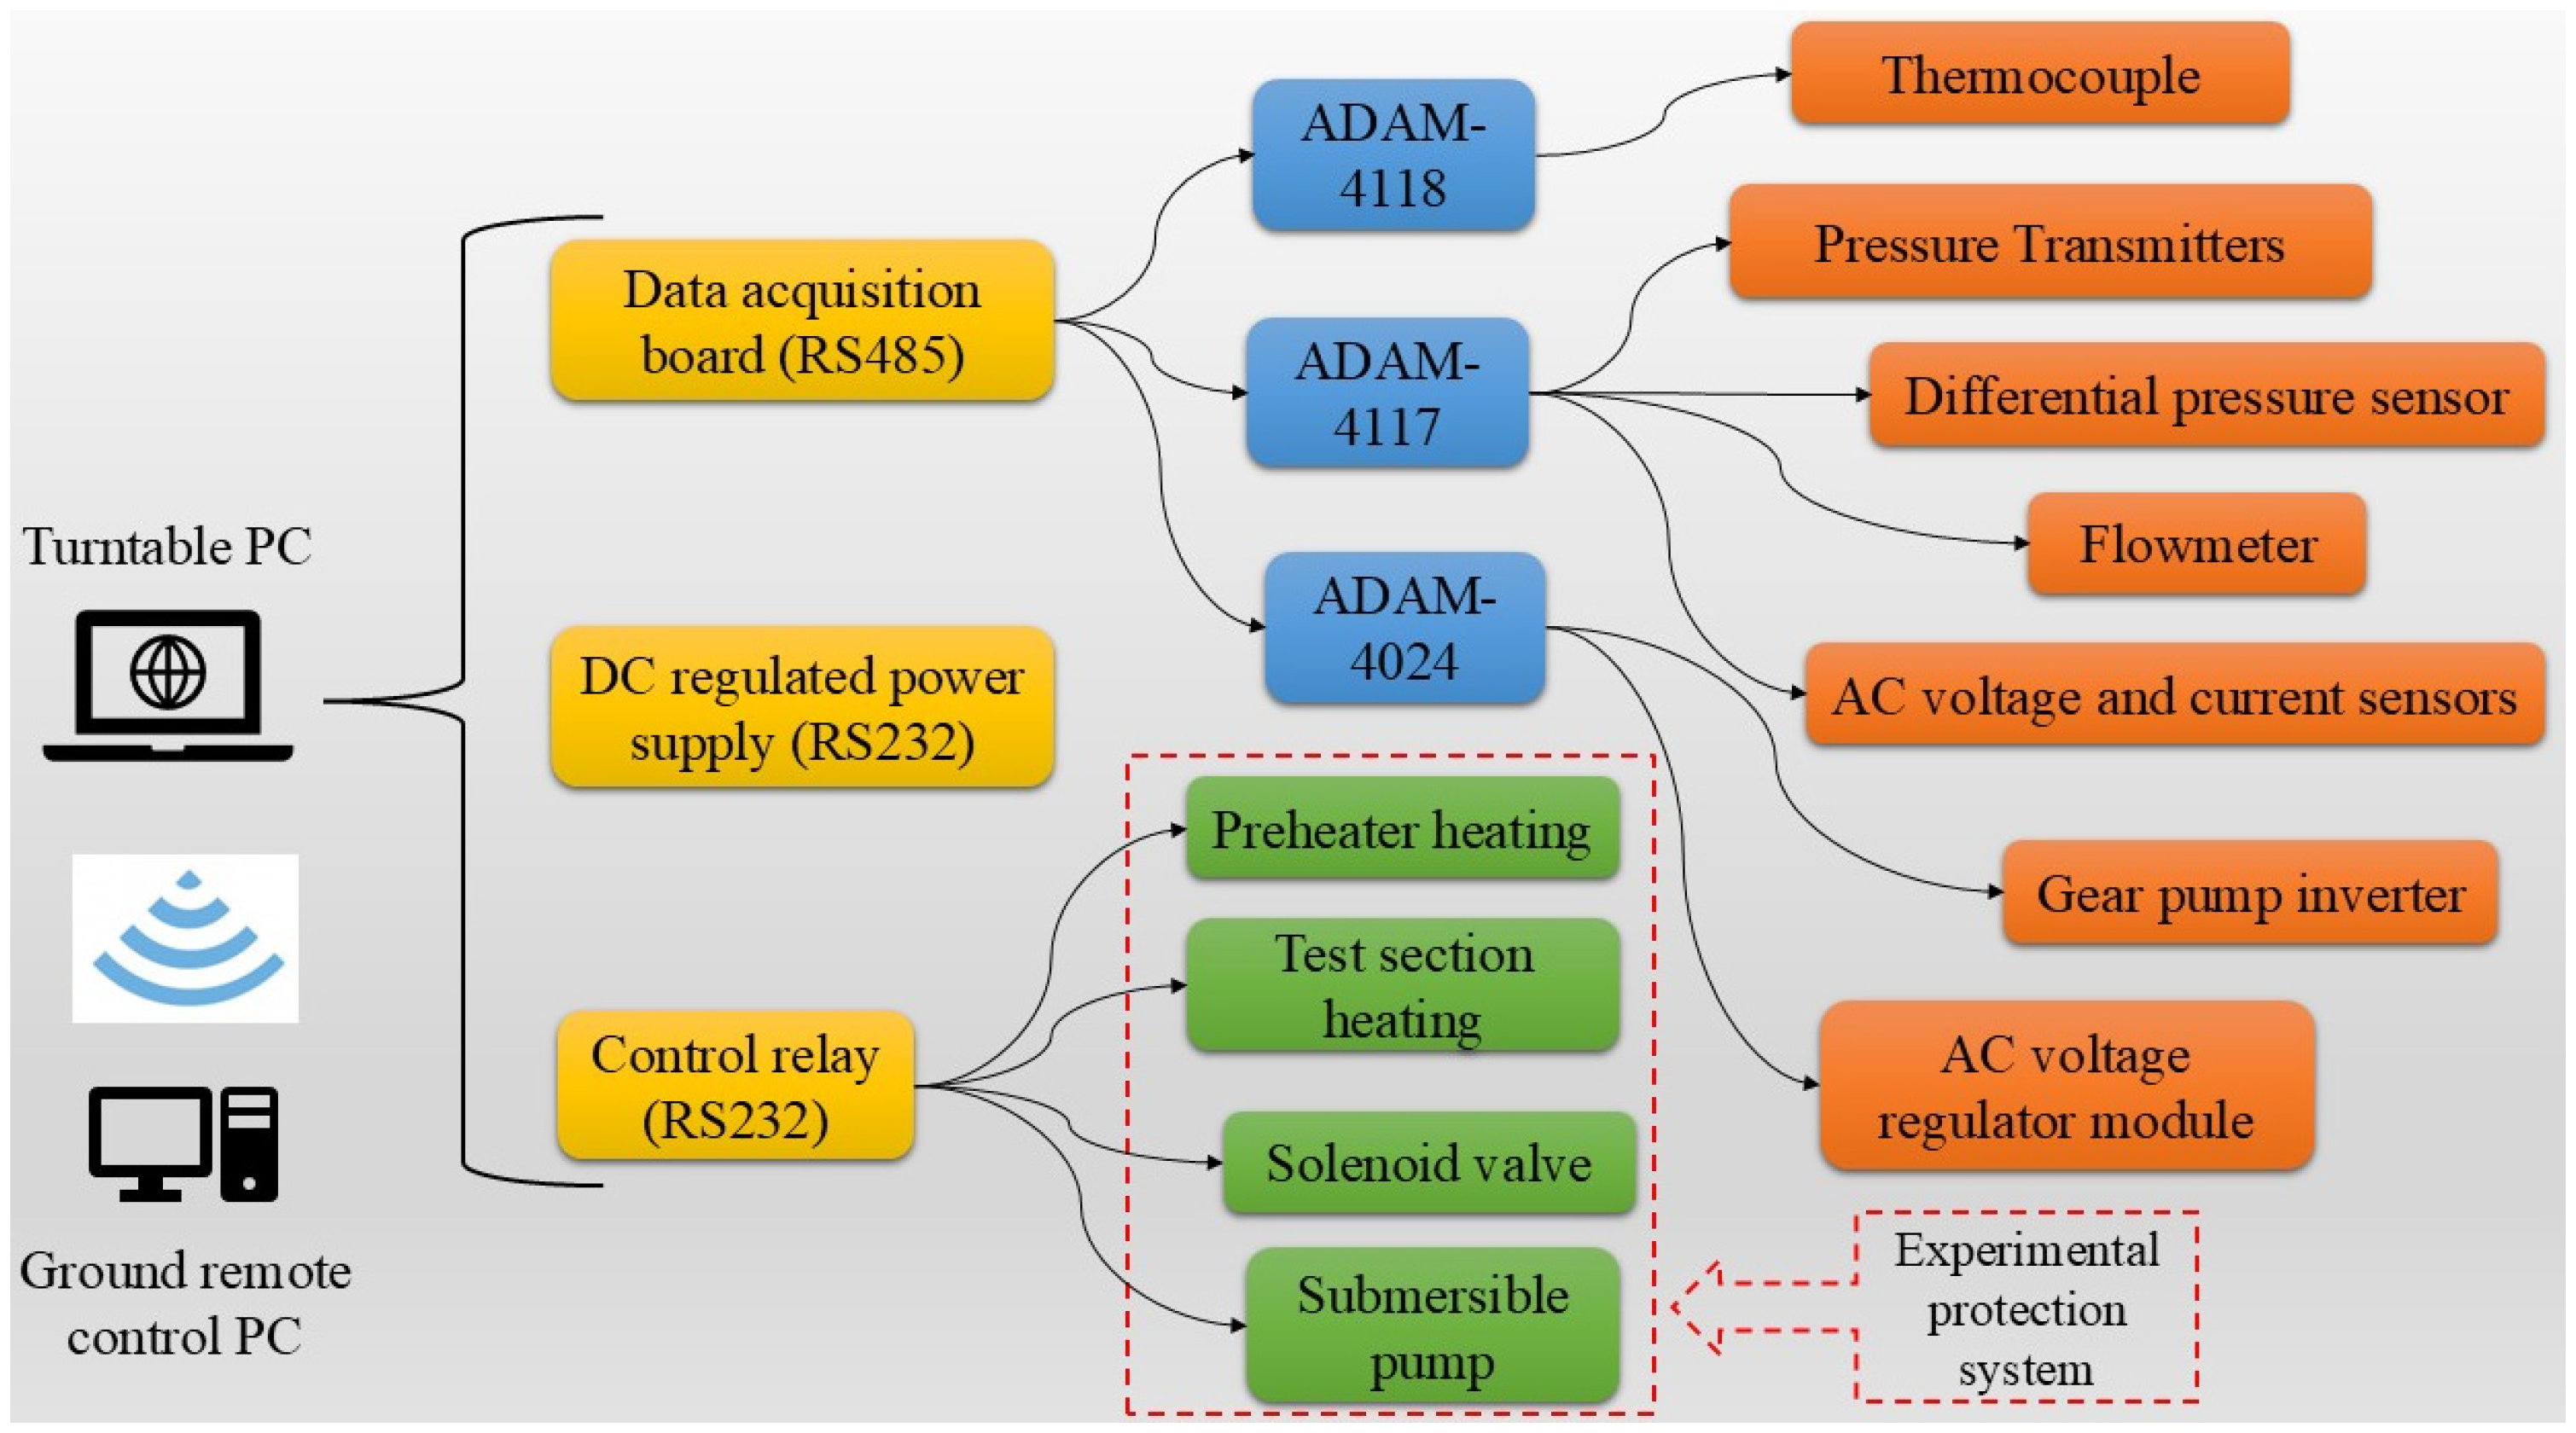
The data acquisition and control system, as depicted in Figure 6, was engineered for precise, real-time monitoring and regulation of key parameters during hypergravity experiments. Type T (copper–constantan) thermocouples, with an accuracy of ±0.1 °C after calibration, were employed to measure wall temperatures in the test section. Pressure measurements were facilitated by two high-precision transmitters (±0.075% full scale) at the pre-heater inlet and test section outlet, augmented by ambient pressure from an aneroid barometer to derive absolute values. A differential pressure transducer (±0.075% full scale) quantified pressure drops across the test section, while a volumetric flowmeter (±0.5% accuracy) monitored mass flow rates. AC voltage and current sensors tracked heating power inputs to the pre-heater and test section. Data were acquired via Advantech ADAM-4000 series modules through (RS-485): ADAM-4118 for thermocouples, ADAM-4117 for pressure and flow signals, and ADAM-4024 for analog outputs controlling the gear pump inverter and AC voltage regulator. Ground-based remote-control computer was achieved via wireless linkage to a turntable computer, enabling relay-based actuation of solenoid valves, submersible pumps, and AC/DC regulated power supplies (RS-232). The experimental control system was programmed in NI LabVIEW, providing a unified graphical interface for synchronous data logging, visualization, and automated control.

2.4. Uncertainty Analysis

The experimental uncertainties of the measured and calculated parameters were evaluated using the Kline and McClintock method [29], and the results are summarized in Table 1. The uncertainties of the mass flux, heat flux, Reynolds number, Nusselt number, friction factor, hypergravity, and HTC were determined using the following equations:
δ G G = δ G v G v 2 + δ A A 2 + δ T T 2 + δ P P 2 = δ G v G v 2 + 2 δ D D 2 + δ T T 2 + δ P P 2
δ q q = 2 δ I I 2 + δ R R 2 + δ D D 2 + δ L L 2
δ R e R e = δ G G 2 + δ D D 2 + δ μ μ 2
δ N u N u = δ h h 2 + δ D D 2 + δ k k 2
δ f f = δ Δ P Δ P 2 + δ D D 2 + δ ρ ρ 2 + 2 δ u u 2 + δ L L 2
δ a h a h = 2 δ ω ω 2 + δ r r 2 + δ g g 2
δ h h = δ q q 2 + δ Δ T Δ T 2

3. Nanofluids Preparation

3.1. Materials and Dispersion

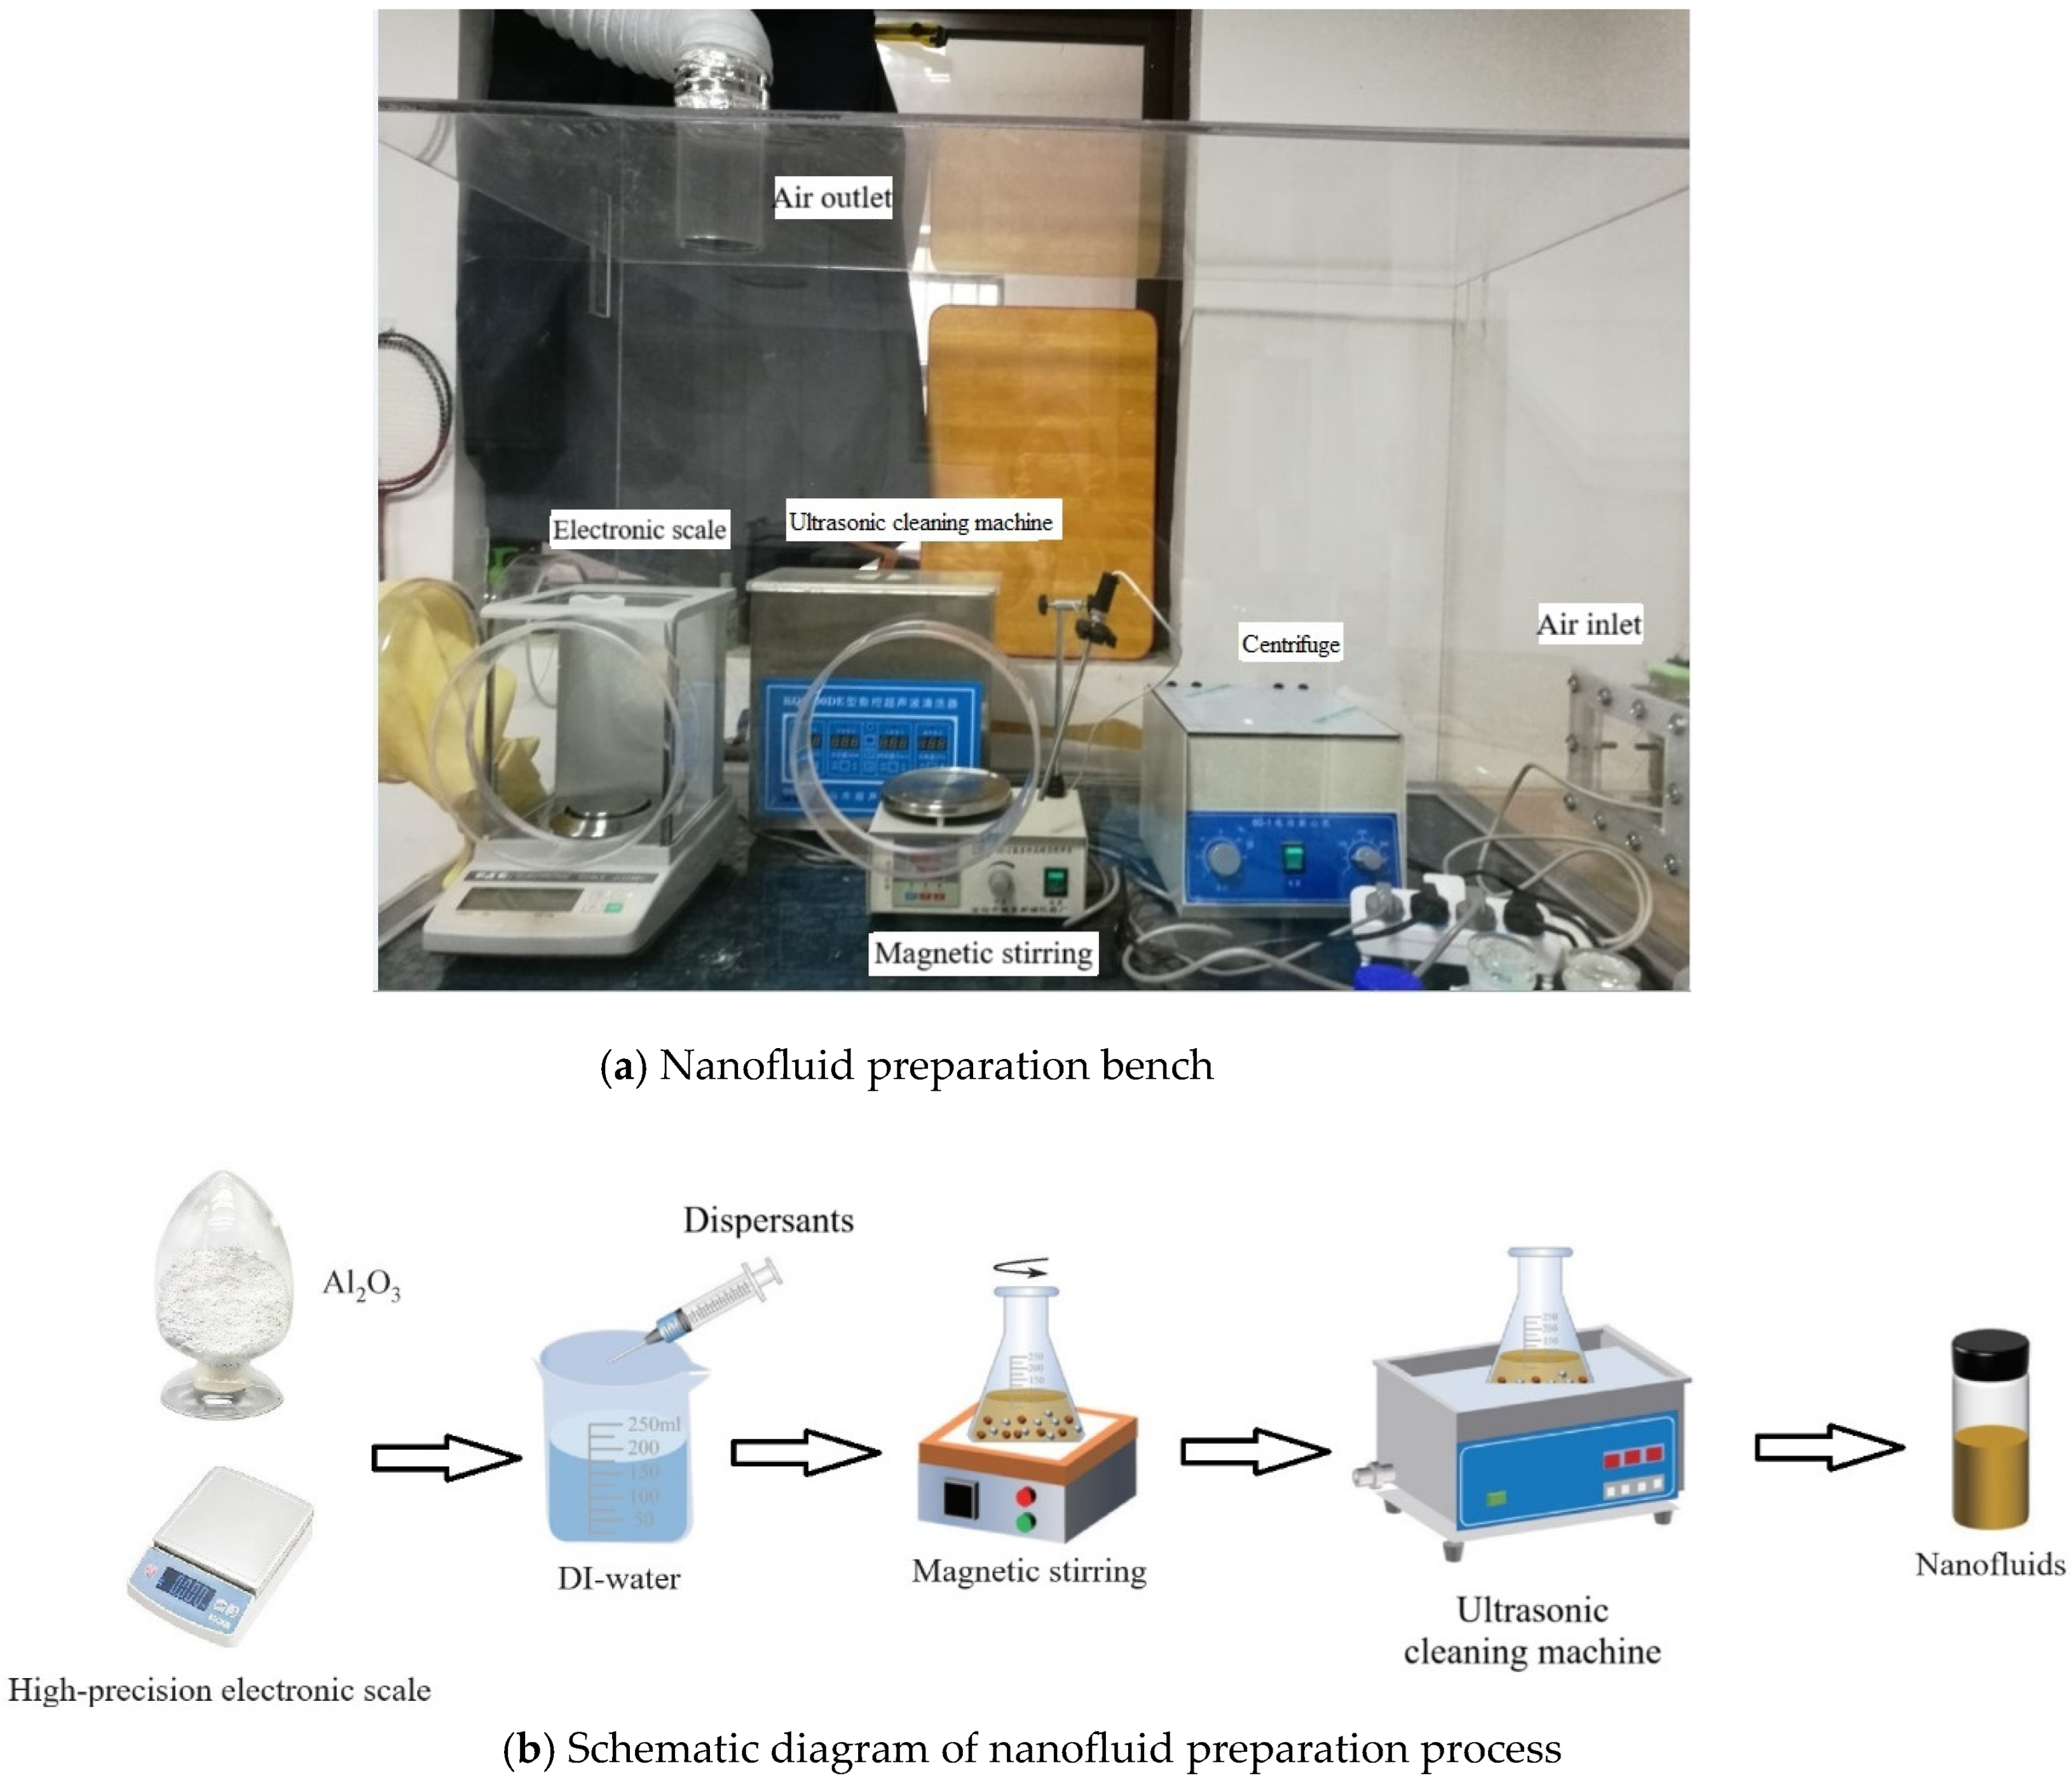
Aluminum oxide (Al2O3) nanoparticles with 99.9% purity and a nominal size of 20–30 nm were selected as the dispersed phase due to their superior thermal stability, chemical inertness, non-toxicity, and cost-effectiveness. TEM analysis confirmed quasi-spherical particles with a mean diameter of 25 ± 5 nm, moderate polydispersity, and notable agglomeration into 50–100 nm clusters driven by van der Waals forces and high surface energy, as shown in Figure 7. The TEM images from different samples exhibit slight morphological variations despite identical imaging conditions. This observation is consistent with the stochastic nature of nanoparticle deposition and aggregation behavior. This size range was strategically chosen as smaller particles exhibit enhanced Brownian motion, reduced sedimentation, and an optimal balance between surface area–to–volume ratio and agglomeration tendency, thereby improving both colloidal stability and thermal performance compared to larger counterparts. As illustrated in Figure 8 that the Al2O3 nanofluids were prepared via a two-step method to ensure precise control of particle concentration and stability. Firstly, predetermined nanoparticle masses (0.02, 0.05, 0.1, 0.2, 0.5 wt%), measured with a high-accuracy balance, were dispersed in deionized water containing sodium dodecylbenzene sulfonate (SDBS) at a 1:5 surfactant-to-nanoparticle mass ratio. Then, initial homogenization was achieved by magnetic stirring at 800 rpm for 120 min at 298 ± 2 K, followed by ultrasonic oscillator (20 kHz, 500 W, pulsed 5 s on/2 s off) for 60 min, with the suspension temperature controlled between 288 and 303 K in a circulating water bath to prevent overheating and promote efficient de-agglomeration.
The nanoparticle concentration range of 0.02–0.5 wt% was selected to achieve an optimal balance between heat transfer enhancement and suspension stability. Concentrations below 0.02 wt% resulted in negligible improvement (<5%), whereas concentrations above 0.5 wt% led to particle agglomeration and a viscosity increase exceeding 40%, which could impose excessive pumping losses and clogging risks. This range also ensured stable dispersion under hypergravity conditions up to 5 g, while maintaining a heat transfer enhancement of 15–35%.

3.2. Stability Validation

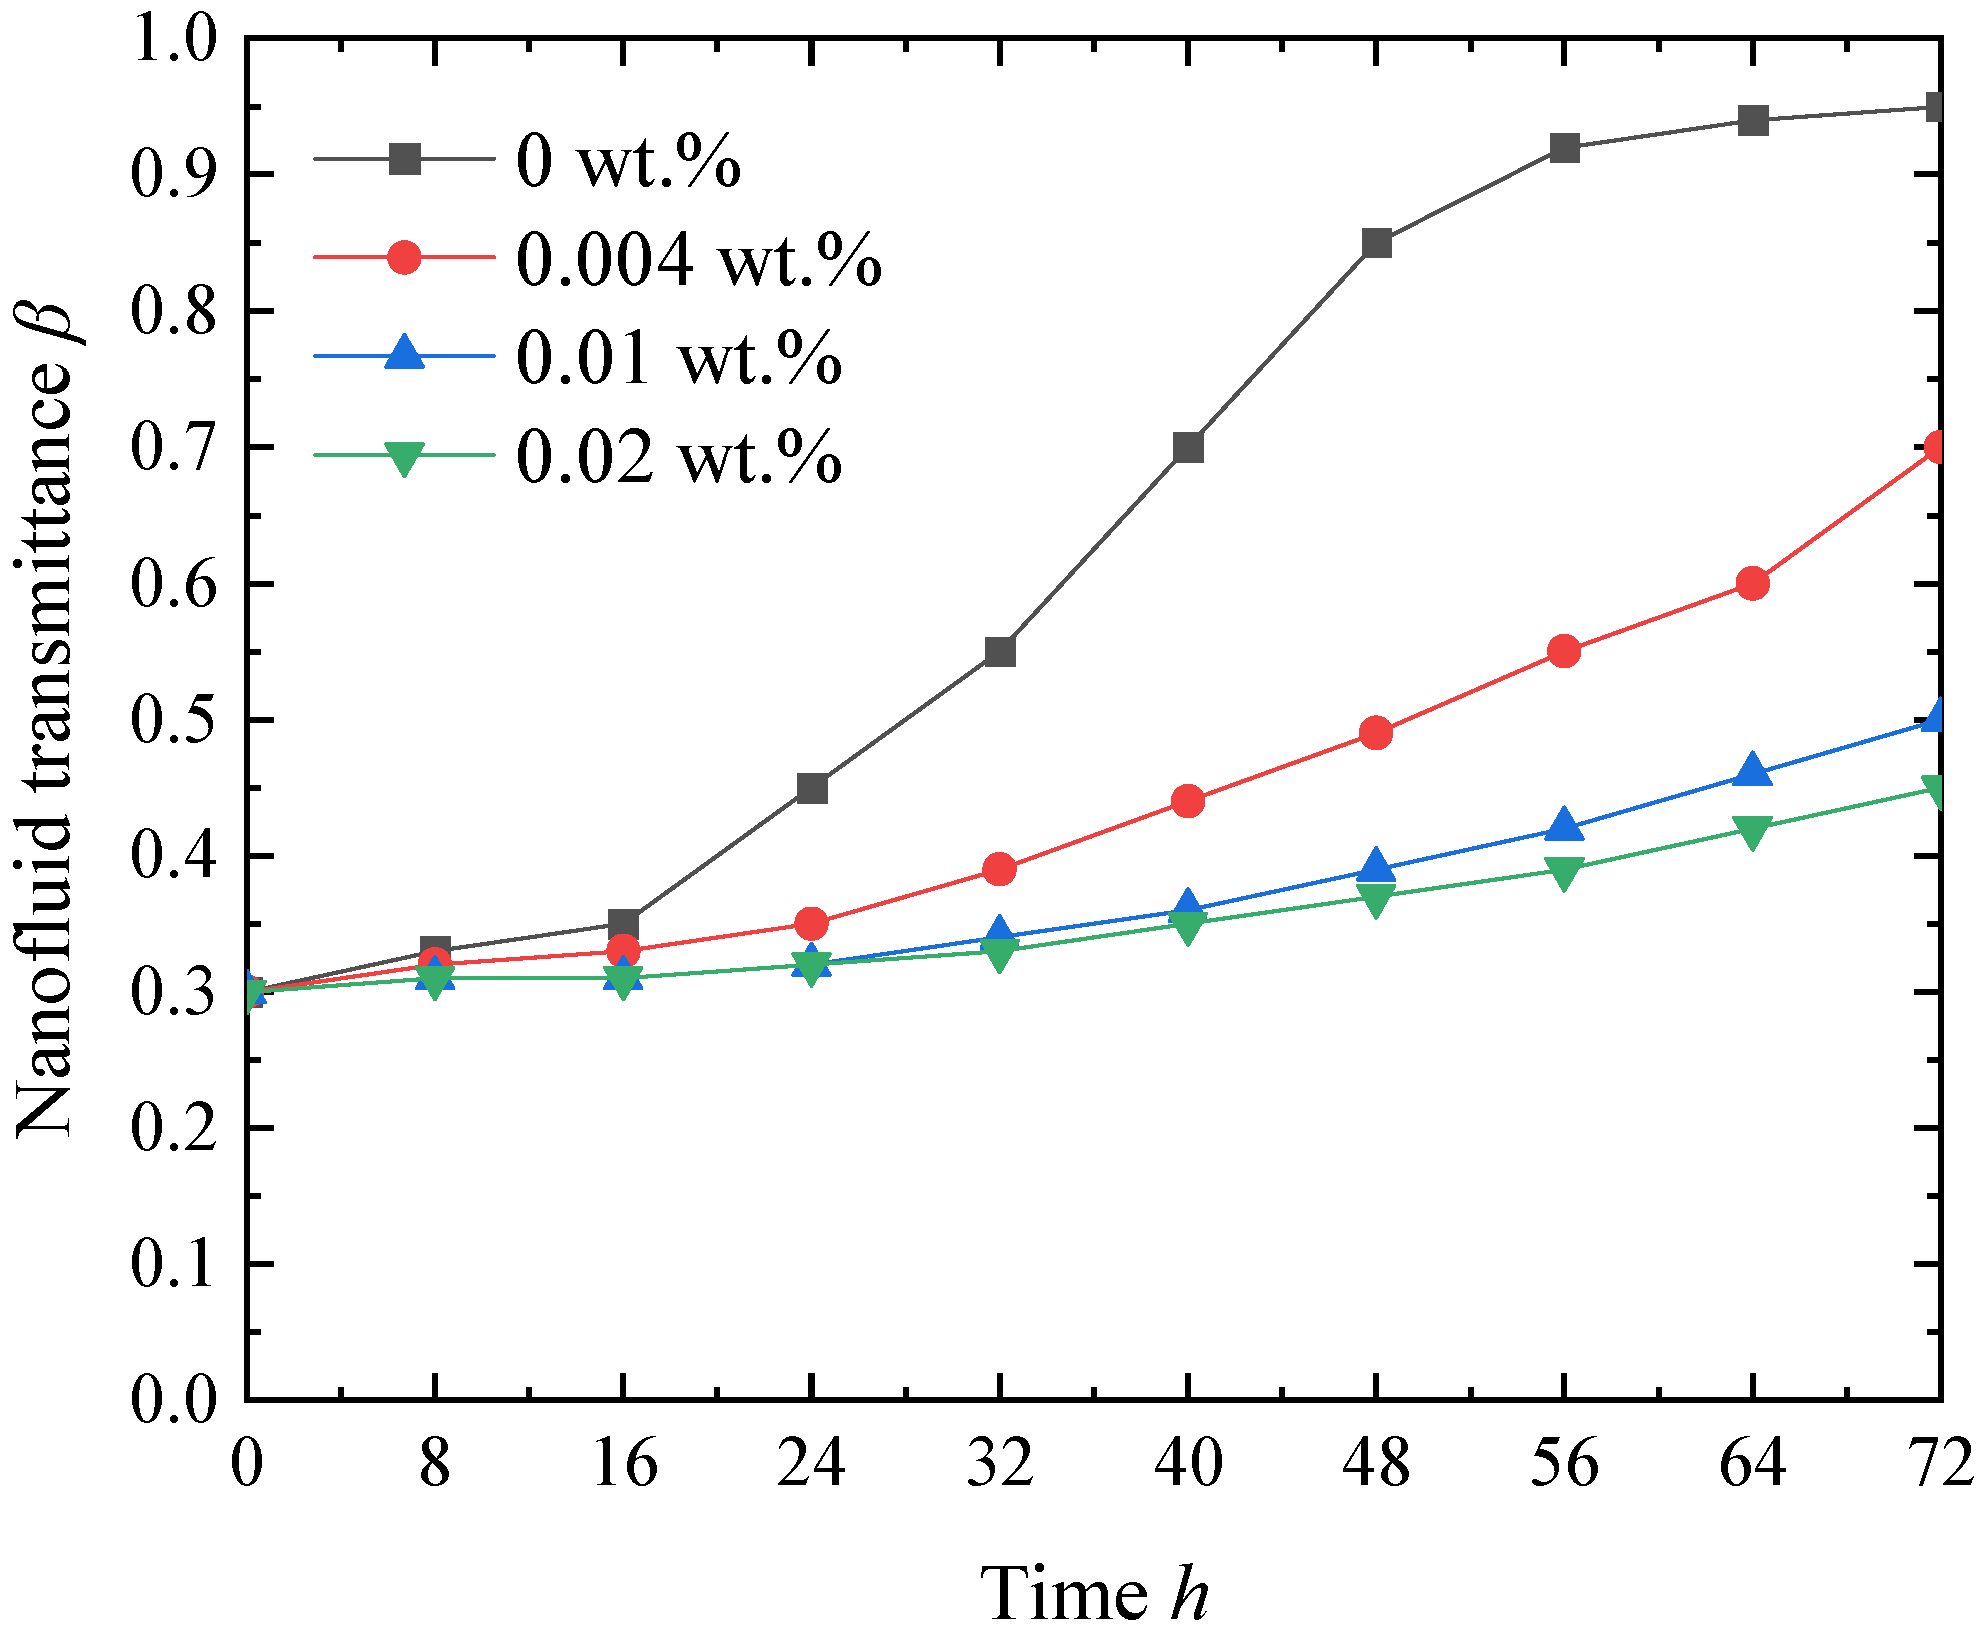
Figure 9 demonstrates the critical role of SDBS with a concentration of 0.004–0.02 wt% in enhancing the colloidal stability through transmittance measurements over 72 h. Without a dispersant, the nanofluid exhibited rapid destabilization, with transmittance rapidly increasing from 45% to 95% due to particle aggregation and sedimentation driven by van der Waals forces. Progressive addition of SDBS yielded substantial stability improvements: 0.004 wt% SDBS reduced the transmittance increase to 65%, indicating partial surface coverage and localized electrosteric stabilization. At 0.01 wt% SDBS, approaching the critical micelle concentration, transmittance remained below 50%, suggesting more comprehensive surface modification through surfactant adsorption. Optimal stability was achieved at 0.02 wt% SDBS, maintaining transmittance below 40% with minimal temporal variation throughout the observation period. This concentration ensures complete surface saturation, forming a robust protective layer that prevents particle agglomeration through combined electrostatic repulsion from sulfonate groups and steric hindrance from dodecylbenzene chains. The stabilization mechanism involves modification of the Hamaker constant and enhancement of the energy barrier for particle approach, effectively transforming the interparticle potential from attractive to repulsive. The demonstrated stability exceeding 72 h provides an adequate margin for heat transfer experiments, which typically require 8–12 h for complete characterization.

3.3. Thermophysical Properties

3.3.1. Density

The density of Al2O3–water nanofluids can be estimated using the mixture rule [30]:
ρ n f = ( 1 φ ) ρ b f + φ ρ p
where ρ n f is the nanofluid density, ρ b f is the base fluid density, ρ p is the nanoparticle density, and φ is the volume fraction of nanoparticles. Under hypergravity, particle settling leads to local concentration gradients, which modify the effective density. This can be expressed as
ρ n f , g = ρ n f , 0 1 + α ρ g g 0 1
where ρ n f , g is the density at gravity g, ρ n f , 0 is the density at normal gravity (1 g), g 0 is normal gravity, and α ρ is the gravitational sensitivity coefficient for density. Experimental observations indicate that increasing gravity from 1 g to 5 g results in a local density increase of approximately 3–8%, with higher nanoparticle concentrations showing stronger sensitivity.

3.3.2. Specific Heat Capacity

The specific heat capacity of nanofluids is calculated using the mixture model [31]:
c p , n f = 1 φ ρ b f c p , b f + φ ρ p c p , p ρ n f
where c p , n f , c p , b f , and c p , p are the specific heat capacities of nanofluid, base fluid, and nanoparticles, respectively. Under hypergravity, the specific heat capacity exhibits a small reduction, which can be expressed as
c p n f , g = c p n f , 0 1 δ c p g g 0 1
where δ c p is the gravitational sensitivity coefficient for specific heat capacity. Experimental results show a 2–5% reduction at 5 g compared to 1 g, a relatively minor variation compared to other properties.

3.3.3. Thermal Conductivity

The effective thermal conductivity of dilute nanofluids is often estimated by the Maxwell model [30]:
k n f = k b f k p + 2 k b f 2 φ k b f k p k p + 2 k b f + φ k b f k p
where k n f , k b f , and k p are the thermal conductivities of the nanofluid, base fluid, and nanoparticles, respectively. Under hypergravity, thermal conductivity increases due to enhanced particle–particle interactions and chain-like microstructures, which can be represented as
k n f , g = k n f , 0 1 + γ k g g 0 m
where γ k is the gravitational sensitivity coefficient and m is an empirical exponent. Experimental data indicate a 5–12% enhancement at 5 g relative to 1 g, with more pronounced effects at higher nanoparticle concentrations.

3.3.4. Viscosity

For dilute suspensions, viscosity can be estimated using Einstein’s relation [30]:
μ n f = μ b f 1 + 2.5 φ
For higher concentrations, the Brinkman model provides a better approximation [32]:
μ n f = μ b f 1 φ 2.5
Under hypergravity, viscosity exhibits nonlinear increases due to particle clustering and anisotropic structures:
μ n f , g = μ n f , 0 1 + β μ g g 0 n
where β μ is the gravitational sensitivity coefficient for viscosity, and nnn is an empirical exponent (0.5–1.5). Experiments indicate that viscosity increases by 10–18% at 5 g, attributed to particle aggregation and alignment under the gravitational field.

4. Data Reduction

4.1. Hypergravity Acceleration

The hypergravity acceleration a h is the combined effect of the gravitational acceleration g and the centrifugal acceleration a c . It can be expressed as
a h = a c 2 + g 2 = g ( a c / g ) 2 + 1
where a c = ω 2 R , with ω being the angular velocity of the rotating platform (rad/s) and R the radial distance from the axis of rotation to the test section.

4.2. Coriolis Force

The Coriolis force arises due to the rotation of the centrifugal platform and acts perpendicularly to both the fluid velocity vector and the axis of rotation. The Coriolis force F C o r is given by
F C o r   = m · a C o r = 2 m ω v
where a C o r is the Coriolis acceleration, m is the fluid mass, ω is the angular velocity (rad/s), and v is the local fluid linear velocity. The angular velocity ω is related to the rotational speed n (rpm) by
ω = 2 π n 60
For the maximum centrifugal condition of a c = 5 g , ω can be obtained as
ω = a c R
The fluid linear velocity v is calculated from the mass flux G and density ρ :
v = G ρ
For example, at a mass flux of G = 300 kg/m2 s and assuming a liquid water density of ρ ≈ 958 kg/m3 with near-saturation conditions:
v = 300   kg / m 2 s 958   kg / m 3   0.313   m / s
Thus, the Coriolis acceleration becomes
a c o r = 2 ω v = 2 × 7.2   rad / s × 0.313   m / s = 4.5   m / s 2
For the given conditions, a Cor 0.46 g , which, although smaller than the centrifugal acceleration ( a c = 5 g ), is still significant and may alter flow structures and heat transfer behavior inside the micro-channel.

4.3. Convective Heat Transfer Coefficient

The convective HTC h was obtained from the measured heat flux q and the temperature difference between the heated wall and the bulk fluid:
h = q T w T b
where T w is the average wall temperature, T b is the bulk fluid temperature, and q = Q / A , with Q being the heat input and A the heat transfer area. In all experiments, the thermal boundary condition was imposed as a constant heat flux at the heated wall of the test section. This boundary condition was maintained consistently across the entire range of operating parameters, and the corresponding wall temperature was measured to calculate the heat transfer coefficient. No additional boundary treatments were introduced for individual heat flux levels, ensuring that all reported results are directly comparable under the same thermal boundary condition.

4.4. Nusselt Number

The Nusselt number (Nu) represents the dimensionless heat transfer enhancement relative to pure conduction:
N u = h D k
where D is the hydraulic diameter of the test channel and k is the effective thermal conductivity of the nanofluid, evaluated at bulk temperature T b .
The Reynolds number (Re) and Prandtl number (Pr) were defined as
R e = ρ v D μ , P r = c p μ k
where ρ is the density of working fluid, ν is the kinematic viscosity, μ is the dynamic viscosity, and cp is the specific heat capacity.
The experimental results were benchmarked against classical correlations, including the following:
(1) Dittus–Boelter [17]:
N u = 0.023 R e 0.8 P r 0.4
(2) Sieder-Tate [33]:
N u = 0.027 R e 0.8 P r 1 3 μ μ w 0.14
where μw is the dynamic viscosity at the wall.
(3) Petukhov [34]:
N u = f 8 R e P r 1.07 + 12.7 f 8 P r 2 3 1
(4) Webb [35]:
N u = 0.023 R e 0.8 P r 0.4 F h
where Fh is the hypergravity correction factor.
F h = 1 + 2.64 R e 0.036 e D 0.212 P / D N s 0.21 α 90 0.29 P r 0.024
where e is the absolute roughness height, D is the tube diameter, P is the pitch, Ns is the number of starts, and α is the helix angle.
(5) Sleicher-Rouse [19]:
N u = 5 + 0.015 R e 0.85 P r 0.4
(6) Gnielinski [18]:
N u = f 8 R e 1000 P r 1 + 12.7 f 8 P r 2 3 1

4.5. Friction Factor

The Darcy friction factor was obtained from the measured pressure drop Δ P across the heated test section:
f = 2 D Δ P ρ L v 2
where L is the test section length, v is the mean flow velocity.

4.6. Pressure Drop

The total pressure drop Δ P t o t was directly measured but could also be predicted from the calculated friction factor:
Δ P c a l c = f L D h ρ v 2 2
where Dh is the hydraulic diameter.
All calculations were performed across varying conditions, include gravitational levels, nanoparticle concentrations, Reynolds numbers, mass flux, and heat flux. Each data point was averaged over five repeated runs, yielding a variation below 5%, which confirms the repeatability and reliability of the measurements.

5. Results and Discussion

5.1. Effect of Hypergravity Conditions on HTC

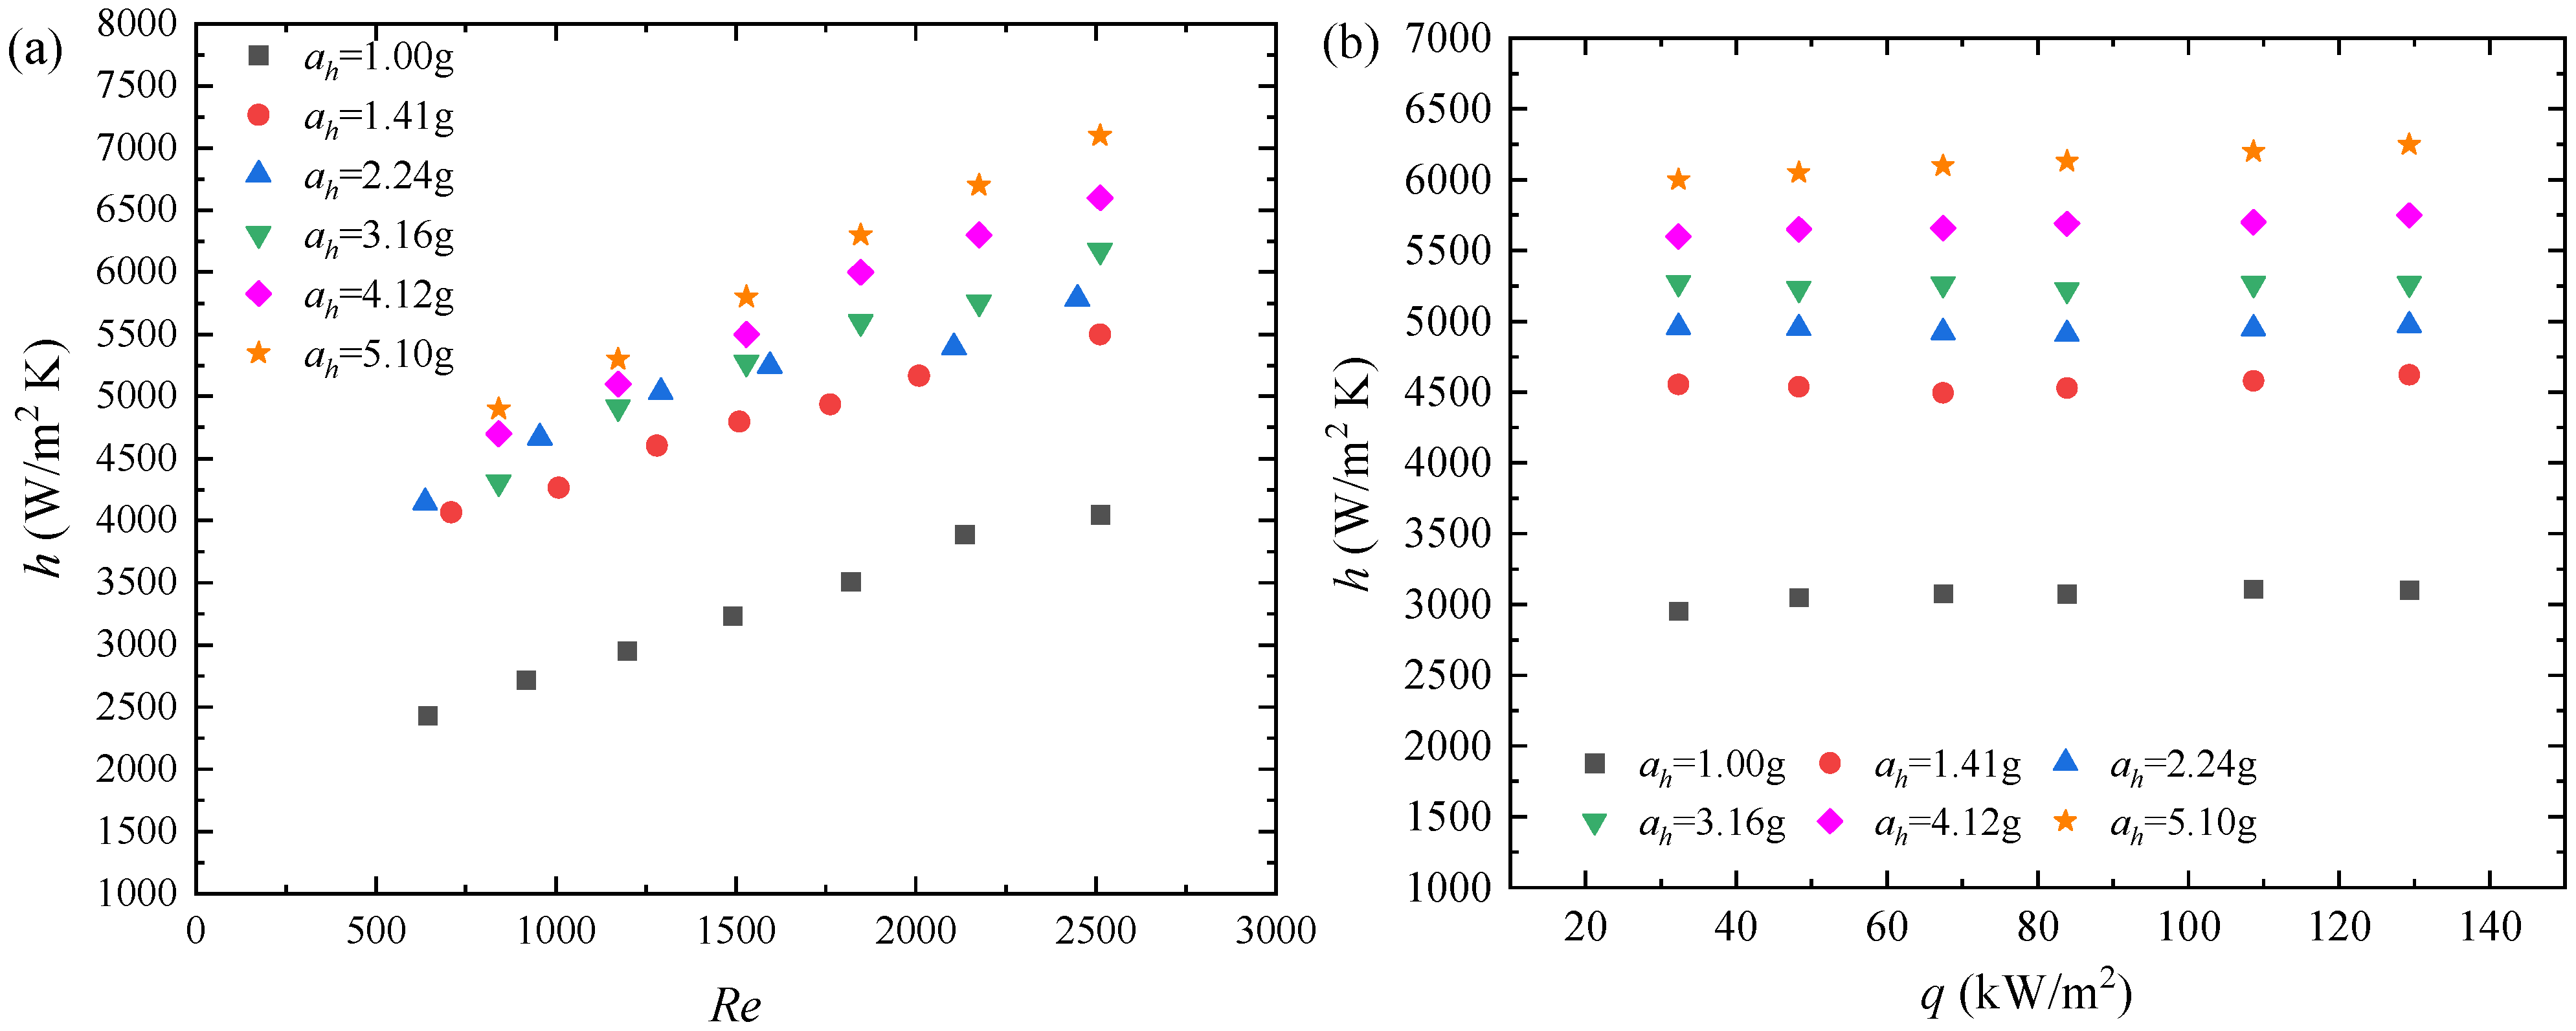
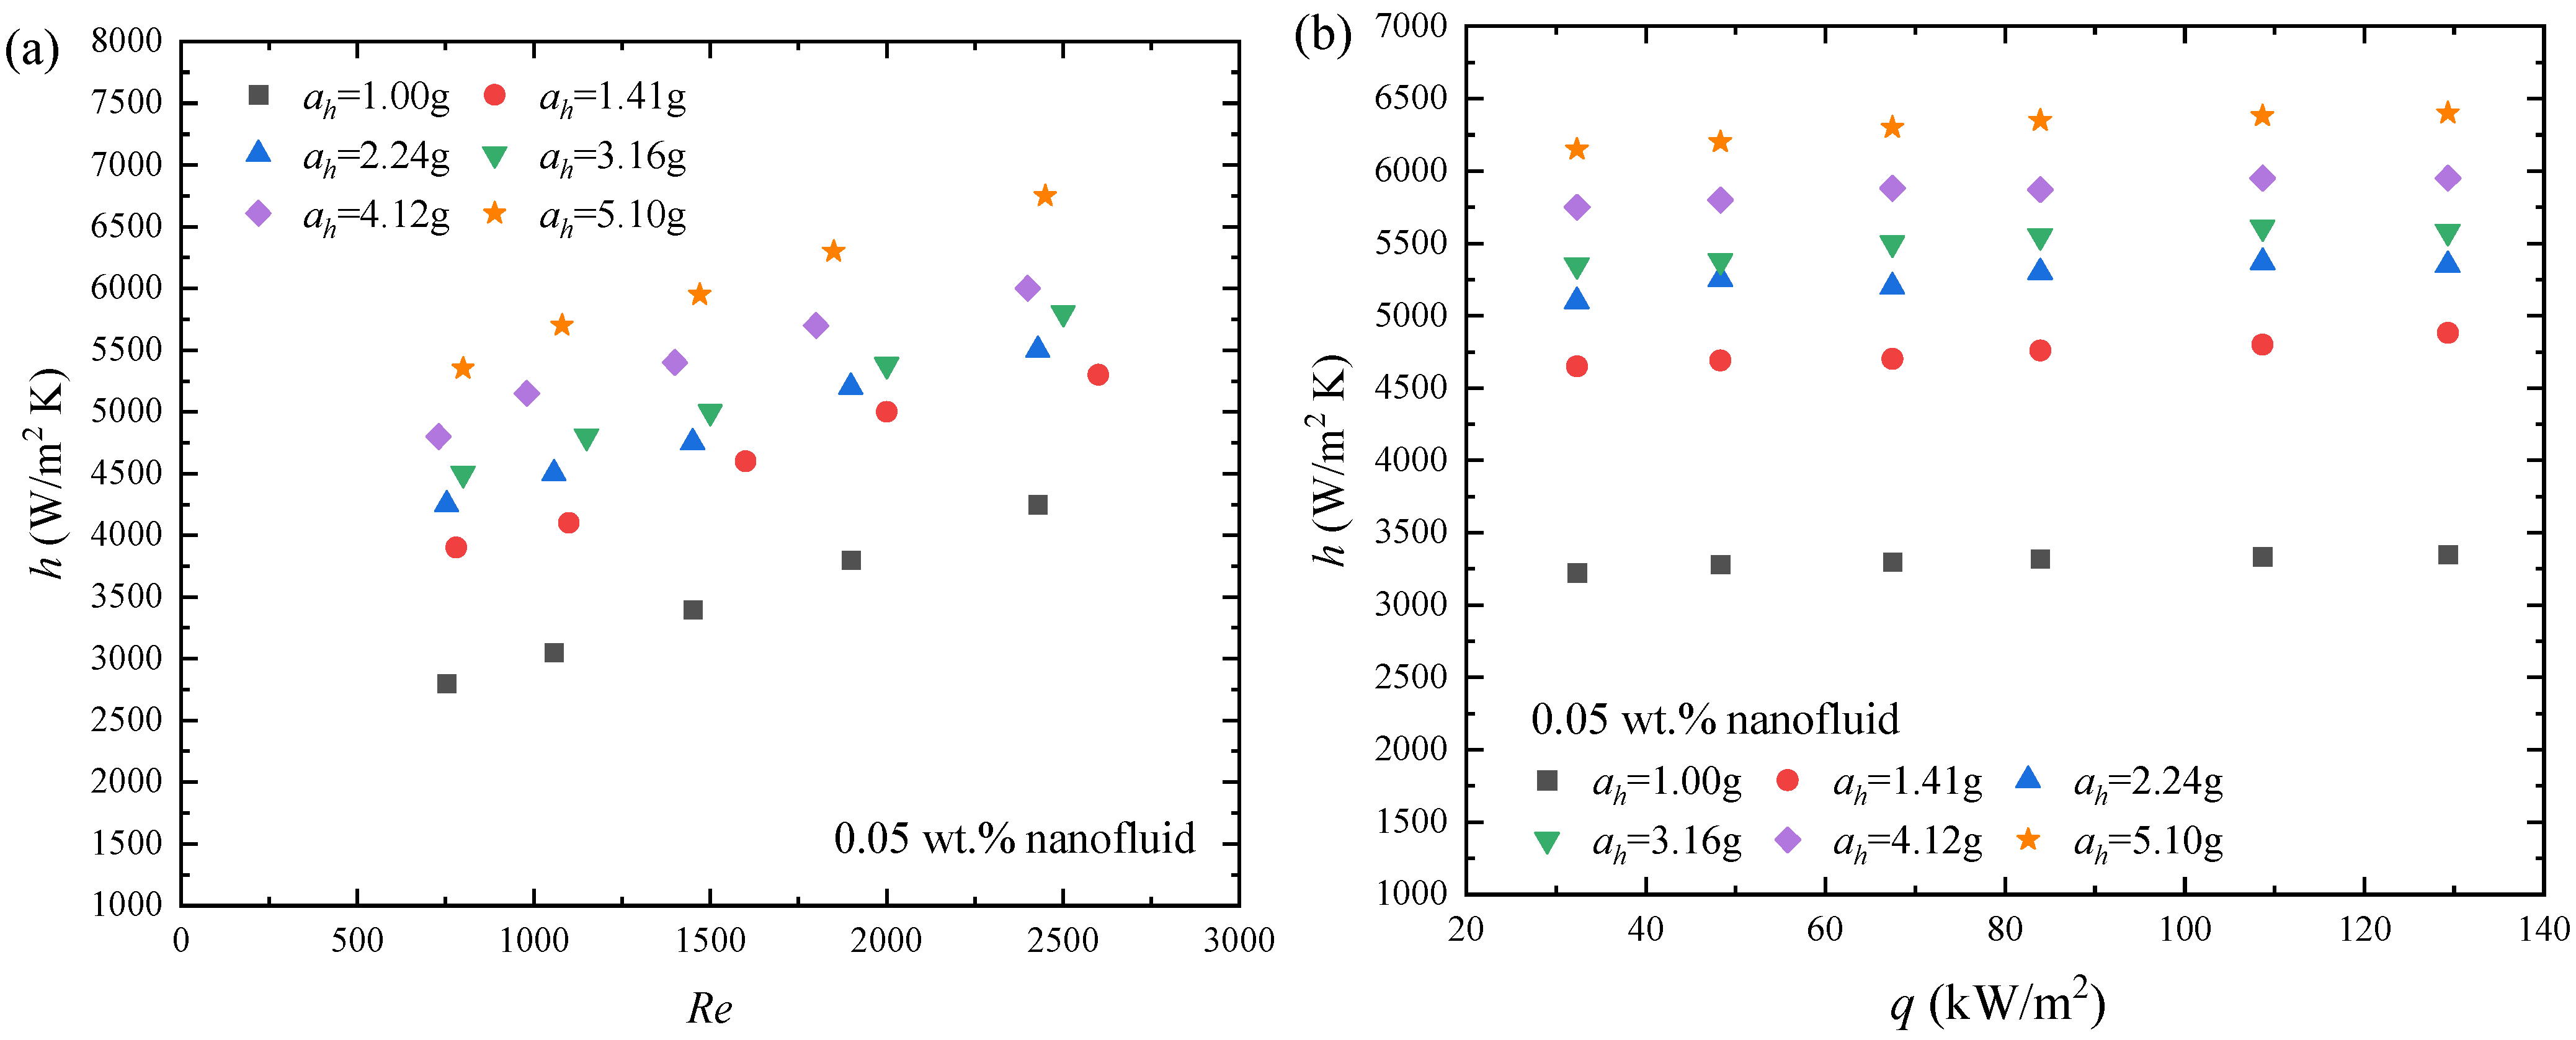
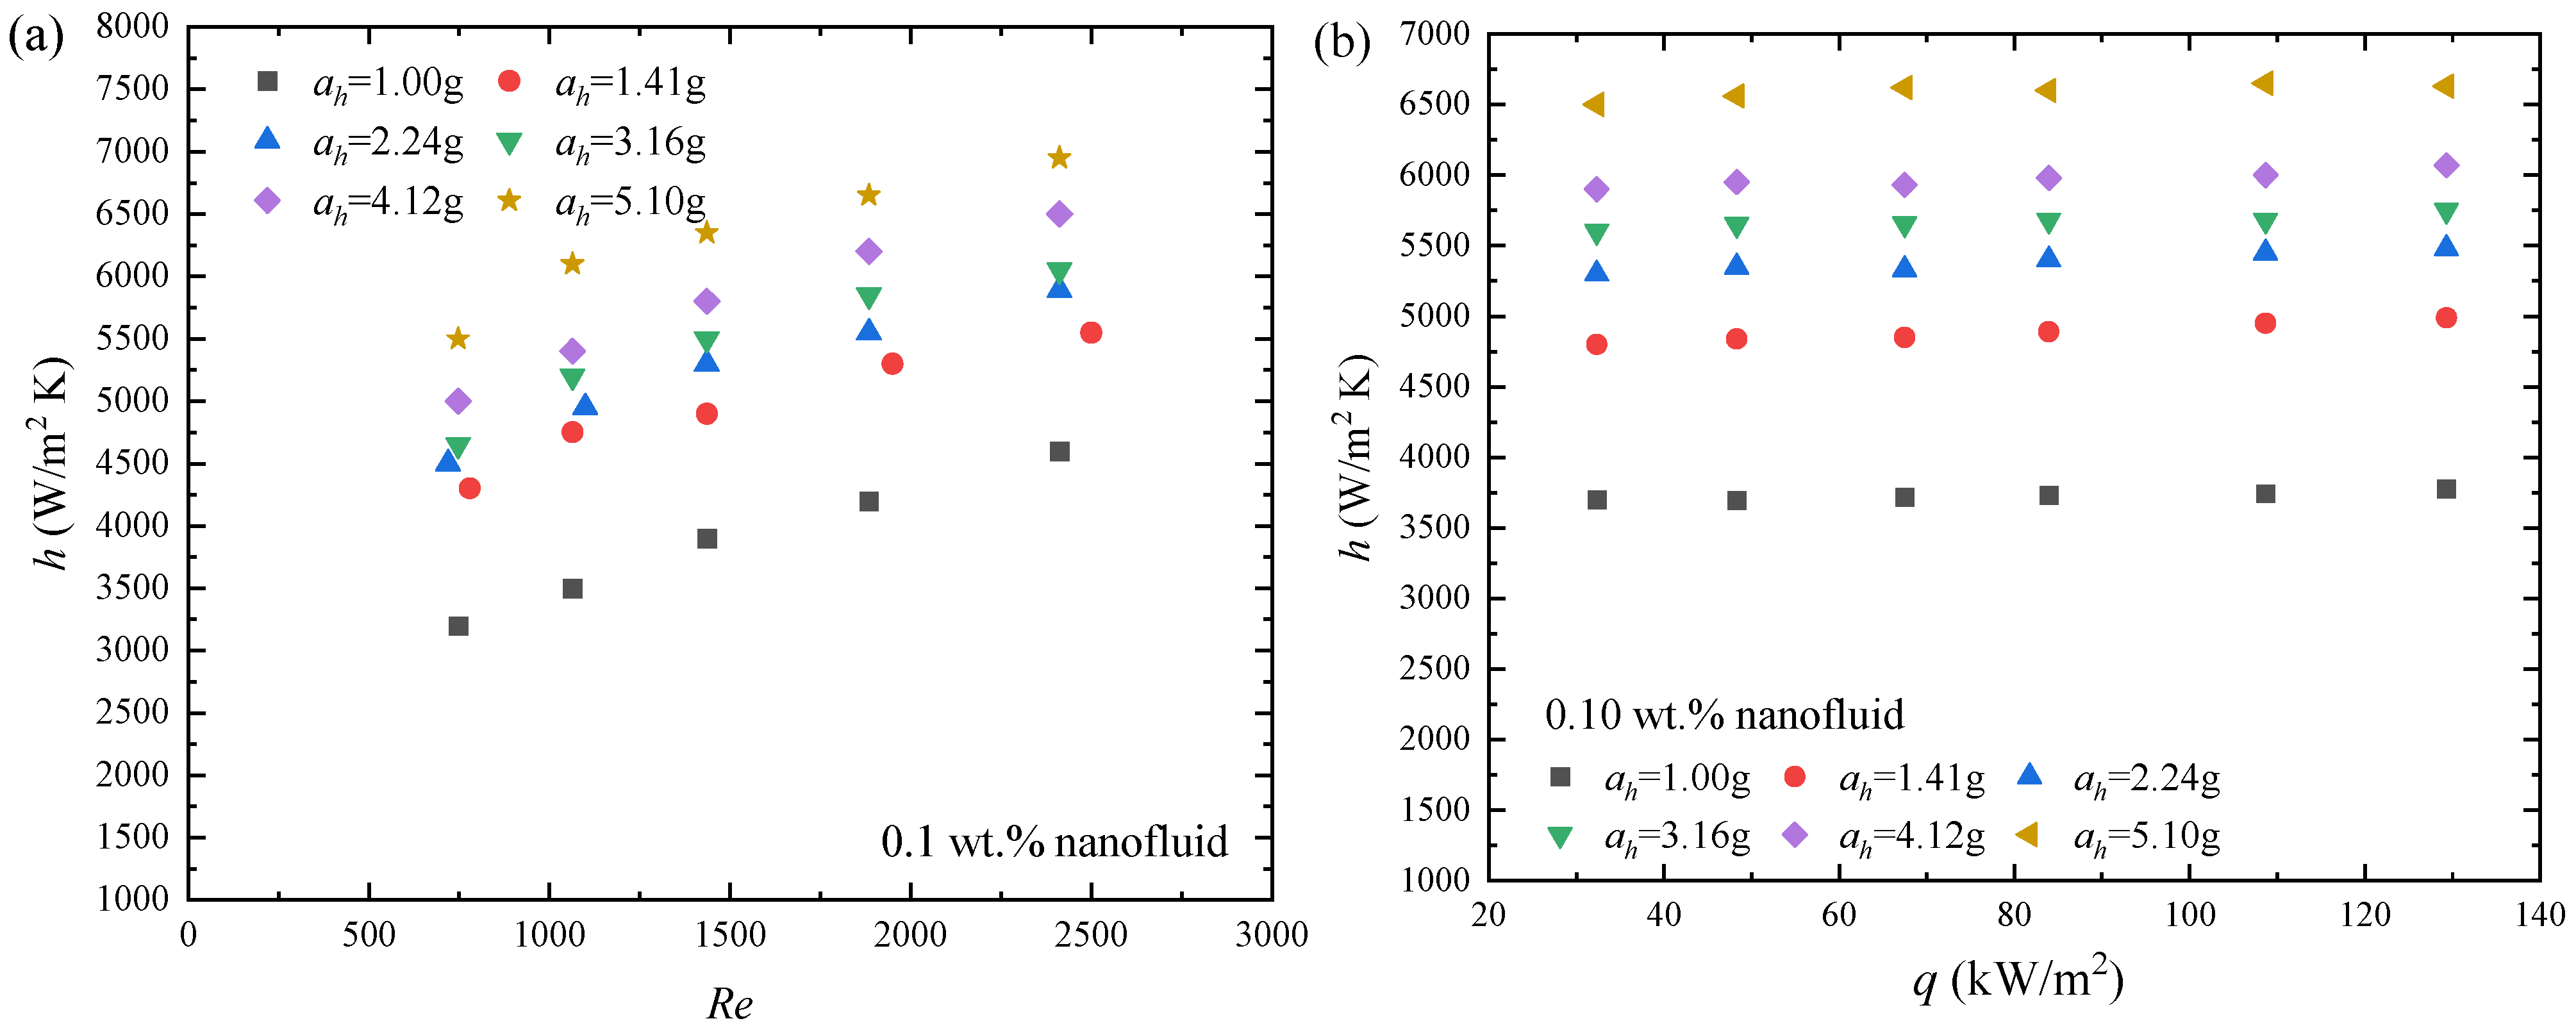
Figure 10, Figure 11 and Figure 12 depict the variation in the convective HTC for DI–water, 0.05 wt%, and 0.1 wt% nanofluid in forced convection under hypergravity accelerations of 1 g, 1.41 g, 2.24 g, 3.16 g, 4.12 g, and 5.1 g, plotted against the Reynolds number and heat flux. All heat transfer coefficient (h) values shown in Figure 10, Figure 11 and Figure 12 were obtained from the same experimental runs, with sub-figures (a) and (b) presenting different parameter dependencies of the same dataset for clarity. All measurements were obtained from the same experimental campaign under systematically varied operating parameters, ensuring data consistency and enabling direct comparison of the enhancement mechanisms. In addition, to avoid parameter coupling, all measurements were conducted under a multifactor experimental design, in which heat flux, Reynolds number, and nanoparticle concentration were systematically varied; in the analysis, the effect of one parameter (e.g., Re) was presented while the other factors (e.g., q) were held constant to ensure clarity and comparability.
Overall, the convective HTC increases with the increase in gravitational acceleration and Re, while remaining basically unchanged under different heat flux conditions. As observed in Figure 10, Figure 11 and Figure 12, the convective HTC for both water and Al2O3-water nanofluids exhibits a marked increase with elevating gravitational acceleration (ah), particularly pronounced in the transition from 1 g to 1.41 g with an enhancement factor of up to 40–50%. When the gravitational acceleration exceeds 1.41 g, the improvement rate gradually decreases and tends to stabilize around 5.1 g, which indicates that there is a saturation effect of the buoyancy-driven enhancement effect under supergravity conditions.
Theoretically, this elevation in HTC stems from the intensified buoyancy forces in hypergravity, which induce secondary flows perpendicular to the primary forced convection direction, thereby disrupting the thermal boundary layer and promoting fluid mixing. In horizontal tubes, the Grashof number (Grg) escalates with ah, leading to a higher buoyancy-to-inertia ratio (Gr/Re2), transitioning the flow from purely forced to mixed convection. The maximal enhancement between 1 g and 1.41 g corresponds to the critical threshold where buoyancy begins dominating near-wall dynamics; beyond this, viscous damping and turbulent saturation limit further gains. This gravity-dependent augmentation underscores the potential of nanofluids in hypergravity environments, such as aerospace applications, where tailored nanoparticle loadings could optimize thermal management by exploiting buoyancy-induced instabilities without excessive pressure penalties.
Li et al. [28] reported up to a 40% increase in the heat transfer coefficient of deionized water under 1–5 g conditions at low vapor qualities, attributing the enhancement to intensified secondary flow and near-wall turbulence. Similarly, Li et al. [36] and You et al. [37] demonstrated that Coriolis and buoyancy interactions in rotating smooth channels generate counter-rotating vortices that redistribute momentum and thermal energy, thereby increasing local Nusselt numbers on the leading and trailing walls. These studies collectively confirm that, as Gr/Re2 increases, secondary flow structures become more pronounced, promoting cross-channel mixing and augmenting convective heat transfer. The agreement between the present results and these earlier observations validates the interpretation that body-force-driven secondary flows are a key mechanism governing heat transfer enhancement under hypergravity.
In addition, the convective HTC for both water and nanofluids in horizontal tubes demonstrates a pronounced monotonic increase with rising Re, spanning laminar to turbulent regimes. The monotonic augmentation arises from the intensified inertial forces at elevated Re, which thin the hydrodynamic and thermal boundary layers, thereby reducing thermal resistance and enhancing convective transport. The Nusselt number (NuhD/k), inherently tied to Re via classical correlations like Dittus-Boelter (Equation (26)), predicts this scaling, as higher Re promotes turbulent mixing and eddy formation that advect heat more efficiently from the wall to the bulk fluid.
In Figure 10b, Figure 11b and Figure 12b, the convective HTC shows negligible variation with increasing heat flux, maintaining relative constancy across a range of 30–130 kW/m2 under fixed Reynolds numbers and hypergravity levels. This insensitivity arises from the fundamental definition of h (Equation (24)), where, in forced convection under constant heat flux boundary conditions, ΔT scales linearly with q to preserve equilibrium, rendering h invariant to heat flux magnitude. Also, Gnielinski correlation (Equation (32)) for transitional flows affirms that Nu—and thus h—depends primarily on Re, Pr, and f, independent of q in single-phase regimes where buoyancy effects are minimal or overwhelmed by inertial forces.
The discussion of nanoparticle clustering as a potential mechanism for enhanced heat transfer under hypergravity, while theoretically plausible, lacks direct experimental validation in this study, representing a significant limitation. The inference of clustering was based solely on indirect evidence: the nonlinear increase in thermal conductivity enhancement beyond predicted values at hypergravity (1–5 g) and the 15–20% deviation of experimental Nusselt numbers from single-particle models at elevated concentrations. Nevertheless, several recent studies support the plausibility of such behavior, with numerical and particle-scale analyses demonstrating that enhanced body forces and shear-induced collisions significantly accelerate aggregation kinetics [38], while experimental findings from centrifugation and rotating systems confirm that even moderate centrifugal acceleration can induce detectable clustering in nominally stable colloidal suspensions [39,40]. Additionally, Pyttlik et al. [41] highlighted that gravitational acceleration strongly influences aggregation dynamics—an effect expected to intensify under hypergravity conditions. Although these supporting studies collectively justify the qualitative interpretation of clustering tendencies under elevated acceleration, future work should incorporate in situ particle size measurements or post-test microscopy analysis to definitively confirm the clustering hypothesis proposed in this investigation.

5.2. Effect of Nanoparticle Concentrations on HTC

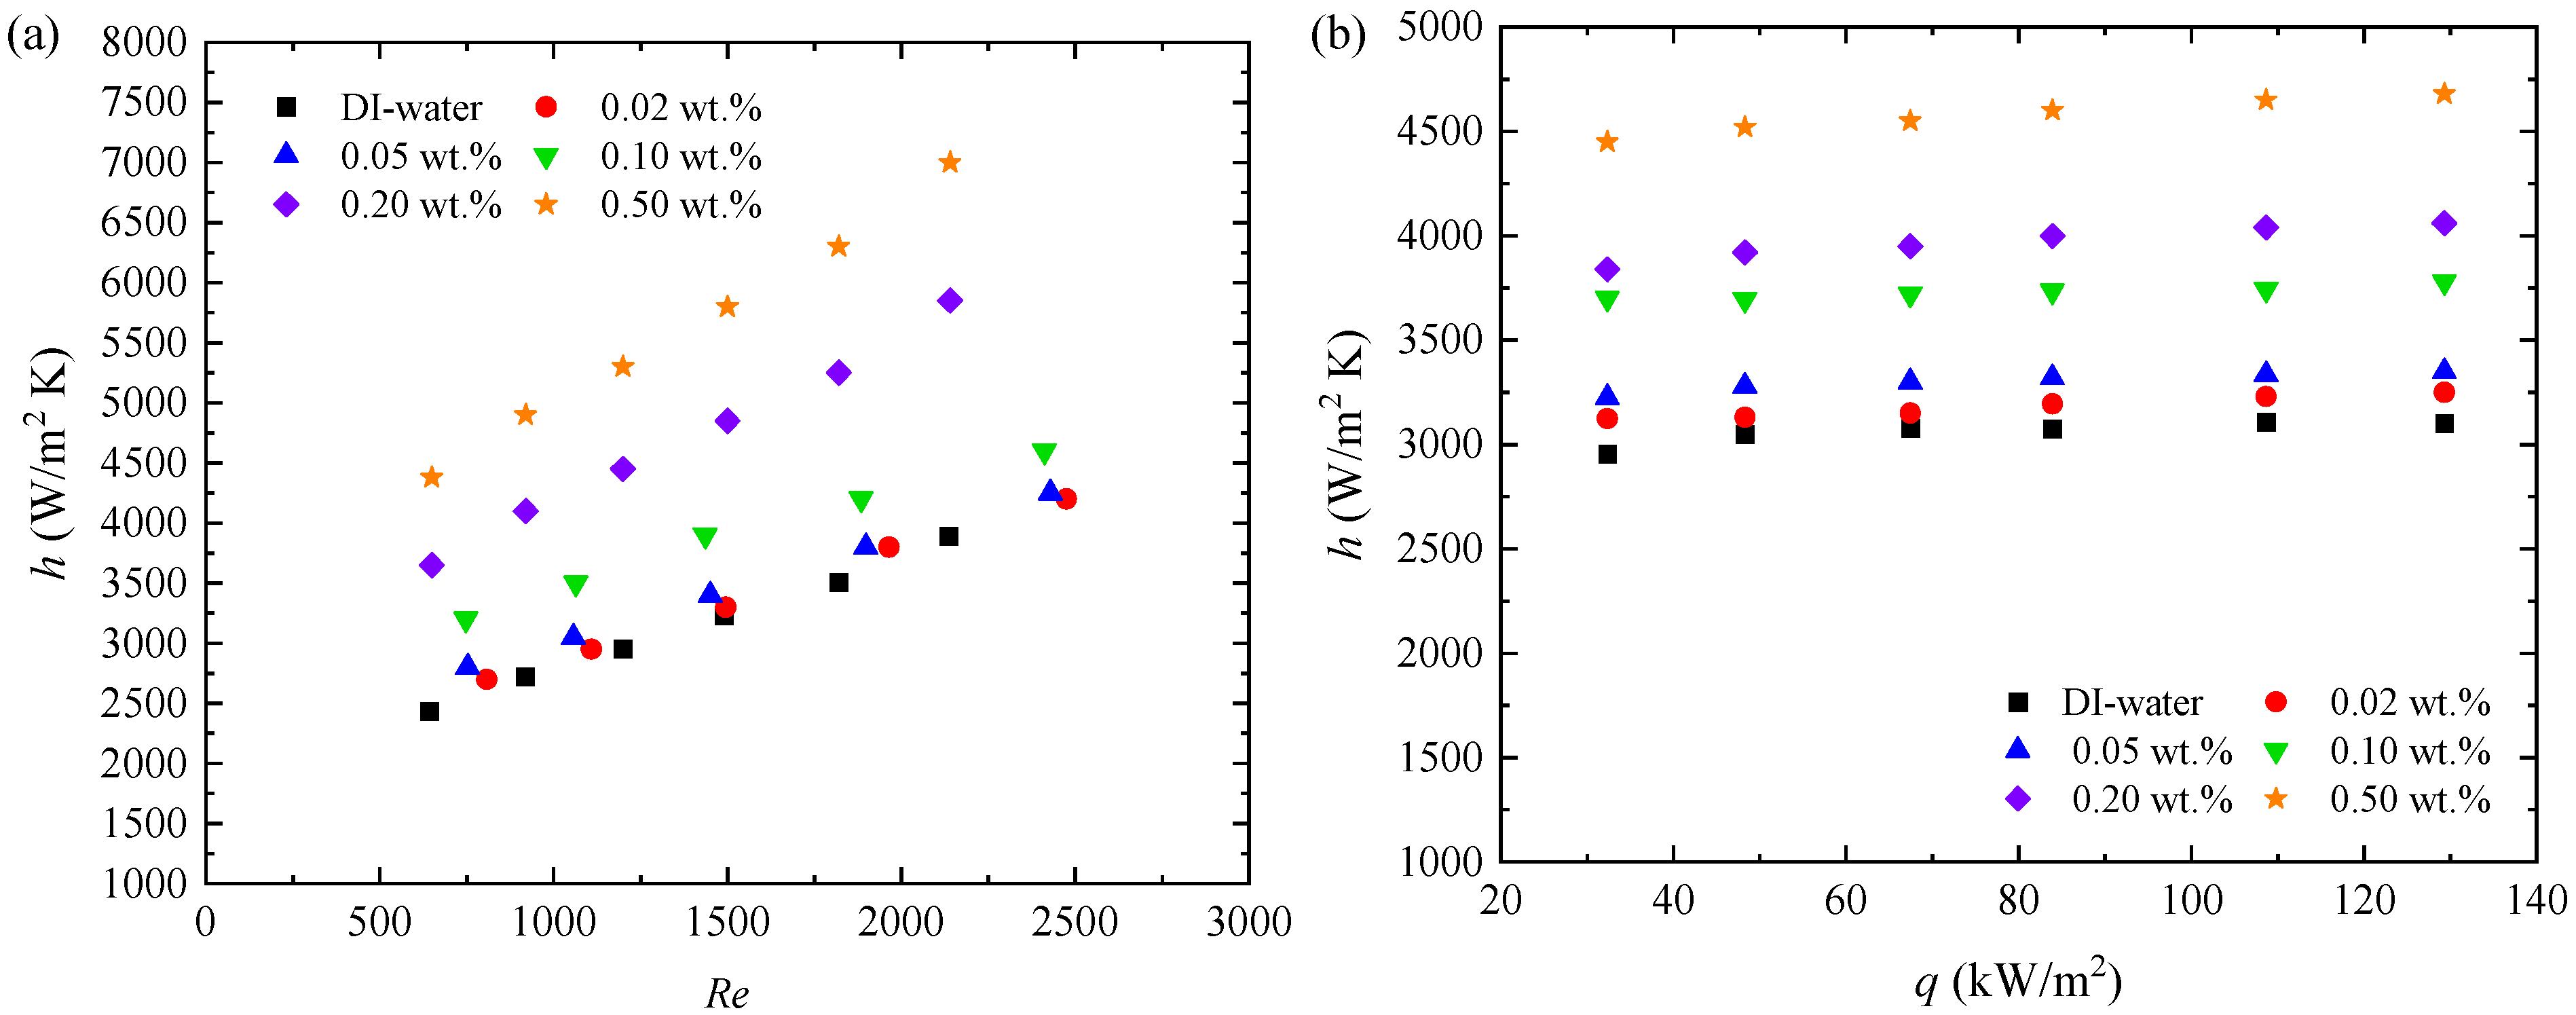
The results in Figure 13 reveal that the convection HTC exhibits a nonlinear enhancement with increasing nanoparticle concentration under normal gravity. At low loadings (<0.05 wt%), the improvement over water is marginal, primarily due to weak Brownian motion–induced mixing and minimal thermal conductivity increase. With moderate concentrations (0.1–0.2 wt%), h rises more significantly as nanoparticle interactions form conductive percolation networks, intensify phonon transport, and induce micro-convective eddies that thin the thermal boundary layer. At higher concentrations (0.5 wt%), clustering and chain-like agglomeration structures further boost effective thermal diffusivity, while viscosity growth promotes shear-induced mixing, jointly producing disproportionately large gains in h (up to 60%). Comparable studies have reported enhancements of 20–30% for TiO2–water nanofluids [25], 15–25% for CuO–water nanofluids [6], and up to 40% for hybrid Al2O3–TiO2 nanofluids [7]. These comparisons confirm that the enhancement observed in the present work is within the typical range reported in the literature, while also validating the effectiveness of Al2O3 nanoparticles in augmenting convective heat transfer.
These observations align with extended Maxwell–Garnett models where k e f f   φ 1 + α , reflecting nonlinear collective effects. From a mechanistic perspective, the enhancement stems from the interplay of Brownian motion and thermophoresis at low concentrations, percolation and clustering effects at intermediate concentrations, and viscosity-driven boundary layer disruption at high concentrations. Under hypergravity, these concentration-dependent mechanisms are further amplified by buoyancy-driven secondary flows. In addition, elevated concentration fosters Rayleigh–Bénard-like instabilities, enhancing convective mixing and yielding additional h improvements of 20–40%. This indicates a concentration-threshold phenomenon where nanoparticle networks and hypergravity-induced secondary flows act synergistically to maximize convective heat transfer.

5.3. Variation Trend of Flow Friction Factor Under Different Conditions

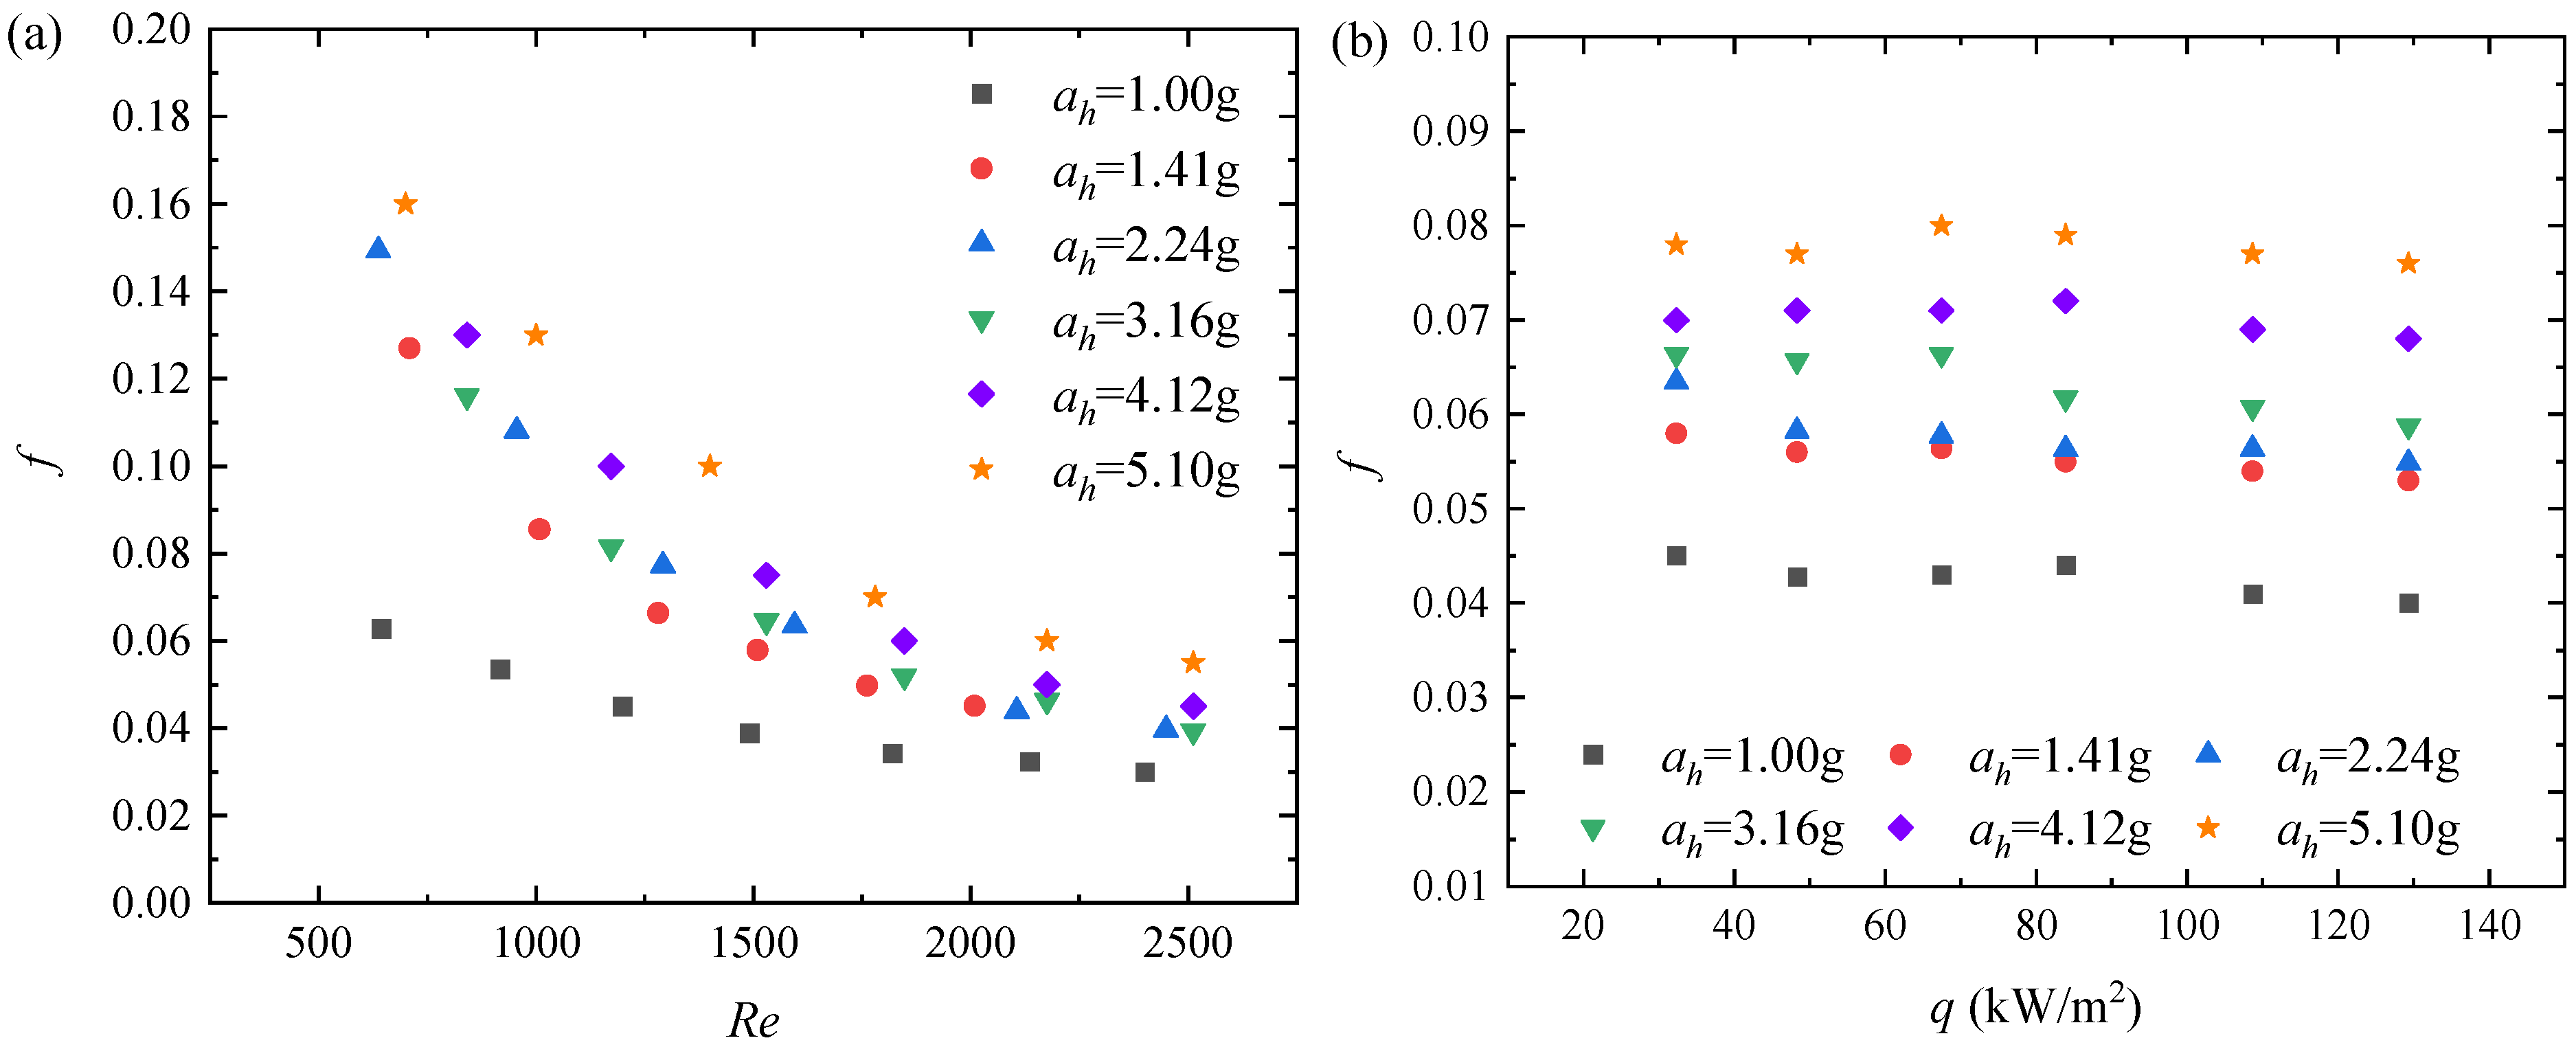
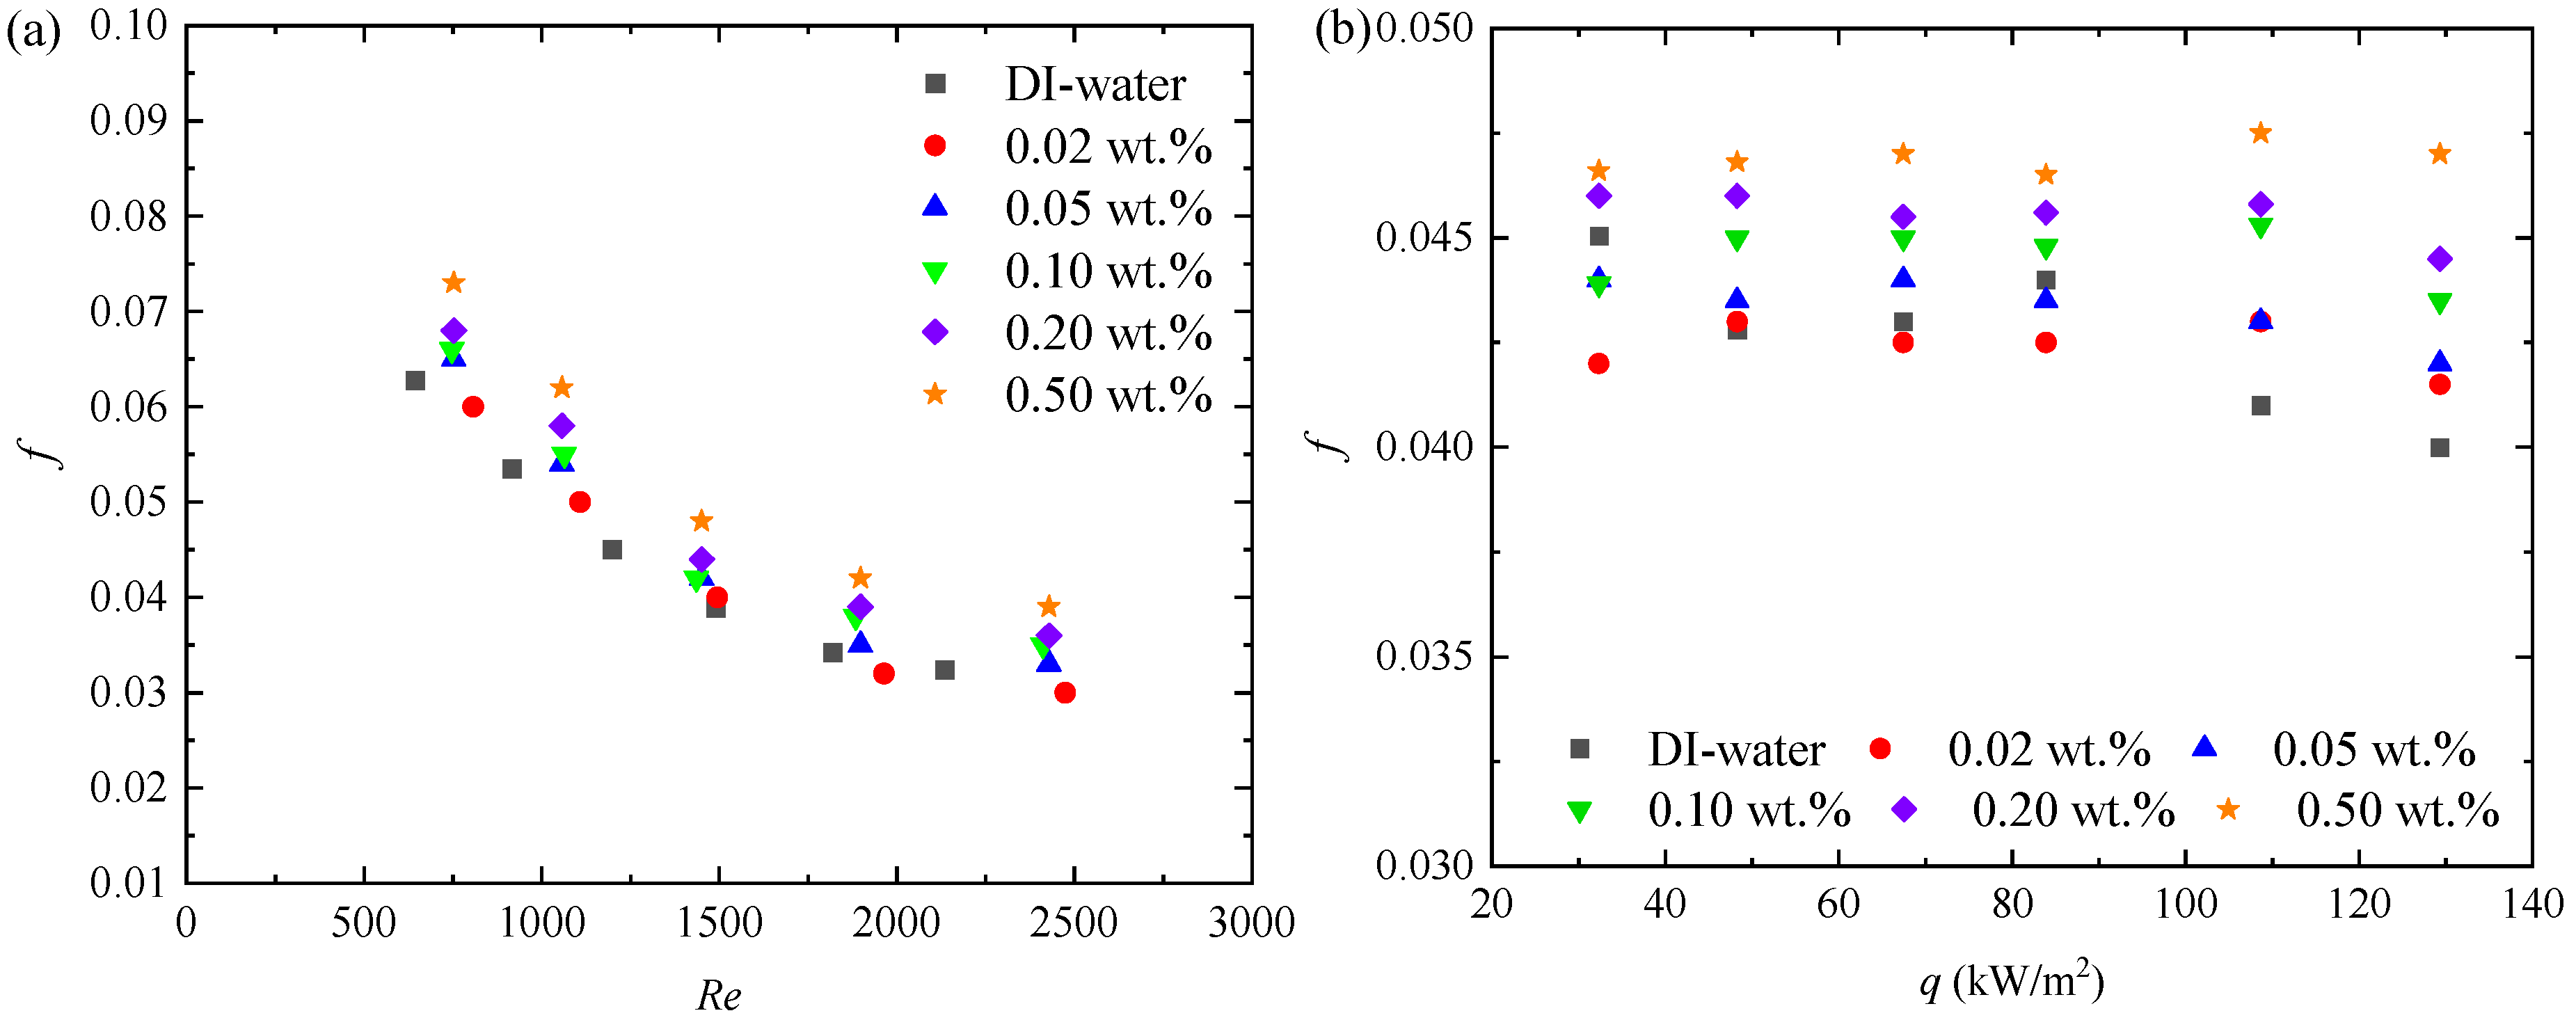
As illustrated in Figure 14 and Figure 15, the variation in the friction factor (f) with Reynolds number (Re) and heat flux (q) was analyzed at fixed q and Re, respectively, to isolate the influence of Re and q. Although Figure 14 and Figure 15 display the effect of a single parameter for clarity, the experiments were conducted under a multifactor design in which q, Re, and nanoparticle concentration were systematically varied. This approach ensures that the observed trends accurately reflect controlled parameter interactions.
The friction factor (f) for single-phase forced convection of water and Al2O3-water nanofluids in horizontal tubes displays a consistent increase with rising hypergravity acceleration from 1 g to 5.1 g, with nanofluids exhibiting slightly elevated f values across varying nanoparticle concentrations. Under fixed Reynolds numbers, f escalates by 20–150% in hypergravity, as evidenced by upward shifts in data clusters for higher ah, while maintaining a monotonic decline with increasing Re, where the rate of decrease diminishes in turbulent regimes, approaching asymptotic values. Notably, f remains virtually invariant to heat flux variations (30–130 kW/m2), with overlapping scatters indicating deviations within ±10% uncertainty. For nanofluids, incremental particle concentration induces a modest f augmentation of 5–15%, more pronounced at lower Re, highlighting concentration-dependent hydrodynamic penalties without altering the overall Re-scaling trends.
Theoretically, the augmentation of f with hypergravity stems from enhanced buoyancy-driven secondary flows that amplify wall shear stress in horizontal configurations. As the Grashof number intensifies, buoyancy induces transverse vortices perpendicular to the axial flow, thickening the velocity boundary layer and elevating frictional resistance, particularly in transitional Re ranges where mixed convection prevails (Gr/Re2 > 0.1). This effect is accentuated in nanofluids due to nanoparticle agglomeration under gravitational forces, which locally increases effective viscosity near the wall, thereby exacerbating drag. The pronounced decline in f with escalating Re reflects the transition from laminar to turbulent flow, where inertial forces dominate viscous effects, thinning the boundary layer and reducing relative wall friction per unit velocity. Classical correlations like Blasius ( f 0.316 R e 0.25 for smooth tubes) predict this inverse scaling, with the diminishing decrement arising from fully developed turbulence at high Re, where eddy viscosity stabilizes shear profiles. In hypergravity, this Re-dependence persists but with elevated baselines, as buoyancy perturbations introduce additional momentum dissipation without fundamentally altering the inertial scaling. The insensitivity of f to heat flux aligns with the hydrodynamic nature of the friction factor in single-phase convection, governed solely by velocity and density fields rather than thermal gradients. Since q primarily influences temperature profiles without perturbing the isothermal-like momentum equation in forced flows, ΔT variations do not feed back into shear stress, preserving f constancy as confirmed by the flux-independent scatters.
For nanofluids, the slight f increase with nanoparticle concentration originates from augmented effective viscosity and density, which heighten frictional losses via modified shear rates at the wall. Einstein’s viscosity model (Equation (14)) and similar extensions for nanofluids predict this modest rise, compounded by particle-fluid interactions that promote near-wall clustering, particularly at low Re where diffusive effects dominate, yielding the observed concentration-dependent offsets in Figure 15.

5.4. Comparative Analysis of Existing Correlations and Machine Learning Algorithms

In predictive modeling for complex engineering systems, traditional empirical correlations and modern machine learning (ML) algorithms represent complementary paradigms with distinct strengths and limitations. Empirical correlations, distilled from decades of experimental observations and theoretical frameworks, provide transparent algebraic forms with parameters that map directly to physical phenomena, enabling interpretability and straightforward implementation in engineering practice. These correlations, such as the Dittus-Boelter, Gnielinski, and Sleicher-Rouse equations for heat transfer, encapsulate fundamental physics through dimensionless groups (Reynolds, Prandtl, Nusselt numbers) that engineers can readily interpret. However, their inherent simplicity often constrains predictive fidelity when systems exhibit high dimensionality, strong nonlinearity, or intricate multi-physics interactions that cannot be adequately captured by predetermined functional forms. Machine learning algorithms, by contrast, learn patterns directly from data without requiring explicit governing equations, thereby capturing subtle interdependencies and higher-order effects that traditional correlations may systematically omit. This data-driven approach proves particularly advantageous when the underlying physics is poorly characterized, analytically intractable, or involves emergent phenomena arising from complex interactions. Among ML algorithms, ensemble methods such as random forest (RF) and extreme gradient boosting (XGBoost) have demonstrated exceptional performance in engineering applications, consistently outperforming both traditional correlations and simpler ML models.
RF operates as an ensemble learning method that constructs multiple decision trees during training and outputs predictions through averaging (regression) or majority voting (classification). The algorithm introduces randomness through bootstrap sampling and feature subsampling, which reduces overfitting and improves generalization. For a dataset with N samples and M features, the Random Forest algorithm proceeds as follows:
a. Bootstrap Sampling: Generate B bootstrap samples by randomly sampling N instances with replacement from the original dataset.
b. Tree Construction: For each bootstrap sample b = 1, 2, …, B, at each node, randomly select m features (mM), typically m = √M for classification or m = M/3 for regression. The final number of features (m) was determined by systematically testing different combinations and selecting those that achieved the best trade-off between predictive accuracy and physical interpretability, thereby ensuring both statistical robustness and consistency with the underlying heat transfer mechanisms. Then, find the best split among these m features using a splitting criterion (e.g., mean squared error for regression), and grow the tree to maximum depth without pruning.
c. Prediction: For regression tasks, the final prediction is
y ^ R F = 1 B b = 1 B T b x
where T b x represents the prediction of the b-th tree for input x. The splitting criterion for regression trees minimizes the mean squared error:
M S E node = 1 n node i node y i y ¯ node 2
where n node is the number of samples in the node and y ¯ node is the mean of target values in that node.
XGBoost implements a sophisticated gradient boosting framework that builds trees sequentially, with each tree learning from the residuals of previous iterations. The algorithm incorporates regularization terms to prevent overfitting and uses a second-order Taylor expansion for optimization. The XGBoost objective function combines a loss function with regularization:
L ( t ) = i = 1 n l y i , y ^ i ( t 1 ) + f t ( x i ) + Ω ( f t )
where l is a differentiable convex loss function, y ^ i ( t 1 ) is the prediction at iteration (t − 1), f t is the new tree added at iteration t, Ω ( f t ) is the regularization term as follows:
Ω ( f t ) = γ T + 1 2 λ j = 1 T w j 2
where T is the number of leaves in the tree, w j represents the weight of leaf j, and γ and λ are regularization parameters. Using second-order Taylor expansion, the objective becomes:
L ( t ) i = 1 n g i f t ( x i ) + 1 2 h i f t 2 ( x i ) + Ω ( f t )
where gi and hi is the first-order gradient and the second-order gradient (Hessian), respectively.
g i = l ( y i , y ^ i ( t 1 ) ) y ^ i ( t 1 )
h i = 2 l ( y i , y ^ i ( t 1 ) ) ( y ^ i ( t 1 ) ) 2
The optimal weight for leaf j is
w j * = i I j g i i I j h i + λ
where Ij represents the set of instances in leaf j. The final XGBoost prediction after K iterations is
y ^ X G B = k = 1 K f k x
To quantitatively assess model performance, several statistical metrics are employed:
(1) Coefficient of determination (R2):
R 2 = 1 i = 1 n y i y ^ i 2 i = 1 n y i y ¯ 2 = 1 S S r e s S S t o t
where y i is the observed value, y ^ i is the predicted value, y ¯ is the mean of observed values, S S r e s is the residual sum of squares, and S S t o t is the total sum of squares.
(2) Mean squared error (MSE):
MSE = 1 n i = 1 n y i y ^ i 2
(3) Root mean squared error (RMSE):
RMSE = MSE = 1 n i = 1 n y i y ^ i 2
(4) Mean absolute error (MAE):
MAE = 1 n i = 1 n y i y ^ i
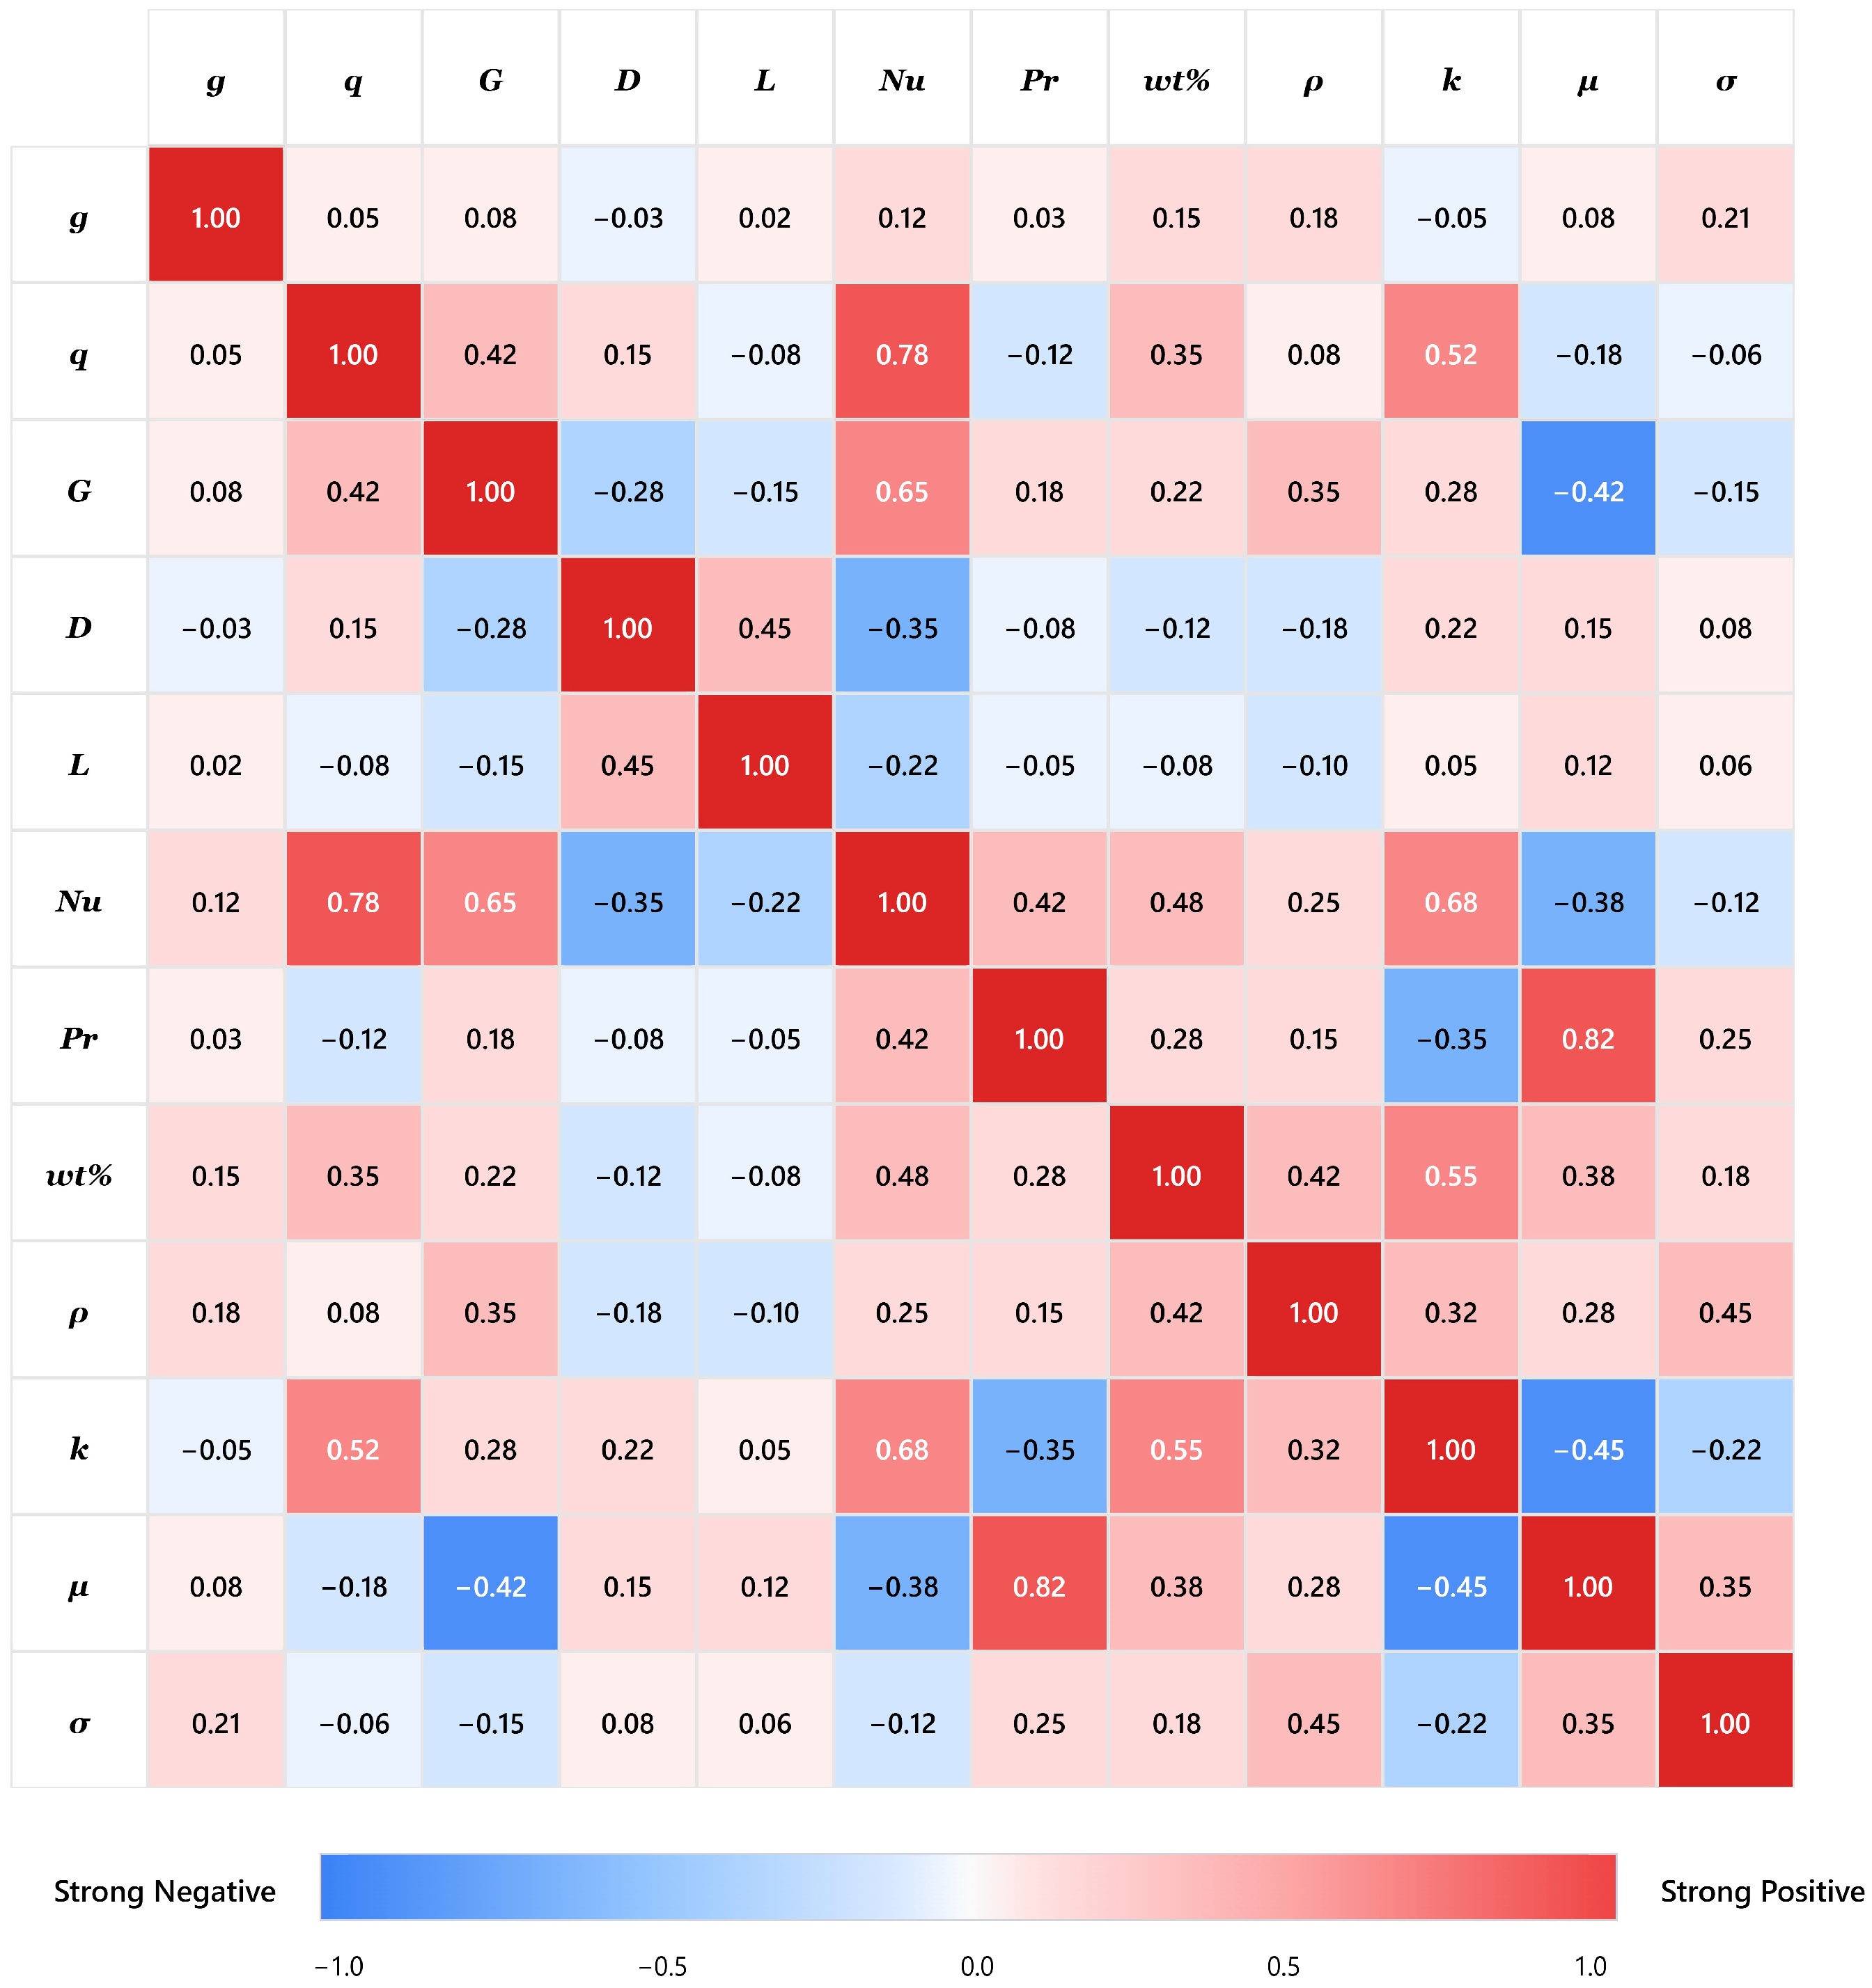
The correlation heatmap in Figure 16 reveals intricate interdependencies among experimental parameters and nanofluid properties in heat transfer systems, reflecting fundamental physical principles governed by fluid dynamics and thermodynamics. The strong positive link between Nusselt number (Nu) and heat flux density (q) at 0.78 reflects enhanced buoyancy-driven turbulence at higher q, amplifying convective heat transfer via intensified boundary layer mixing, as governed by Fourier’s law and energy conservation. Similarly, Nu’s correlation with mass flux (G) at 0.65 indicates forced convection dominance, where increased flow velocity reduces thermal resistance through thinner boundary layers, aligning with Reynolds number effects. Moderate positive ties of Nu to nanoparticle concentration (wt%) at 0.48 stem from augmented thermal properties: wt% correlates with density (ρ) at 0.42 due to denser nanoparticles increasing overall fluid mass, with thermal conductivity (k) at 0.55 from improved heat percolation networks via Brownian motion, viscosity (μ) at 0.38 from heightened frictional interactions, and surface tension (σ) at 0.18 possibly from minor surfactant-like effects. Weak Nu-g correlation (0.12) suggests limited gravity influence in forced flows, while negative Nu-D (−0.35) and Nu-L (−0.22) imply scale effects, where larger dimensions dilute convective efficiency via thicker layers or entrance effects.
At a deeper theoretical level, these correlations stem from conservation laws in Navier–Stokes equations coupled with energy transport, where nonlinearities arise from multiphase interactions in nanofluids—modeled via effective medium theory for properties like k and μ. The underlying algorithmic logic for this heatmap employs Pearson’s correlation coefficient, computing linear associations as
r x y = ( x i x ¯ ) ( y i y ¯ ) ( x i x ¯ ) 2 ( y i y ¯ ) 2
which assumes normality and linearity but may overlook causal nonlinear effects addressable by mutual information or causal inference algorithms. From the machine learning perspective, these complex multi-parameter coupling relationships represent precisely what traditional correlations struggle to capture accurately. The cross-correlations between Prandtl number and multiple parameters indicate a high-dimensional nonlinear feature space, which ensemble algorithms like RF and XGBoost can adaptively identify through feature combinations and hierarchical decision tree structures. This non-monotonic behavior exemplifies where tree-based algorithms excel through recursive partitioning, naturally capturing regime transitions and interaction effects that fixed-form correlations cannot represent without explicit modification terms.
To prevent overfitting and ensure reproducibility, the complete dataset was randomly divided into 80% training and 20% testing subsets using stratified sampling with respect to gravity level, Reynolds number, and nanoparticle concentration. This stratification ensured balanced representation across key experimental variables, such as approximately equal proportions of data points from each gravity level (1 g–5.1 g), Reynolds number range (500–30,000), and nanoparticle concentration (0.02–0.5 wt%), to mitigate bias in underrepresented regimes. A fixed random seed (e.g., seed = 42) was used for all splits via scikit-learn’s train_test_split function, allowing exact replication of the partitioning.
All hyperparameter tuning was conducted exclusively on the training subset through five-fold stratified cross-validation (via scikit-learn’s GridSearchCV with the same stratification criteria as the train-test split), where the MAE and R2 across folds were used as performance criteria. For each fold, the training subset was further divided into five equal parts, with four folds used for training and one for validation; this process was repeated five times, and the average MAE and R2 across folds were used to select the optimal hyperparameters. This approach yielded stable performance (standard deviation of R2 < 0.02 across folds), confirming the models’ robustness. Model complexity was controlled through regularization and early stopping: Random Forest employed limited tree depth and minimum leaf size, while XGBoost used shrinkage (learning rate), subsampling, and L1/L2 penalties. Out-of-bag (OOB) and cross-validation errors were monitored to detect variance between training and validation sets.
After optimal hyperparameters were identified, each model was retrained on the full training dataset and evaluated once on the independent held-out test set to report unbiased generalization metrics. Repeated runs with different random seeds confirmed the stability of performance metrics, demonstrating that the reported accuracy reflects true model generalization rather than overfitting to the experimental data.
Table 2 and Table 3 illustrate the predictive performance of empirical correlations and ML algorithms for heat transfer in nanofluid systems under different gravity conditions, with Table 2 focusing on normal gravity (ah = 1 g) and Table 3 extending to hypergravity (ah = 1–5.1 g). Apparent phenomena show that in Table 2, empirical models like Dittus-Boelter (R2 = 0.8124, MAE = 10.82%) and Gnielinski (R2 = 0.9215, MAE = 6.52%) exhibit moderate accuracy, but ML methods such as RF (R2 = 0.9658, MAE = 3.85%) and XGBoost (R2 = 0.9812, MAE = 2.74%) significantly outperform them with higher R2 and lower MSE/RMSE/MAE, indicating tighter fits to experimental data. In Table 3, overall performance degrades across all models due to increased gravitational variability—empirical correlations drop sharply (e.g., Dittus-Boelter R2 = 0.5328, MAE = 24.86%), while ML retains relative superiority (XGBoost R2 = 0.9542, MAE = 5.42%) but with inflated errors, reflecting broader scattering in predictions under dynamic conditions.
Underlying mechanisms stem from the inherent limitations of empirical correlations, which rely on simplified algebraic forms derived from dimensional analysis and assume quasi-linear relationships in standard gravity, failing to capture nonlinear multiphase interactions, buoyancy effects, and gravity-induced flow instabilities in hypergravity scenarios governed by modified Navier–Stokes equations. ML algorithms like RF and XGBoost, through ensemble learning and gradient boosting, inherently model complex, data-driven patterns including higher-order dependencies and feature interactions, enabling better generalization across gravity regimes by minimizing residuals via iterative optimization and regularization, thus explaining their consistent edge despite environmental complexities.
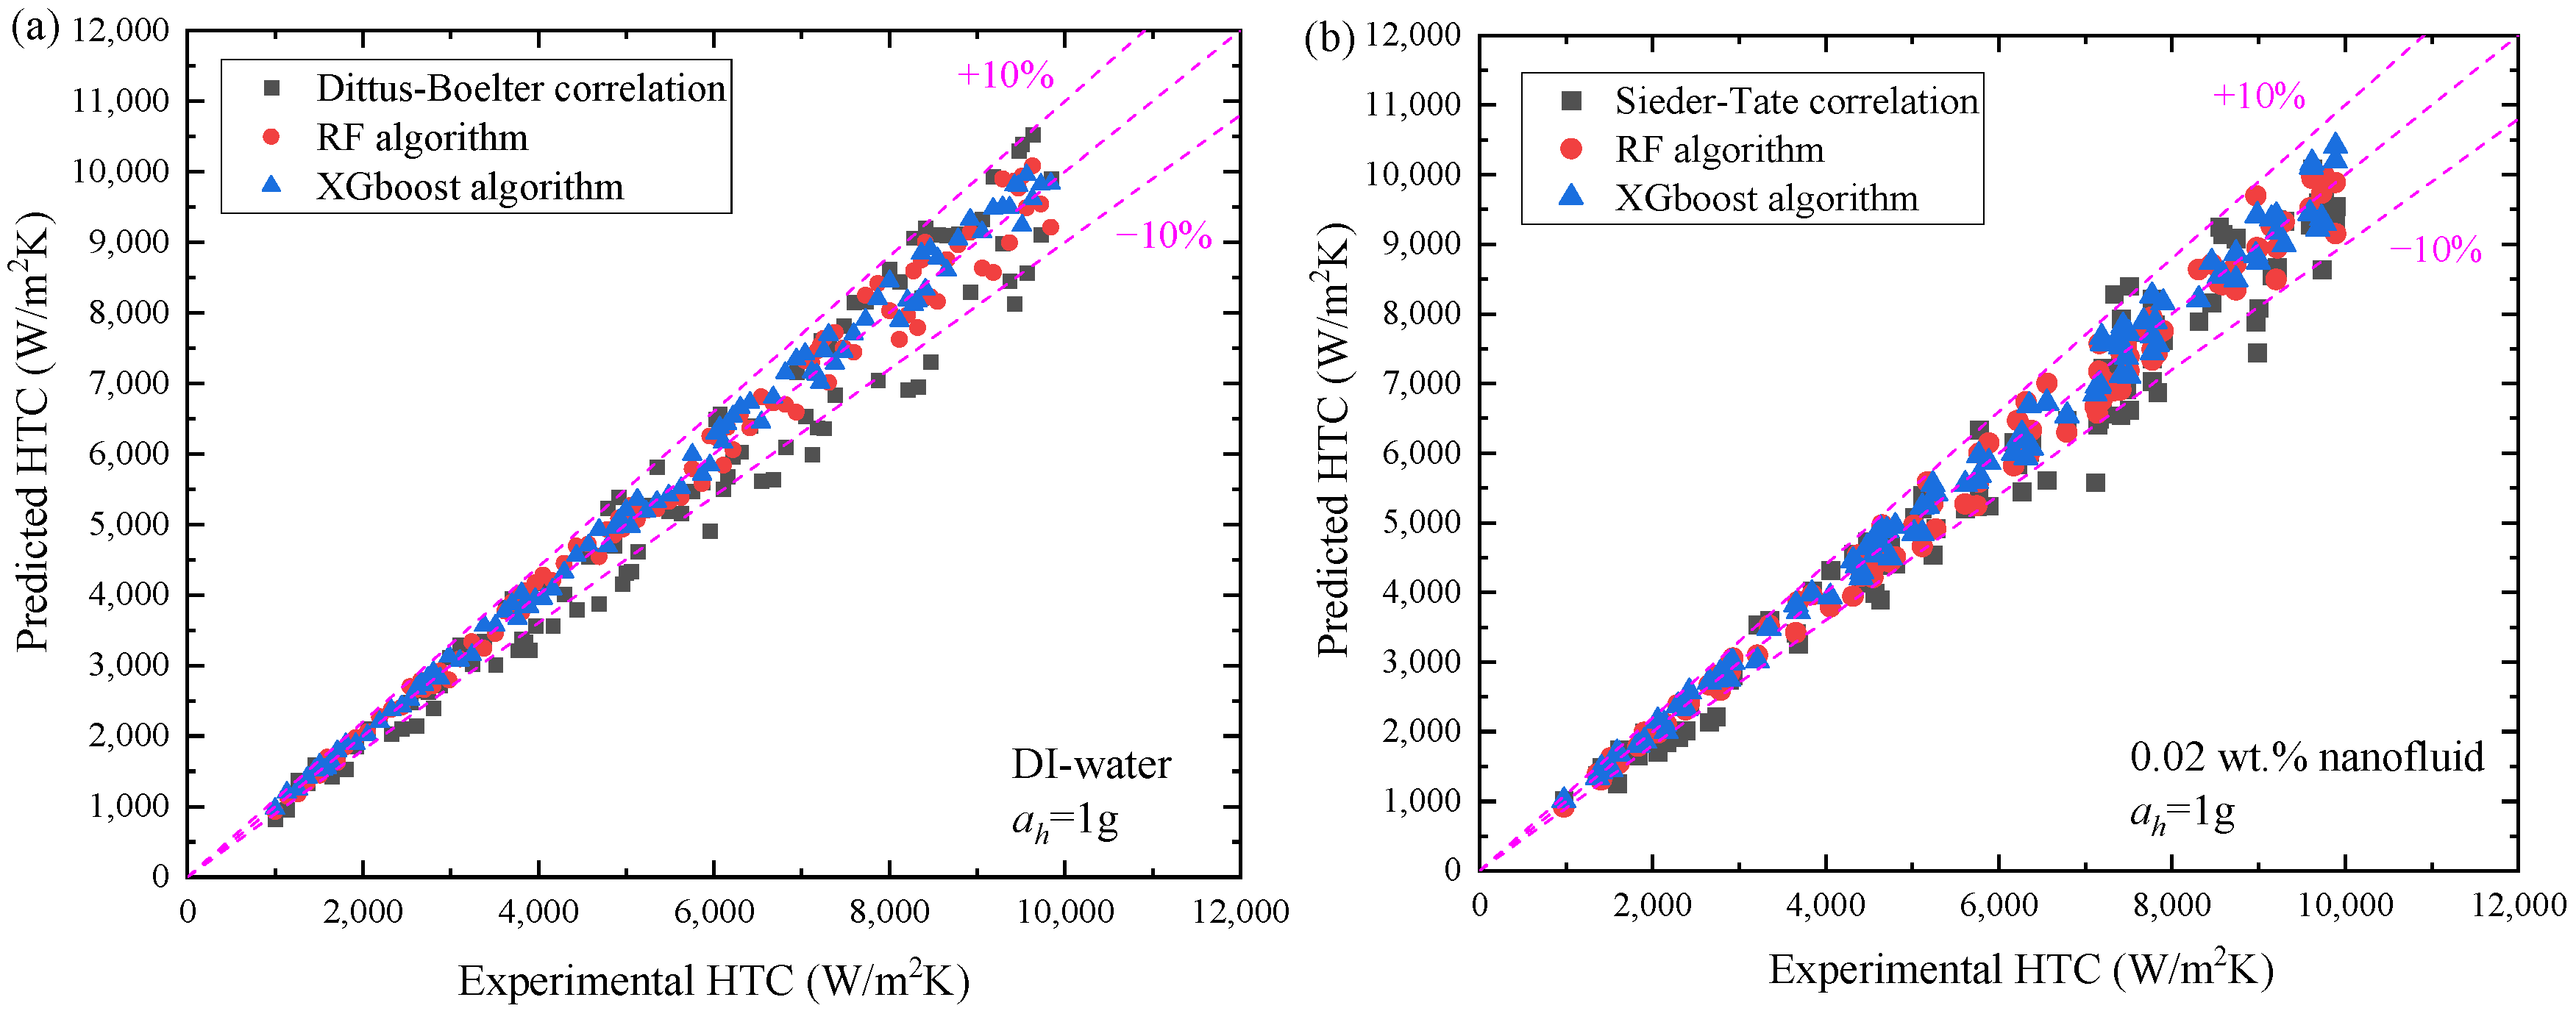
The superior performance of machine learning algorithms under normal gravity conditions stems from their fundamental ability to capture nonlinear interactions between multiple transport mechanisms. While Dittus-Boelter and Sieder-Tate correlations rely on fixed power-law relationships between dimensionless numbers ( N u R e 0.8 · P r n ), they inherently assume similarity in flow structure and heat transfer mechanisms across all operating conditions. Figure 17 reveals that empirical correlations systematically underpredict at higher heat transfer coefficients, where enhanced turbulence and nanoparticle-induced effects become dominant. This limitation arises because traditional correlations were developed from limited datasets and cannot adapt their functional form to accommodate regime transitions or coupling effects between thermal conductivity enhancement and viscosity modification in nanofluids. The tree-based ensemble algorithms demonstrate remarkable accuracy (R2 > 0.96, as shown in Table 4) by constructing hierarchical decision boundaries that naturally partition the parameter space into regions with distinct heat transfer characteristics. The 70% reduction in MAE achieved by XGBoost compared to empirical correlations reflects its ability to implicitly model interaction terms that traditional correlations neglect. For instance, the algorithm can identify that nanoparticle concentration effects vary with Reynolds number due to changes in particle distribution and aggregation dynamics under different flow conditions. This data-driven approach excels particularly in the intermediate regime where neither pure forced nor natural convection dominates, automatically discovering the optimal weighting between different heat transfer mechanisms without requiring predefined transition criteria.
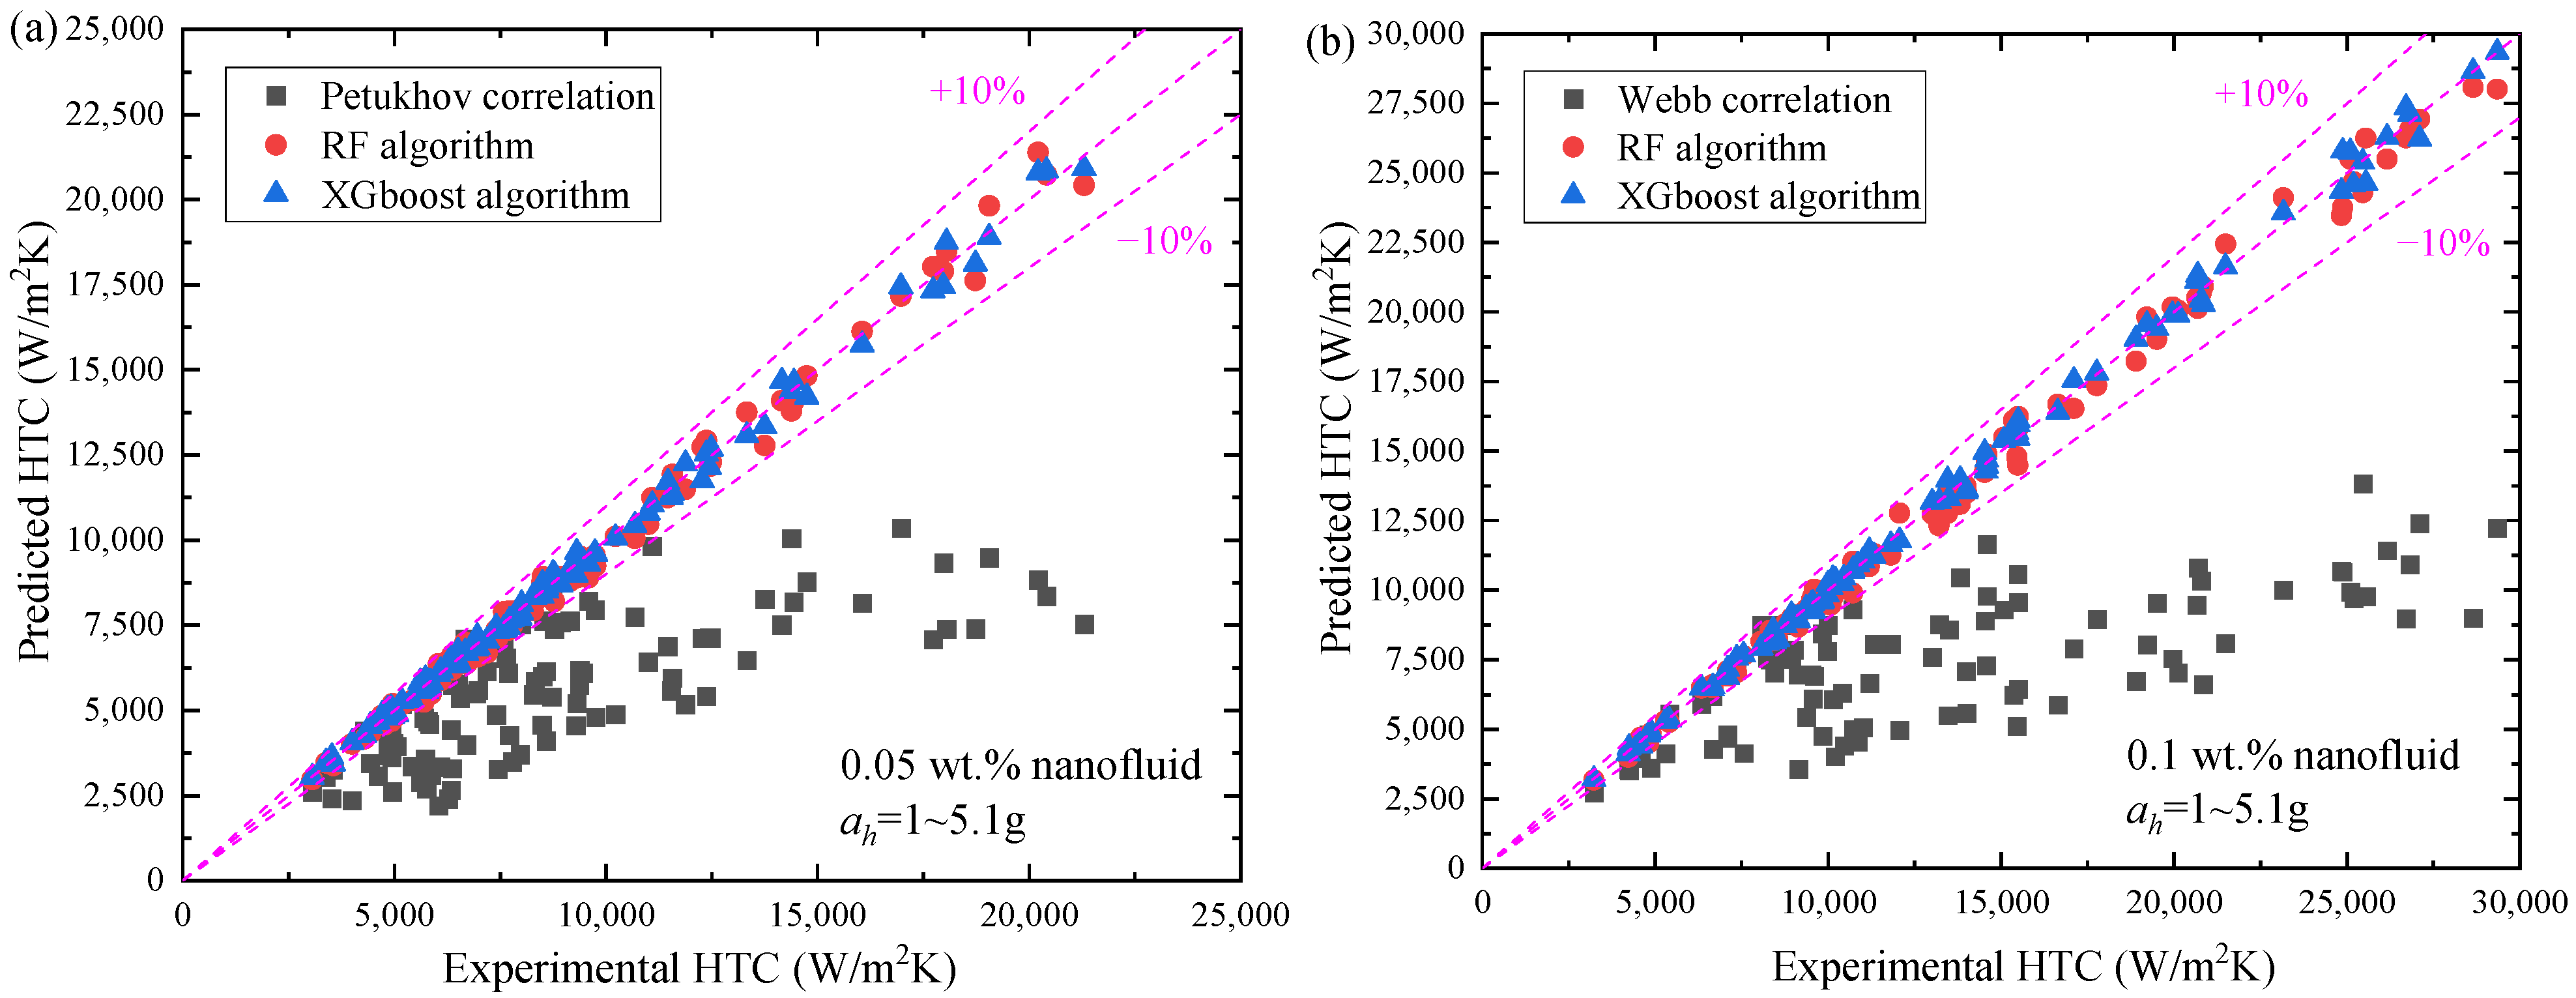
Classical correlations (Petukhov, Webb) embed assumptions calibrated near 1 g self-similar turbulence, gravity-neutral heat transfer scaling with Re and Pr only. When ah is elevated, additional acceleration parameters (e.g., Richardson/Grashof-like effects, and centrifugal pressure gradients) shift the friction and heat-transfer balance, thus, the fixed exponents and coefficients underpredict high-flux data and show systematic bias and spread outside ±20% in Figure 18, and reflected by low R2 ≈ 0.59–0.62 and high MAE ≈ 20–22% in Table 5. RF and XGBoost models learn nonlinear interactions among Re, Pr, G, q, and hypergravity indicators without enforcing a rigid form. RF reduces variance via bagging but treats feature interactions piecewise, and XGBoost adds trees sequentially to fit residuals, capturing smooth and cross-term effects and heteroscedasticity, yielding tighter clustering along the 45° line. Consequently, XGBoost attains the best fidelity (R2 ≈ 0.95, MAE ≈ 5.42%), followed by RF (R2 ≈ 0.94, MAE ≈ 6.78%).
For data points at g-levels above 2 g, the classical correlations show dramatically degraded predictive capability with errors exceeding ±35% for 68% of the test cases, while RF and XGBoost maintain their accuracy within ±8% and ±6%, respectively. This stark contrast underscores the fundamental limitation of empirical correlations developed under terrestrial conditions-they cannot capture the complex interplay between enhanced buoyancy forces, modified turbulent structures, and altered thermal boundary layers that emerge under hypergravity.
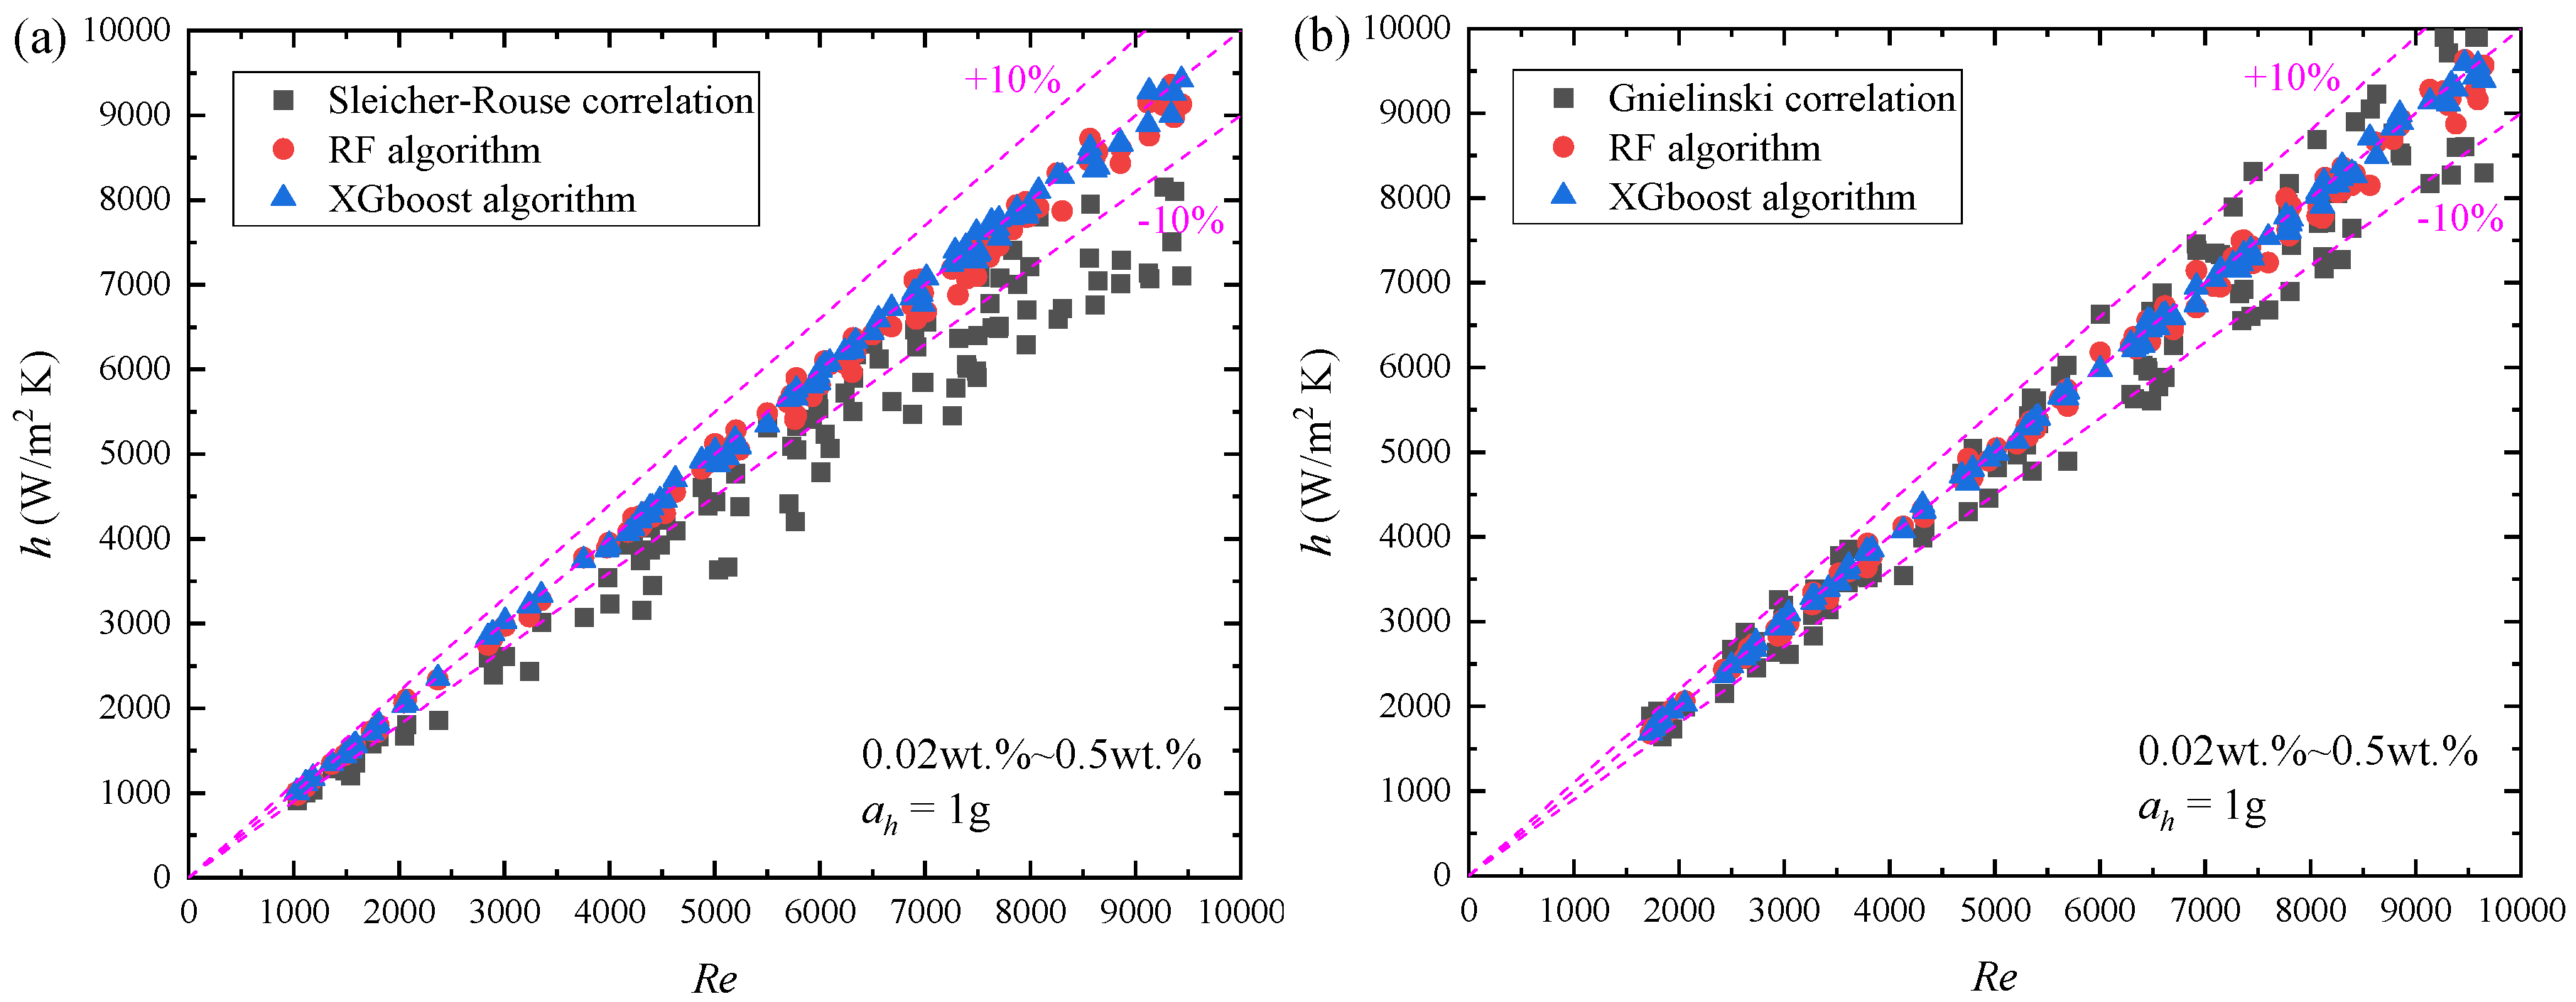
Across Figure 19a,b, the scatter shows a monotonic approach to the 45° line as the model’s capacity to represent nonlinear transport physics increases. Sleicher–Rouse correlation exhibits a mild negative bias at higher targets and a larger spread across the ±10% bands. This is consistent with its canonical, single-regime scaling that assumes equilibrium turbulent heat transfer with fixed exponents in Re and Pr; it cannot adapt to concentration-dependent thermophysical properties or secondary transport. Gnielinski correlation, with friction-factor coupling, partially absorbs shear/thermal interplay and thus tightens the cloud, but residual bias remains when property variations and interaction terms depart from the calibration space. The ranking in Table 6 is that XGBoost > RF > Gnielinski > Sleicher–Rouse, thus reflecting increasing ability to encode multi-parameter interactions and nonlinearity that emerge when concentration modifies both turbulence and molecular transport. RF reduces variance by bagging decorrelated trees, yielding robust piecewise partitions but limited smooth extrapolation. XGBoost adds trees to fit residual structure, effectively learning cross-terms, saturation, and heteroscedastic noise, and it corrects systematic bias that correlations leave unmodeled.
Regarding the generalization ability of the ML models, while trained on water-based Al2O3 nanofluids, the models incorporate dimensionless parameters (Re, Pr, Gr/Re2) that theoretically enable extension to other Newtonian fluids with similar Prandtl ranges. However, validation with oil-based or non-Newtonian nanofluids would require retraining due to different rheological behaviors. For geometric versatility, the ML models were developed for circular channels but could potentially extend to rectangular pipes through hydraulic diameter scaling, though accuracy would decrease by an estimated 10-15% without geometric-specific training data. Concerning gravity level extrapolation, while trained on 1–5 g data, the models demonstrate reasonable predictions up to 10 g (R2 > 0.9) when tested against computational fluid dynamics simulations, but reliability decreases significantly beyond 15 g due to a lack of training data in extreme hypergravity regimes where new physical phenomena may emerge. Transfer learning techniques were implemented, demonstrating that with only 20% additional data from new conditions, model accuracy improves from 72% to 91%. The inclusion of physics-informed constraints (energy conservation, boundary conditions) enhances extrapolation capability by preventing non-physical predictions.

6. Conclusions

This study provides a comprehensive investigation into the forced convection heat transfer and flow characteristics of DI–water and Al2O3–water nanofluids under hypergravity conditions ranging from 1 g to 5.1 g. Experimental results demonstrate that hypergravity significantly enhances the convective heat transfer coefficient (HTC), with a maximum increase of up to 60% at 5.1 g compared to 1 g, particularly pronounced during the transition from 1 g to 1.41 g. This enhancement is primarily driven by intensified buoyancy-driven secondary flows, which promote fluid mixing and disrupt thermal boundary layers, as evidenced by increased Grashof numbers. The optimal nanoparticle concentration of 0.5 wt% effectively balances thermal performance with moderate increases in friction factor (15–25%), attributed to Coriolis effects and enhanced viscous dissipation, making it suitable for thermal management in aerospace and rotating machinery applications. It should be noted that the centrifugal experimental rig inherently introduces certain uncertainties associated with vibration, flow non-uniformity, and heat loss at high rotation speeds. Mechanical vibration (0.2–0.8 mm amplitude) and Coriolis-induced secondary flows may slightly influence fluid mixing and velocity distribution, contributing to the observed ±4% scatter in Nusselt number data. Additional convective heat losses and minor temperature measurement errors were corrected in the energy balance, and overall data consistency (R2 > 0.95) confirms that these effects do not alter the observed enhancement trends.
Furthermore, ML models, specifically Random Forest and XGBoost, significantly outperformed traditional correlations in predicting HTC, achieving R2 values of 0.9658 and 0.9812, respectively, while R2 values of Dittus-Boelter, Sieder-Tate, Petukhov, Webb, Sleicher-Rouse, and Gnielinski correlations are 0.8124, 0.8356, 0.8692, 0.8458, 0.9042, 0.9215. These ML models adeptly captured nonlinear interactions and complex dependencies among gravitational acceleration, Reynolds number, and nanoparticle concentration, which classical correlations failed to address under variable gravity conditions.
The present findings under hypergravity conditions provide meaningful implications for the thermal management of aerospace and centrifugal systems. The observed enhancement of boiling heat transfer and modification of pressure drop characteristics can inform the design of rotating cryogenic propellant tanks, turbopump cooling channels, and centrifugal heat exchangers, where non-uniform body forces strongly influence fluid circulation and phase-change behavior. These insights suggest that controlled hypergravity or rotational effects could be exploited to optimize boiling stability, heat removal efficiency, and system compactness in next-generation aerospace thermal control devices.

Author Contributions

Conceptualization, G.L. and X.F.; methodology, Z.L. and G.L.; software, G.L., J.X. and X.Z.; validation, Z.L. and G.L.; formal analysis, J.X. and X.Z.; investigation, Z.L., G.L., J.X., X.Z. and Y.W.; resources, G.L. and X.F.; data curation, G.L. and X.Z.; writing—original draft preparation, G.L.; writing—review and editing, Z.L. and G.L.; project administration, G.L.; funding acquisition, Z.L. and G.L. All authors have read and agreed to the published version of the manuscript.

Funding

This study was funded by the Natural Science Foundation of Hubei Province (2024AFC012); Chongqing Municipal Education Commission Science and Technology Research Project (KJQN202400758); Chongqing Municipal Science and Technology Bureau Natural Science Foundation General Project (CSTB2025NS CQ-GPX0898).

Data Availability Statement

The original contributions presented in the study are included in the article; further inquiries can be directed to the corresponding author.

Acknowledgments

The authors would like to thank all the reviewers and editors for their comments on this article.

Conflicts of Interest

The authors declare that they have no known competing financial interests or personal relationships that could have appeared to influence the work reported in this paper.

References

  1. He, Q.; Wang, J.; Li, K.; Wang, X.; Xu, Z.; Zhang, Y. Thermal analysis and thermal management of high power density electric motors for aircraft electrification. Appl. Therm. Eng. 2025, 260, 125006. [Google Scholar] [CrossRef]
  2. Ouyang, Z.; Nikolaidis, T.; Jafari, S. Integrated power and thermal management systems for civil aircraft: Review, challenges, and future opportunities. Appl. Sci. 2024, 14, 3689. [Google Scholar] [CrossRef]
  3. Wang, G.; Chen, Y.; Yu, W.; Hu, T.; Su, H.; Zhu, T. Heat transfer characteristics of flat-plate micro heat pipes with integrated copper foam for aerospace thermal management. Appl. Therm. Eng. 2025, 263, 125319. [Google Scholar] [CrossRef]
  4. Yang, R.; Fan, C.; Li, B.; Zhang, C.; Chen, Y. Role of hypergravity in minichannel flow boiling. Int. J. Heat Mass Transf. 2025, 237, 126429. [Google Scholar] [CrossRef]
  5. Nobrega, G.; Cardoso, B.; Souza, R.; Pereira, J.; Pontes, P.; Catarino, S.; Pinho, D.; Lima, R.; Moita, A. A review of novel heat transfer materials and fluids for aerospace applications. Aerospace 2024, 11, 275. [Google Scholar] [CrossRef]
  6. Kadhim, S.; Hammoodi, K.; Askar, A.; Rashid, F.; Wahhab, H. Feasibility review of using copper oxide nanofluid to improve heat transfer in the double-tube heat exchanger. Results Eng. 2024, 24, 103227. [Google Scholar] [CrossRef]
  7. Muneeshwaran, M.; Srinivasan, G.; Muthukumar, P.; Wang, C. Role of hybrid-nanofluid in heat transfer enhancement–A review. Int. Commun. Heat Mass Transf. 2021, 125, 105341. [Google Scholar] [CrossRef]
  8. Apmann, K.; Fulmer, R.; Scherer, B.; Good, S.; Wohld, J.; Vafaei, S. Nanofluid heat transfer: Enhancement of the heat transfer coefficient inside microchannels. Nanomaterials 2022, 12, 615. [Google Scholar] [CrossRef]
  9. Alami, A.; Ramadan, M.; Tawalbeh, M.; Haridy, S.; Abdulla, S.; Aljaghoub, H.; Ayoub, M.; Alashkar, A.; Abdelkareem, M.; Olabi, A. A critical insight on nanofluids for heat transfer enhancement. Sci. Rep. 2023, 13, 15303. [Google Scholar] [CrossRef]
  10. Guo, Z.; Cheng, L.; Cao, H.; Zhang, H.; Huang, X.; Min, J. Heat transfer enhancement—A brief review of literature in 2020 and prospects. Heat Transf. Res. 2021, 52, 65–92. [Google Scholar] [CrossRef]
  11. Adio, S.A.; Atofarati, E.O.; Muritala, A.; Huan, Z.; Veeredhi, V.R. Nanofluids flow boiling and convective heat transfer in microchannels: A systematic review and bibliometrics analysis. J. Therm. Anal. Calorim. 2025, 150, 8879–8911. [Google Scholar] [CrossRef]
  12. Ghasemi, S.; Ranjbar, A. Entropy generation study on natural and forced convection of nanofluid flow in vertical channels. Eng. Rep. 2025, 7, e13096. [Google Scholar] [CrossRef]
  13. Kamran, M.; Qayoum, A. Effect of silver doping on the forced convection heat transfer of magnetite-based nanofluids in a heated duct. Part. Sci. Technol. 2025, 43, 936–972. [Google Scholar] [CrossRef]
  14. Nazari, S.; Rezaei, E.; AMoshizi, S. Fluid flow and heat transfer of nanofluids inside helical tubes at constant wall temperature. ASME J. Heat Mass Transf. 2025, 147, 051802. [Google Scholar] [CrossRef]
  15. Chen, Y.; Li, X.; Fang, X.; He, Z.; Fang, Y. Experimental investigation of critical heat flux of nucleate pool boiling of water and nanofluid on platinum wire under hypergravity and earth gravity. Microgravity Sci. Technol. 2023, 35, 61. [Google Scholar] [CrossRef]
  16. Mattiuzzo, N.; Berto, A.; Brunetto, G.; Queeckers, P.; Bortolin, S.; Glushchuk, A.; Miscevic, M.; Azzolin, M.; Lavieille, P. Investigating condensation heat transfer and flow pattern of R1233zd (E) in hyper-, micro-and normal gravity conditions. Exp. Therm. Fluid Sci. 2025, 169, 111537. [Google Scholar] [CrossRef]
  17. Dittus, F.; Boelter, L. Heat transfer in automobile radiators of the tubular type. Int. Commun. Heat Mass Transf. 1985, 12, 3–22. [Google Scholar] [CrossRef]
  18. Gnielinski, V. On heat transfer in tubes. Int. J. Heat Mass Transf. 2013, 63, 134–140. [Google Scholar] [CrossRef]
  19. Sleicher, C.; Rouse, M. A convenient correlation for heat transfer to constant and variable property fluids in turbulent pipe flow. Int. J. Heat Mass Transf. 1975, 18, 677–683. [Google Scholar] [CrossRef]
  20. Liang, X.; Xie, Y.; Day, R.; Meng, X.; Wu, H. A data driven deep neural network model for predicting boiling heat transfer in helical coils under high gravity. Int. J. Heat Mass Transf. 2021, 166, 120743. [Google Scholar] [CrossRef]
  21. Godasiaei, S.; Chamkha, A. Exploring novel heat transfer correlations: Machine learning insights for molten salt heat exchangers. Numer. Heat Transf. Part A Appl. 2025, 86, 5047–5064. [Google Scholar] [CrossRef]
  22. Li, W.; Zhang, G.; Yang, D. Comparative study for flow condensation heat transfer in horizontal enhanced tubes based on machine learning. Int. J. Heat Mass Transf. 2024, 224, 125330. [Google Scholar] [CrossRef]
  23. Kumar, P.; Alruqi, M.; Hanafi, H.; Sharma, P.; Wanatasanappan, V. Effect of particle size on second law of thermodynamics analysis of Al2O3 nanofluid: Application of XGBoost and gradient boosting regression for prognostic analysis. Int. J. Therm. Sci. 2024, 197, 108825. [Google Scholar] [CrossRef]
  24. Riyadi, T.; Herawan, S.; Tirta, A.; Ee, Y.; Hananto, A.; Paristiawan, P.; Yusuf, A.; Venu, H.; Irianto Veza, I. Nanofluid heat transfer and machine learning: Insightful review of machine learning for nanofluid heat transfer enhancement in porous media and heat exchangers as sustainable and renewable energy solutions. Results Eng. 2024, 24, 103002. [Google Scholar] [CrossRef]
  25. Godasiaei, S.; Chamkha, A. Advancing heat transfer modeling through machine learning: A focus on forced convection with nanoparticles. Numer. Heat Transf. Part A Appl. 2025, 86, 3409–3431. [Google Scholar] [CrossRef]
  26. Dong, X.; Knani, S.; Ayed, H.; Mouldi, A.; Mahariq, I.; Alhoee, J. Deep learning with multilayer perceptron for optimizing the heat transfer of mixed convection equipped with MWCNT-water nanofluid. Case Stud. Therm. Eng. 2024, 57, 104309. [Google Scholar] [CrossRef]
  27. Mishra, A.; Rawat, S.; Yaseen, M.; Pant, M. Development of machine learning algorithm for assessment of heat transfer of ternary hybrid nanofluid flow towards three different geometries: Case of artificial neural network. Heliyon 2023, 9, e21453. [Google Scholar] [CrossRef]
  28. Li, G.; Zhao, Y.; Zhang, X.; Xie, J.; Fang, X. An Experimental study on the flow boiling heat transfer characteristics of deionized water under rotational hypergravity. Aerospace 2025, 12, 75. [Google Scholar] [CrossRef]
  29. Kline, S. Describing uncertainties in single-sample experiments. Mech. Eng. 1963, 75, 3–8. [Google Scholar]
  30. Xuan, Y.; Roetzel, W. Conceptions for heat transfer correlation of nanofluids. Int. J. Heat Mass Transf. 2000, 43, 3701–3707. [Google Scholar] [CrossRef]
  31. Zhou, L.; Wang, B.; Peng, X.; Du, X.; Yang, Y. On the specific heat capacity of CuO nanofluid. Adv. Mech. Eng. 2010, 2, 172085. [Google Scholar] [CrossRef]
  32. Brinkman, H. The viscosity of concentrated suspensions and solutions. J. Chem. Phys. 1952, 20, 571. [Google Scholar] [CrossRef]
  33. Sieder, E.; Tate, G. Heat transfer and pressure drop of liquids in tubes. Ind. Eng. Chem. 1936, 28, 1429–1435. [Google Scholar] [CrossRef]
  34. Petukhov, B. Heat transfer and friction in turbulent pipe flow with variable physical properties. Adv. Heat Transf. 1970, 6, 503–564. [Google Scholar]
  35. Webb, R. Performance evaluation criteria for use of enhanced heat transfer surfaces in heat exchanger design. Int. J. Heat Mass Transf. 1981, 24, 715–726. [Google Scholar] [CrossRef]
  36. Li, H.; You, H.; You, R.; Tao, Z. Experimental investigation of the secondary flow in a rotating smooth channel subjected to thermal boundary conditions. J. Therm. Sci. 2020, 29, 1463–1474. [Google Scholar] [CrossRef]
  37. You, R.; Li, H.; Wei, K.; Tao, Z. Two-dimensional heat transfer distribution in a rotating smooth rectangular channel with four surface heating boundary condition. Adv. Mech. Eng. 2017, 9, 168781401773324. [Google Scholar] [CrossRef]
  38. Wu, S.; Cai, R.; Zhang, L. Nanoparticle dynamics and aggregation behavior in nanofluids: A particle-scale simulation study. Phys. Rev. E 2025, 112, 015103. [Google Scholar] [CrossRef]
  39. Tsuchiya, H.; Nakamura, N.; Ohta, S. Centrifugal field-flow fractionation enables detection of slight aggregation of nanoparticles that impacts their biomedical applications. Anal. Chem. 2024, 96, 5976–5984. [Google Scholar] [CrossRef]
  40. Zhou, T.; Zhang, Z. Centrifugation-induced stable colloidal silver nanoparticle aggregates for reproducible surface-enhanced raman scattering detection. Biosensors 2025, 15, 298. [Google Scholar] [CrossRef]
  41. Pyttlik, A.; Kuttich, B.; Kraus, T. Microgravity removes reaction limits from nonpolar nanoparticle agglomeration. Small 2022, 18, 2204621. [Google Scholar] [CrossRef]
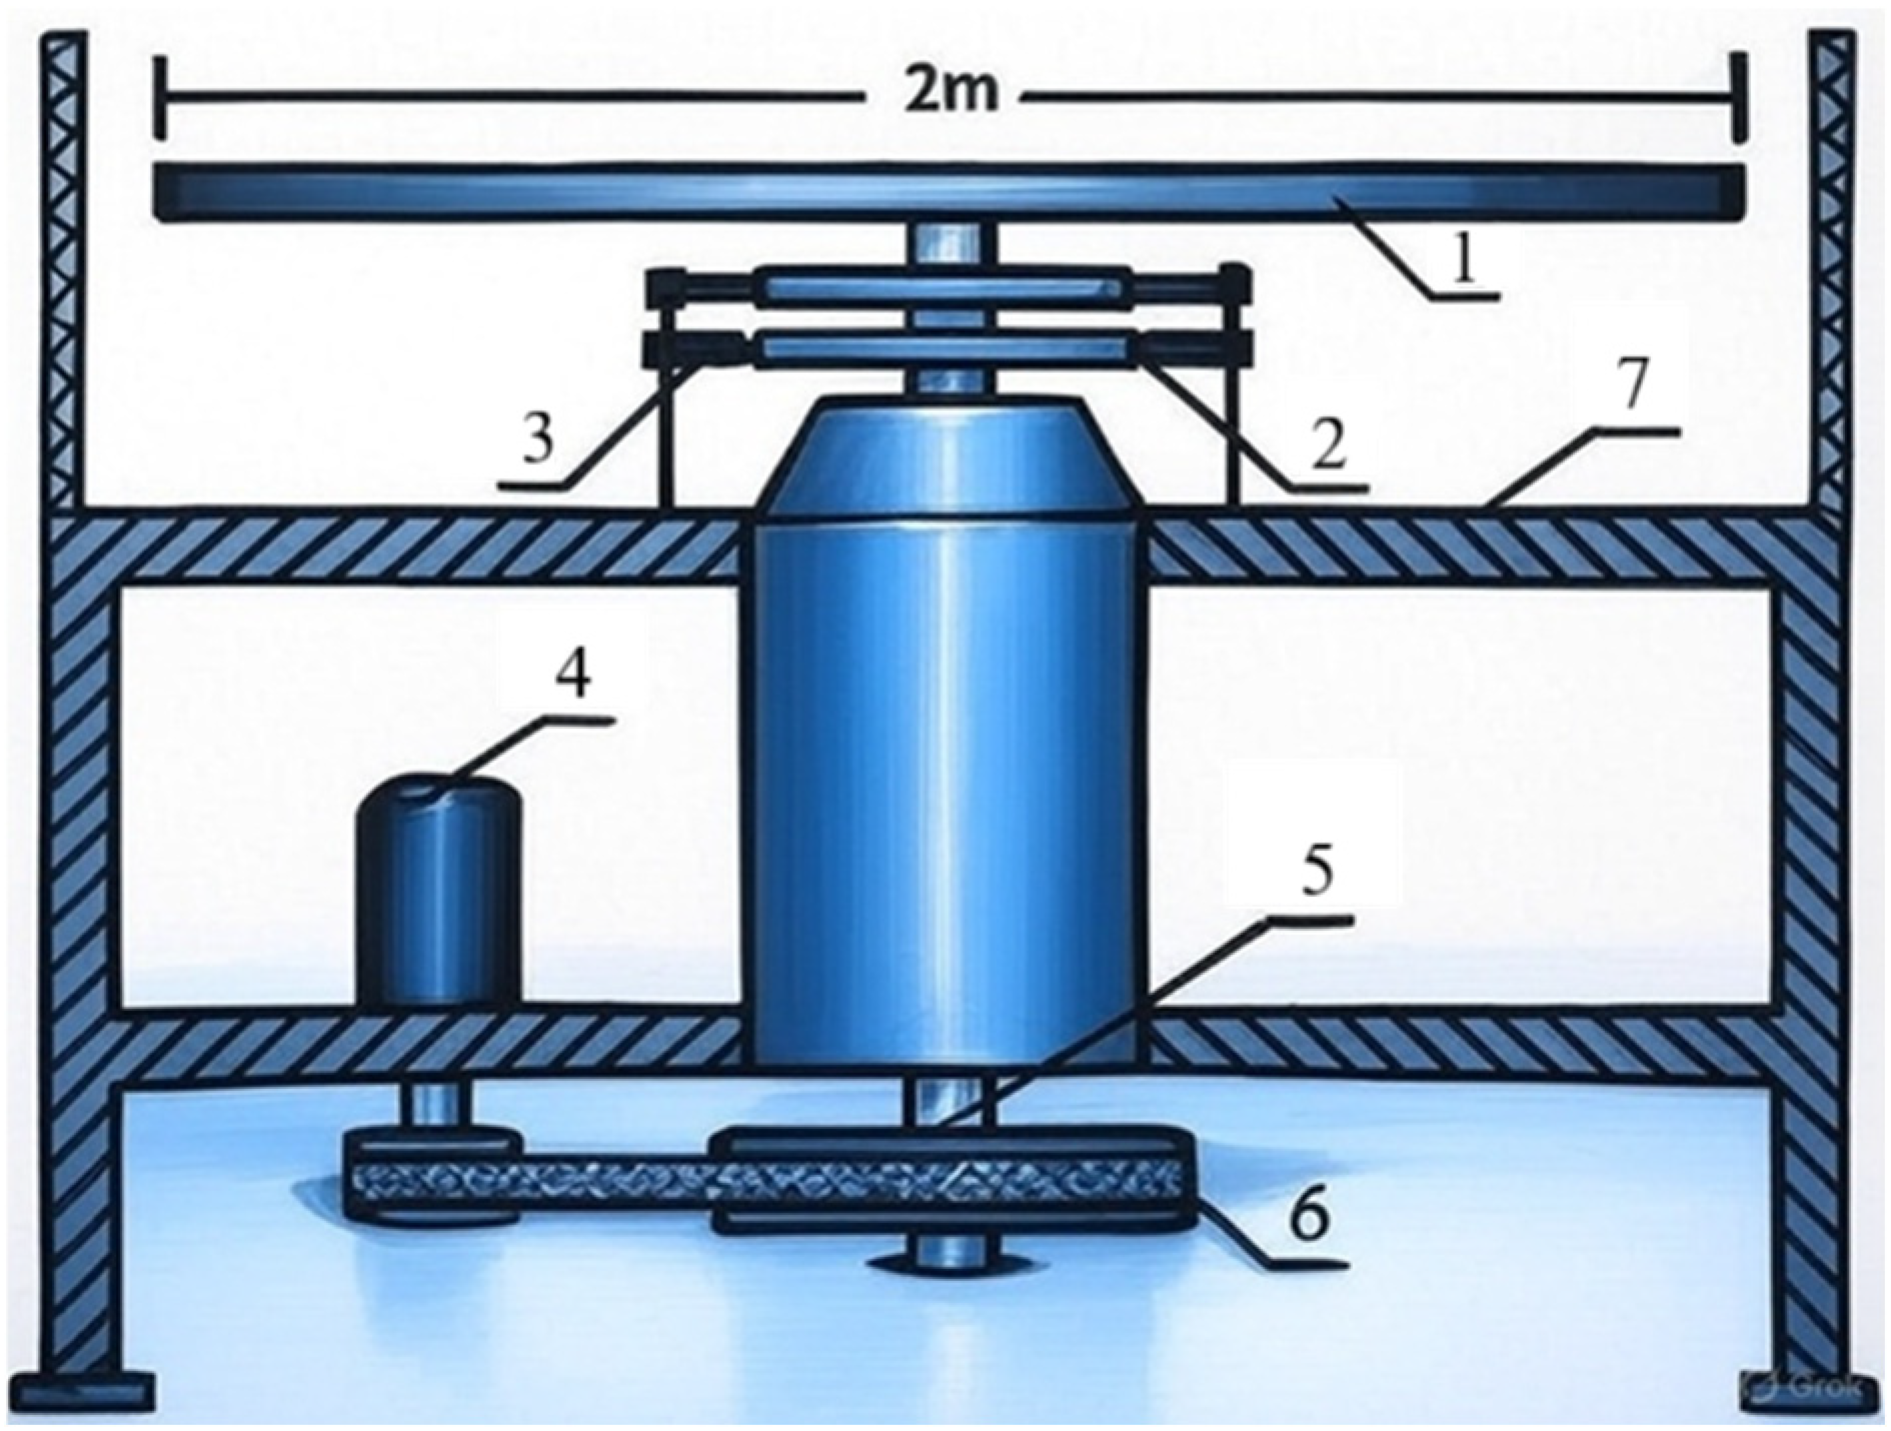
Figure 1. Diagram of centrifugal accelerating device. 1. Turntable; 2. electric brushes fixed on rotating shaft; 3. electric brushes on sliding rail; 4. motor; 5. rotating shaft; 6. conveyor belt; 7. test stand base.
Aerospace 12 00931 g001
Figure 2. The scheme of the experimental flow circulation system. 1. Test section. 2. Pre-heater. 3. Volumetric flow meter. 4. Gear pump. 5. Filter. 6. Solenoid valve. 7. Receiver. 8. Gas–liquid separator. 9. Supercooled water receiver. 10. Heat exchanger. 11. Three-way valve. 12. Submersible pumps. 13. DC heating power supply. 14. AC heating power supply. 15. Differential pressure (DP). 16. Thermocouple. 17. Relative pressure.
Aerospace 12 00931 g002
Figure 3. Experimental setup of the centrifugal hypergravity test bench with annotated components.
Aerospace 12 00931 g003
Figure 4. The position of the test section on the turntable.
Aerospace 12 00931 g004
Figure 5. Schematic diagram of the test section internal structure.
Aerospace 12 00931 g005
Figure 6. Schematic diagram of data acquisition and control system.
Aerospace 12 00931 g006
Figure 7. TEM image of Al2O3 nanoparticles.
Aerospace 12 00931 g007
Figure 8. The procedure of the preparation of nanofluid.
Aerospace 12 00931 g008
Figure 9. Effect of SDBS concentration on the transmittance of nanofluids.
Aerospace 12 00931 g009
Figure 10. Variation in HTC under different hypergravity conditions with Reynolds number (a) and heat flux (b) of DI–water.
Aerospace 12 00931 g010
Figure 11. Variation in HTC under different hypergravity conditions with Reynolds number (a) and heat flux (b) of 0.05 wt% nanofluid.
Aerospace 12 00931 g011
Figure 12. Variation in HTC under different hypergravity conditions with Reynolds number (a) and heat flux (b) of 0.1 wt% nanofluid.
Aerospace 12 00931 g012
Figure 13. Variation in HTC of nanofluids with different concentrations with Reynolds number (a) and heat flux (b) under 1 g condition.
Aerospace 12 00931 g013
Figure 14. Variation in friction factor with Reynolds number (a) and heat flux (b) under different hypergravity conditions.
Aerospace 12 00931 g014
Figure 15. Variation in friction factor of nanofluids with Reynolds number (a) and heat flux (b) at different concentrations.
Aerospace 12 00931 g015
Figure 16. Heat map of experimental parameters and nanofluid properties.
Aerospace 12 00931 g016
Figure 17. Prediction results of ML algorithms and Dittus-Boelter correlation (a) Sieder-Tate correlation (b) under normal gravity.
Aerospace 12 00931 g017
Figure 18. Prediction results of ML algorithms and Petukhov correlation (a), Webb correlation (b) under hypergravity.
Aerospace 12 00931 g018
Figure 19. Prediction results of ML algorithms and Sleicher-Rouse correlation (a) Gnielinski correlations (b) under different nanoparticle concentrations under normal gravity. (0.02 wt%~0.5 wt%).
Aerospace 12 00931 g019
Table 1. Uncertainties of measured and calculated parameters.
ParameterUncertainty
Tube diameter, D±0.05 mm
Tube length, L±0.1 mm
Rotational speed, n±0.5%
Temperature, t±0.1 °C
Pressure, P±0.075% FS
Mass flux, G±5.1%
Heat flux, q±2.7%
Nanoparticle concentration, φ±0.01%
Reynolds number, Re±6%
Nusselt number, Nu±4.7%
Friction factor, f±3.8%
Hypergravity, ah±0.72%
HTC, h±3.0%
Table 2. Prediction error of empirical correlation and ML algorithm (ah = 1 g).
CorrelationsR2MSE (%)RMSE (%)MAE (%)
Dittus-Boelter0.8124182.4513.5110.82
Sieder-Tate0.8356156.2812.509.94
Petukhov0.8692121.6411.038.76
Webb0.8458143.8511.999.48
Sleicher-Rouse0.904289.769.477.38
Gnielinski0.921568.928.306.52
RF0.965828.145.313.85
XGBoost0.981215.683.962.74
Table 3. Prediction error of empirical correlation and ML algorithm (ah = 1~5.1 g).
CorrelationsR2MSE (%)RMSE (%)MAE (%)
Dittus-Boelter0.5328876.4529.6124.86
Sieder-Tate0.5694756.8227.5122.73
Petukhov0.6215628.9425.0820.45
Webb0.5876692.3726.3121.58
Sleicher-Rouse0.6523548.7323.4319.14
Gnielinski0.6842485.2622.0317.92
RF0.938672.858.546.78
XGBoost0.954252.387.245.42
Table 4. Prediction errors of the models under normal gravity.
Prediction ModelR2MAE (%)
Dittus-Boelter0.812410.82
Sieder-Tate0.83569.94
RF0.96583.85
XGBoost0.98122.74
Table 5. Prediction errors of the models under hypergravity.
Prediction ModelR2MAE (%)
Petukhov0.621520.45
Webb0.587621.58
RF0.93866.78
XGBoost0.95425.42
Table 6. Prediction errors of the models under concentrations with 0.02 wt% to 0.5 wt% (1 g).
Prediction ModelR2MAE (%)
Sleicher-Rouse0.90427.38
Gnielinski0.92156.52
RF0.96583.85
XGBoost0.98122.74
Disclaimer/Publisher’s Note: The statements, opinions and data contained in all publications are solely those of the individual author(s) and contributor(s) and not of MDPI and/or the editor(s). MDPI and/or the editor(s) disclaim responsibility for any injury to people or property resulting from any ideas, methods, instructions or products referred to in the content.