Willingness to Pay for Urban Heat Island Mitigation: A Case Study of Singapore


Abstract
1. Introduction
2. Research Methods
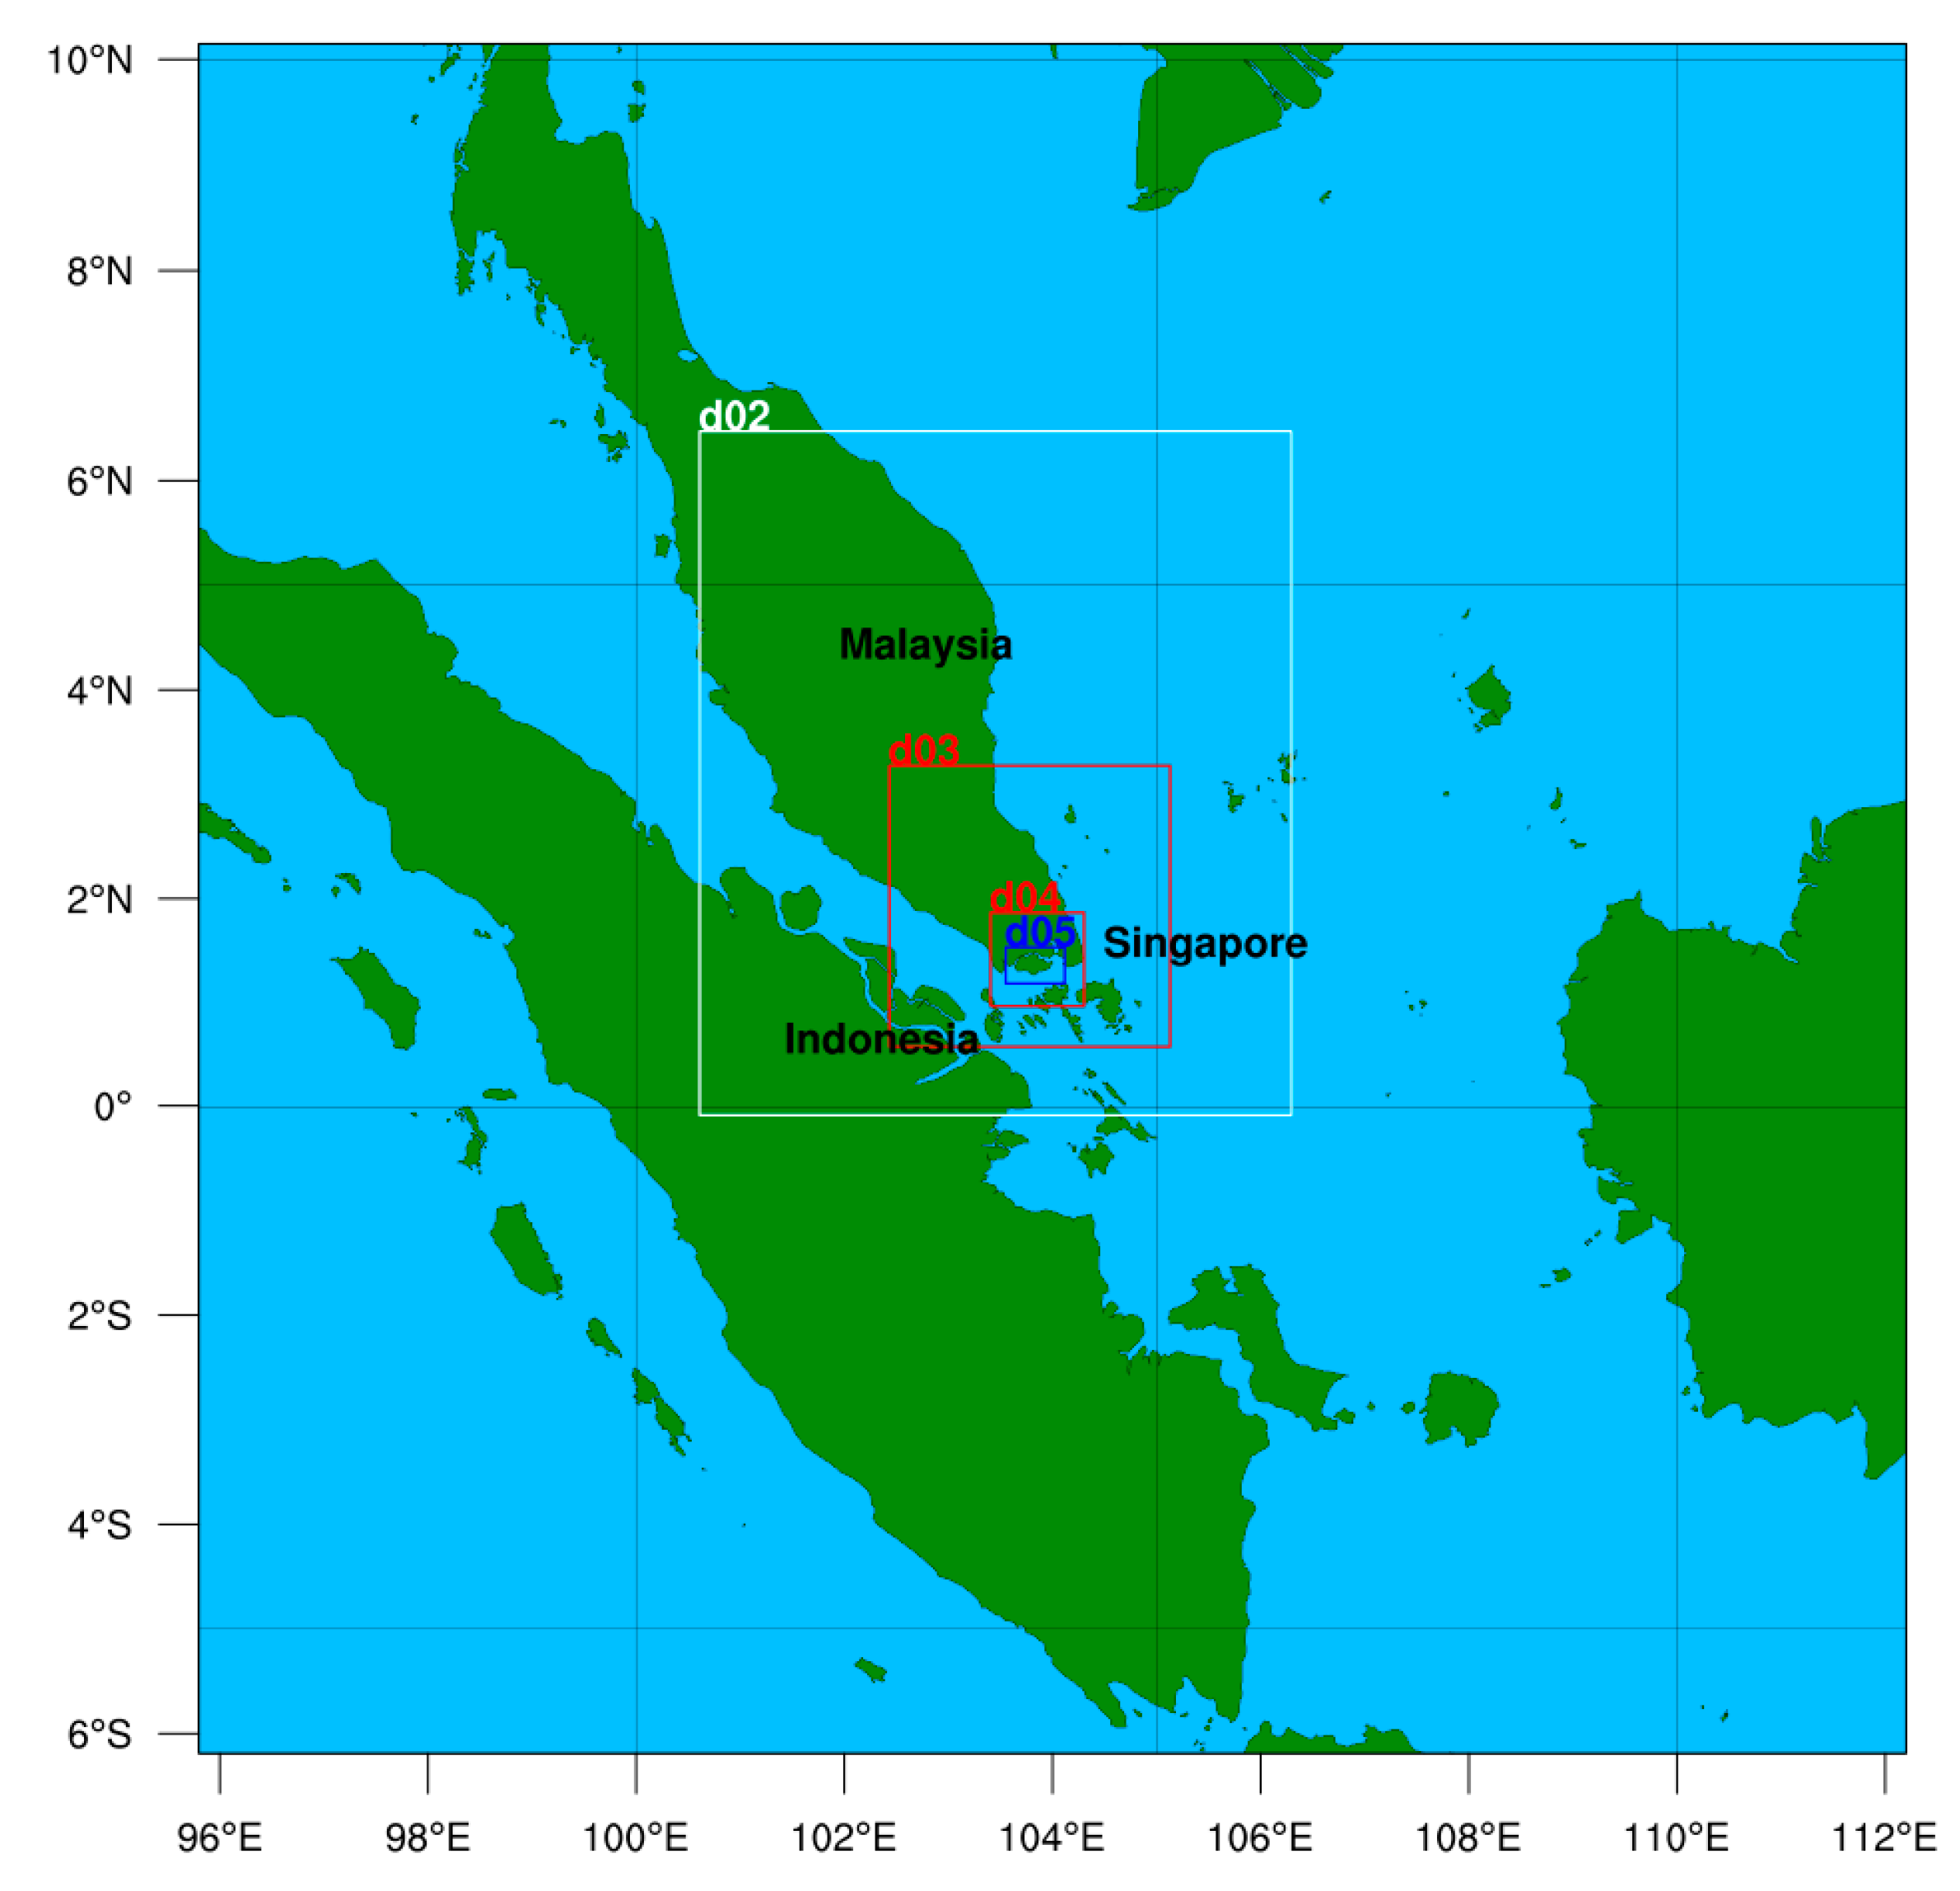
2.1. UHI Assessment
2.2. WTP Assessment
2.2.1. WTP Payment Vehicle
2.2.2. Study Design and Protocol
- We obtained written consent from the respondents prior to the survey. However, participants could withdraw from the survey at any time without giving any reason, and all the data collected from those participants were discarded.
- Respondents’ demographic characteristics (age, gender, education, etc.), their socio-economic attributes (income and employment), as well as information on their level of awareness of need for UHI mitigation, level of attitudes towards UHI mitigation and outdoor preferences were asked for in a questionnaire and collected. The demographic and socio-economic information was used to build up citizen profiles with differing WTPs. No identifiable information was collected. For all questions, which were deemed sensitive, we provided an, “I prefer not to answer” option so that respondents had a way to bypass the question. This also helped to lower the number of inaccurate or missing responses, resulting in a higher validity and accuracy of the data collected.
- After having answered the questionnaire, a short description summarizing the UHI situation in Singapore as well as an illustrative image of the different temperatures across Singapore were presented to the respondents. They also received information on the meaning of UHI and a map from Singapore showing different UHI values in different regions [24] (see Figure 2). Specifically, we informed participants that “The urban heat island effect is the local temperature increase due to human activity and urbanization. The image shows the current urban heat island effect in Singapore. The brighter areas represent regions in Singapore that experience higher air temperature due to human activity and urbanization. The regions in red experience up to 4.2 °C increase in air temperature in comparison to regions in blue. For example, Orchard Road is 4.2 °C hotter than the Bukit Timah Nature Reserve”.
- First Bid: We then asked the respondents whether (answering “YES”) or not (answering “NO”) they would support a policy that obliges all people living permanently in Singapore to contribute to a mitigation strategy fund during one year. They were confronted with differing specific percentages of their incomes that they would be asked to contribute. The percentages presented in the questionnaires varied randomly between seven possible bid-bundles previously established as plausible in a pilot study (see Table 2). To facilitate the understanding of the corresponding percentage values, the respondents were also presented with a numerical calculation of what this percentage (X1) of their annual income would be in Singapore Dollars. The design of the bids was calculated based on the WTP results from a pilot study, which we did with a representative sample of 200 respondents in Singapore in the month before starting the main survey. The respondents in the pilot study were exposed to the same main survey as the one presented here, but with an open-ended contingent valuation format. We trimmed 10% off both tails of the bid distribution and selected seven bid combinations from the remaining distribution for our main survey. The methodology for selecting the final seven bid combinations followed the seminal work of Cooper [56], wherein the optimal bid design is the one that minimizes the square errors. The main objective of the pilot study was to get and use the bid distribution to create an unbiased bid design for the main survey, following the methodology described in [56].
- Second bid: If a respondent answered “YES” to the first bid, the respondent was then asked to respond to the same question again but with a higher bid value (Xhigh) (see Table 2). If a respondent answered “NO” to the first ID, the respondent was then presented with a lower second bid (Xlow). Hence, the two consecutive questions were presented in a decision tree with four different outcomes. Figure 3 displays the flowchart and illustrates steps 4 and 5 of this protocol.
2.2.3. Determinants of the Willingness to Pay
3. The Theoretical Model: Double-Bounded Dichotomous Contingent Valuation (DBDCV)
- If a subject answers YES to the first question and NO to the second question, we can infer that ≤ WTP < .
- If a subject answers YES to the first question and YES to the second, then ≤ WTP < ∞.
- If a subject answers NO to the first question and YES to the second, then ≤ WTP < .
- If a subject answers NO to the first and to the second question, then we have 0 < WTP < .
- 1.
- 2.
- where the last expression follows from and where F(.) represents the cumulative distribution function. Therefore, using symmetry of the normal distribution we have that:
- 3.
- 4.
- (if the responses of ith person are ‘yes-yes’ = 1; 0 otherwise)
- (if the responses of ith person are ‘yes-no’ = 1; 0 otherwise)
- (if the responses of ith person are ‘no-yes’ = 1; 0 otherwise)
- (if the responses of ith person are ‘no-no’ = 1; 0 otherwise)
4. Results
4.1. Descriptive Statistics
4.2. UHI Assessment and WTP Estimation
4.2.1. UHI Assessment
4.2.2. WTP Estimation Results
4.2.3. Determinants of the WTP Estimation
5. Discussion
6. Conclusions and Implications
- Singapore citizens and permanent residents express a strong willingness to pay for mitigating the UHI effect in Singapore. This should encourage policymakers to further increase their efforts to address the UHI effect in Singapore and to continue improving the urban outdoor thermal environment, particularly in those areas with a high UHI intensity.
- Stimulating education and awareness for issues related to environmental and urban sustainability might generate a higher public support for the implementation of UHI mitigating measures.
- Further CVM-related research on mitigating the UHI effect is recommended to provide further insights into the differences in WTP within the population. In particular, the relationship between WTP for specific UHI mitigation measures and the vulnerability of different population groups (for example older adults and young children) should be further explored.
- As our study presented the mitigation measures as a bundle, we were not able to calculate the WTP for specific mitigation measures. Nevertheless, it is important to understand how much citizens are willing to pay for different mitigation measures. Based on such information, measures could be ranked and implemented according to their WTP. With respect to the implementation, the expected discounted costs for different UHI mitigation measures should also be taken into account. Combining this information within a cost-benefit analyses would provide policymakers with deeper insights which could guide their policy decisions.
Supplementary Materials
Author Contributions
Funding
Acknowledgments
Conflicts of Interest
References
- Mathew, A.; Khandelwal, S.; Kaul, N. Analysis of diurnal surface temperature variations for the assessment of surface urban heat island effect over Indian cities. Energy Build. 2018, 159, 271–295. [Google Scholar] [CrossRef]
- Berdahl, P.; Bretz, S.E. Preliminary survey of the solar reflectance of cool roofing materials. Energy Build. 1997, 25, 149–158. [Google Scholar] [CrossRef]
- Oke, T.R. Applied Climatology: Principles and Practice; Thompson, R.D., Perry, A., Eds.; Routledge: New York, NY, USA, 1997. [Google Scholar]
- Sailor, D.J.; Dietsch, N. The urban heat island mitigation impact screening tool (MIST). Environ. Model. Softw. 2007, 22, 1529–1541. [Google Scholar] [CrossRef]
- Costa, S.; Ferreira, J.; Silveira, C.; Costa, C.; Lopes, D.; Relvas, H.; Paulo Teixeira, J. Integrating health on air quality assessment—Review report on health risks of two major European outdoor air pollutants: PM and NO2. J. Toxicol. Environ. Health Part B 2014, 17, 307–340. [Google Scholar] [CrossRef]
- Godish, T.; Davis, W.T.; Fu, J.S. Air Quality; CRC Press: Boca Raton, FL, USA, 2014. [Google Scholar]
- World Health Organization. Ambient (Outdoor) Air Quality and Health Fact Sheet No 313; World Health Organization: Geneva, Switzerland, 2014; Updated in May 2018. [Google Scholar]
- Rocklöv, J.; Forsberg, B.; Ebi, K.; Bellander, T. Susceptibility to mortality related to temperature and heat and cold wave duration in the population of Stockholm County, Sweden. Glob. Health Action 2014, 7, 22737. [Google Scholar] [CrossRef] [PubMed]
- Estrada, F.; Botzen, W.W.; Tol, R.S. A global economic assessment of city policies to reduce climate change impacts. Nat. Clim. Chang. 2017, 7, 403. [Google Scholar] [CrossRef]
- Smith, K.R.; Woodward, A.; Campbell-Lendrum, D.; Chadee, D.D.; Honda, Y.; Liu, Q.; Olwoch, J.; Revich, B.; Sauerborn, R.; Aranda, C.; et al. Human health: Impacts, adaptation and co-benefits. In Climate Change 2014: Impacts, Adaptation, and Vulnerability. Part A: Global and Sectoral Aspects. Contribution of Working Group II to the Fifth Assessment Report of the Intergovernmental Panel on Climate Change; Cambridge University Press: Cambridge, UK, 2017; pp. 709–754. [Google Scholar]
- Kjellstrom, T.; Briggs, D.; Freyberg, C.; Lemke, B.; Otto, M.; Hyatt, O. Heat, human performance, and occupational health: A key issue for the assessment of global climate change impacts. Ann. Rev. Public Health 2016, 37, 97–112. [Google Scholar] [CrossRef]
- Abel, D.W.; Holloway, T.; Harkey, M.; Meier, P.; Ahl, D.; Limaye, V.S.; Patz, J.A. Air-quality-related health impacts from climate change and from adaptation of cooling demand for buildings in the eastern United States: An interdisciplinary modeling study. PLoS Med. 2018, 15, e1002599. [Google Scholar] [CrossRef]
- Wang, Y.; Chen, L.; Kubota, J. The relationship between urbanization, energy use and carbon emissions: Evidence from a panel of Association of Southeast Asian Nations (ASEAN) countries. J. Clean. Prod. 2016, 112, 1368–1374. [Google Scholar] [CrossRef]
- Taslim, S.; Parapari, D.M.; Shafaghat, A. Urban design guidelines to mitigate Urban Heat Island (UHI) effects in hot-dry cities. J. Teknol. 2015, 74, 119–124. [Google Scholar] [CrossRef]
- Kolokotsa, D.; Santamouris, M.; Zerefos, S.C. Green and cool roofs’ urban heat island mitigation potential in European climates for office buildings under free floating conditions. Sol. Energy 2013, 95, 118–130. [Google Scholar] [CrossRef]
- Priyadarsini, R. Urban heat island and its impact on building energy consumption In Advances in Building Energy Research; Routledge: Abingdon-on-Thames, UK, 2012. [Google Scholar]
- Zinzi, M.; Agnoli, S. Cool and green roofs. An energy and comfort comparison between passive cooling and mitigation urban heat island techniques for residential buildings in the mediterranean region. Energy Build. 2012, 55, 66–76. [Google Scholar] [CrossRef]
- Walcek, C.J.; Yuan, H.H. Calculated influence of temperature-related factors on ozone formation rates in the lower troposphere. J. Appl. Meteorol. 1995, 34, 1056–1069. [Google Scholar] [CrossRef]
- Taha, H. Modeling the impacts of large-scale albedo changes on ozone air quality in the South Coast Air Basin. Atmos. Environ. 1997, 31, 1667–1676. [Google Scholar] [CrossRef]
- Cohen, A.J.; Anderson, H.R.; Ostro, B.; Pandey, K.D.; Krzyzanowski, M.; Künzli, N.; Kersten Gutschmidt, C.; Arden Pope, I.R., III; Samet, J.M.; Smith, K.R. Urban air pollution. Comp. Quantif. Health Risks 2004, 2, 1353–1433. [Google Scholar]
- Tan, P.Y.; bin Abdul Hamid, A.R. Urban ecological research in Singapore and its relevance to the advancement of urban ecology and sustainability. Landsc. Urban Plan. 2014, 125, 271–289. [Google Scholar] [CrossRef]
- Corlett, R.T. Impacts of warming on tropical lowland rainforests. Trends Ecol. Evol. 2011, 26, 606–613. [Google Scholar] [CrossRef] [PubMed]
- Chow, W.T.; Roth, M. Temporal dynamics of the urban heat island of Singapore. Int. J. Climatol. J. R. Meteorol. Soc. 2006, 26, 2243–2260. [Google Scholar] [CrossRef]
- Mughal, M.O.; Li, X.X.; Yin, T.; Martilli, A.; Brousse, O.; Dissegna, M.A.; Norford, L.K. High-resolution, multi-layer modelling of Singapore’s urban climate incorporating local climate zones. J. Geophys. Res. Atmos. 2019, 124, 7764–7785. [Google Scholar] [CrossRef]
- Dos Santos, A.R.; de Oliveira, F.S.; da Silva, A.G.; Gleriani, J.M.; Gonçalves, W.; Moreira, G.L.; Juvanhol, R.S. Spatial and temporal distribution of urban heat islands. Sci. Total Environ. 2017, 605, 946–956. [Google Scholar] [CrossRef]
- Chun, B.; Guldmann, J.M. Impact of greening on the urban heat island: Seasonal variations and mitigation strategies. Comput. Environ. Urban Syst. 2018, 71, 165–176. [Google Scholar] [CrossRef]
- Ruefenacht, L.; Acero, J.A. Strategies for Cooling Singapore: A Catalogue of 80+ Measures to Mitigate Urban Heat Island and Improve Outdoor Thermal Comfort; Cooling Singapore (CS): Singapore, 2017. [Google Scholar] [CrossRef]
- Wong, N.H.; Cheong, D.W.; Yan, H.; Soh, J.; Ong, C.L.; Sia, A. The effects of rooftop garden on energy consumption of a commercial building in Singapore. Energy Build. 2003, 35, 353–364. [Google Scholar] [CrossRef]
- Li, X.X.; Norford, L.K. Evaluation of cool roof and vegetations in mitigating urban heat island in a tropical city, Singapore. Urban Clim. 2016, 16, 59–74. [Google Scholar] [CrossRef]
- Wong, N.H.; Tan, A.Y.K.; Tan, P.Y.; Wong, N.C. Energy simulation of vertical greenery systems. Energy Build. 2009, 41, 1401–1408. [Google Scholar] [CrossRef]
- Wong, N.H.; Tan, A.Y.K.; Chen, Y.; Sekar, K.; Tan, P.Y.; Chan, D.; Wong, N.C. Thermal evaluation of vertical greenery systems for building walls. Build. Environ. 2010, 45, 663–672. [Google Scholar] [CrossRef]
- Huang, G. PM2.5 opened a door to public participation addressing environmental challenges in China. Environ. Pollut. 2015, 197, 313–315. [Google Scholar] [CrossRef]
- Zhang, L.; Fukuda, H.; Liu, Z. Households’ willingness to pay for green roof for mitigating heat island effects in Beijing (China). Build. Environ. 2019, 150, 13–20. [Google Scholar] [CrossRef]
- Zhang, L.; Fukuda, H.; Liu, Z. The value of cool roof as a strategy to mitigate urban heat island effect: A contingent valuation approach. J. Clean. Prod. 2019, 228, 770–777. [Google Scholar] [CrossRef]
- Carlsson, F.; García, J.H.; Löfgren, Å. Conformity and the demand for environmental goods. Environ. Resource Econ. 2010, 47, 407–421. [Google Scholar] [CrossRef]
- Ding, F.; Pang, H.; Guo, W. Impact of the urban heat island on residents’ energy consumption: A case study of Qingdao. In IOP Conference Series: Earth and Environmental Science; IOP Publishing: Bristol, UK, 2018; Volume 121, p. 032026. [Google Scholar]
- Chakraborty, T.; Hsu, A.; Manya, D.; Sheriff, G. Disproportionately higher exposure to urban heat in lower-income neighborhoods: A multi-city perspective. Environ. Res. Lett. 2019, 14, 105003. [Google Scholar] [CrossRef]
- Macintyre, H.L.; Heaviside, C.; Taylor, J.; Picetti, R.; Symonds, P.; Cai, X.M.; Vardoulakis, S. Assessing urban population vulnerability and environmental risks across an urban area during heatwaves—Implications for health protection. Sci. Total Environ. 2018, 610, 678–690. [Google Scholar] [CrossRef] [PubMed]
- Martin-Vide, J.; Sarricolea, P.; Moreno-García, M.C. On the definition of urban heat island intensity: The “rural” reference. Front. Earth Sci. Front. 2015, 3, 24. [Google Scholar] [CrossRef]
- Liao, J.; Wang, T.; Wang, X.; Xie, M.; Jiang, Z.; Huang, X.; Zhu, J. Impacts of different urban canopy schemes in WRF/Chem on regional climate and air quality in Yangtze River Delta, China. Atmos. Res. 2014, 145, 226–243. [Google Scholar] [CrossRef]
- Wang, Y.; Di Sabatino, S.; Martilli, A.; Li, Y.; Wong, M.S.; Gutiérrez, E.; Chan, P.W. Impact of land surface heterogeneity on urban heat island circulation and sea-land breeze circulation in Hong Kong. J. Geophys. Res. Atmos. 2017, 122, 4332–4352. [Google Scholar] [CrossRef]
- Valdés, A.C.F. Influence of urban land cover on mexico city’s meteorological conditions. In Proceedings of the NW-AIRQUEST 2018 Annual Meeting, Seattle, WA, USA, 13 June 2018; Available online: Http://lar.wsu.edu/nw-airquest/docs/20180612_meeting/NWAQ_Valdez_20180613.pdf (accessed on 1 March 2020).
- Stewart, I.D.; Oke, T.R. Local climate zones for urban temperature studies. Bull. Am. Meteorol. Soc. 2012, 93, 1879–1900. [Google Scholar] [CrossRef]
- Bohnenstengel, S.I.; Evans, S.; Clark, P.A.; Belcher, S. Simulations of the London urban heat island. Q. J. R. Meteorol. Soc. 2011, 137, 1625–1640. [Google Scholar] [CrossRef]
- Quah, E.; Mishan, E.J. Cost-Benefit Analysis; Routledge: New York, NY, USA, 2007. [Google Scholar]
- Hanemann, W.M. Valuing the environment through contingent valuation. J. Econ. Perspect. 1994, 8, 19–43. [Google Scholar] [CrossRef]
- Lin, T.P.; De Dear, R.; Hwang, R.L. Effect of thermal adaptation on seasonal outdoor thermal comfort. Int. J. Climatol. 2011, 31, 302–312. [Google Scholar] [CrossRef]
- Mitchell, R.C.; Carson, R.T. Using Surveys to Value Public Goods: The Contingent Valuation Method; Resources for the Future: Washington, DC, USA, 1989. [Google Scholar]
- Soon, J.J.; Ahmad, S.A. Willingly or grudgingly? A meta-analysis on the willingness-to-pay for renewable energy use. Renew. Sustain. Energy Rev. 2015, 44, 877–887. [Google Scholar] [CrossRef]
- Dupont, D.P. Do children matter? An examination of gender differences in environmental valuation. Ecol. Econ. 2004, 49, 273–286. [Google Scholar] [CrossRef]
- Carson, R. Contingent Valuation: A Comprehensive Bibliography and History; Edward Elgar Publishing: Cheltenham, UK, 2012. [Google Scholar]
- Hanemann, M.; Loomis, J.; Kanninen, B. Statistical efficiency of double-bounded dichotomous choice contingent valuation. Am. J. Agric. Econ. 1991, 73, 1255–1263. [Google Scholar] [CrossRef]
- Carson, R.T.; Flores, N.E.; Meade, N.F. Contingent valuation: Controversies and evidence. Environ. Resour. Econ. 2001, 19, 173–210. [Google Scholar] [CrossRef]
- Lin, Y.; Wijedasa, L.S.; Chisholm, R.A. Singapore’s willingness to pay for mitigation of transboundary forest-fire haze from Indonesia. Environ. Res. Lett. 2017, 12, 024017. [Google Scholar] [CrossRef]
- Von Fintel, D. Dealing with earnings bracket responses in household surveys—How sharp are midpoint imputations? S. Afr. J. Econ. 2007, 75, 293–312. [Google Scholar] [CrossRef]
- Cooper, J.C. Optimal bid selection for dichotomous choice contingent valuation surveys. J. Environ. Econ. Manag. 1993, 24, 25–40. [Google Scholar] [CrossRef]
- Zsóka, Á.; Szerényi, Z.M.; Széchy, A.; Kocsis, T. Greening due to environmental education? Environmental knowledge, attitudes, consumer behavior and everyday pro-environmental activities of Hungarian high school and university students. J. Clean. Prod. 2013, 48, 126–138. [Google Scholar] [CrossRef]
- Kaiser, F.G.; Fuhrer, U. Ecological behavior’s dependency on different forms of knowledge. Appl. Psychol. 2003, 52, 598–613. [Google Scholar] [CrossRef]
- Mobley, C.; Vagias, W.M.; DeWard, S.L. Exploring additional determinants of environmentally responsible behavior: The influence of environmental literature and environmental attitudes. Environ. Behav. 2010, 42, 420–447. [Google Scholar] [CrossRef]
- Oğuz, D.; Kavas, S. Environmental awareness of university students in Ankara, Turkey. Afr. J. Agric. Res. 2010, 5, 2629–2636. [Google Scholar]
- Kennedy, E.H.; Beckley, T.M.; McFarlane, B.L.; Nadeau, S. Why we don’t “walk the talk”: Understanding the environmental values/behaviour gap in Canada. Hum. Ecol. Rev. 2009, 16, 151–160. [Google Scholar]
- Lopez-Feldman, A. Introduction to Contingent Valuation Using Stata; Centro de Investigacion y Docencia Economicas (CIDE): Toluca, Mexico, 2012. [Google Scholar]
- Cameron, T.A.; Quiggin, J. Estimation using contingent valuation data from a “dichotomous choice with follow-up” questionnaire. J. Environ. Econ. Manag. 1994, 27, 218–234. [Google Scholar] [CrossRef]
- Haab, T.C.; McConnell, K.E. Valuing Environmental and Natural Resources: The Econometrics of Non-Market Valuation; Edward Elgar Publishing: Cheltenham, UK, 2002. [Google Scholar]
- Li, X.X.; Koh, T.Y.; Entekhabi, D.; Roth, M.; Panda, J.; Norford, L.K. A multi-resolution ensemble study of a tropical urban environment and its interactions with the background regional atmosphere. J. Geophys. Res. Atmos. 2013, 118, 9804–9818. [Google Scholar] [CrossRef]
- Roth, M. Review of urban climate research in (sub) tropical regions. Int. J. Climatol. 2007, 27, 1859–1873. [Google Scholar] [CrossRef]
- Singapore Ministry of Finance, Singapore Budget 2020. Available online: https://www.singaporebudget.gov.sg/budget_2020 (accessed on 18 June 2020).
- Krupnick, A. Mortality-risk valuation and age: Stated preference evidence. Rev. Environ. Econ. Policy 2007, 1, 261–282. [Google Scholar] [CrossRef]
- Kotchen, M.J.; Boyle, K.J.; Leiserowitz, A.A. Willingness-to-pay and policy-instrument choice for climate-change policy in the United States. Energy Policy 2013, 55, 617–625. [Google Scholar] [CrossRef]


| Percentage of Respondents 1 | Percentage of Population 2 | |
|---|---|---|
| Gender | ||
| Male | 49.95% (n = 910) | 51.09% |
| Female | 49.34% (n = 899) | 48.90% |
| Prefer not to say | 0.71% (n = 13) | |
| Age distribution | ||
| 20 to 29 | 21.34% (n = 389) | 17% |
| 30 to 39 | 26.39% (n = 481) | 18% |
| 40 to 49 | 23.86% (n = 435) | 20% |
| 50 to 59 | 21.45% (n = 391) | 20% |
| 60 and above | 6.97% (n = 127) | 25% |
| Gross monthly income | ||
| No income | 2.36% (n = 43) | 3.3% |
| <2000 | 8.6% (n = 157) | 7.5% |
| 2000 to 4999 | 18.01% (n = 328) | 16.1% |
| 5000 to 9999 | 28.54% (n = 520) | 26.3% |
| 10,000 to 13,999 | 16.35% (n = 298) | 17.5% |
| 14,000 and above | 26.12% (n = 476) | 21.9% |
| Bid Bundles | |||||||
|---|---|---|---|---|---|---|---|
| Random Number | 1 | 2 | 3 | 4 | 5 | 6 | 7 |
| First bid (X1) | 0.10% | 0.30% | 0.50% | 1.0% | 1.50% | 3.0% | 4.50% |
| Second bid (Xhigh) | 0.30% | 0.50% | 1.00% | 1.50% | 3.0% | 4.50% | 5.50% |
| Second bid (Xlow) | 0.05% | 0.10% | 0.30% | 0.50% | 1.0% | 1.50% | 3.0% |
| Bid Bundle | Sample | YES-YES | YES-NO | NO-YES | NO-NO | ||||
|---|---|---|---|---|---|---|---|---|---|
| Number | Observations | Freq. | % | Freq. | % | Freq. | % | Freq. | % |
| 1 | 262 | 92 | 21.51 | 60 | 17.51 | 19 | 16.67 | 91 | 9.66 |
| 2 | 261 | 79 | 18.44 | 54 | 15.73 | 27 | 24.07 | 101 | 10.84 |
| 3 | 261 | 58 | 13.48 | 52 | 15.13 | 14 | 12.04 | 137 | 14.7 |
| 4 | 262 | 56 | 13 | 51 | 14.84 | 16 | 13.89 | 139 | 14.81 |
| 5 | 259 | 51 | 11.82 | 50 | 14.54 | 17 | 14.81 | 141 | 15.13 |
| 6 | 260 | 48 | 11.11 | 43 | 12.46 | 14 | 12.04 | 155 | 16.63 |
| 7 | 257 | 46 | 10.64 | 33 | 9.79 | 8 | 6.48 | 170 | 18.24 |
| Total | 1822 | 430 | 23.5 | 343 | 18.72 | 115 | 6 | 934 | 51.78 |
| Demographic and Socio-Economic Characteristics | Number of Respondents | Percentage of Respondents (in %) |
|---|---|---|
| Gender | Males: 910: Female 899 | males 49.92: Females 49.29 |
| Age distribution | ||
| 20 to 29 | 389 | 21.34 |
| 30 to 39 | 481 | 26.39 |
| 40 to 49 | 435 | 23.86 |
| 50 to 59 | 391 | 21.45 |
| 60 and above | 127 | 6.97 |
| Gross monthly income | ||
| No Income | 43 | 2.36 |
| less_than_$1000 | 61 | 3.35 |
| $1001–$2000 | 96 | 5.27 |
| $2001–$3000 | 108 | 5.93 |
| $3001–$4000 | 106 | 5.82 |
| $4001–$5000 | 114 | 6.26 |
| $5001–$6000 | 139 | 7.63 |
| $6001–$7000 | 116 | 6.37 |
| $7001–$8000 | 100 | 5.49 |
| $8001–$9000 | 87 | 4.77 |
| $9001–$10,000 | 78 | 4.28 |
| $10,001–$11,000 | 109 | 5.98 |
| $11,001–$12,000 | 51 | 2.8 |
| $12,001–$13,000 | 90 | 4.94 |
| $13001–$14000 | 48 | 2.63 |
| above_$14,000 | 476 | 26.12 |
| Education | ||
| Primary & below | 27 | 1.48 |
| n/o levels | 209 | 11.47 |
| A levels/diploma | 564 | 30.96 |
| bachelors | 769 | 42.21 |
| postgraduate | 226 | 12.4 |
| Employment | ||
| student | 58 | 3.18 |
| employed | 1,368 | 75.08 |
| self-employed | 145 | 7.96 |
| unemployed(seeking) | 184 | 10.1 |
| Number of Children | ||
| 0 | 988 | 54.23 |
| 1 | 414 | 22.72 |
| 2 | 311 | 17.07 |
| 3 or more | 100 | 5.69 |
| Marital Status | ||
| single | 637 | 34.96 |
| married | 1,088 | 59.71 |
| divorced/separated | 81 | 4.45 |
| (1) | (2) | (3) | (4) | (5) | (6) | (7) | (8) |
|---|---|---|---|---|---|---|---|
| Regions | Number of Respondents Per Region | Estimated Population Per Region 1 | % of Respondents from the Estimated Population | Mean WTP Estimation Per Singaporean (in SGD$) | Mean UHI Intensity (in °C) | Mean Annual Income (in SGD$) | % WTP from the Mean Annual Income |
| Central | 429 | 753,068 | 0.057 | 665.968 | 2.2 | 56,661.97 | 1.18 |
| East | 311 | 516,138 | 0.060 | 218.656 *** | 1.31 *** | 57,533.98 | 0.38 *** |
| North | 245 | 404,038 | 0.061 | 138.748 *** | 1.6 *** | 57,719.01 | 0.24 *** |
| Northeast | 439 | 752,028 | 0.058 | 84.232 *** | 1.6 *** | 56,471.4 | 0.15 *** |
| West | 398 | 751,428 | 0.053 | 120.292 *** | 2.08 *** | 60,969.7 | 0.20 *** |
| Total | 1822 | 3,176,700 | 0.29 | 246.51 | 1.758 | 57,790 | 0.43 |
| (1) | (2) | (3) | (4) | |||||
|---|---|---|---|---|---|---|---|---|
| Model without Covariates | Model with UHI Intensity | Model with UHI Intensity, Demographic and Socio-Economic Covariates | Model with UHI Intensity, Demographic, Socio-Economic, Awareness, Attitudes and Outdoor Preferences Covariates | |||||
| VARIABLES | ||||||||
| Bid | −0.159 *** | (0.024) | −0.161 *** | (0.0243) | −0.179 *** | (0.0253) | −0.184 *** | (0.0255) |
| Mean UHI intensity per region | 0.318 ** | (0.145) | 0.312 ** | (0.150) | 0.346 ** | (0.152) | ||
| Age: 20–35 years old | Ref | Ref | ||||||
| 35 to 50 years old | −0.250 | (0.222) | −0.303 | (0.225) | ||||
| Older than 51 years | −0.732 *** | (0.213) | −0.763 *** | (0.2159) | ||||
| Gender: Male | Ref | Ref | ||||||
| Female | −0.411 *** | (0.101) | −0.393 *** | (0.102) | ||||
| Income | 0.0382 *** | (0.0978) | 0.0375 *** | (0.0156) | ||||
| Marital status: Divorced | Ref | Ref | ||||||
| Single | 0.556 ** | (0.262) | 0.464 ** | (0.2654) | ||||
| Married | 0.418 * | (0.249) | 0.32 * | (0.2527) | ||||
| Education | 0.106 ** | (0.044) | 0.0928 ** | (0.0479) | ||||
| Presence of children | 0.558 *** | (0.117) | 0.541 *** | (0.1187) | ||||
| Employment status: Unemployed | Ref | Ref | ||||||
| Student | 0.846 ** | (0.346) | 0.826 ** | (0.3409) | ||||
| Employed | −0.147 | (0.153) | −0.167 | (0.1634) | ||||
| Self-employed | −0.0092 | (0.226) | −0.0124 | (0.2293) | ||||
| Level of awareness of need for UHI mitigation | 0.263 *** | (0.0975) | ||||||
| Level of attitudes towards mitigation strategies | 0.210 *** | (0.107) | ||||||
| Outdoors preferences | 0.180 *** | (0.0608) | ||||||
| Mean WTP | 246.51 *** | (92.077) | 276.21 *** | (102.01) | 284.13 *** | (114.67) | 293.91 *** | (116.08) |
| Constant | 0.3923 *** | (0.1061) | −0.173 *** | (0.279) | −0.585 *** | (0.444) | −2.436 *** | (0.561) |
| Observations | 1817 | 1817 | 1790 | 1790 | ||||
| Wald statistic | 43.66 *** | 48.51 *** | 131.9 *** | 157.37 *** | ||||
| Log-likelihood | −1224.138 | −1214.169 | −1146.91 | −1130.527 | ||||
© 2020 by the authors. Licensee MDPI, Basel, Switzerland. This article is an open access article distributed under the terms and conditions of the Creative Commons Attribution (CC BY) license (http://creativecommons.org/licenses/by/4.0/).
Share and Cite
Borzino, N.; Chng, S.; Mughal, M.O.; Schubert, R. Willingness to Pay for Urban Heat Island Mitigation: A Case Study of Singapore. Climate 2020, 8, 82. https://doi.org/10.3390/cli8070082
Borzino N, Chng S, Mughal MO, Schubert R. Willingness to Pay for Urban Heat Island Mitigation: A Case Study of Singapore. Climate. 2020; 8(7):82. https://doi.org/10.3390/cli8070082
Chicago/Turabian StyleBorzino, Natalia, Samuel Chng, Muhammad Omer Mughal, and Renate Schubert. 2020. "Willingness to Pay for Urban Heat Island Mitigation: A Case Study of Singapore" Climate 8, no. 7: 82. https://doi.org/10.3390/cli8070082
APA StyleBorzino, N., Chng, S., Mughal, M. O., & Schubert, R. (2020). Willingness to Pay for Urban Heat Island Mitigation: A Case Study of Singapore. Climate, 8(7), 82. https://doi.org/10.3390/cli8070082