Trends of Climate Change in Saudi Arabia: Implications on Water Resources


Abstract
:1. Introduction
2. Methodology
2.1. Data Statistics
2.2. Trend Analysis
2.3. NCAR Community Climate System Model (CCSM4) Data
3. Results and Discussion
3.1. Statistical Analysis
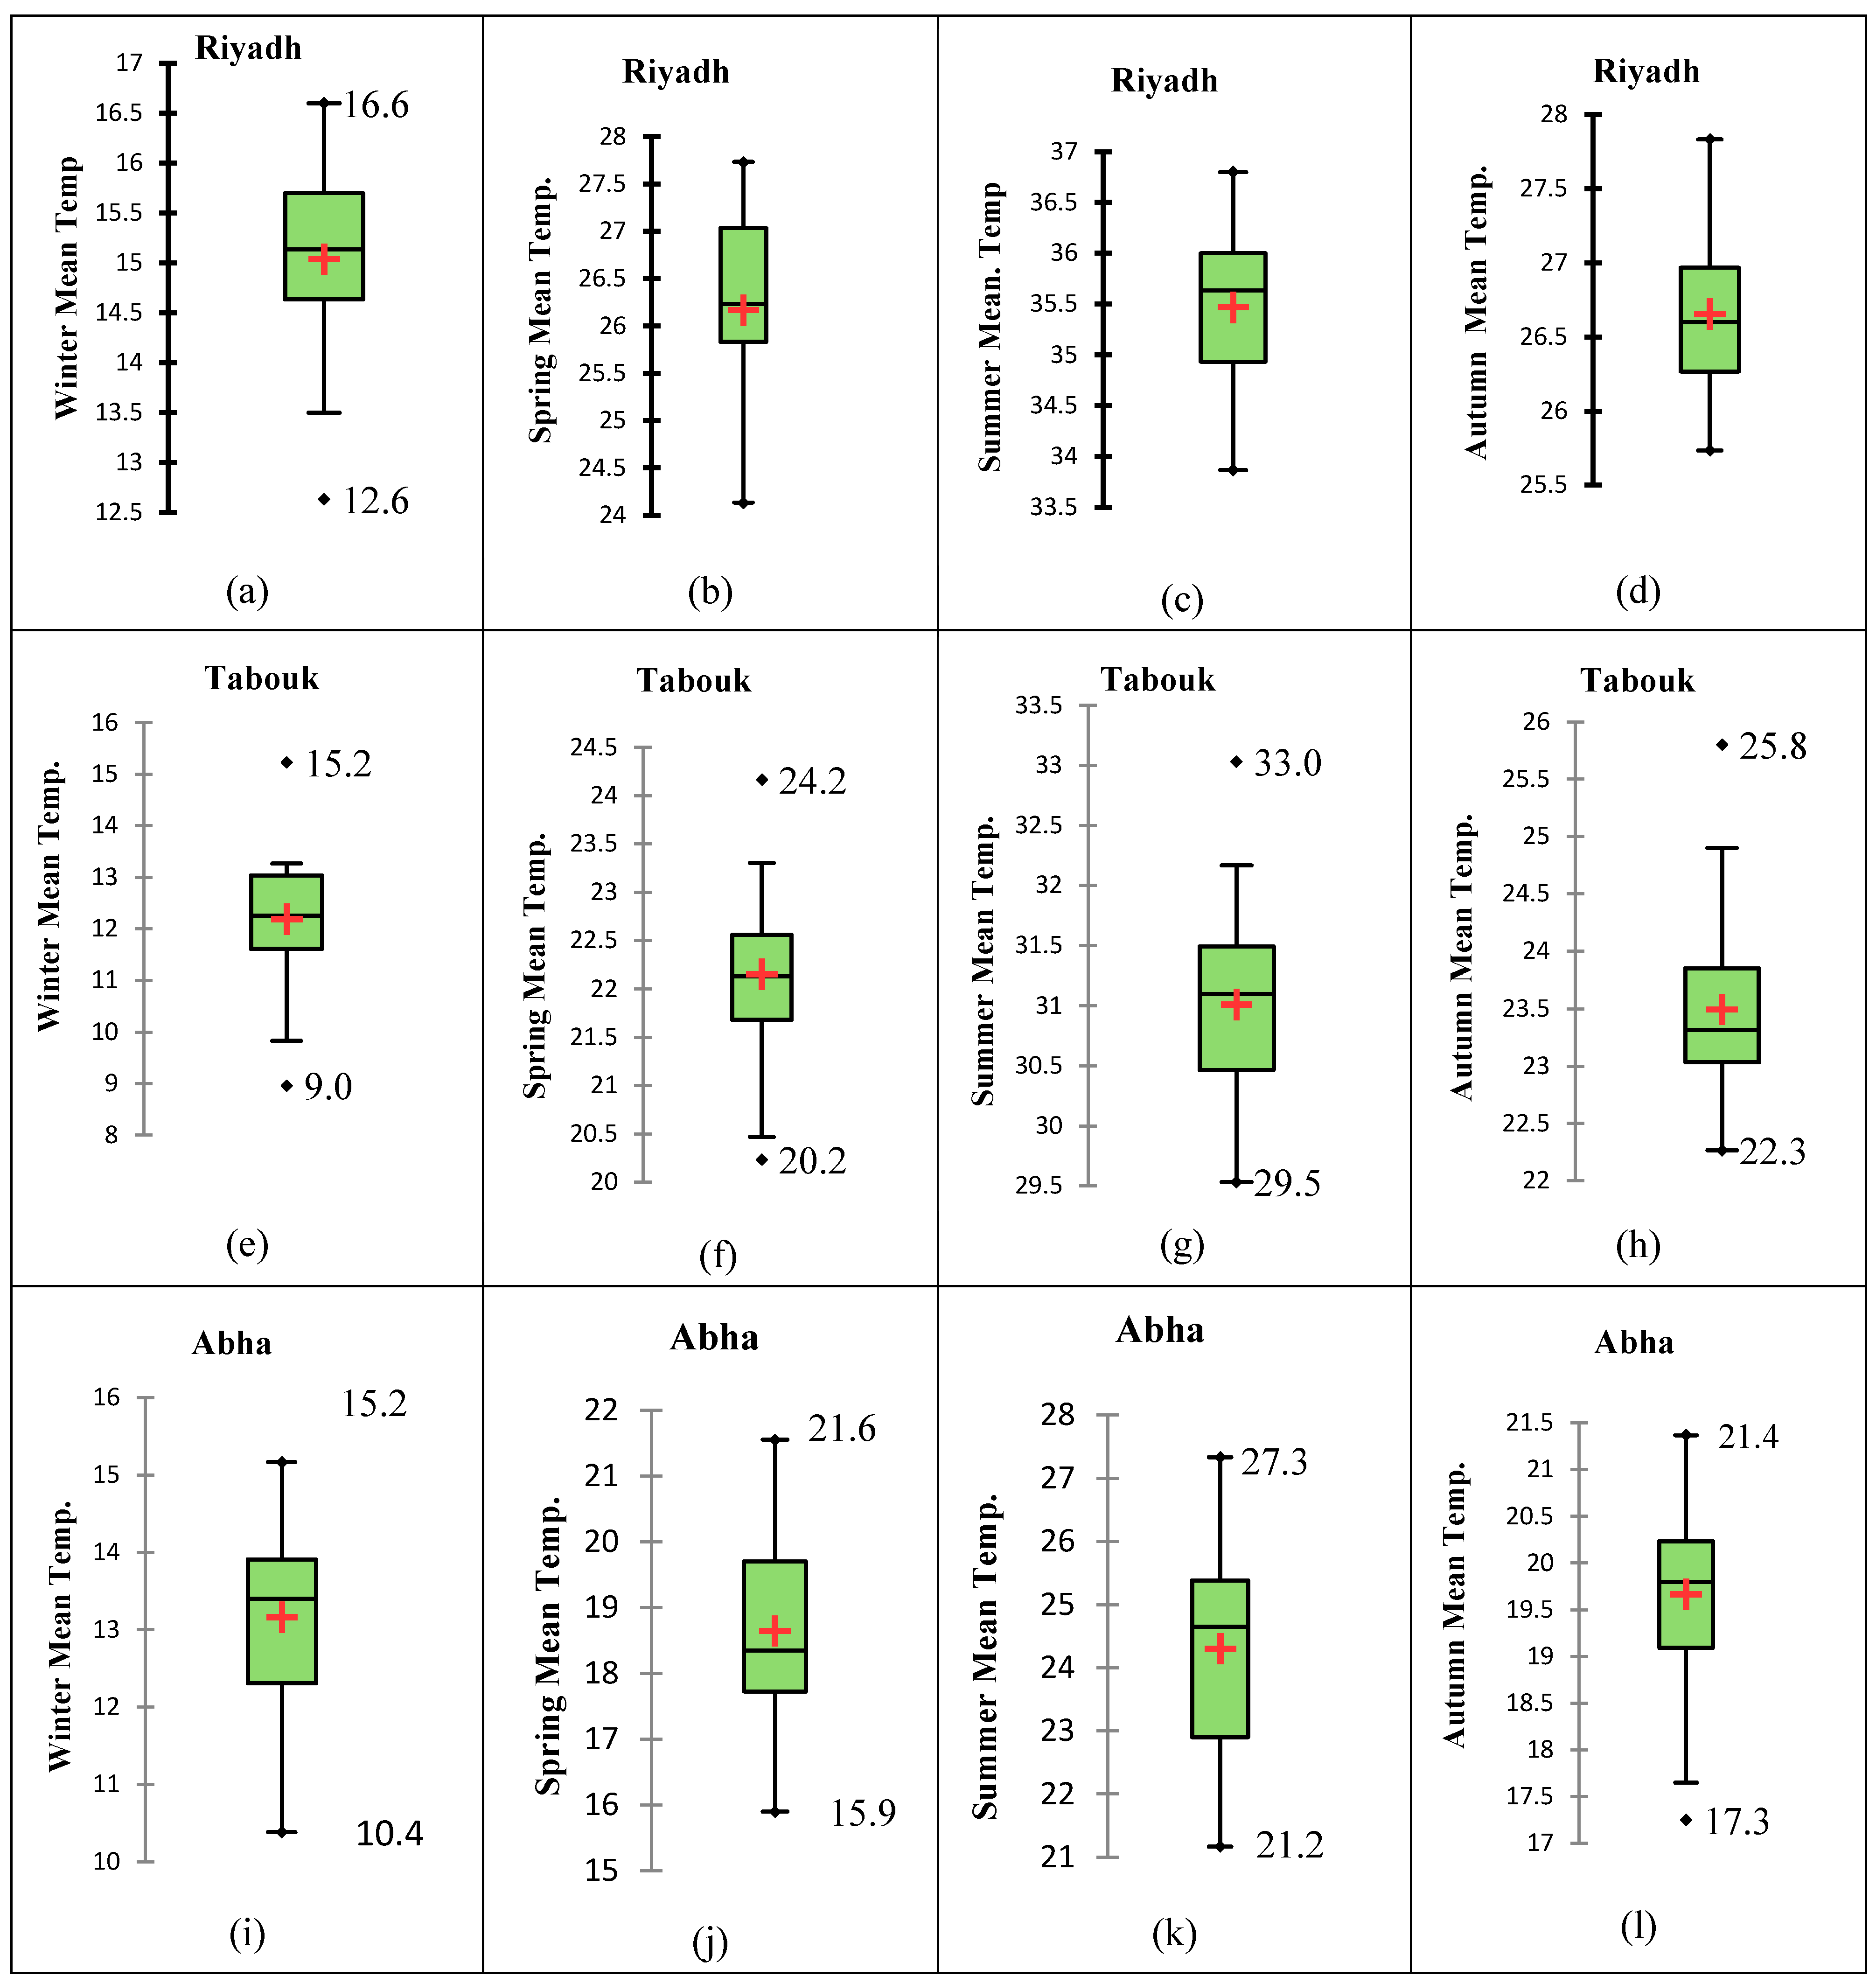
3.1.1. Temperature
Central Region
North Region
Southwest Region
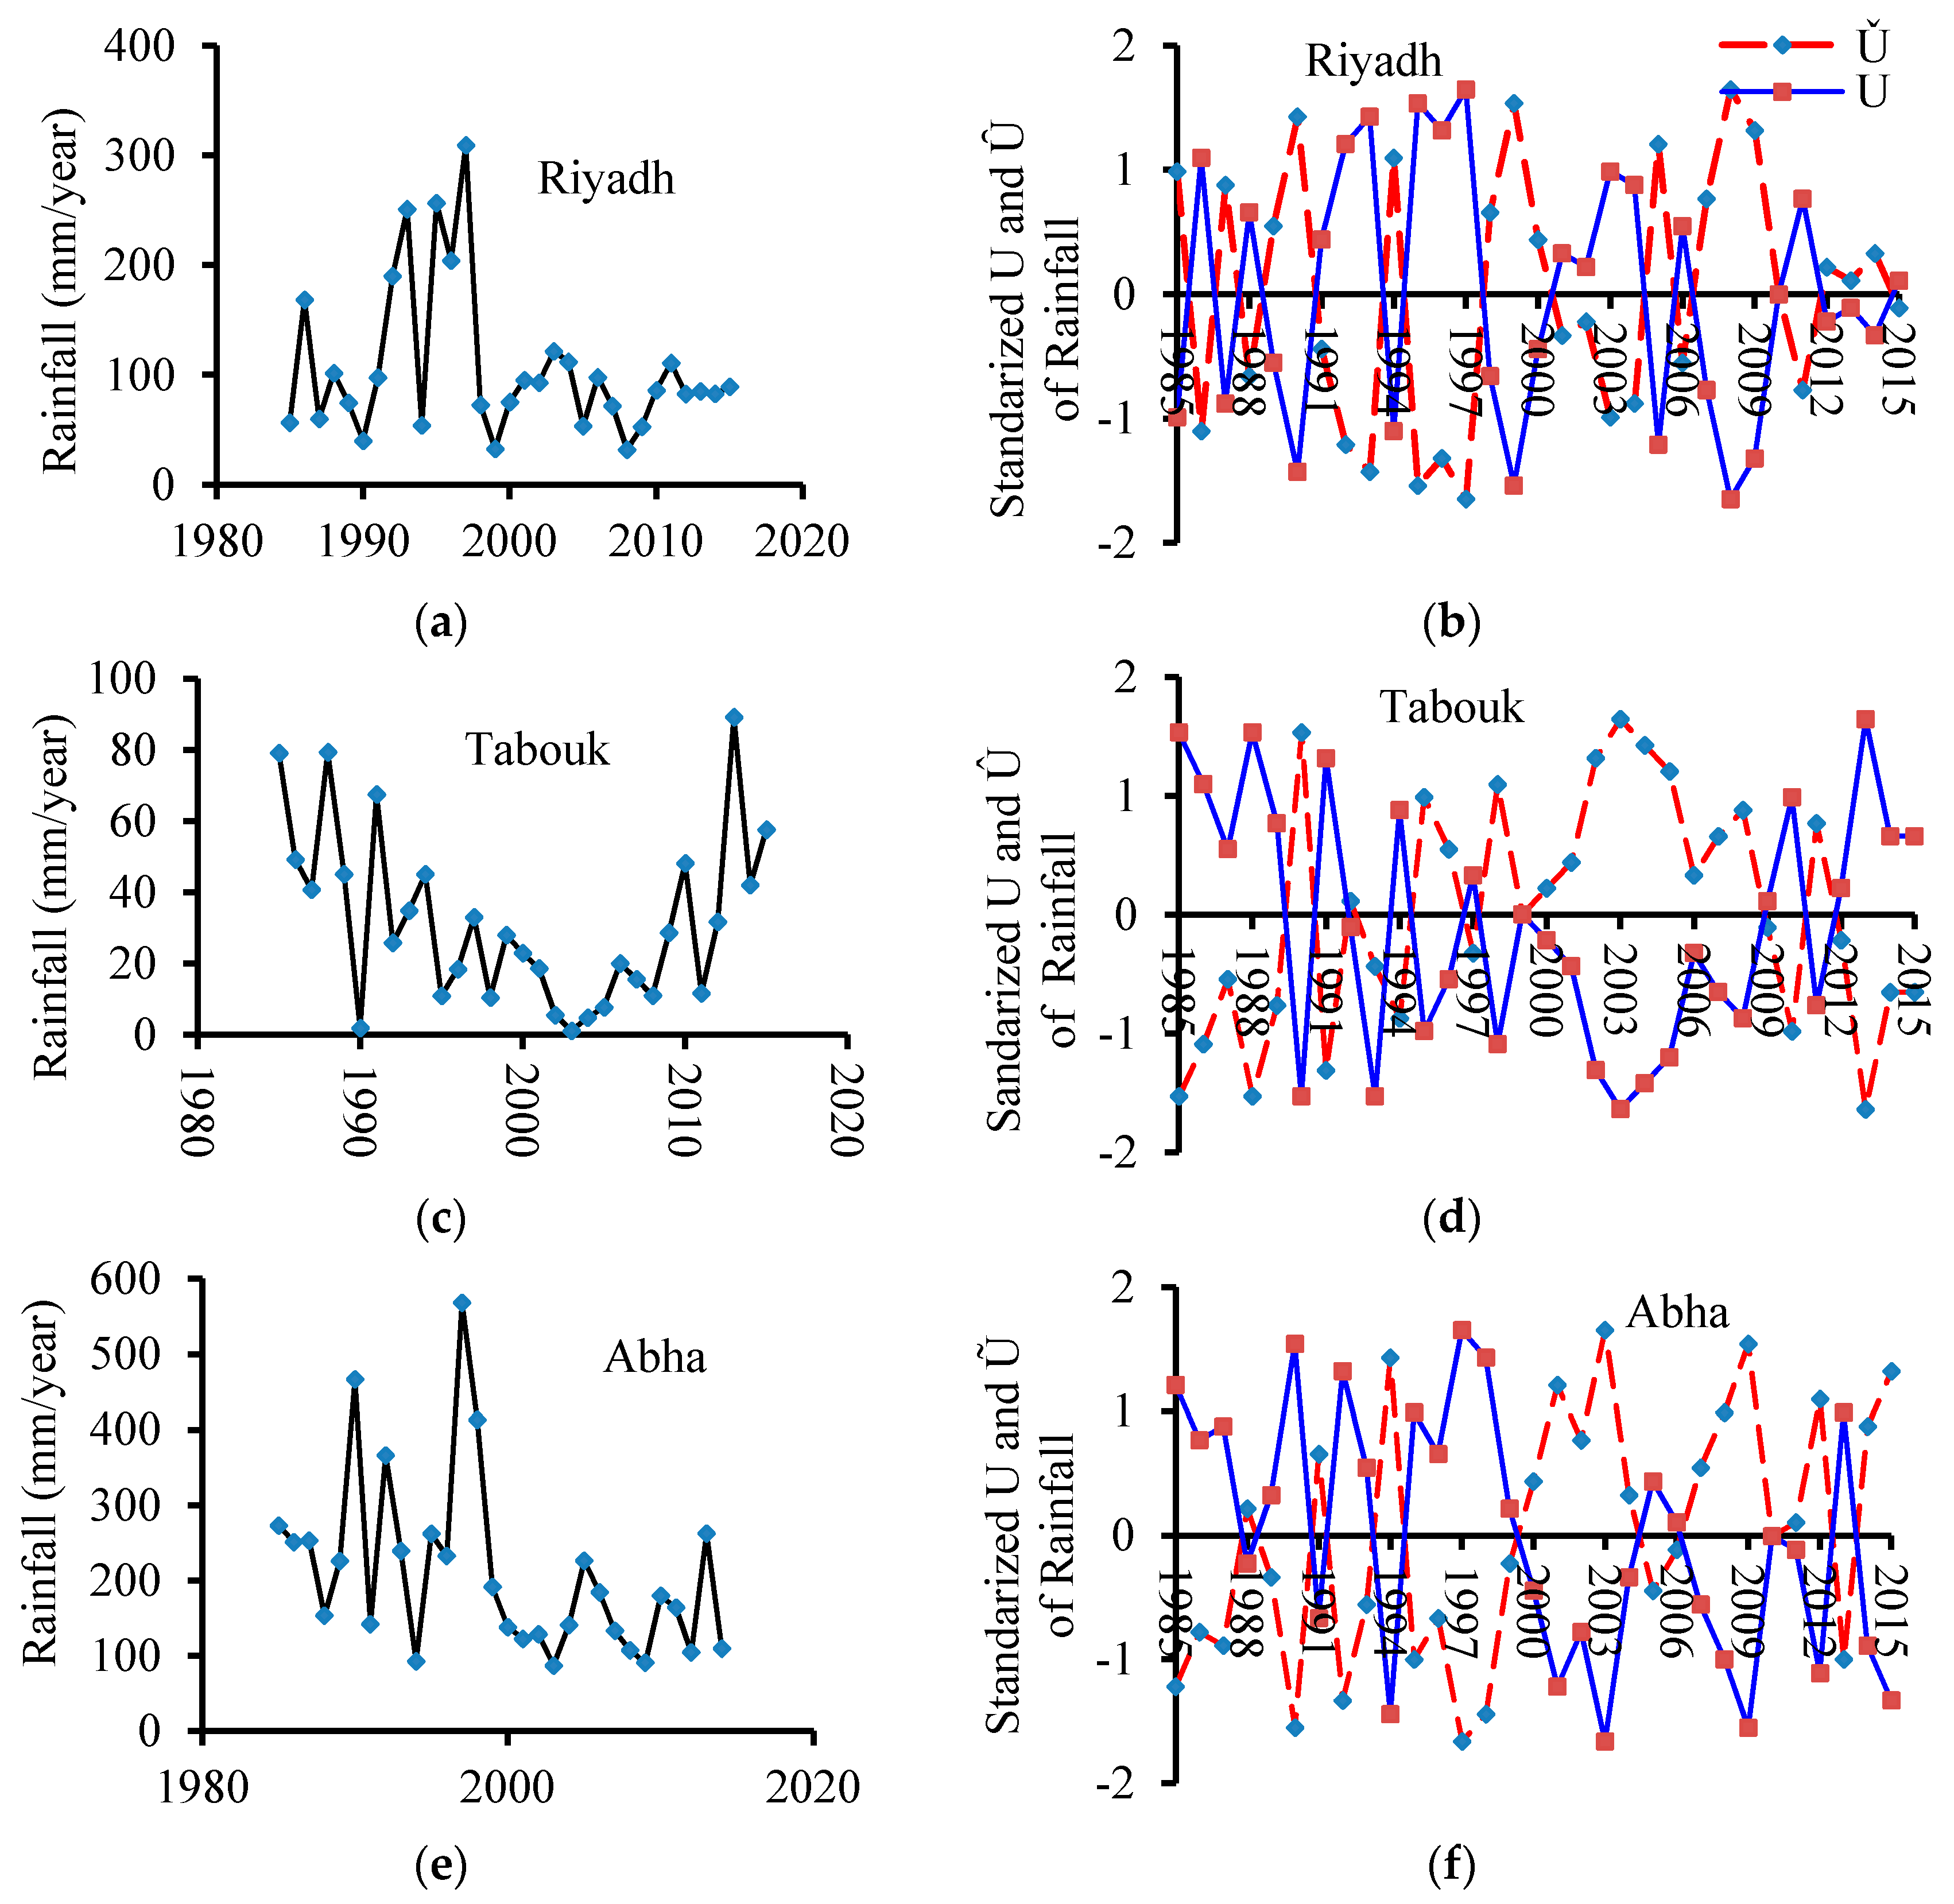
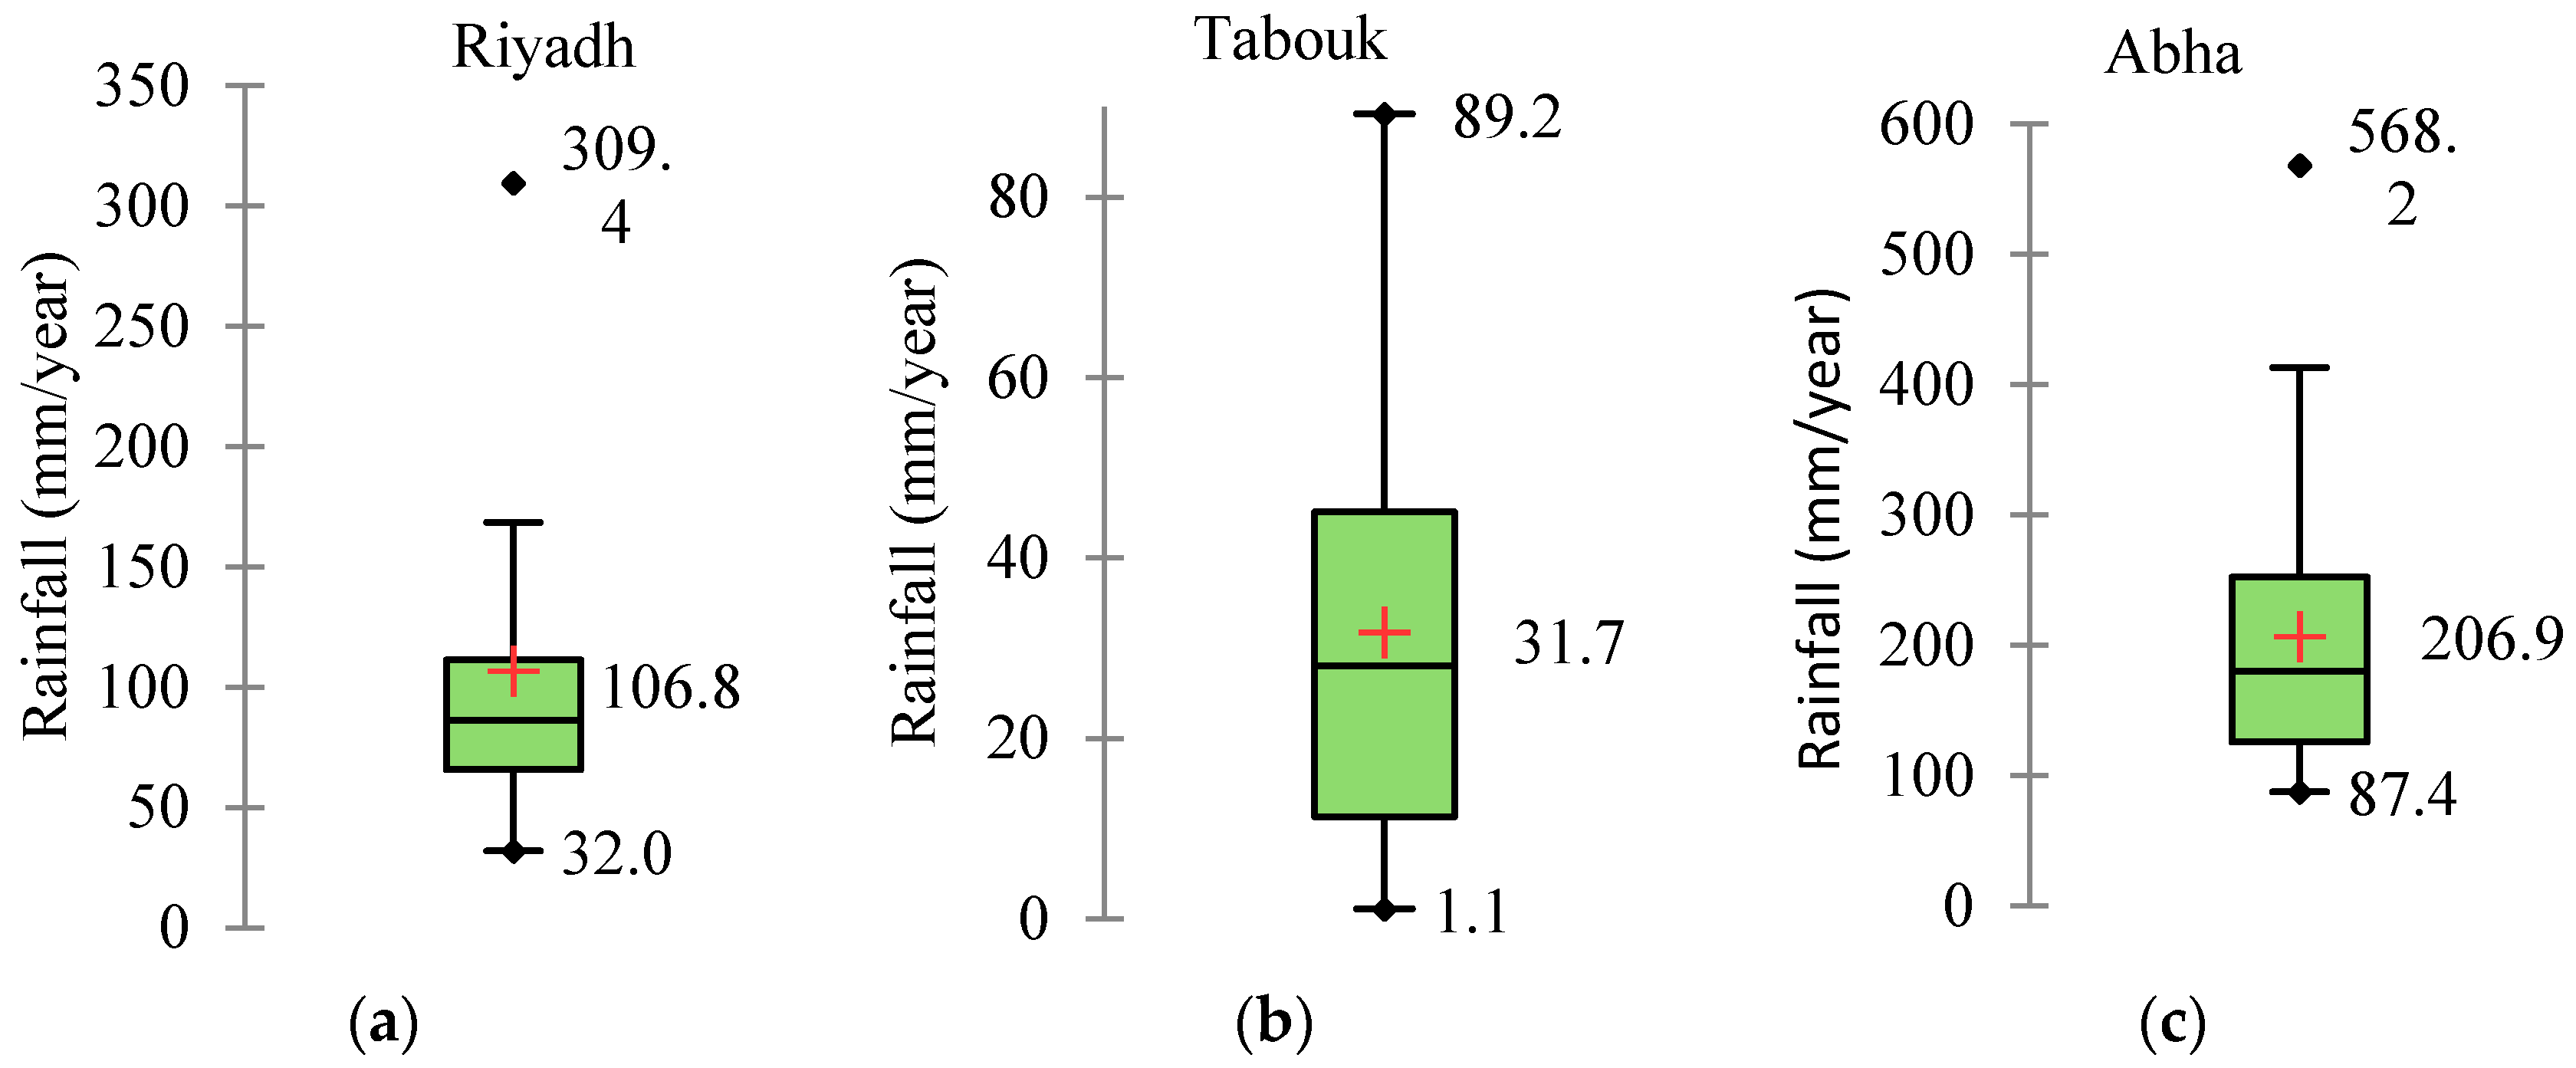
3.1.2. Rainfall
3.2. Trend Analysis
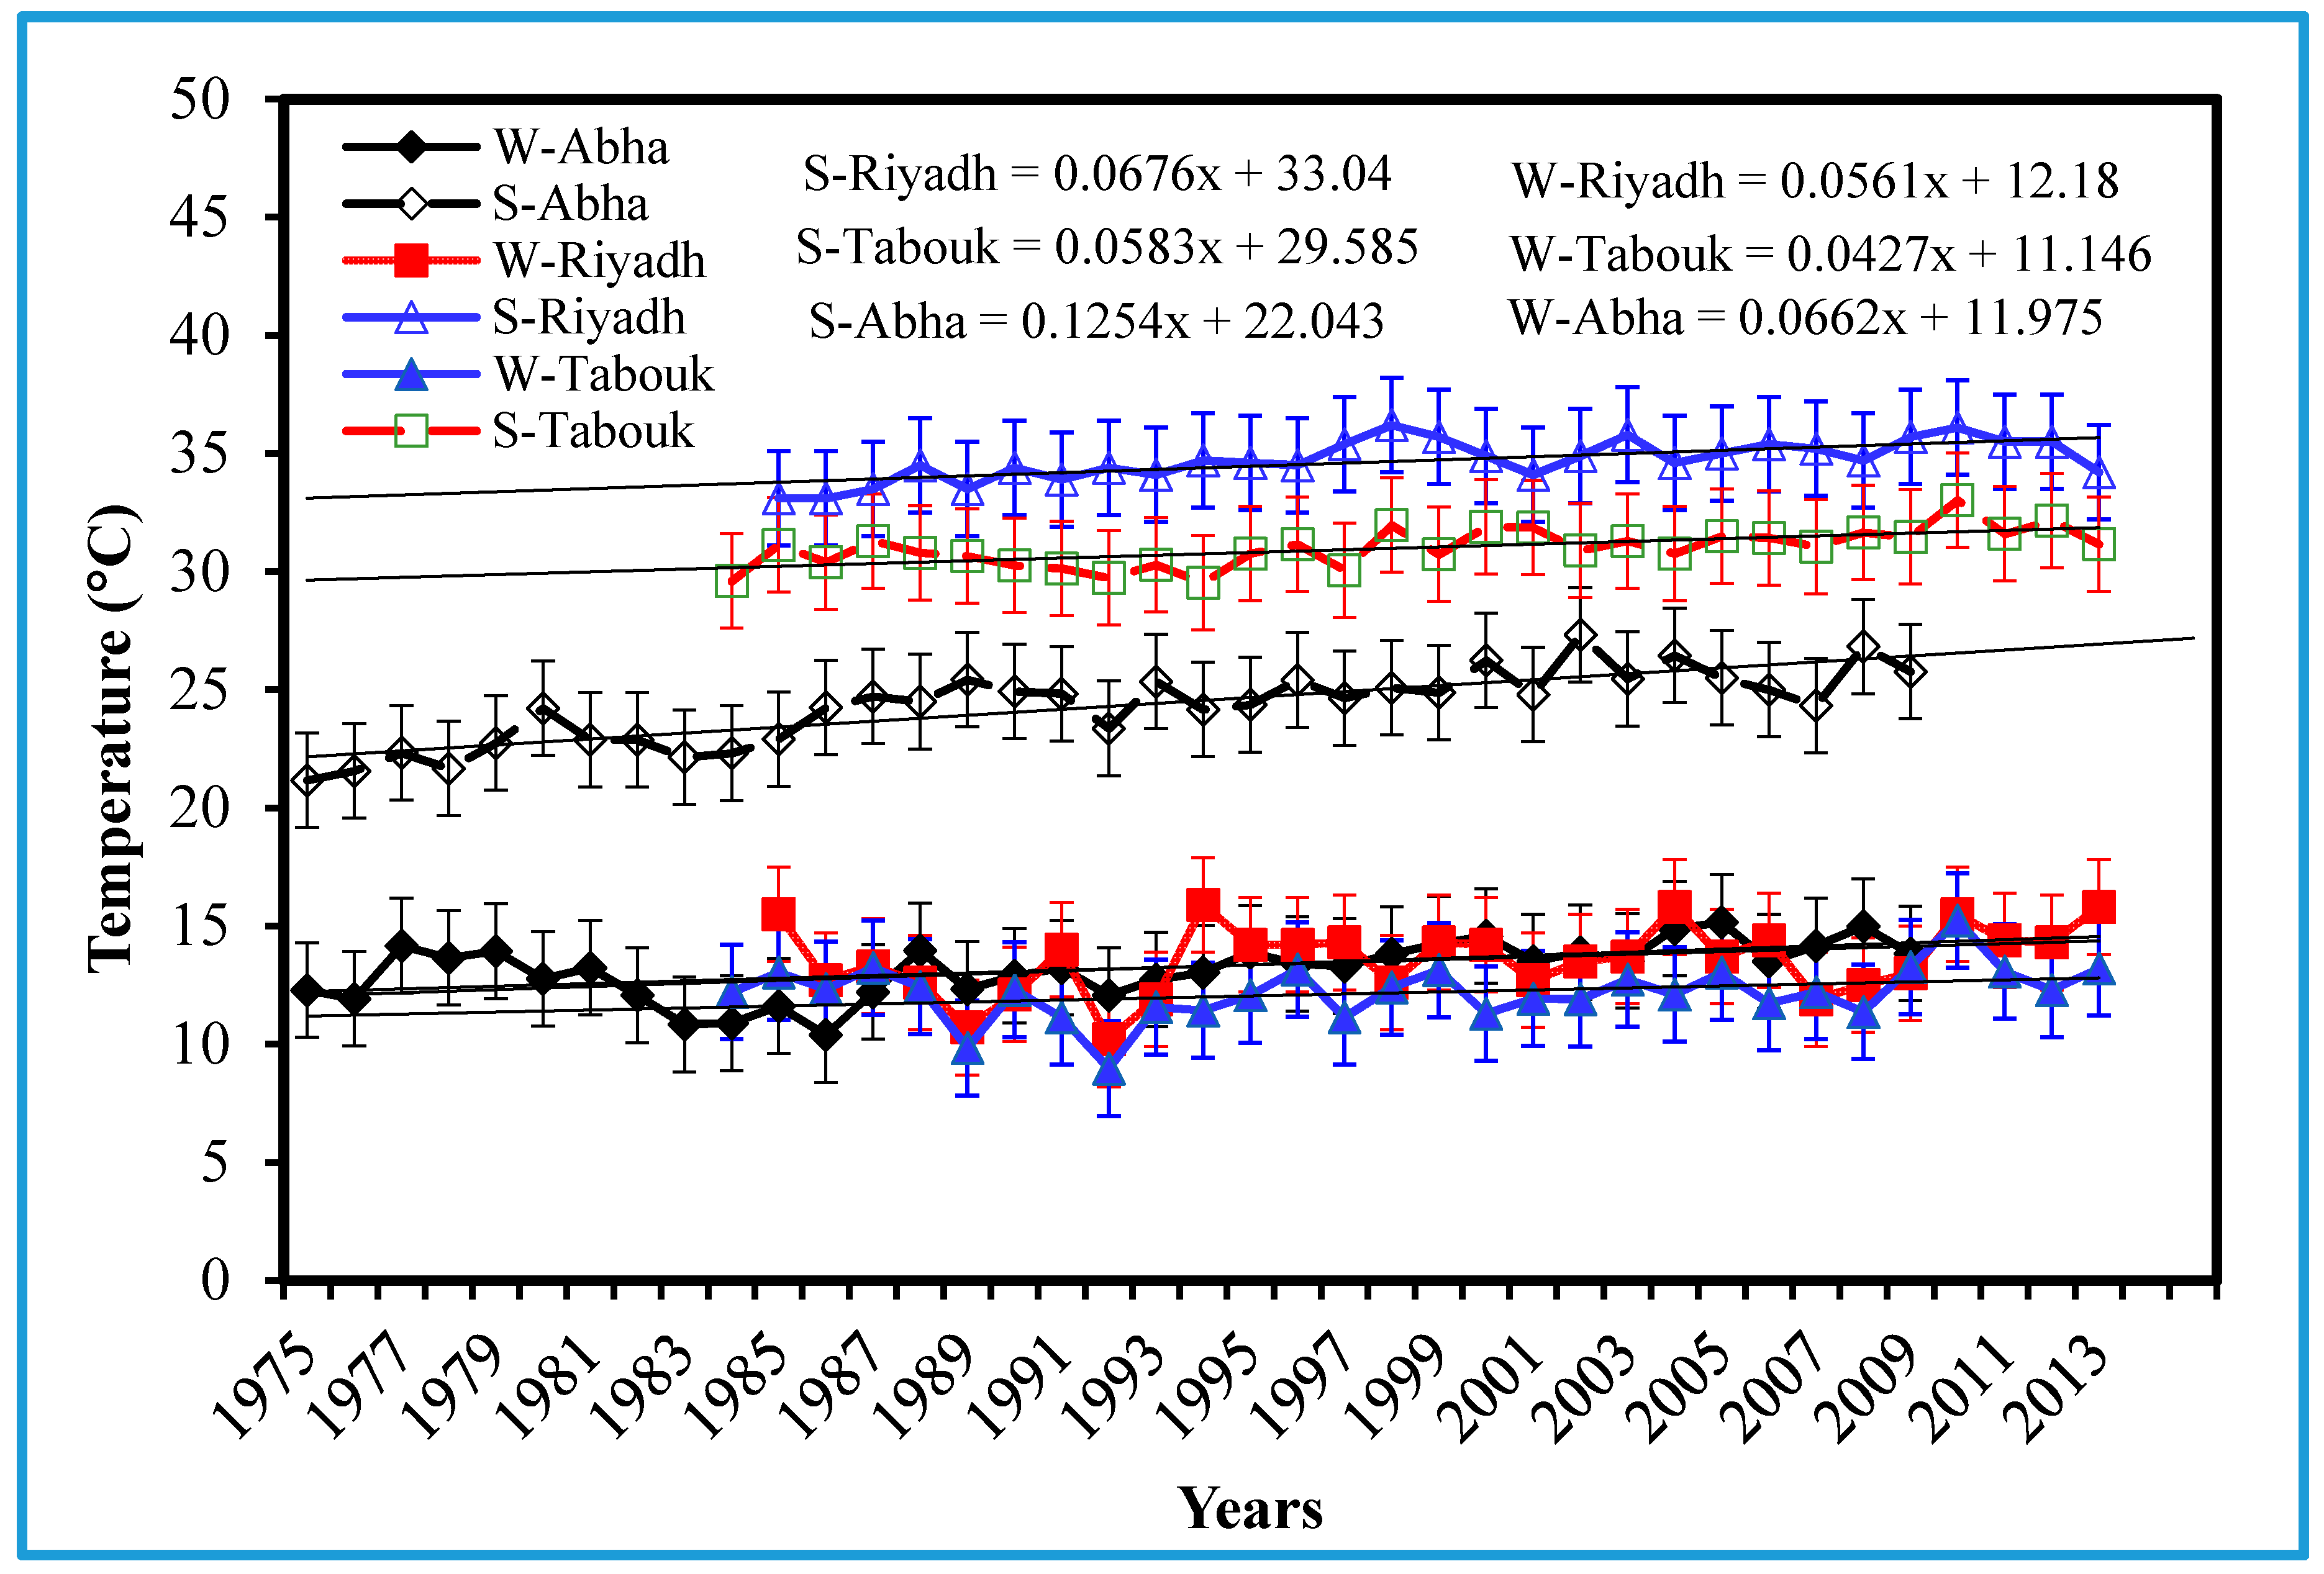
3.2.1. Temperature
3.2.2. Rainfall
3.3. Climate Change Prediction
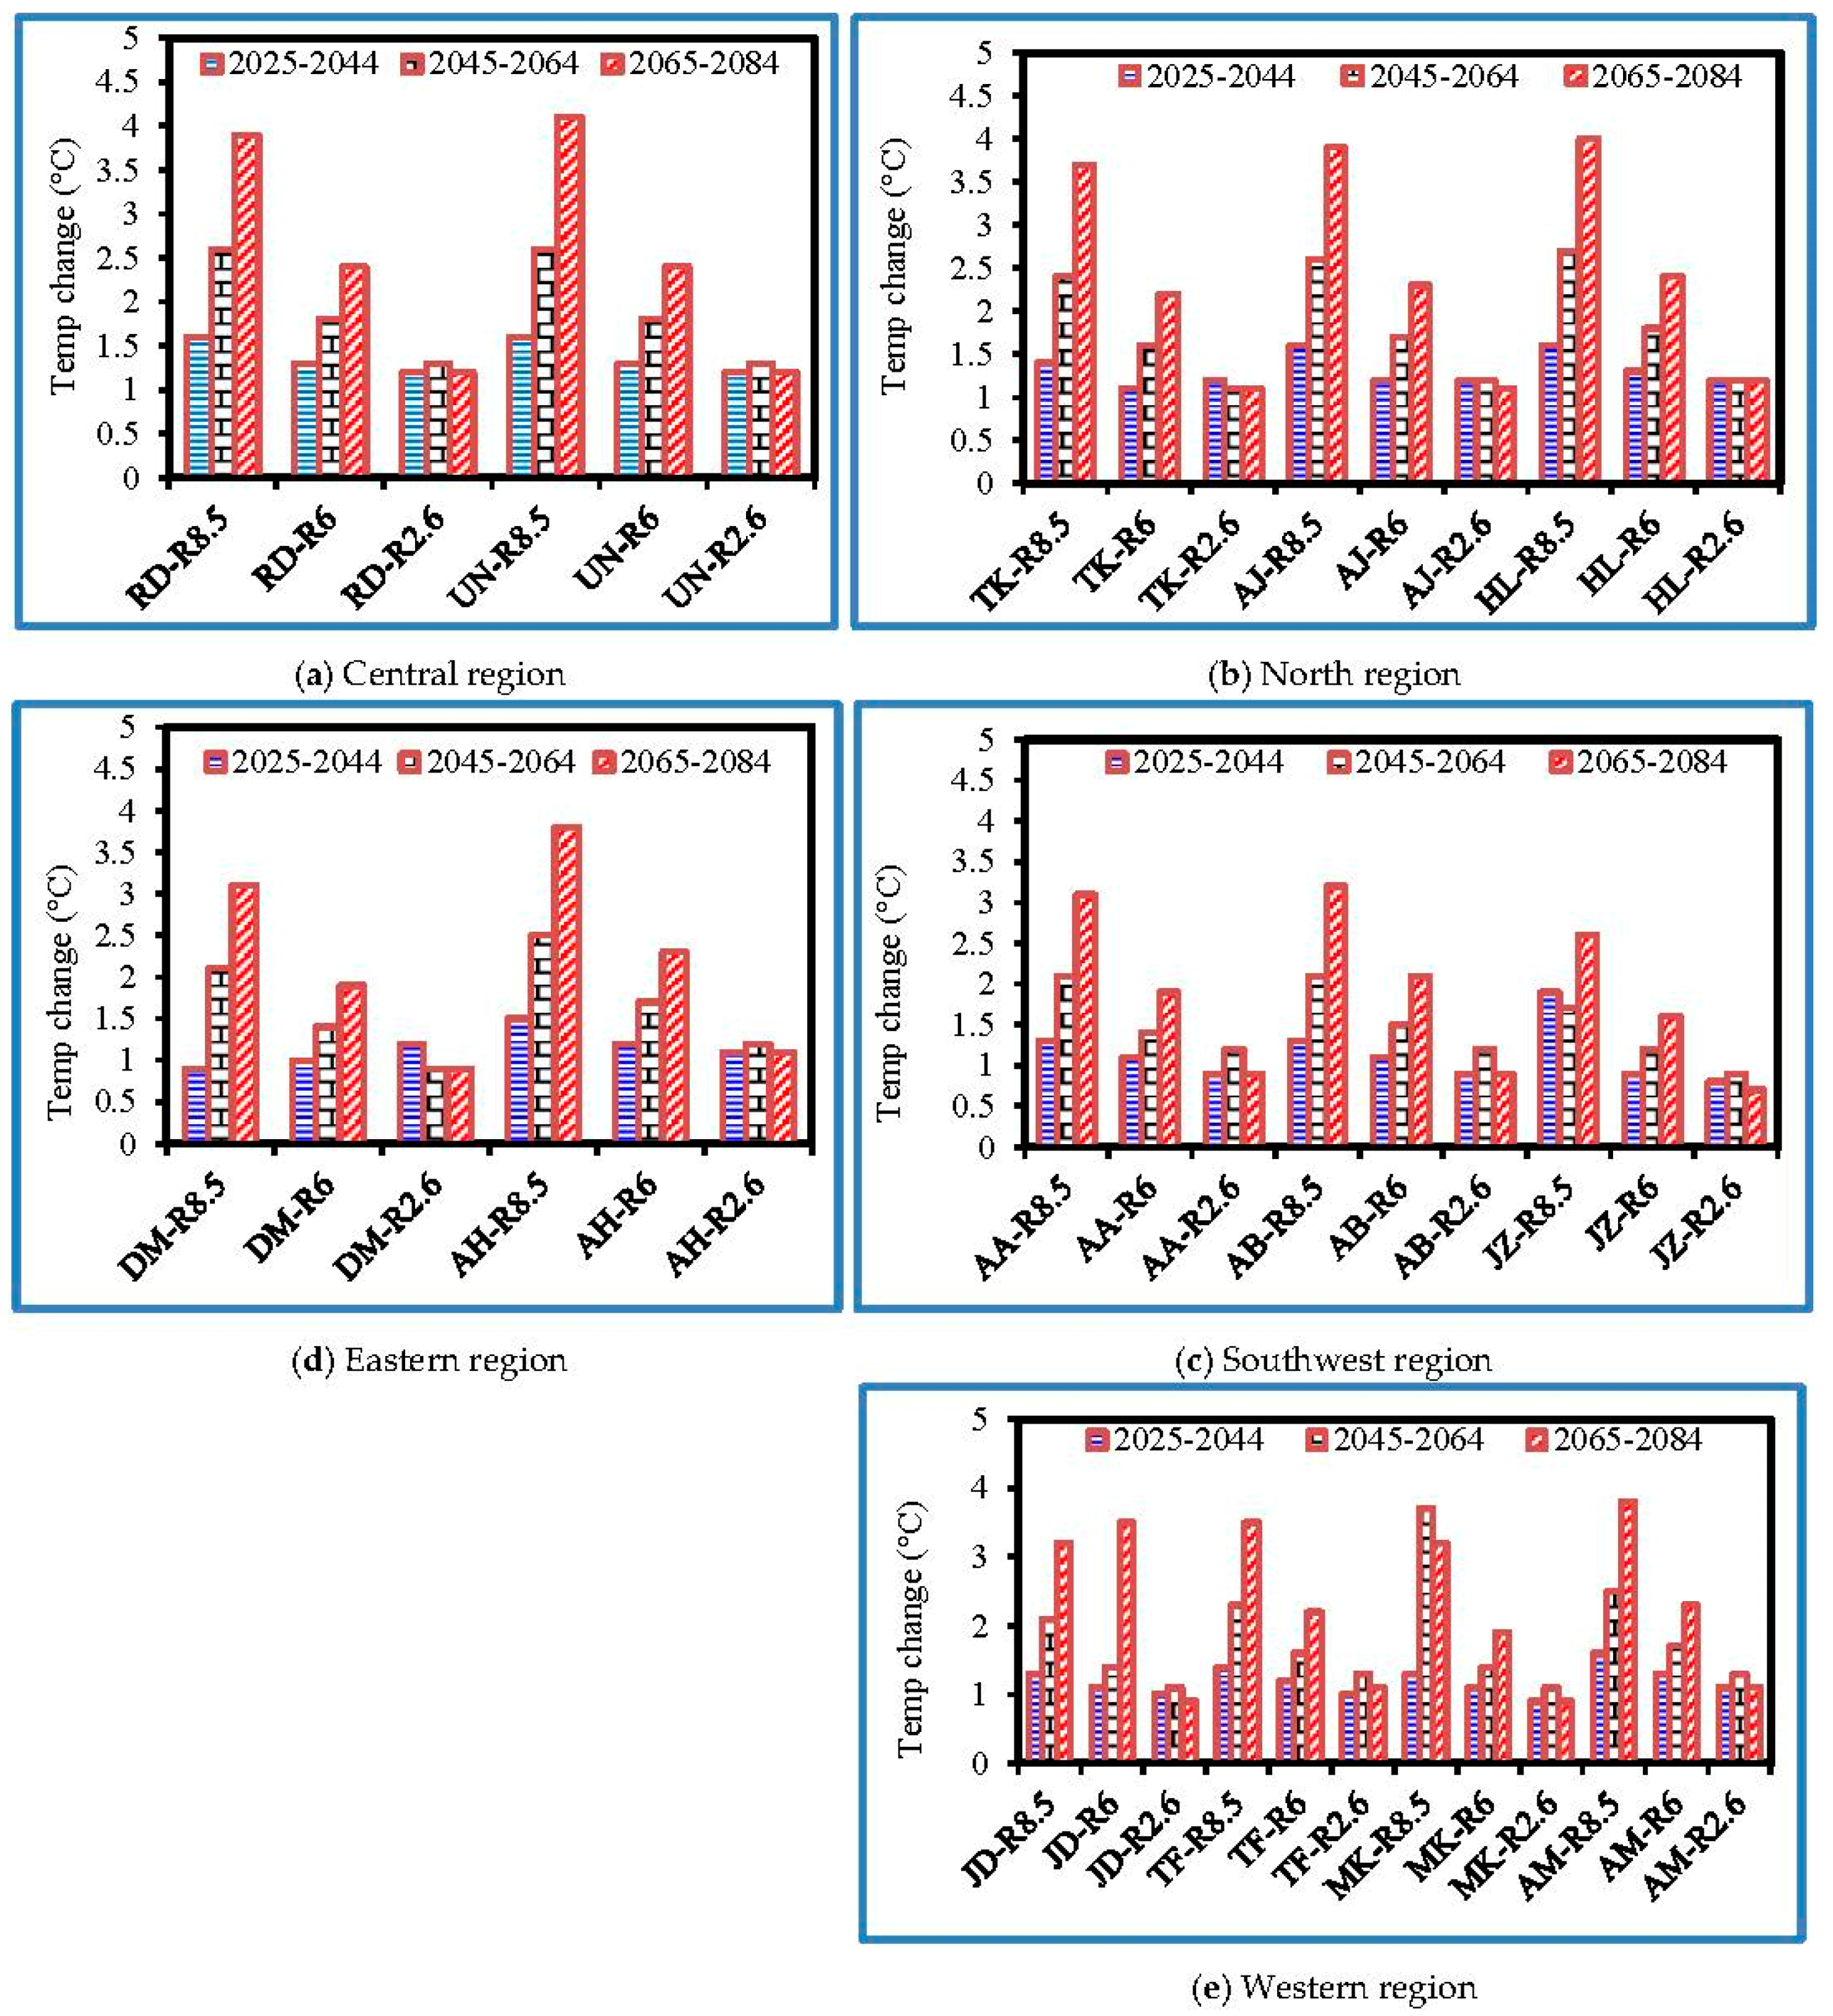
3.3.1. Temperature
Central Region
North Region
Southwest Region
Eastern Region
Western Region
3.3.2. Rainfall
Central Region
North Region
Southwest Region
Eastern Region
Western Region
4. Implications on Water Resources and Quality
5. Conclusions
Acknowledgments
Author Contributions
Conflicts of Interest
References
- Hasanean, H.; Almazroui, M. Rainfall: Features and Variations over Saudi Arabia, A Review. Climate 2015, 3, 578–626. [Google Scholar] [CrossRef]
- Chowdhury, S.; Al-Zahrani, M. Implications of Climate Change on Water Resources in Saudi Arabia. Arab. J. Sci. Eng. 2013, 38, 1959–1971. [Google Scholar] [CrossRef]
- Al-Zawad, F.M. Impacts of climate change on water resources in Saudi Arabia. In Proceedings of the 3rd International Conference on Water Resources and Arid Environments and the 1st Arab Water Forum, Riyadh, Saudi Arabia, 16–19 November 2008. [Google Scholar]
- Rehman, S.; Al-Hadhrmi, L.M. Extreme Temperature Trend on the West Coast of Saudi Arabia. Atmos. Clim. Sci. 2012, 2, 352–361. [Google Scholar] [CrossRef]
- Almazroui, M. Simultaion of present and future climate of Saudi Arabia using a regional model (PRECIS). Int. J. Climatol. 2013, 33, 2247–2259. [Google Scholar] [CrossRef]
- IPCC (Intergovernmental Panel on Climate Change). Climate change. In The IPCC Second Assessment Report; Houghton, J.T., Meira Filho, L.G., Callander, B.A., Harris, N., Kattenberg, A., Maskell, K., Eds.; Cambridge University Press: New York, NY, USA, 1996. [Google Scholar]
- Addisu, S.; Selassie, Y.G.; Fissha, G.; Gedif, B. Time series trend analysis of temperature and rainfall in lake Tana Sub-Basin, Ethiopia. Environ. Syst. Res. 2015, 4, 1–12. [Google Scholar] [CrossRef]
- Weigel, A.P.; Liniger, M.A.; Appenzeller, C. Can multi-model combination really enhance the prediction skill of probabilistic ensemble forecasts? Q. J. R. Meteorol. Soc. 2008, 134, 241–260. [Google Scholar] [CrossRef]
- IPCC (Intergovernmental Panel on Climate Change). Data Distribution Centre. 2006. Available online: http://www.mad.zmaw.de/IPCC_DDC/html/SRES_TAR/index.html (accessed on 20 November 2010).
- WHO (World Health Organization). Climate Change and Human Health—Risk and Responses, WHO Summary Report; WHO: Geneva, Switzerland, 2002. [Google Scholar]
- Patz, J.A.; Lendrum, D.C.; Holloway, T.; Foley, J.A. Impact of regional climate change on human health. Nature 2005, 438, 310–317. [Google Scholar] [CrossRef] [PubMed]
- UNOCHA (United Nations Office for the Coordination of Humanitarian Affairs). Climatic Change and Human Vulnerability; UNOCHA: Zeneva, Switzerland, 2008. [Google Scholar]
- IPCC (Intergovernmental Panel on Climate Change). Climate Change: Third Assessment Report of the Intergovernmental Panel on Climate Change; Cambridge University Press: Cambridge, UK, 2001. [Google Scholar]
- DeNicola, E.; Aburizaiza, O.S.; Siddique, A.; Khwaja, H.; Carpenter, M.D. Climate Change and Water Scarcity: The Case of Saudi Arabia. Ann. Glob. Health 2015, 81, 342–353. [Google Scholar] [CrossRef] [PubMed]
- Rajab, R.; Prudhomme, C. Climate Change on Water Resources Management in Arid and Semi-arid Regions: Prospective and Challenges for the 21st Century. Biosyst. Eng. 2002, 81, 3–34. [Google Scholar]
- Parry, M.L.; Swaminathan, M.S. Effect of climatic change on food production. In Confronting Climatic Change: Risks, Implications, and Responses; Mintzer, I.M., Ed.; Cambridge University Press: Cambridge, UK, 1993; Chapter 8. [Google Scholar]
- Trenberth, K.E. Changes in precipitation with climate change. Clim. Res. 2011, 47, 123–138. [Google Scholar] [CrossRef]
- Kang, Y.; Khan, S.; Maa, X. Climate change impacts on crop yield, crop water productivity and food security—A review. Progress Nat. Sci. 2009, 19, 1665–1674. [Google Scholar] [CrossRef]
- PME (Presidency of Meteorology and Environment), Saudi Arabia. 2017. Available online: https://www.pme.gov.sa/En/Weather/LocalWeatherInfo/Pages/stationinfo.aspx (accessed on 29 January 2018).
- Mann, H.B. Non-parametric test against trend. Econometrica 1945, 13, 245–259. [Google Scholar] [CrossRef]
- Fowler, H.J.; Blenkinsop, S.; Tebaldi, C. Review linking climate change modeling to impacts studies recent advances in downscaling techniques for hydrological modeling. Int. J. Climatol. 2007, 27, 1547–1578. [Google Scholar] [CrossRef]
- NCAR Community Climate System Model. Downscaling procedure. Statistical Downscaling of the Community Climate System Model—Monthly Temperature and Precipitation Projections. Hoar, T., Nychka, D., Eds.; 2008. Available online: http://gisclimatechange.ucar.edu/ (accessed on 27 November 2012).
- Hibbard, K.A.; Meehl, G.A.; Cox, P.M.; Friedlingstein, P. A strategy for climate change stabilization experiments. Eos 2007, 88, 217–221. [Google Scholar] [CrossRef]
- Meehl, G.A.; Hibbard, K.A. A Strategy for Climate Change Stabilization Experiments with AOGCMS and ESMS; WCRP (World Climate Research Programme) Informal Report; WCRP: Aspen, CO, USA, 2006. [Google Scholar]
- Claussen, M.; Mysak, L.A.; Weaver, A.J.; Crucifix, M.; Fichefet, T.; Loutre, M.F.; Weber, S.L.; Alcamo, J.; Alexeev, V.A.; Berger, A.; et al. Earth system models of intermediate complexity: Closing the gap in the spectrum of climate system models. Clim. Dyn. 2002, 18, 579–586. [Google Scholar]
- MEWA (Ministry of Environment, Water and Agriculture). Annual Report. Riyadh, Saudi Arabia, 2017. Available online: https://www.mewa.gov.sa/en/Pages/default.aspx (accessed on 27 December 2017).
- Lopez, O.; Stenchikov, G.; Missimer, T.M. Water management during climate change using aquifer storage and recovery of stormwater in a dunefield in western Saudi Arabia. Environ. Res. Lett. 2014, 9, 075008. [Google Scholar] [CrossRef]
- Missimer, T.M.; Drewes, J.E.; Amy, G.; Maliva, R.G.; Keller, S. Restoration of wadi aquifers by artificial recharge with treated wastewater. Groundwater 2012, 50, 514–527. [Google Scholar] [CrossRef] [PubMed]
- Abderrahman, W.A.; Al-Harazin, I.M. Assessment of climate changes on water resources in the Kingdom of Saudi Arabia. In Proceedings of the GCC Environment and Sustainable Development Symposium, Dhahran, Saudi Arabia, 28–30 January 2008; pp. D-1-1–D-1-13. [Google Scholar]
- Chowdhury, S.; Al-Zahrani, M. Reuse of Treated Wastewater in Saudi Arabia: An Assessment Framework. J. Water Reuse Desalin. 2013, 3, 297–314. [Google Scholar] [CrossRef]
- Alkolibi, F.M. Possible effects of global warming on agriculture and Water resources in Saudi Arabia: Impacts and responses. Clim. Chang. 2002, 54, 225–245. [Google Scholar] [CrossRef]
- AL-Sheikh, A.A.; Tarawneh, Q.Y. An analysis of Dry Spell Patterns Intensity and Duration in Saudi Arabia. Middle East J. Sci. Res. 2013, 13, 314–327. [Google Scholar]
- Subyani, A.M. Hydrochemical identification and salinity problem of ground water in Wadi Yalamlam basin, Western Saudi Arabia. J. Arid Environ. 2005, 60, 53–66. [Google Scholar] [CrossRef]
- Balling, R.C., Jr.; Gober, P. Climate Variability and Residential Water Use in the City of Phoenix, Arizona. J. Appl. Meteorol. Climatol. 2007, 46, 1130–1137. [Google Scholar] [CrossRef]
- Arab News. Flash Flood Fury Leaves 7 Dead in South. Published in Arab News on Monday, 5 August 2013. Available online: http://www.arabnews.com/news/460295 (accessed on 30 September 2013).
- BBC News. 2009. Available online: http://news.bbc.co.uk/2/hi/8384832.stm (accessed on 30 November 2010).
- Al-Zahrani, M.; Chowdhury, S.; Abo-Monasar, A. Augmentation of surface water sources from spatially distributed rainfall in Saudi Arabia. J. Water Reuse Desalin. 2015, 5, 391–406. [Google Scholar] [CrossRef]
- Afzal, M.; Gagnon, A.S.; Mansell, M.G. Changes in the variability and periodicity of precipitation in Scotland. Theor. Appl. Climatol. 2015, 119, 135–159. [Google Scholar] [CrossRef]
- Afzal, M.; Gagnon, A.S.; Mansell, M.G. The impact of projected changes in climate variability on the reliability of surface water supply in Scotland. Water Sci. Technol. Water Supply 2015, 15, 736–745. [Google Scholar] [CrossRef]


| Central Region (Riyadh) | ||||||||
| Element | Mean | Max. | Min. | Median | Skewness | Kurtosis | Std. Dev | CV |
| Winter | 15 | 16.6 | 12.6 | 15.1 | −1.02 | 0.97 | 0.97 | 0.07 |
| Spring | 26.2 | 27.7 | 24.1 | 26.2 | −0.39 | −0.58 | 0.92 | 0.04 |
| Summer | 35.5 | 36.8 | 33.8 | 35.6 | −0.16 | −0.24 | 0.71 | 0.02 |
| Autumn | 26.6 | 27.8 | 25.7 | 26.6 | 0.58 | −0.02 | 0.58 | 0.02 |
| January | 13.5 | 15.9 | 10.2 | 13.7 | −0.35 | −0.09 | 1.45 | 0.11 |
| June | 34.7 | 36.2 | 33.1 | 34.7 | −0.21 | −0.56 | 0.84 | 0.02 |
| North Region (Tabouk) | ||||||||
| Winter | 12.2 | 15.2 | 8.9 | 12.3 | −0.38 | 2.56 | 1.14 | 0.09 |
| Spring | 22.2 | 24.2 | 20.2 | 22.1 | 0.15 | 0.78 | 0.86 | 0.04 |
| Summer | 31 | 33 | 29.5 | 31.1 | 0.14 | 0.15 | 0.81 | 0.03 |
| Autumn | 23.5 | 25.8 | 22.3 | 23.3 | 0.09 | 1.65 | 0.76 | 0.03 |
| January | 10.9 | 14.9 | 7.4 | 10.9 | −0.03 | 0.61 | 1.6 | 0.15 |
| June | 30.04 | 31.7 | 28.9 | 29.9 | 0.54 | 0.08 | 0.69 | 0.02 |
| Southwest Region (Abha) | ||||||||
| Winter | 19.4 | 22.1 | 15.5 | 19.8 | −0.61 | 0.07 | 1.58 | 0.08 |
| Spring | 18.3 | 21.5 | 12.8 | 24.2 | −0.55 | 1.7 | 1.7 | 0.09 |
| Summer | 24.3 | 27.3 | 18.8 | 24.6 | −0.64 | 0.55 | 1.8 | 0.07 |
| Autumn | 19.4 | 21.4 | 16.8 | 19.7 | −0.39 | −0.71 | 1.2 | 0.06 |
| January | 12.5 | 15.1 | 10 | 12.5 | −0.07 | −0.57 | 1.23 | 0.10 |
| June | 23.6 | 27.3 | 16 | 24.4 | −1.5 | 2.27 | 2.8 | 0.12 |
| Element | Mean | Max. | Min. | Median | Skew | Kur | St. Dev | CV |
|---|---|---|---|---|---|---|---|---|
| Central region (Riyadh) | 106.9 | 309.4 | 32 | 86 | 1.6 | 2.02 | 68.5 | 0.64 |
| North region (Tabouk) | 31.7 | 89.2 | 1.1 | 28 | 0.84 | 0.01 | 24 | 0.76 |
| Southwest region (Abha) | 206 | 568.2 | 87.4 | 179 | 1.5 | 2.3 | 115.9 | 0.56 |
| Riyadh | ||||||
| Element | Mann–Kendall Statistic (S) | Kendall’s Tau | Var. (σ2) | p-Value | Alpha | Test Interpretation |
| Annual Mean Temp. | 142 | 0.37 | 0 | 0.005 | 0.05 | Reject H0/Trend. |
| January Min. Temp. | 118 | 0.69 | 2838 | 0.028 | 0.05 | Reject H0/Trend. |
| January Max. Temp. | 62 | 0.15 | 2838 | 0.252 | 0.05 | Accept H0/No Trend. |
| January Min. Temp. | 278 | 0.69 | 2833 | <0.0001 | 0.05 | Reject H0/Trend. |
| January Max. Temp. | 149 | 0.37 | 2827 | 0.005 | 0.05 | Reject H0/Trend. |
| Rainfall | −35 | −0.08 | 0 | 0.567 | 0.05 | Accept H0/No Trend. |
| Tabouk | ||||||
| Annual Mean Temp. | 174 | 0.44 | 0 | 0.001 | 0.05 | Reject H0/Trend. |
| January Min. Temp. | 21 | 0.05 | 3133 | 0.721 | 0.05 | Accept H0; No Trend. |
| January Max. Temp. | 11 | 0.03 | 3131 | 0.858 | 0.05 | Accept H0; No Trend. |
| June Min. Temp. | 247 | 0.57 | 3130 | <0.0001 | 0.05 | Reject H0/Trend. |
| June Max. Temp. | 77 | 0.18 | 3114 | 0.173 | 0.05 | Accept H0; No Trend. |
| Rainfall | −33 | −0.08 | 0 | 0.572 | 0.05 | Accept H0; No Trend. |
| Abha | ||||||
| Annual Mean Temp. | 393 | 0 | 0 | <0.0001 | 0.05 | Reject H0/Trend. |
| January Min. Temp. | 260 | 0.44 | 4951.3 | 0 | 0.05 | Reject H0/Trend. |
| January Max. Temp. | 20 | 0.03 | 4948.6 | 0.787 | 0.05 | Accept H0; No Trend. |
| Junuary Min. Temp. | 265 | 0.44 | 4949.6 | 0 | 0.05 | Reject H0/Trend. |
| Junuary Max. Temp. | 186 | 0.31 | 4951.3 | 0.009 | 0.05 | Reject H0/Trend. |
| Rainfall | −157 | −0.36 | 0 | 0.005 | 0.05 | Reject H0/Trend. |
| 2025–2044 | 2045–2064 | 2065–2084 | |||||||||||
|---|---|---|---|---|---|---|---|---|---|---|---|---|---|
| Region | Stations | Lat. | Lon. | Elevation (m) | RCP8.5 | RCP6.0 | RCP2.6 | RCP8.5 | RCP6.0 | RCP2.6 | RCP8.5 | RCP6.0 | RCP2.6 |
| Central | Riyadh | 24.7 | 46.67 | 564 | 7.6 | −10.2 | 5.1 | 5.1 | −5.1 | −7.6 | 0 | 0 | 5.1 |
| Unaizah | 26.08 | 43.96 | 746 | 12.7 | −10.2 | 5.1 | 20.3 | 0 | −2.5 | 7.6 | 10.2 | 5.1 | |
| North | Hail | 27.5 | 41.72 | 1010 | 12.7 | −2.5 | 10.2 | 15.2 | 5.1 | −5.1 | −2.5 | 15.2 | 7.6 |
| Al-Jouf | 29.87 | 40.1 | 560 | 7.6 | 0 | 7.6 | 12.7 | 0 | −5.1 | −2.5 | 5.1 | 2.5 | |
| Tabouk | 28.38 | 36.56 | 737 | 5.1 | −2.5 | 10.2 | 12.7 | 5.1 | −5.1 | −2.5 | 10.2 | 10.2 | |
| Southwest | Abha | 18.24 | 42.51 | 2600 | −10.2 | −33 | 20.3 | 12.7 | 10.2 | 5.1 | 43.2 | −5.1 | −7.6 |
| Al-Baha | 19.99 | 41.47 | 2200 | 5.1 | −22.9 | 20.3 | 48.3 | −20.3 | −27.9 | 48.3 | 10.2 | 2.5 | |
| Jazan | 16.86 | 42.57 | 350 | 25.4 | 12.7 | 38.1 | 111.8 | 25.4 | −22.9 | 152.4 | 63.5 | 27.9 | |
| Eastern | Dammam | 26.37 | 49.97 | 50 | 17.8 | 0 | 12.7 | 2.5 | −2.5 | −5.1 | 5.1 | 20.3 | 10.2 |
| Al-Hofuf | 25.33 | 49.61 | 160 | 12.7 | −7.6 | 12.7 | 30.5 | −35.6 | −38.1 | 0 | 0 | 5.1 | |
| Western | Jeddah | 21.18 | 39.21 | 17 | 7.6 | −10.2 | 10.2 | 40.6 | −7.6 | −17.8 | 30.5 | 17.8 | 5.1 |
| Taif | 21.41 | 40.52 | 1530 | 0 | −15.2 | 2.5 | 27.9 | −17.8 | −27.8 | 25.4 | 7.6 | −2.5 | |
| Makkah | 21.37 | 39.86 | 331 | 7.6 | −10.2 | 10.2 | 40.6 | −7.6 | −17.8 | 30.5 | 17.8 | 5.1 | |
| Al-Madinah | 24.51 | 39.56 | 849 | 10.2 | −7.6 | 12.7 | 22.9 | −5.1 | −2.5 | 12.7 | 12.7 | 17.8 | |
© 2018 by the authors. Licensee MDPI, Basel, Switzerland. This article is an open access article distributed under the terms and conditions of the Creative Commons Attribution (CC BY) license (http://creativecommons.org/licenses/by/4.0/).
Share and Cite
Tarawneh, Q.Y.; Chowdhury, S. Trends of Climate Change in Saudi Arabia: Implications on Water Resources. Climate 2018, 6, 8. https://doi.org/10.3390/cli6010008
Tarawneh QY, Chowdhury S. Trends of Climate Change in Saudi Arabia: Implications on Water Resources. Climate. 2018; 6(1):8. https://doi.org/10.3390/cli6010008
Chicago/Turabian StyleTarawneh, Qassem Y., and Shakhawat Chowdhury. 2018. "Trends of Climate Change in Saudi Arabia: Implications on Water Resources" Climate 6, no. 1: 8. https://doi.org/10.3390/cli6010008
APA StyleTarawneh, Q. Y., & Chowdhury, S. (2018). Trends of Climate Change in Saudi Arabia: Implications on Water Resources. Climate, 6(1), 8. https://doi.org/10.3390/cli6010008