Determination of the Variability of Biophenols and Mineral Nutrients in Olive Leaves with Respect to Cultivar, Collection Period and Geographical Location for Their Targeted and Well-Timed Exploitation

 ,
,  ,
,  , , , ,
Abstract
1. Introduction
2. Results
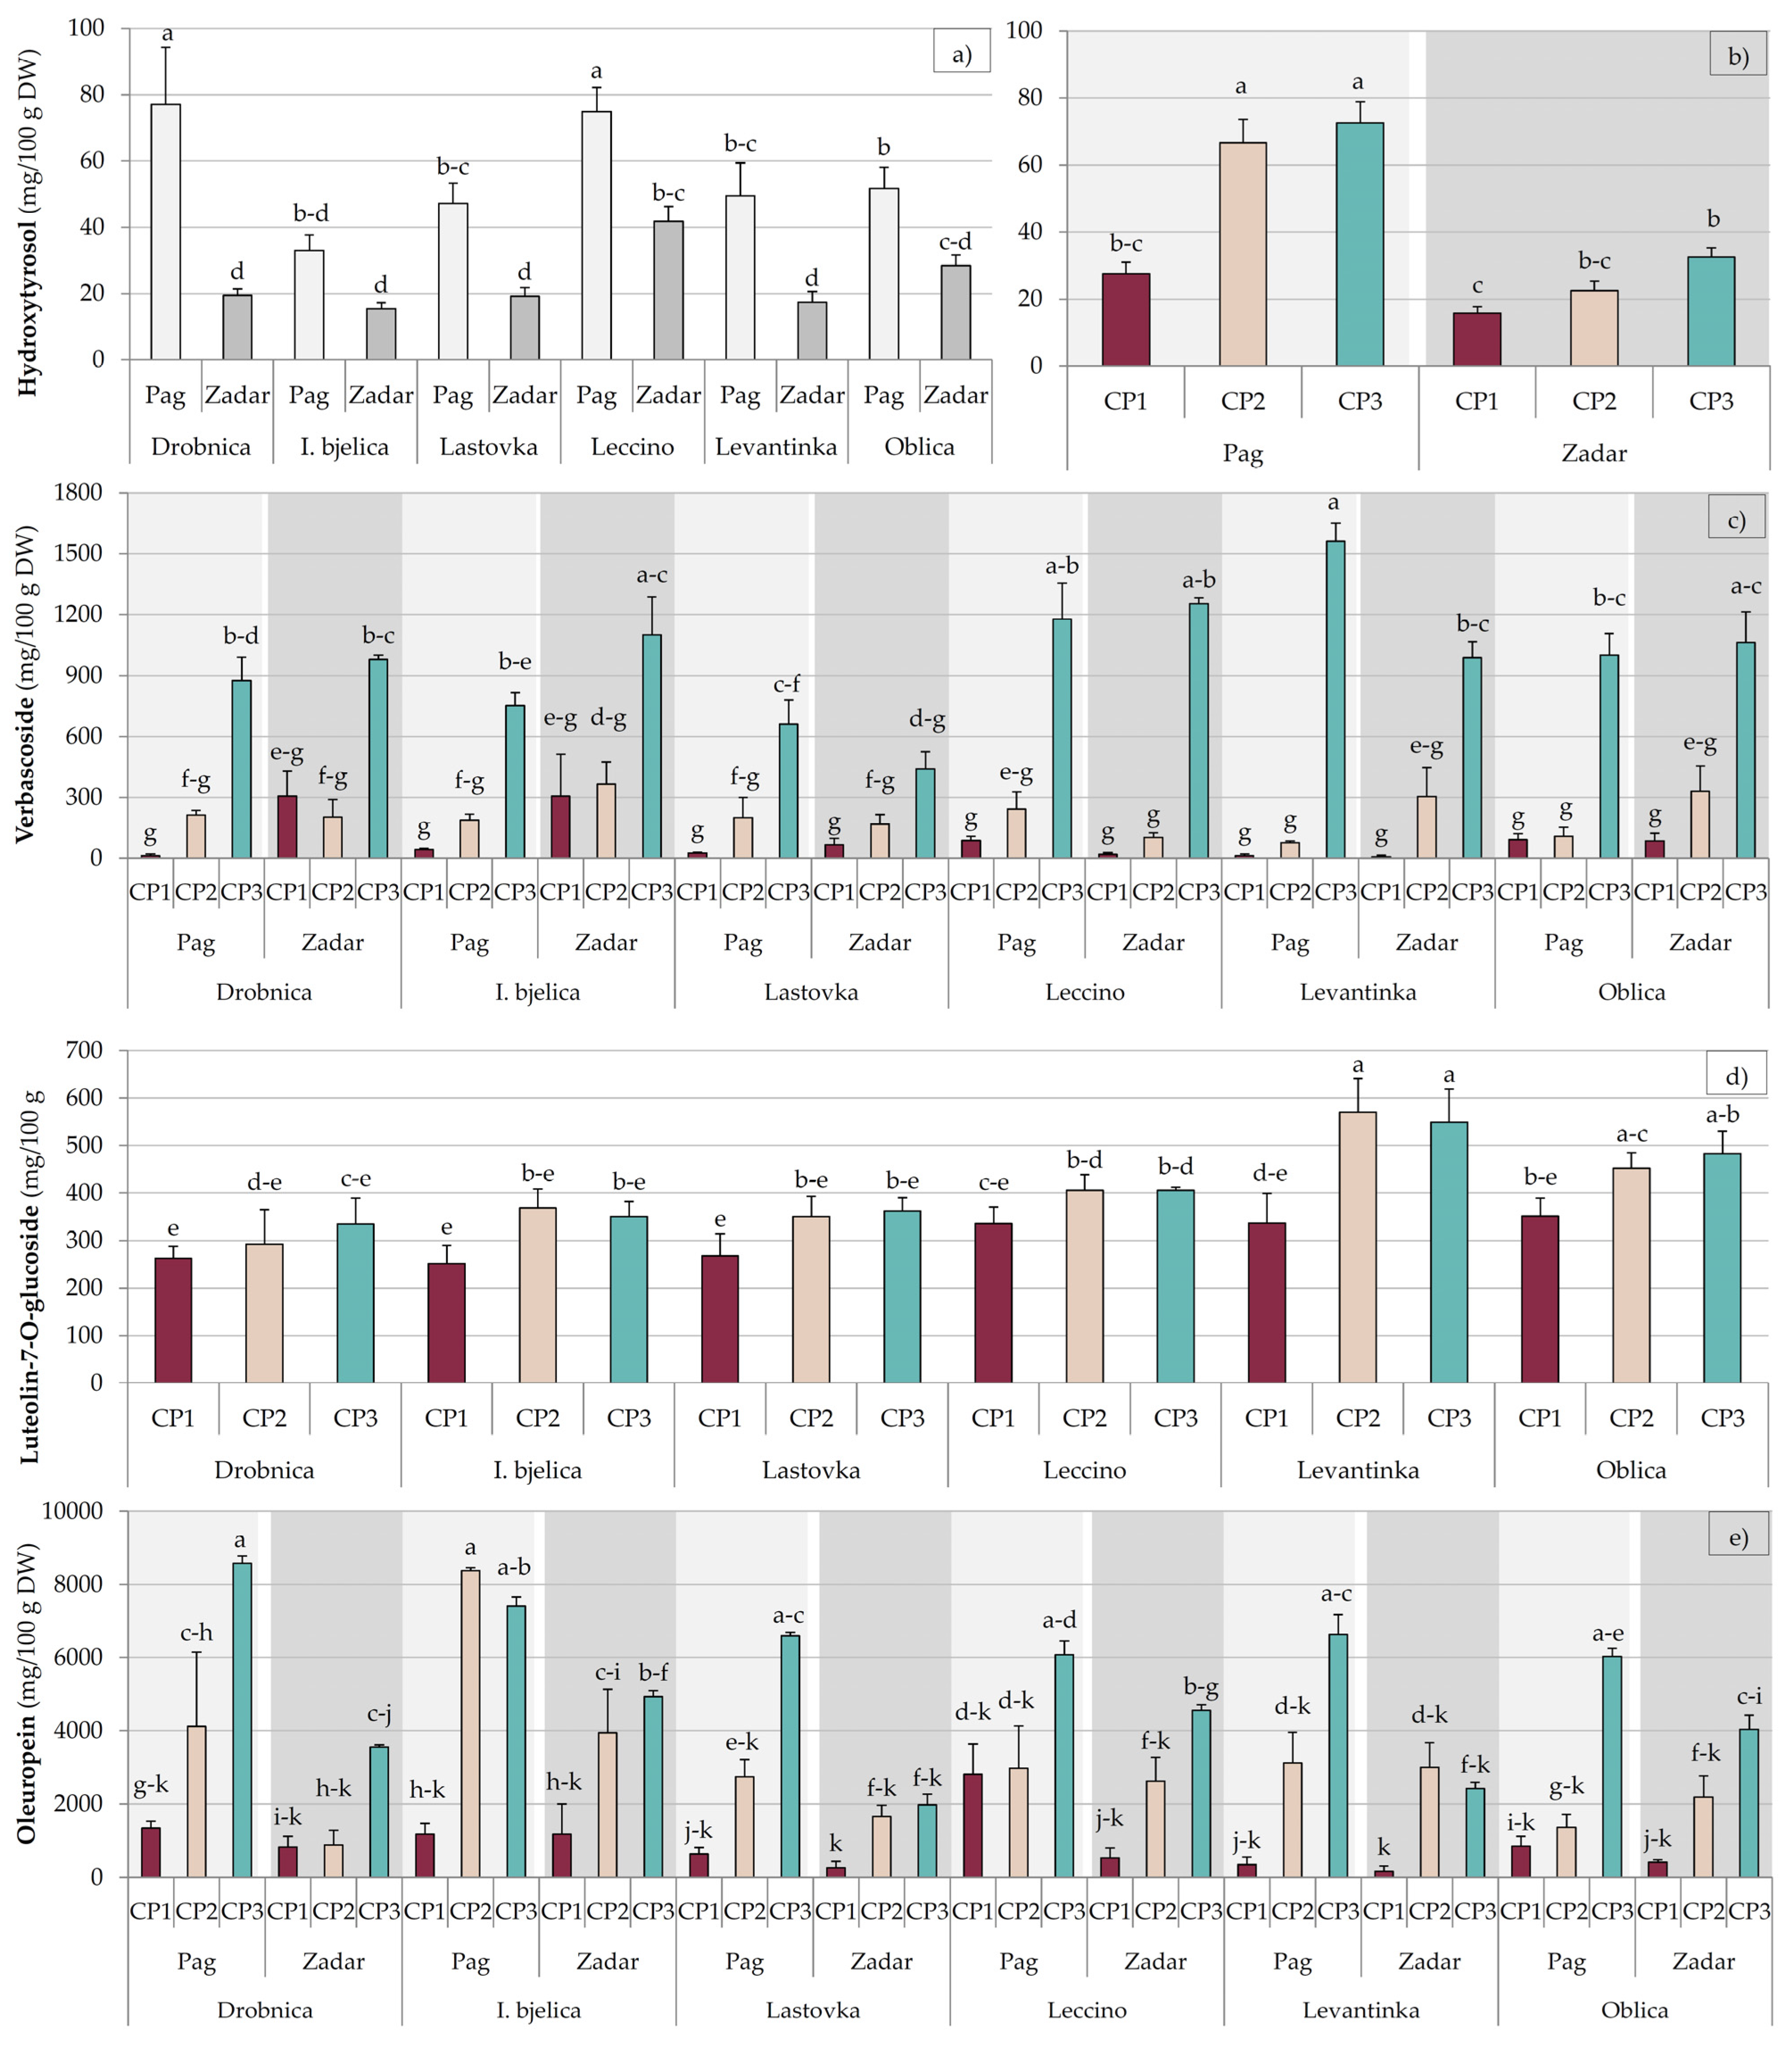
2.1. Biophenols
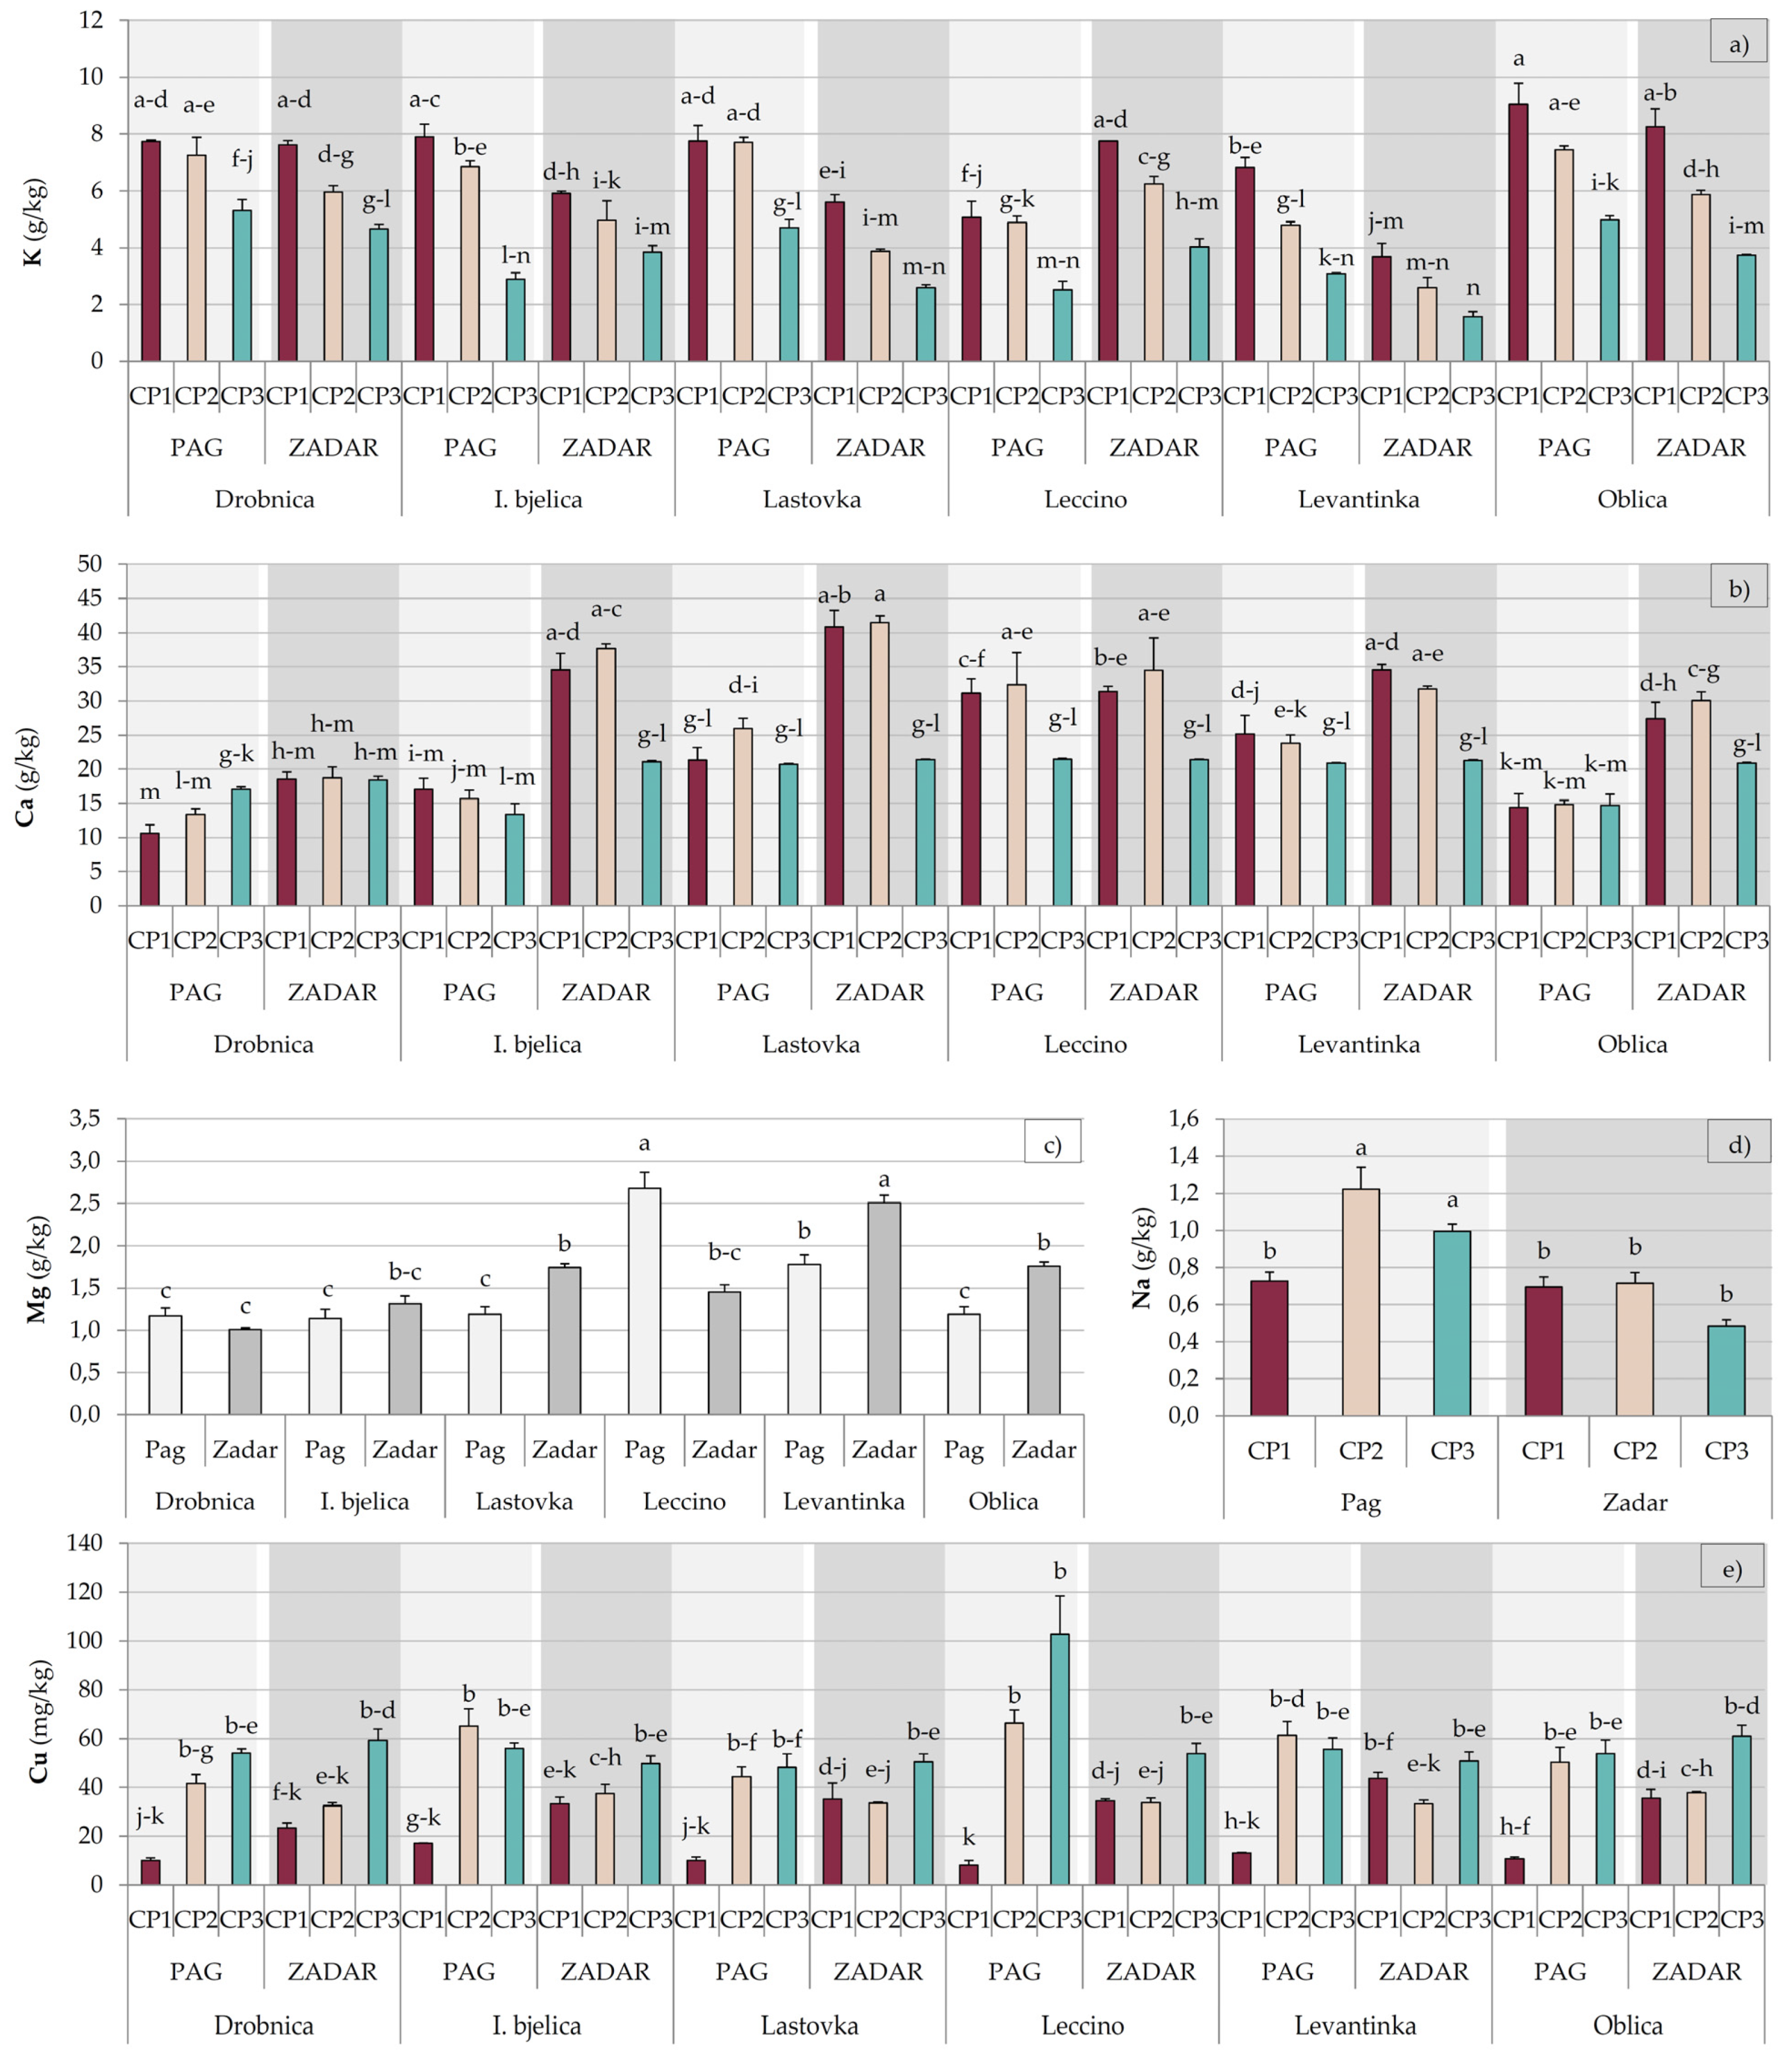
2.2. Mineral Nutrients
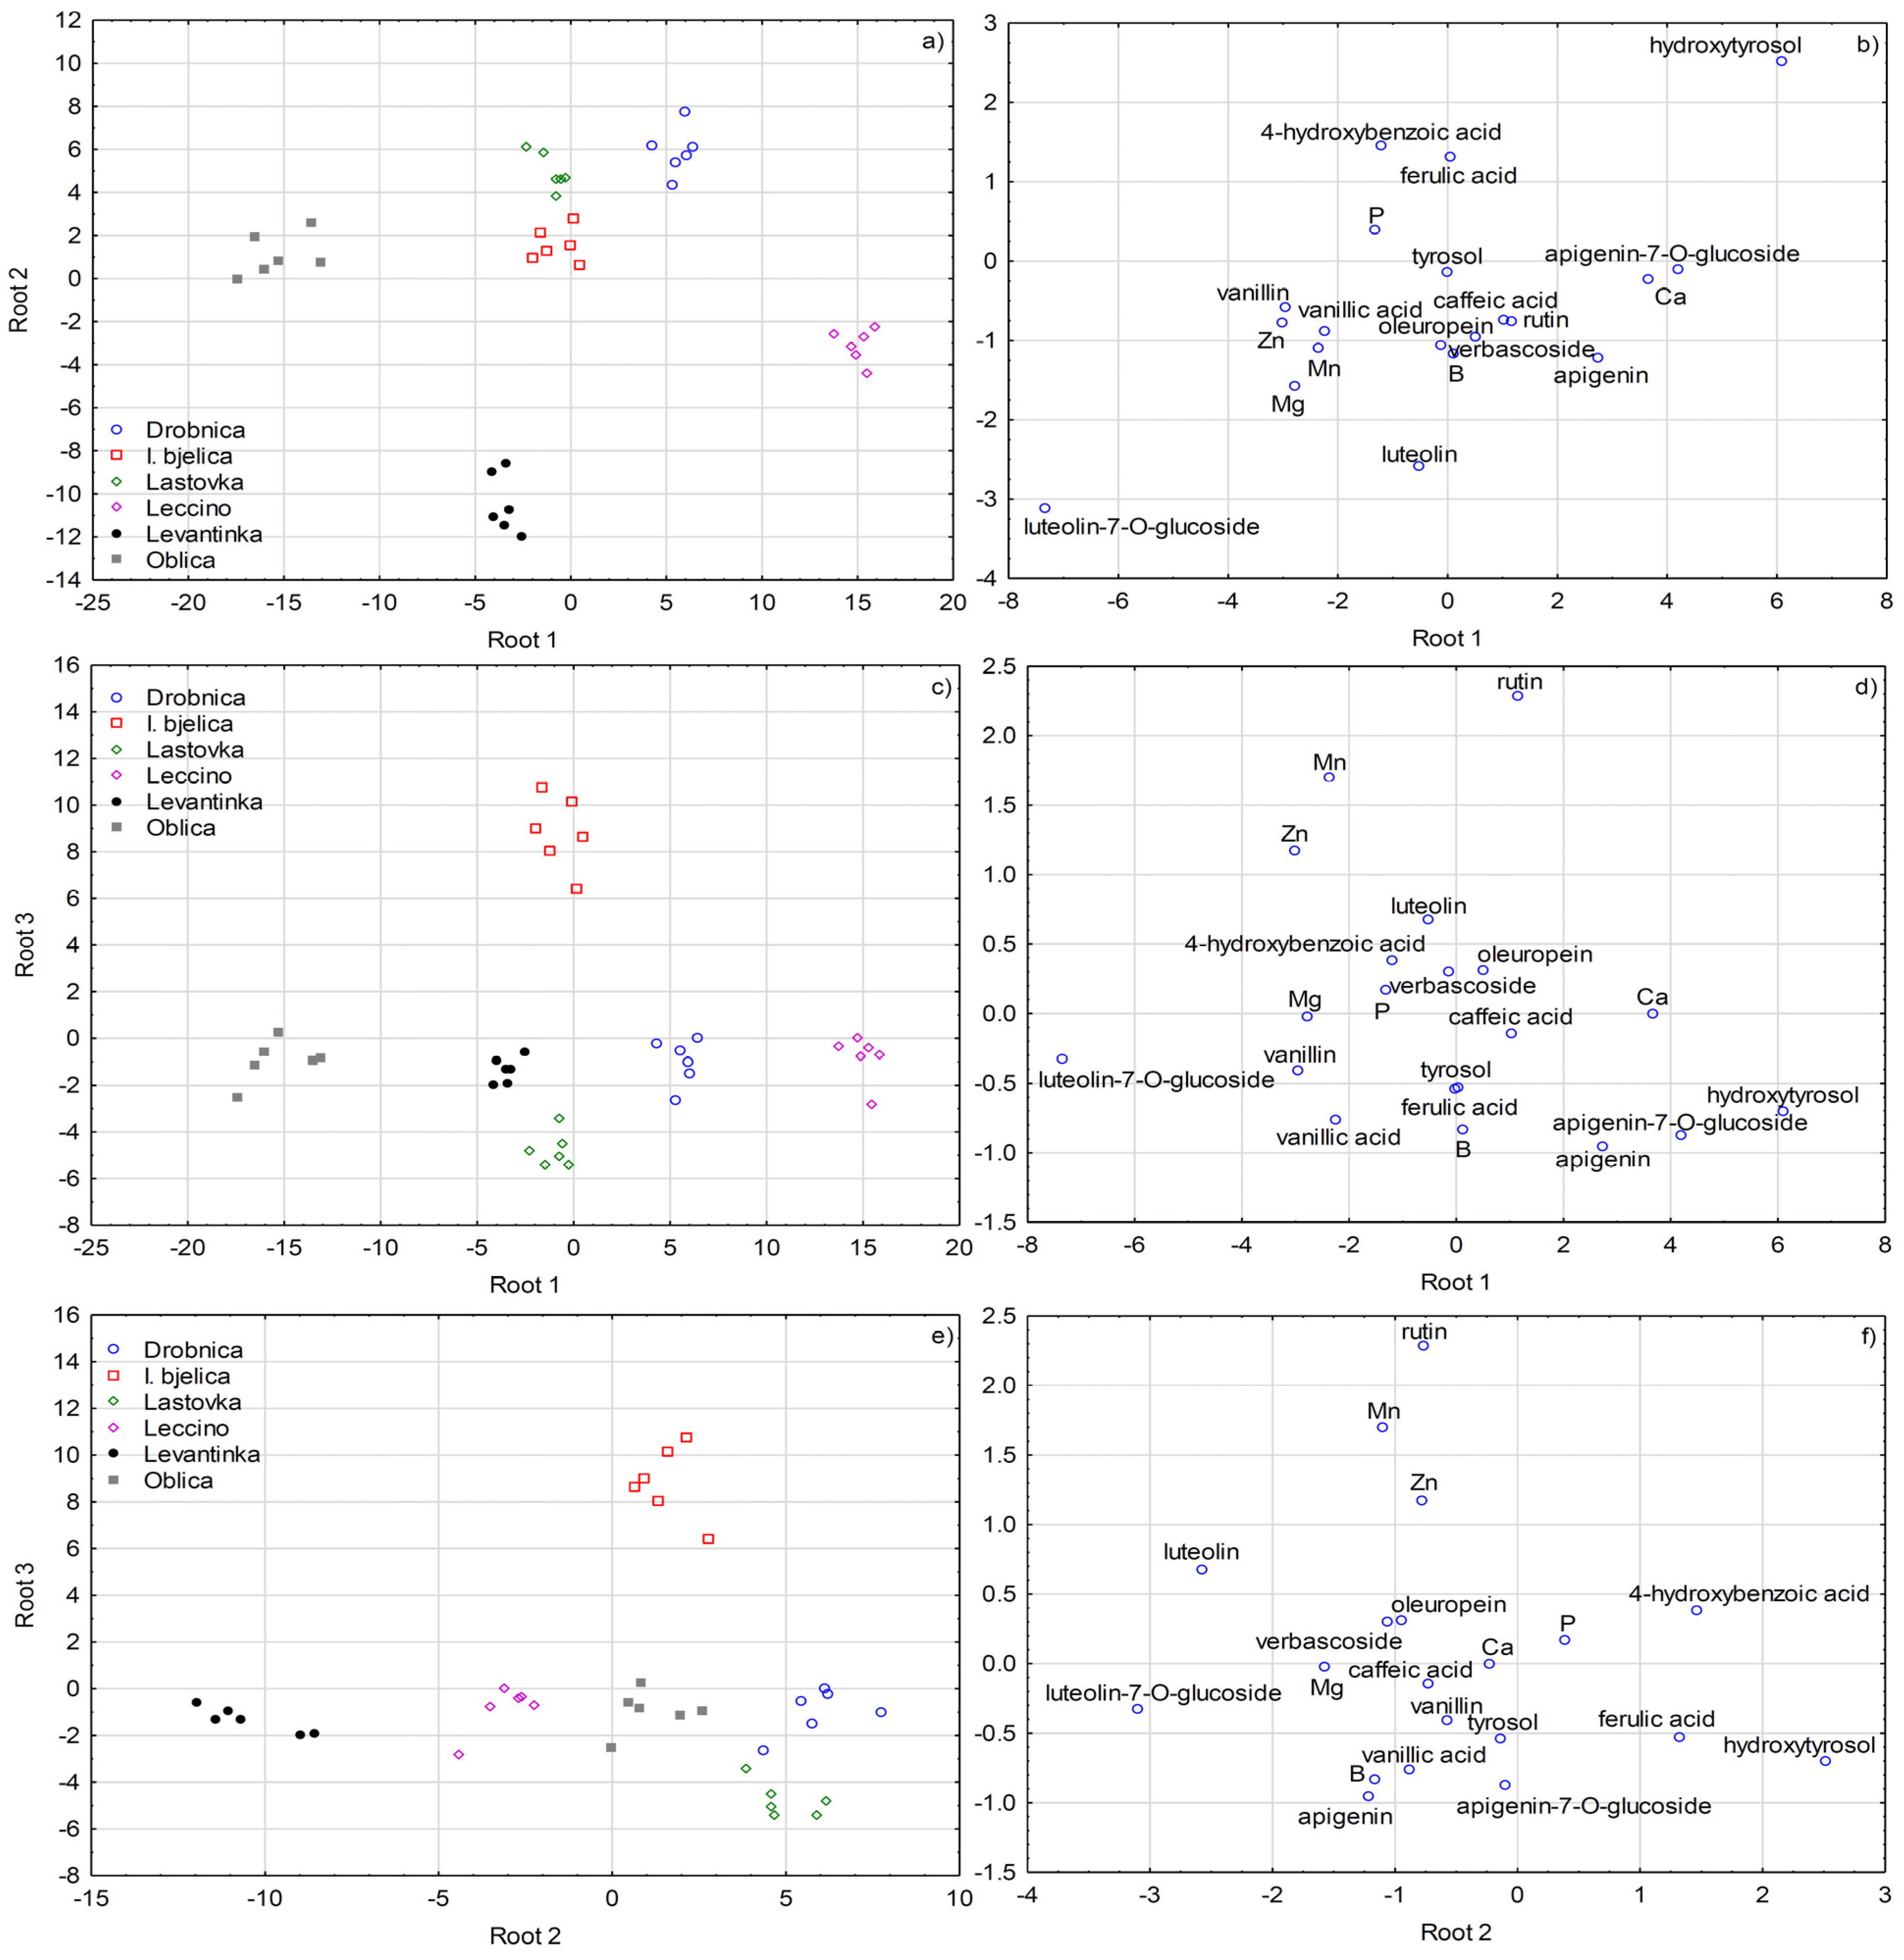
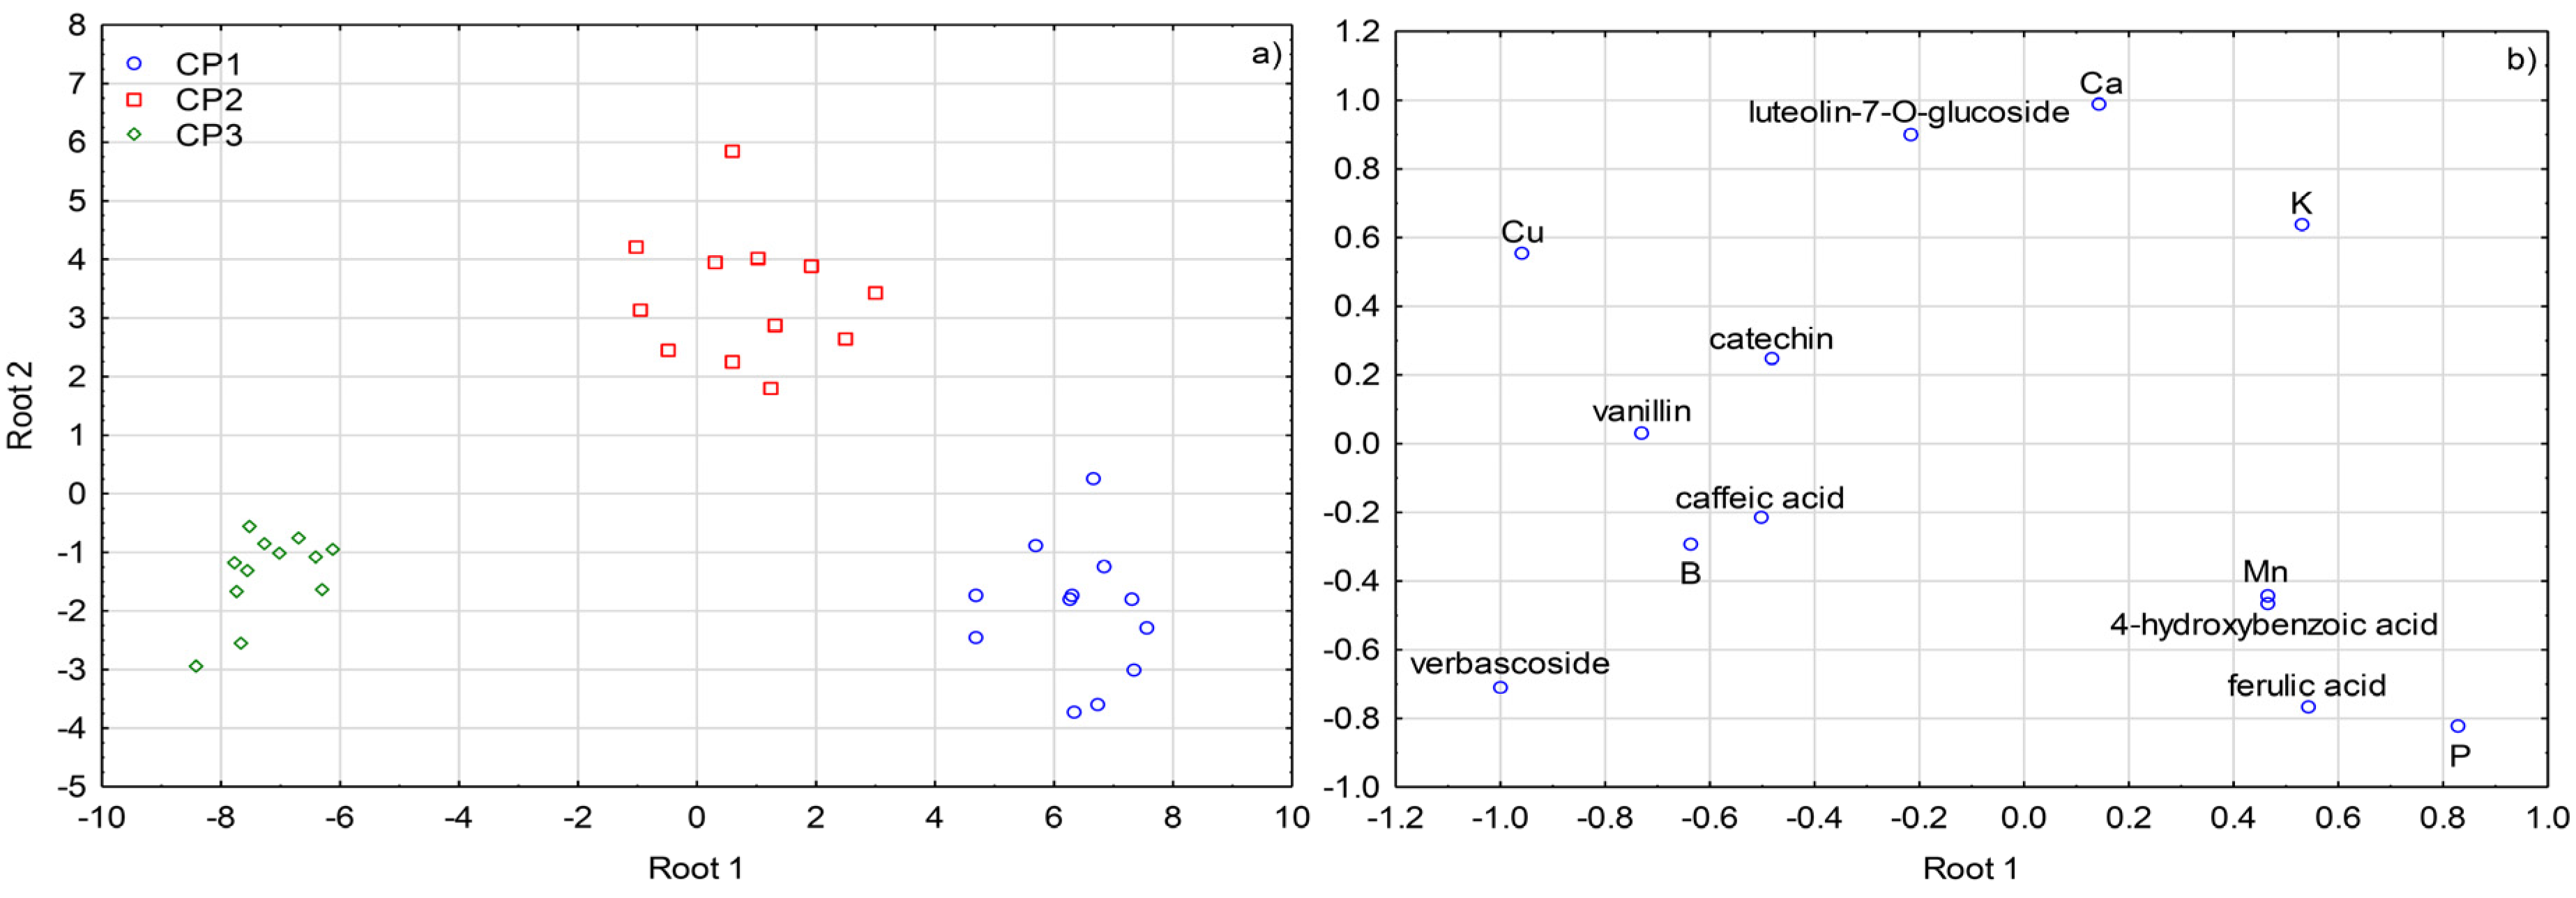
2.3. Multivariate Differentiation
3. Discussion
4. Materials and Methods
4.1. Olive Leaf Sampling
4.2. Chemicals
4.3. Analysis of Biophenols
4.4. Analysis of Mineral Nutrients
4.5. Statistical Analysis
5. Conclusions
Supplementary Materials
Author Contributions
Funding
Acknowledgments
Conflicts of Interest
References
- Berbel, J.; Posadillo, A. Review and analysis of alternatives for the valorisation of agro-industrial olive oil by-products. Sustainability 2018, 10, 237. [Google Scholar] [CrossRef]
- Olmo-Garcia, L.; Bajoub, A.; Benlamaalam, S.; Hurtado-Fernandez, E.; Bagur-Gonzalez, M.G.; Chigr, M.; Mbarki, M.; Fernandez-Gutierrez, A.; Carrasco-Pancorbo, A. Establishing the phenolic composition of Olea europaea L. leaves from cultivars grown in Morocco as a crucial step towards their subsequent exploitation. Molecules 2018, 23, 2524. [Google Scholar] [CrossRef] [PubMed]
- Bulotta, S.; Corradino, R.; Celano, M.; D’Agostino, M.; Maiuolo, J.; Oliverio, M.; Procopio, A.; Iannone, M.; Rotiroti, D.; Russo, D. Antiproliferative and antioxidant effects on breast cancer cells of oleuropein and its semisynthetic peracetylated derivatives. Food Chem. 2011, 127, 1609–1614. [Google Scholar] [CrossRef]
- Jemai, H.; El Feki, A.; Sayadi, S. Antidiabetic and antioxidant effects of hydroxytyrosol and oleuropein from olive leaves in alloxan-diabetic rats. J. Agric. Food Chem. 2009, 57, 8798–8804. [Google Scholar] [CrossRef] [PubMed]
- Jemai, H.; Fki, I.; Bouaziz, M.; Bouallagui, Z.; El Feki, A.; Isoda, H.; Sayadi, S. Lipid-lowering and antioxidant effects of hydroxytyrosol and its triacetylated derivative recovered from olive tree leaves in cholesterol-fed rats. J. Agric. Food Chem. 2008, 56, 2630–2636. [Google Scholar] [CrossRef] [PubMed]
- Lee, O.H.; Lee, B.Y. Antioxidant and antimicrobial activities of individual and combined phenolics in Olea europaea leaf extract. Bioresour. Technol. 2010, 101, 3751–3754. [Google Scholar] [CrossRef]
- Sudjana, A.N.; D’Orazio, C.; Ryan, V.; Rasool, N.; Ng, J.; Islam, N.; Riley, T.V.; Hammer, K.A. Antimicrobial activity of commercial Olea europaea (olive) leaf extract. Int. J. Antimicrob. Agents 2009, 33, 461–463. [Google Scholar] [CrossRef]
- Korukluoglu, M.; Sahan, Y.; Yigit, A. Antifungal properties of olive leaf extracts and their phenolic compounds. J. Food Saf. 2008, 28, 76–87. [Google Scholar] [CrossRef]
- Somova, L.I.; Shode, F.O.; Mipando, M. Cardiotonic and antidysrhythmic effects of oleanolic and ursolic acids, methyl maslinate and uvaol. Phytomedicine 2004, 11, 121–129. [Google Scholar] [CrossRef]
- Susalit, E.; Agus, N.; Effendi, I.; Tjandrawinata, R.R.; Nofiarny, D.; Perrinjaquet-Moccetti, T.; Verbruggen, M. Olive (Olea europaea) leaf extract effective in patients with stage-1 hypertension: Comparison with Captopril. Phytomedicine 2011, 18, 251–258. [Google Scholar] [CrossRef]
- Lee-Huang, S.; Zhang, L.; Huang, P.L.; Chang, Y.T. Anti-HIV activity of olive leaf extract (OLE) and modulation of host cell gene expression by HIV-1 infection and OLE treatment. Biochem. Biophys. Res. Commun. 2003, 307, 1029–1037. [Google Scholar] [CrossRef]
- Han, J.; Talorete, T.P.N.; Yamada, P.; Isoda, H. Anti-proliferative and apoptotic effects of oleuropein and hydroxytyrosol on human breast cancer MCF-7 cells. Cytotechnology 2009, 59, 45–53. [Google Scholar] [CrossRef] [PubMed]
- Abaza, L.; Talorete, T.P.N.; Yamada, P.; Kurita, Y.; Zarrouk, M.; Isoda, H. Induction of growth inhibition and differentiation of human leukemia HL-60 cells by a Tunisian gerboui olive leaf extract. Biosci. Biotechnol. Biochem. 2007, 71, 1306–1312. [Google Scholar] [CrossRef]
- Nishibe, S.; Han, Y.; Noguchi, Y.; Ueda, H.; Yamazaki, M.; Mizutani, K.; Kambara, T.; Kishida, N. The inhibitory effects of the compounds from olive leaf on tumor necrosis factor production and on β-hexosaminidase release. J. Nat. Med. 2001, 55, 205–208. [Google Scholar]
- Aouidi, F.; Okba, A.; Hamdi, M. Valorization of functional properties of extract and powder of olive leaves in raw and cooked minced beef meat. J. Sci. Food Agric. 2017, 97, 3195–3203. [Google Scholar] [CrossRef]
- de Medina, V.S.; Priego-Capote, F.; de Castro, M.D.L. Characterization of refined edible oils enriched with phenolic extracts from olive leaves and pomace. J. Agric. Food Chem. 2012, 60, 5866–5873. [Google Scholar] [CrossRef]
- Difonzo, G.; Squeo, G.; Calasso, M.; Pasqualone, A.; Caponio, F. Physico-chemical, microbiological and sensory evaluation of ready-to-use vegetable pâté added with olive leaf extract. Foods 2019, 8, 138. [Google Scholar] [CrossRef]
- Natrella, G.; Difonzo, G.; Calasso, M.; Costantino, G.; Caponio, F.; Faccia, M. Evolution of VOC and sensory characteristics of stracciatella cheese as affected by different preservatives. Foods 2020, 9, 1446. [Google Scholar] [CrossRef]
- Baiano, A.; Viggiani, I.; Terracone, C.; Romaniello, R.; Del Nobile, M.A. Physical and sensory properties of bread enriched with phenolic aqueous extracts from vegetable wastes. Czech J. Food Sci. 2015, 33, 247–253. [Google Scholar] [CrossRef]
- Sahin, S.; Bilgin, M. Olive tree (Olea europaea L.) leaf as a waste by-product of table olive and olive oil industry: A review. J. Sci. Food Agric. 2018, 98, 1271–1279. [Google Scholar] [CrossRef]
- Talhaoui, N.; Gomez-Caravaca, A.M.; Leon, L.; De la Rosa, R.; Segura-Carretero, A.; Fernandez-Gutierrez, A. Determination of phenolic compounds of ’Sikitita ’ olive leaves by HPLC-DAD-TOF-MS. Comparison with its parents ’Arbequina’ and ’Picual’ olive leaves. Lwt Food Sci. Technol. 2014, 58, 28–34. [Google Scholar] [CrossRef]
- Talhaoui, N.; Gomez-Caravaca, A.M.; Roldan, C.; Leon, L.; De la Rosa, R.; Fernandez-Gutierrez, A.; Segura-Carretero, A. Chemometric analysis for the evaluation of phenolic patterns in olive leaves from six cultivars at different growth stages. J. Agric. Food Chem. 2015, 63, 1722–1729. [Google Scholar] [CrossRef] [PubMed]
- Romero, C.; Medina, E.; Mateo, M.A.; Brenes, M. Quantification of bioactive compounds in Picual and Arbequina olive leaves and fruit. J. Sci. Food Agric. 2017, 97, 1725–1732. [Google Scholar] [CrossRef] [PubMed]
- Ortega-Garcia, F.; Peragon, J. Phenol metabolism in the leaves of the olive tree (Olea europaea L.) cv. Picual, Verdial, Arbequina, and Frantoio during ripening. J. Agric. Food Chem. 2010, 58, 12440–12448. [Google Scholar] [CrossRef]
- Ranalli, A.; Contento, S.; Lucera, L.; Di Febo, M.; Marchegiani, D.; Di Fonzo, V. Factors affecting the contents of iridoid oleuropein in olive leaves (Olea europaea L.). J. Agric. Food Chem. 2006, 54, 434–440. [Google Scholar] [CrossRef]
- Pasković, I.; Lukić, I.; Žurga, P.; Germek, V.M.; Brkljača, M.; Koprivnjak, O.; Major, N.; Grozić, K.; Franić, M.; Ban, D.; et al. Temporal variation of phenolic and mineral composition in olive leaves is cultivar dependent. Plants 2020, 9, 1099. [Google Scholar] [CrossRef]
- Taamalli, A.; Roman, D.A.; Caravaca, A.M.G.; Zarrouk, M.; Carretero, A.S. Geographical characterization of Tunisian olive tree leaves (cv. Chemlali) using HPLC-ESI-TOF and IT/MS fingerprinting with hierarchical cluster analysis. J. Anal. Methods Chem. 2018. [Google Scholar] [CrossRef]
- Toplu, C.; Uygur, V.; Yildiz, E. Leaf mineral composition of olive varieties and their relation to yield and adaptation ability. J. Plant Nutr. 2009, 32, 1560–1573. [Google Scholar] [CrossRef]
- Treutter, D. Managing phenol contents in crop plants by phytochemical farming and breeding-visions and constraints. Int. J. Mol. Sci. 2010, 11, 807–857. [Google Scholar] [CrossRef]
- Fernández-Escobar, R. Olive nutritional status and tolerance to biotic and abiotic stresses. Front. Plant Sci. 2019, 10. [Google Scholar] [CrossRef]
- Fu, S.P.; Arráez-Roman, D.; Segura-Carretero, A.; Menéndez, J.A.; Menéndez-Gutierrez, M.P.; Micol, V.; Fernandez-Gutierrez, A. Qualitative screening of phenolic compounds in olive leaf extracts by hyphenated liquid chromatography and preliminary evaluation of cytotoxic activity against human breast cancer cells. Anal. Bioanal. Chem. 2010, 397, 643–654. [Google Scholar] [CrossRef] [PubMed]
- Meirinhos, J.; Silva, B.M.; Valentao, P.; Seabra, R.M.; Pereira, J.A.; Dias, A.; Andrade, P.B.; Ferreres, F. Analysis and quantification of flavonoidic compounds from Portuguese olive (Olea europaea L.) leaf cultivars. Nat. Prod. Res. 2005, 19, 189–195. [Google Scholar] [CrossRef] [PubMed]
- Artajo, L.S.; Romero, M.P.; Suarez, M.; Motilva, M.J. Partition of phenolic compounds during the virgin olive oil industrial extraction process. Eur. Food Res. Technol. 2007, 225, 617–625. [Google Scholar] [CrossRef]
- Lukić, I.; Horvat, I.; Godena, S.; Krapac, M.; Lukić, M.; Vrhovsek, U.; Brkić Bubola, K. Towards understanding the varietal typicity of virgin olive oil by correlating sensory and compositional analysis data: A case study. Food Res. Int. 2018, 112, 78–89. [Google Scholar] [CrossRef]
- Lukić, I.; Lukić, M.; Žanetić, M.; Krapac, M.; Godena, S.; Brkić Bubola, K. Inter-varietal diversity of typical volatile and phenolic profiles of Croatian extra virgin olive oils as revealed by GC-IT-MS and UPLC-DAD analysis. Foods 2019, 8, 565. [Google Scholar] [CrossRef]
- Ortega-Garcia, F.; Blanco, S.; Peinado, M.A.; Peragon, J. Phenylalanine ammonia-lyase and phenolic compounds in leaves and fruits of Olea europaea L. cv. Picual during ripening. J. Sci. Food Agric. 2009, 89, 398–406. [Google Scholar] [CrossRef]
- Pasković, I.; Herak Ćustić, M.; Pecina, M.; Bronić, J.; Ban, D.; Radić, T.; Poščić, F.; Špika, M.J.; Soldo, B.; Palčić, I.; et al. Manganese soil and foliar fertilization of olive plantlets: The effect on leaf mineral and phenolic content and root mycorrhizal colonization. J. Sci. Food Agric. 2019, 99, 360–367. [Google Scholar] [CrossRef]
- Pasković, I.; Soldo, B.; Talhaoui, N.; Palčić, I.; Brkljača, M.; Koprivnjak, O.; Germek, V.M.; Ban, D.; Klanjac, J.; Franić, M.; et al. Boron foliar application enhances oleuropein level and modulates volatile compound composition in olive leaves. Sci. Hortic. 2019, 257. [Google Scholar] [CrossRef]
- Restrepo-Diaz, H.; Benlloch, M.; Navarro, C.; Fernández-Escobar, R. Potassium fertilization of rainfed olive orchards. Sci. Hortic. 2008, 116, 399–403. [Google Scholar] [CrossRef]
- Chatzistathis, T.; Therios, I.; Alifragis, D. Differential uptake, distribution within tissues, and use efficiency of manganese, iron, and zinc by olive cultivars kothreiki and koroneiki. Hortscience 2009, 44, 1994–1999. [Google Scholar] [CrossRef]
- Pasković, I.; Perica, S.; Pecina, M.; Hančević, K.; Polić Pasković, M.; Herak Ćustić, M. Leaf mineral concentration of five olive cultivars grown on calcareous soil. J. Cent. Eur. Agric. 2013, 14, 1471–1478. [Google Scholar] [CrossRef][Green Version]
- Therios, I.N.; Misopolinos, N.D. Genotypic response to sodium chloride salinity of four major olive cultivars (Olea europaea L.). Plant Soil 1988, 106, 105–111. [Google Scholar] [CrossRef]
- Marschner, H. Marschner’s Mineral Nutrition of Higher Plants, 3rd ed.; Academic Press: Waltham, MA, USA, 2012. [Google Scholar]
- Loupassaki, M.H.; Chartzoulakis, K.S.; Digalaki, N.B.; Androulakis, I. Effects of salt stress on concentration of nitrogen, phosphorus, potassium, calcium, magnesium, and sodium in leaves, shoots, and roots of six olive cultivars. J. Plant Nutr. 2002, 25, 2457–2482. [Google Scholar] [CrossRef]
- Dimassi, K.; Therios, I.; Passalis, A. Genotypic effect on leaf mineral levels of 17 olive cultivars grown in Greece. Acta Hortic. 1999, 474, 345–348. [Google Scholar] [CrossRef]
- Jordao, P.V.; Marcelo, M.E.; Centeno, M.S.L. Effect of cultivar on leaf-mineral composition of olive tree. Acta Hortic. 1999, 474, 349–352. [Google Scholar] [CrossRef]
- Ben Abdeljelil, Z.; Tekaya, M.; Elmsellem, H.; Mechri, B.; Hammami, M. Impact of season and foliar fertilisers on phenolics of leaves of Chemlali olive cultivar. Moroc. J. Chem. 2017, 5, 96–104. [Google Scholar]
- Hartmann, H.; Uriu, K.; Lilleland, O. Olive nutrition. In Fruit Nutrition; Childers, N., Ed.; Horticultural Publications: Rutgers University, New Brunswick, NJ, USA, 1966; pp. 252–261. [Google Scholar]
- Stateras, D.C.; Moustakas, N.K. Seasonal changes of macro- and micro-nutrients concentration in olive leaves. J. Plant Nutr. 2018, 41, 186–196. [Google Scholar] [CrossRef]
- Tadejević, V. Some experiences with the protection of field crops from sneet along Adriatic coast. Agron. Glas. 1987, 1, 39–54. [Google Scholar]
- Petridis, A.; Therios, I.; Samouris, G.; Tananaki, C. Salinity-induced changes in phenolic compounds in leaves and roots of four olive cultivars (Olea europaea L.) and their relationship to antioxidant activity. Environ. Exp. Bot. 2012, 79, 37–43. [Google Scholar] [CrossRef]
- Perica, S.; Goreta, S.; Vuletin Selak, G. Growth, biomass allocation and leaf ion concentration of seven olive (Olea europaea L.) cultivars under increased salinity. Sci. Hortic. 2008, 117, 123–129. [Google Scholar] [CrossRef]
- Tattini, M.; Bertoni, P.; Caselli, S. Genotypic responses of olive plants to sodium-chloride. J. Plant Nutr. 1992, 15, 1467–1485. [Google Scholar] [CrossRef]
- Wang, M.; Zheng, Q.S.; Shen, Q.R.; Guo, S.W. The critical role of potassium in plant stress response. Int. J. Mol. Sci. 2013, 14, 7370–7390. [Google Scholar] [CrossRef] [PubMed]
- Fernández-Escobar, R.; Moreno, R.; Garcia-Creus, M. Seasonal changes of mineral nutrients in olive leaves during the alternate-bearing cycle. Sci. Hortic. 1999, 82, 25–45. [Google Scholar] [CrossRef]
- Yevdokimov, I.; Larionova, A.; Blagodatskaya, E. Microbial immobilisation of phosphorus in soils exposed to drying-rewetting and freeze-thawing cycles. Biol. Fertil. Soils 2016, 52, 685–696. [Google Scholar] [CrossRef]
- Japon-Lujan, R.; Ruiz-Jimenez, J.; De Castro, M.D.L. Discrimination and classification of olive tree varieties and cultivation zones by biophenol contents. J. Agric. Food Chem. 2006, 54, 9706–9712. [Google Scholar] [CrossRef]
- Giannakopoulou, E.; Mitsopoulos, G.; Hagidimitriou, M.; Papageorgiou, V.; Komaitis, M. Influence of cultivar, harvesting season and geographical origin on phenolic content in leaves of Greek olive cultivars. Acta Hortic. 2011, 924, 437–444. [Google Scholar] [CrossRef]
- Bilgin, M.; Sahin, S. Effects of geographical origin and extraction methods on total phenolic yield of olive tree (Olea europaea) leaves. J. Taiwan Inst. Chem. Eng. 2013, 44, 8–12. [Google Scholar] [CrossRef]
- Brahmi, F.; Mechri, B.; Dhibi, M.; Hammami, M. Variation in antioxidant activity and phenolic content in different organs of two Tunisian cultivars of Olea europaea L. Acta Physiol. Plant. 2014, 36, 169–178. [Google Scholar] [CrossRef]
- Erel, R.; Kerem, Z.; Ben-Gatt, A.; Dag, A.; Schwartz, A.; Zipori, I.; Basheer, L.; Yermiyahu, U. Olive (Olea europaea L.) tree nitrogen status is a key factor for olive oil quality. J. Agric. Food Chem. 2013, 61, 11261–11272. [Google Scholar] [CrossRef]
- Tekaya, M.; El-Gharbi, S.; Mechri, B.; Chehab, H.; Bchir, A.; Chraief, I.; Ayachi, M.; Boujnah, D.; Attia, F.; Hammami, M. Improving performance of olive trees by the enhancement of key physiological parameters of olive leaves in response to foliar fertilization. Acta Physiol. Plant. 2016, 38. [Google Scholar] [CrossRef]
- Penel, C.; Van Cutsem, P.; Greppin, H. Interactions of a plant peroxidase with oligogalacturonides in the presence of calcium ions. Phytochemistry 1999, 51, 193–198. [Google Scholar] [CrossRef]
- Pasković, I.; Pecina, M.; Bronić, J.; Perica, S.; Ban, D.; Goreta Ban, S.; Poščić, F.; Palčić, I.; Herak Ćustić, M. Synthetic zeolite A as zinc and manganese fertilizer in calcareous soil. Commun. Soil Sci. Plant Anal. 2018, 49, 1072–1082. [Google Scholar] [CrossRef]
- Šegota, T.; Filipčić, A. Köppen’s classification of climates and the problem of corresponding Croatian terminology. Geoadria 2003, 8, 17–37. [Google Scholar] [CrossRef]
- Vuletin Selak, G.; Perica, S.; Goreta Ban, S.; Raduniž, M.; Poljak, M. Reproductive success after self-pollination and cross-pollination of olive cultivars in Croatia. Hortscience 2011, 46, 186–191. [Google Scholar] [CrossRef]
- Barranco Navero, D.; Cimato, A.; Fiorino, P.; Rallo, L.; Touzani, A.; Castañeda, C.; Serafin, F.; Trujillo, I. World Catalogue of Olive Varieties; International Olive Oil Council: Madrid, Spain, 2000; pp. 51–216. [Google Scholar]
- Marinova, D.; Ribarova, F.; Atanassova, M. Total phenolics and total flavonoids in Bulgarian fruits and vegetables. J. Univ. Chem. Technol. Metall. 2005, 40, 255–260. [Google Scholar]
- Miller, C.H. Diurnal temperature cycling influences flowering and node numbers of broccoli. Hortscience 1988, 23, 873–875. [Google Scholar]


| Factor | Simple Phenols (mg/100 g DW) | Phenolic Acids (mg/100 g DW) | |||||||
|---|---|---|---|---|---|---|---|---|---|
| Hydroxytyrosol | Tyrosol | Vanillin | 4-Hydroxybenzoic acid | Caffeic Acid | Ferulic Acid | Vanillic Acid | Verbascoside | ||
| Cultivar (Cv.) | |||||||||
| Drobnica | 48.3 ± 10.91 ab | 13.06 ± 1.34 a | 1.20 ± 0.24 bc | 1.16 ± 0.17 b | 1.78 ± 0.28 b | 1.79 ± 0.31 b | 2.02 ± 0.31 bc | 431.46 ± 91.96 a | |
| Istarska bjelica | 24.19 ± 3.25 d | 8.35 ± 0.55 bc | 0.96 ± 0.15 bc | 1.57 ± 0.29 ab | 1.39 ± 0.25 b | 0.84 ± 0.18 c | 1.70 ± 0.31 c | 459.37 ± 97.23 a | |
| Lastovka | 33.19 ± 4.69 cd | 4.66 ± 0.42 d | 1.83 ± 0.25 a | 1.42 ± 0.22 ab | 3.91 ± 0.88 a | 2.85 ± 0.45 a | 3.28 ± 0.63 a | 260.75 ± 59.94 b | |
| Leccino | 58.38 ± 5.77 a | 10.44 ± 0.49 ab | 1.54 ± 0.18 ab | 1.90 ± 0.36 a | 1.99 ± 0.29 b | 1.88 ± 0.21 b | 1.38 ± 0.19 c | 480.47 ± 130.35 a | |
| Levantinka | 33.48 ± 6.36 cd | 6.84 ± 1.03 cd | 0.83 ± 0.13 c | 1.35 ± 0.27 b | 1.82 ± 0.19 b | 2.12 ± 0.22 ab | 1.99 ± 0.42 bc | 492.01 ± 144.52 a | |
| Oblica | 40.05 ± 4.47 bc | 8.52 ± 0.55 bc | 1.37 ± 0.19 abc | 1.33 ± 0.16 b | 2.10 ± 0.23 b | 2.26 ± 0.24 ab | 2.87 ± 0.43 ab | 446.76 ± 107.55 a | |
| p-value | *** | *** | *** | ** | *** | *** | *** | *** | |
| F-value | 14.75 | 16.98 | 6.33 | 3.69 | 7.29 | 9.12 | 10.4 | 5.28 | |
| Collecting period (CP) | |||||||||
| CP1 | 21.64 ± 2.20 c | 8.16 ± 0.55 b | 0.74 ± 0.05 c | 2.60 ± 0.18 a | 2.08 ± 0.12 ab | 2.66 ± 0.24 a | 3.32 ± 0.37 a | 89.05 ± 24.25 c | |
| CP2 | 44.57 ± 5.27 b | 7.66 ± 0.78 b | 1.37 ± 0.14 b | 1.02 ± 0.09 b | 1.71 ± 0.21 c | 1.28 ± 0.13 c | 2.5 ± 0.22 b | 208.47 ± 24.32 b | |
| CP3 | 52.59 ± 4.78 a | 10.11 ± 0.74 a | 1.75 ± 0.17 a | 0.75 ± 0.02 b | 2.70 ± 0.5 a | 1.93 ± 0.22 b | 0.8 ± 0.0 c | 987.89 ± 54.33 a | |
| p-value | *** | ** | *** | *** | * | *** | *** | *** | |
| F-value | 51.11 | 6.77 | 24 | 112.8 | 4.62 | 19.88 | 65.84 | 347.94 | |
| Location (L) | |||||||||
| Pag | 55.57 ± 4.28 a | 8.11 ± 0.62 | 1.42 ± 0.12 a | 1.39 ± 0.13 | 2.22 ± 0.22 | 1.84 ± 0.15 | 1.89 ± 0.17 b | 407.4 ± 65.06 | |
| Zadar | 23.63 ± 1.71 b | 9.18 ± 0.54 | 1.16 ± 0.11 b | 1.51 ± 0.16 | 2.11 ± 0.30 | 2.07 ± 0.21 | 2.52 ± 0.30 a | 449.54 ± 59.7 | |
| p-value | *** | n.s. | * | n.s. | n.s. | n.s. | ** | n.s. | |
| F-value | 151.61 | 3.43 | 4.85 | 1.22 | 0.18 | 1.56 | 11.76 | 1.95 | |
| Cv. × CP | n.s. | * | n.s. | ** | *** | n.s. | *** | *** | |
| F-value | 1.35 | 2.15 | 1.88 | 2.90 | 7.41 | 1.59 | 5.52 | 6.19 | |
| Cv. × L | *** | n.s. | * | ** | n.s. | * | ** | ** | |
| F-value | 4.76 | 1.30 | 2.74 | 3.54 | 0.61 | 2.94 | 3.75 | 3.83 | |
| CP × L | *** | * | * | n.s. | n.s. | n.s. | ** | n.s. | |
| F-value | 15.44 | 4.72 | 4.89 | 1.19 | 0.96 | 0.52 | 6.74 | 1.61 | |
| Cv. × CP × L | n.s. | n.s. | n.s. | * | n.s. | ** | ** | ** | |
| F-value | 1.91 | 1.49 | 2.5 | 0.9 | 2.59 | 3.11 | 2.65 | ||
| Factor | Flavonoids (mg/100 g DW) | Secoiridoids (mg/100 g DW) | Total Phenols (mg/100 g DW) | |||||
|---|---|---|---|---|---|---|---|---|
| Apigenin | Apigenin-7-O- glucoside | Luteolin | Luteolin-7-O- glucoside | Rutin | Catechin | Oleuropein | ||
| Cultivar (Cv.) | ||||||||
| Drobnica | 4.92 ± 0.79 b | 29.87 ± 2.96 c | 30.48 ± 3.04 b | 296.78 ± 30.19 d | 55.70 ± 5.77 b | 25.87 ± 3.99 b | 3214.87 ± 722.32 b | 4431.7 ± 224.82 a |
| Istarska bjelica | 2.73 ± 0.71 b | 34.05 ± 1.89 c | 20.59 ± 2.79 c | 323.39 ± 23.55 cd | 107.60 ± 11.67 a | 27.15 ± 4.40 b | 4497.35 ± 705.29 a | 4385.06 ± 213.58 a |
| Lastovka | 4.64 ± 1.12 b | 31.14 ± 2.38 c | 28.49 ± 3.40 bc | 326.72 ± 23.98 cd | 19.82 ± 2.98 d | 25.51 ± 2.97 b | 2307.22 ± 515.42 b | 3714.59 ± 178.10 b |
| Leccino | 10.33 ± 2.25 a | 91.75 ± 5.67 a | 36.49 ± 3.03 b | 382.37 ± 17.13 bc | 55.88 ± 4.48 b | 22.76 ± 2.49 b | 3258.03 ± 476.23 b | 4030.79 ± 217.40 ab |
| Levantinka | 10.28 ± 1.91 a | 62.85 ± 5.09 b | 53.74 ± 3.00 a | 485.70 ± 44.67 a | 35.66 ± 3.96 c | 24.68 ± 3.83 b | 2612.49 ± 549.09 b | 4414.42 ± 165.97 a |
| Oblica | 2.74 ± 0.60 b | 27.79 ± 1.26 c | 31.68 ± 2.36 b | 428.80 ± 25.52 ab | 28.29 ± 3.31 cd | 34.39 ± 5.69 a | 2472.81 ± 493.50 b | 3836.30 ± 191.08 b |
| p-value | *** | *** | *** | *** | *** | *** | *** | *** |
| F-value | 22.09 | 155.49 | 30.88 | 23.12 | 77.75 | 8.75 | 11.58 | 8.6 |
| Collecting period (CP) | ||||||||
| CP1 | 10.60 ± 1.43 a | 41.83 ± 3.88 b | 44.26 ± 2.37 a | 301.23 ± 17.44 b | 43.16 ± 5.95 b | 10.72 ± 1.08 c | 871.71 ± 149.51 c | 3721.92 ± 147.90 b |
| CP2 | 5.34 ± 0.66 b | 43.28 ± 4.70 b | 33.01 ± 2.29 b | 406.60 ± 24.38 a | 55.69 ± 7.17 a | 28.60 ± 1.78 b | 3079.25 ± 376.50 b | 3909.95 ± 118.95 b |
| CP3 | 1.89 ± 0.29 c | 53.63 ± 5.20 a | 23.47 ± 2.13 c | 414.06 ± 21.44 a | 52.63 ± 6.04 a | 40.86 ± 2.71 a | 5230.42 ± 332.04 a | 4774.57 ± 106.21 a |
| p-value | *** | *** | *** | *** | ** | *** | *** | *** |
| F-value | 69.27 | 19.32 | 53.68 | 35 | 6.68 | 248.14 | 169.68 | 53.62 |
| Location (L) | ||||||||
| Pag | 4.49 ± 0.59 b | 52.90 ± 4.24 a | 32.81 ± 2.29 | 455.41 ± 17.20 a | 63.49 ± 6.22 a | 33.38 ± 2.38 a | 3950.63 ± 398.44 a | 4158.72 ± 142.94 |
| Zadar | 7.39 ± 1.09 a | 39.58 ± 3.10 b | 34.34 ± 2.05 | 292.51 ± 12.33 b | 37.49 ± 3.19 b | 20.08 ± 1.89 b | 2170.29 ± 227.20 b | 4112.24 ± 91.12 |
| p-value | *** | *** | n.s. | *** | *** | *** | *** | n.s. |
| F-value | 22.65 | 62.08 | 0.87 | 174.94 | 79.27 | 143.2 | 84.92 | 0.28 |
| Cv. × CP | *** | *** | n.s. | * | n.s. | *** | *** | * |
| F-value | 4.96 | 7.87 | 1.22 | 2.04 | 1.25 | 11.50 | 4.21 | 2.19 |
| Cv. × L | n.s. | *** | n.s. | *** | *** | ** | * | * |
| F-value | 1.48 | 6.09 | 1.36 | 5.48 | 21.81 | 3.46 | 3.08 | 2.76 |
| CP × L | *** | *** | * | n.s. | n.s. | ** | *** | *** |
| F-value | 16.14 | 7.99 | 4.50 | 0.12 | 1.57 | 7.23 | 16.98 | 52.73 |
| Cv. × CP × L | ** | n.s. | n.s. | n.s. | n.s. | *** | *** | * |
| F-value | 2.8 | 1.02 | 1.22 | 0.72 | 0.98 | 3.55 | 3.68 | 2.53 |
| Factor | Macronutrients (g/kg) | Micronutrients (mg/kg) | ||||||||
|---|---|---|---|---|---|---|---|---|---|---|
| Phosphorous | Potassium | Calcium | Magnesium | Sodium | Iron | Zinc | Manganese | Copper | Boron | |
| Cultivar (Cv.) | ||||||||||
| Drobnica | 1.20 ± 0.04 b | 6.42 ± 0.31 a | 16.14 ± 0.83 c | 1.09 ± 0.05 c | 0.98 ± 0.08 a | 77.93 ± 2.53 bc | 24.04 ± 1.45 b | 48.86 ± 2.17 c | 36.73 ± 4.24 b | 19.79 ± 0.88 |
| Istarska bjelica | 1.34 ± 0.04 a | 5.39 ± 0.43 b | 23.25 ± 2.34 b | 1.23 ± 0.07 bc | 0.95 ± 0.10 a | 77.10 ± 2.14 bc | 29.87 ± 1.96 a | 56.99 ± 4.10 b | 43.02 ± 4.07 ab | 19.72 ± 0.97 |
| Lastovka | 1.33 ± 0.05 a | 5.37 ± 0.47 b | 28.62 ± 2.24 a | 1.47 ± 0.08 b | 0.71 ± 0.09 bc | 91.68 ± 3.79 a | 24.79 ± 1.11 b | 44.46 ± 1.72 c | 36.93 ± 3.58 b | 19.68 ± 1.10 |
| Leccino | 1.33 ± 0.04 a | 5.08 ± 0.41 b | 28.71 ± 1.61 a | 2.07 ± 0.18 a | 0.89 ± 0.07 ab | 78.67 ± 2.99 b | 25.78 ± 0.87 b | 67.87 ± 2.74 a | 49.82 ± 7.63 a | 18.26 ± 1.11 |
| Levantinka | 1.30 ± 0.05 a | 3.76 ± 0.42 c | 26.23 ± 1.33 a | 2.14 ± 0.11 a | 0.64 ± 0.07 c | 68.70 ± 2.63 c | 25.22 ± 1.35 b | 56.92 ± 2.09 b | 42.89 ± 4.09 ab | 19.61 ± 1.09 |
| Oblica | 1.37 ± 0.04 a | 6.56 ± 0.47 a | 20.38 ± 1.63 b | 1.47 ± 0.09 b | 0.68 ± 0.04 bc | 80.69 ± 3.99 b | 31.38 ± 2.35 a | 51.34 ± 2.14 bc | 41.52 ± 4.22 b | 19.22 ± 0.76 |
| p-value | *** | *** | *** | *** | *** | *** | *** | *** | *** | n.s. |
| F-value | 9.08 | 54.30 | 50.77 | 49.02 | 8.6 | 10.54 | 19.17 | 20.04 | 6.98 | 2.1 |
| Collecting period (CP) | ||||||||||
| CP1 | 1.36 ± 0.02 a | 6.93 ± 0.27 a | 25.59 ± 1.57 a | 1.41 ± 0.10 b | 0.71 ± 0.04 b | 79.86 ± 2.32 a | 25.40 ± 1.43 b | 61.86 ± 2.25 a | 22.80 ± 2.17 c | 22.92 ± 0.72 a |
| CP2 | 1.33 ± 0.04 a | 5.7 ± 0.26 b | 26.68 ± 1.61 a | 1.73 ± 0.09 a | 0.97 ± 0.08 a | 83.70 ± 2.45 a | 27.19 ± 1.21 a | 46.20 ± 1.53 c | 44.75 ± 2.30 b | 15.77 ± 0.24 c |
| CP3 | 1.25 ± 0.03 b | 3.66 ± 0.19 c | 19.39 ± 0.49 b | 1.59 ± 0.10 a | 0.74 ± 0.05 b | 73.83 ± 2.23 b | 27.96 ± 0.86 a | 55.17 ± 1.94 b | 57.91 ± 2.77 a | 19.45 ± 0.39 b |
| p-value | *** | *** | *** | *** | *** | *** | ** | *** | *** | *** |
| F-value | 17.51 | 286.44 | 63.31 | 13.50 | 15.48 | 9.50 | 7.25 | 37.10 | 188.57 | 156.23 |
| Location (L) | ||||||||||
| Pag | 1.46 ± 0.02 a | 5.93 ± 0.27 a | 19.66 ± 0.90 b | 1.52 ± 0.09 b | 0.98 ± 0.05 a | 73.79 ± 1.63 b | 21.9 ± 0.57 b | 54.95 ± 1.93 | 42.63 ± 3.64 | 19.86 ± 0.63 a |
| Zadar | 1.17 ± 0.02 b | 4.93 ± 0.26 b | 28.11 ± 1.12 a | 1.63 ± 0.07 a | 0.63 ± 0.03 b | 84.46 ± 2.02 a | 31.8 ± 0.82 a | 53.87 ± 1.65 | 41.01 ± 1.56 | 18.90 ± 0.49 b |
| p-value | *** | *** | *** | * | *** | *** | *** | n.s. | n.s. | ** |
| F-value | 317.5 | 79.27 | 219.38 | 4.55 | 70.94 | 32.78 | 308.42 | 0.53 | 1.19 | 8.38 |
| Cv. × CP | ** | * | *** | n.s. | n.s. | n.s. | * | n.s. | *** | *** |
| F-value | 2.78 | 2.19 | 6.68 | 1.11 | 1.90 | 1.83 | 1.99 | 1.49 | 4.38 | 6.61 |
| Cv. × L | n.s. | *** | *** | *** | n.s. | * | *** | *** | *** | *** |
| F-value | 0.82 | 33.55 | 15.61 | 34.58 | 1.72 | 3.28 | 16.96 | 5.20 | 6.58 | 12.20 |
| CP × L | *** | ** | *** | n.s. | *** | * | *** | * | *** | *** |
| F-value | 18.38 | 7.49 | 25.21 | 2.94 | 14.56 | 3.29 | 19.67 | 3.17 | 72.67 | 10.03 |
| Cv. × CP × L | n.s. | ** | * | n.s. | n.s. | * | n.s. | n.s. | *** | *** |
| F-value | 0.98 | 3.24 | 2.09 | 0.34 | 1.79 | 2.13 | 0.50 | 1.49 | 4.13 | 7.54 |
Publisher’s Note: MDPI stays neutral with regard to jurisdictional claims in published maps and institutional affiliations. |
© 2020 by the authors. Licensee MDPI, Basel, Switzerland. This article is an open access article distributed under the terms and conditions of the Creative Commons Attribution (CC BY) license (http://creativecommons.org/licenses/by/4.0/).
Share and Cite
Lukić, I.; Pasković, I.; Žurga, P.; Majetić Germek, V.; Brkljača, M.; Marcelić, Š.; Ban, D.; Grozić, K.; Lukić, M.; Užila, Z.; et al. Determination of the Variability of Biophenols and Mineral Nutrients in Olive Leaves with Respect to Cultivar, Collection Period and Geographical Location for Their Targeted and Well-Timed Exploitation. Plants 2020, 9, 1667. https://doi.org/10.3390/plants9121667
Lukić I, Pasković I, Žurga P, Majetić Germek V, Brkljača M, Marcelić Š, Ban D, Grozić K, Lukić M, Užila Z, et al. Determination of the Variability of Biophenols and Mineral Nutrients in Olive Leaves with Respect to Cultivar, Collection Period and Geographical Location for Their Targeted and Well-Timed Exploitation. Plants. 2020; 9(12):1667. https://doi.org/10.3390/plants9121667
Chicago/Turabian StyleLukić, Igor, Igor Pasković, Paula Žurga, Valerija Majetić Germek, Mia Brkljača, Šime Marcelić, Dean Ban, Kristina Grozić, Marina Lukić, Zoran Užila, and et al. 2020. "Determination of the Variability of Biophenols and Mineral Nutrients in Olive Leaves with Respect to Cultivar, Collection Period and Geographical Location for Their Targeted and Well-Timed Exploitation" Plants 9, no. 12: 1667. https://doi.org/10.3390/plants9121667
APA StyleLukić, I., Pasković, I., Žurga, P., Majetić Germek, V., Brkljača, M., Marcelić, Š., Ban, D., Grozić, K., Lukić, M., Užila, Z., & Goreta Ban, S. (2020). Determination of the Variability of Biophenols and Mineral Nutrients in Olive Leaves with Respect to Cultivar, Collection Period and Geographical Location for Their Targeted and Well-Timed Exploitation. Plants, 9(12), 1667. https://doi.org/10.3390/plants9121667