Abstract
Long-term poplar phytoremediation data are lacking, especially for ecosystem services throughout rotations. We tested for rotation-age differences in biomass productivity and carbon storage of clones Populus deltoides Bartr. ex Marsh × P. nigra L. ‘DN34′ and P. nigra × P. maximowiczii A. Henry ‘NM6′ grown for landfill phytoremediation in Rhinelander, WI, USA (45.6° N, 89.4° W). We evaluated tree height and diameter, carbon isotope discrimination (Δ), and phytoaccumulation and phytoextraction of carbon, nitrogen, and inorganic pollutants in leaves, boles, and branches. We measured specific gravity and fiber composition, and determined biofuels recalcitrance of the Rhinelander landfill trees versus these genotypes that were grown for biomass production on an agricultural site in Escanaba, MI, USA (45.8° N, 87.2° W). ‘NM6′ exhibited 3.4 times greater biomass productivity and carbon storage than ‘DN34′, yet both of the clones had similar Δ, which differed for tree age rather than genotype. Phytoaccumulation and phytoextraction were clone- and tissue-specific. ‘DN34′ generally had higher pollutant concentrations. Across contaminants, stand-level mean annual uptake was 28 to 657% greater for ‘NM6′, which indicated its phytoremediation superiority. Site-related factors (not genotypic effects) governed bioconversion potential. Rhinelander phytoremediation trees exhibited 15% greater lignin than Escanaba biomass trees, contributing to 46% lower glucose yield for Rhinelander trees.
1. Introduction
Covering more than 31-million hectares across 30 countries [1], poplar biomass plantings are one of the most widespread, fast-growing feedstock production systems worldwide [2]. In addition to biomass production for biofuels, bioenergy, and bioproducts [3], poplars and their hybrids are ideal for phytoremediation [4]. Large root systems, fast growth, and elevated transpiration rates, combined with the availability of specially-bred, vegetatively-propagated material, make poplars model candidates for phytotechnologies [5,6,7]. In particular, poplars have been shown to accumulate heavy metals and other inorganic pollutants [8,9,10] and metabolize organic contaminants and excessive nutrients [11,12,13] in soils and groundwater. Poplars are commonly used in landfill applications and they have been effective in decreasing contamination through processes, such as phytoextraction, phytostabilization, and runoff reduction [7,14,15,16].
Regardless of end use, genotype × environment interactions play a substantial role in poplar establishment and subsequent plantation development [17,18]. This is especially true for phytotechnologies, where genotypic responses not only depend on climatic and edaphic factors, but also conditions that are imposed by pollutants of the system (e.g., contaminated soils, wastewater, etc.). In addition to provisioning ecosystem services, such biomass and freshwater [19], poplars used in phytoremediation provide additional ecosystem services [7,20]. For example, supporting services, such as nitrogen and water cycles, are tightly linked to regulating services, such as carbon sequestration and water quality, both of which phytotechnologies provide [21]. Poplars are among the most productive temperate-grown trees, with global average biomass mean annual increment (BIOMASSMAI) of 11.2 Mg ha−1 yr−1 and North American average of 12.3 Mg ha−1 yr−1 [22]. Carbon sequestration potential of poplars is also relatively higher than other temperate genera, with an average of 47% of poplar biomass being carbon [7]. Predictive modeling of poplars in the Southeast United States resulted in carbon mean annual increment (CARBONMAI) values of 9.9 Mg C ha−1 over a 100-year rotation [20], while poplar plantations in the North Central United States have shown CARBONMAI as high as 10.2 Mg C ha−1 [23].
Overall, the majority of tree-based phytoremediation studies have focused on efficiency (e.g., accumulation and degradation of pollutants) and performance (e.g., tree survival, growth, and physiological responses) of trees grown in the presence of contaminants [2,24]. Therefore, directly quantifying biomass and carbon ecosystem services is essential for gauging phytoremediation success. Other ecosystem services are equally important. For example, poplars exhibit phreatophytic characteristics, such as high water uptake and transpiration [25,26,27] and the ability to economize water use in moisture limited areas [28]. Thus, water use efficiency (WUE), which is strongly correlated with both δ13C stable carbon isotope ratios and carbon isotope discrimination (Δ) [29,30], is an important trait during genotype selection for phytoremediation. However, research using Δ in phytoremediation with trees is scarce [31], especially when considering potential stress impacts that are caused by landfill soil properties [32,33] and/or highly variable contamination sources [10,34,35] on plant water regimes during phytoremediation processes.
In addition to measuring the efficiency and performance of ecosystem services and physiological traits, quantifying biofuels recalcitrance incorporates an aspect of phytoremediation that is not often considered: end use of the biomass feedstock [5,36]. Converting poplar biomass into biofuels, bioenergy, and bioproducts has been the focus of much research [3,37,38], and promising pretreatment methods have been developed and tested on poplars during the last decade [38,39,40]. In particular, dilute acid (DA) and sulfite pretreatment for overcoming the recalcitrance of lignocelluloses (SPORL) pretreatments were used to compare biofuels recalcitrance of native quaking aspen (Populus tremuloides Michx.) with three poplar clones (Populus deltoides Bartr. ex Marsh × P. nigra L. ‘NE222′ ‘DN5′ and P. nigra × P. maximowiczii A. Henry ‘NM6′). ‘NE222′ and ‘DN5′ both exhibited bioconversion potential intermediate of pretreated quaking aspen and ‘NM6′, indicating potential for these methods given that ‘NE222′ and ‘DN5′ have six to eight times greater biomass productivity than quaking aspen along with 36 to 71% greater ethanol yield than ‘NM6′, depending on the pretreatment method [41].
There is a lack of long-term data from poplar installations, despite being used more than any other woody genera for phytoremediation in temperate regions [42]. In particular, there is a knowledge gap about the diversity and magnitude of ecosystem services poplars provide from crown closure to the end of their rotations [7]. To learn about these long-term benefits, we tested for rotation-age differences in biomass productivity and the carbon storage potential of clones Populus deltoides Bartr. ex Marsh × P. nigra L. ‘DN34′ and P. nigra × P. maximowiczii A. Henry ‘NM6′ used for landfill phytoremediation in Rhinelander, WI, USA (45.6° N, 89.4° W). In addition to these ecosystem services, we evaluated tree height and diameter, carbon isotope discrimination (Δ), and phytoaccumulation and phytoextraction of carbon, nitrogen, and inorganic pollutants (Al, Cd, Ca, Co, Cr, Cu, Fe, K, Mg, Mn, Na, Ni, P, Pb, Zn) in leaves, boles, and branches. We measured specific gravity and fiber composition and determined biofuel recalcitrance of the Rhinelander landfill trees versus these genotypes that were grown for biomass production on an agricultural site in Escanaba, MI, USA (45.8° N, −87.2° W). Overall, these data are important for resource managers, researchers, and regulators that are designing, implementing, and monitoring phytoremediation and associated phytotechnologies at landfills and similar liability sites. In addition, biofuel conversion information is useful for evaluating potential biomass feedstock sources from non-traditional applications, thus reducing pressure on purpose-grown plantations and natural forests [36].
2. Results
2.1. Ecosystem Services and Physiology
The tree age main effect was significant for total carbon (p = 0.0023) and carbon isotope discrimination (p < 0.0001) (Table 1). The total carbon ranged from 47.72 ± 0.17% (four years) to 48.86 ± 0.21% (16 years), with an overall mean of 48.20 ± 0.05% (Figure 1A). In general, the total carbon increased over time until 16 years after planting, then significantly decreased 2% during the last year of the study. Carbon content of 16-year-old trees was also 2% greater than that of 4-, 5-, 6-, and 8-year-old trees. Carbon isotope discrimination (Δ) ranged from 18.10 ± 0.20‰ (eight years) to 20.60 ± 0.16‰ (16 years), with an overall mean of 19.20 ± 0.08‰ (Figure 1B). From years six to nine, Δ decreased 2 to 4% as compared with three-year-old trees, with Δ during those four years being 4 to 6% significantly less than the overall mean. At years 10 and 11, Δ increased until reaching its maximum at 16 years, which was not different than at 12, 13, 14, 15, or 17 years. Values for Δ during the last six years of the study were 3 to 7% greater than the overall mean (Figure 1B).

Table 1.
Probability values from analyses of variance for: (1) two hybrid poplar clones [Populus deltoides Bart. ex Marsh. × P. nigra L. ‘DN34′; P. nigra × P. maximowiczii A. Henry ‘NM6′] grown for seventeen years at the former Rhinelander City Landfill in Rhinelander, WI, USA (annual tree ages are from three to seventeen years) (clone × age); (2) clones ‘DN34′ and ‘NM6′ at three developmental plantation stages (0 to 4, 5 to 13, 14, to 17 years) at the former Rhinelander City Landfill (clone × stage); (3) clones ‘DN34′ and ‘NM6′ grown for phytoremediation at the former Rhinelander City Landfill and biomass production at the Michigan State University, Forest Biomass Innovation Center (FBIC) in Escanaba, MI, USA (site × clone). Significant values are bolded.
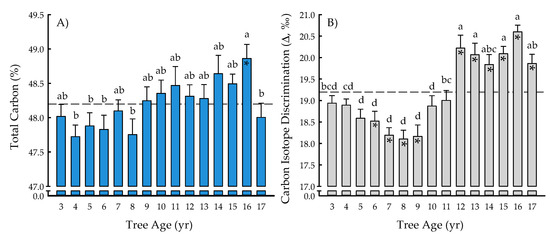
Figure 1.
Total carbon (%) (A) and carbon isotope discrimination (Δ, ‰) (B) from tree age 3 to 17 years across two hybrid poplar clones [Populus deltoides Bart. ex Marsh. × P. nigra L. ‘DN34′; P. nigra × P. maximowiczii A. Henry ‘NM6′] grown for phytoremediation at the former Rhinelander City Landfill in Rhinelander, WI, USA. The dashed line is the overall mean; means differing from the overall mean at p < 0.05 are indicated with asterisks. Bars with the same letters are not different at p < 0.05.
The clone × age interaction was significant for BIOMASSMAI (p < 0.0001) (Table 1). BIOMASSMAI ranged from 0.1 ± 0.1 (‘DN34′, three years) to 4.8 ± 0.3 (‘NM6′, 17 years) Mg ha−1 yr−1, with an overall mean of 2.1 ± 0.1 Mg ha−1 yr−1 (Figure 2). The annual biomass production of ‘DN34′ stabilized during years 14 to 17, while that of ‘NM6′ continued to increase until harvest at age 17 years. Overall, ‘NM6′ exhibited 182% greater BIOMASSMAI, averaged across the rotation. BIOMASSMAI of ‘DN34′ never reached the overall mean, and annual productivity for ‘DN34′ from years three to 11 was 36 to 94% significantly less than the overall mean. In contrast, BIOMASSMAI of ‘NM6′ was 36 to 133% significantly greater than the overall mean from years 9 to 17 (Figure 2).
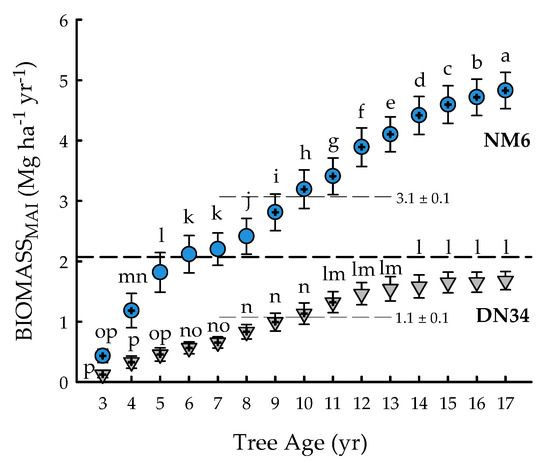
Figure 2.
Mean annual increment of aboveground dry leafless biomass (BIOMASSMAI; Mg ha−1 yr−1) from tree age 3 to 17 years for two hybrid poplar clones [Populus deltoides Bart. ex Marsh. × P. nigra L. ‘DN34′; P. nigra × P. maximowiczii A. Henry ‘NM6′] grown for phytoremediation at the former Rhinelander City Landfill in Rhinelander, WI, USA. The dashed line is the overall mean; means differing from the overall mean at p < 0.05 are indicated with plus symbols. Values for clonal means are shown. Triangles (‘DN34′) and circles (‘NM6′) with the same letters are not different at p < 0.05.
The clone × age interaction was significant for RELATIVEMAI (p = 0.0305) (Table 1), with cubic equations exhibiting the best model fit for both clones (Figure 3A,B). Specifically, the coefficients of determination were R2 = 0.8865 for ‘DN34′ and R2 = 0.8572 for ‘NM6′. The growth curves for both clones represented three distinct developmental plantation stages. In particular, there was an early peak in growth rates through the first 4 years (i.e., relatively substantial increases in RELATIVEMAI). From five to 13 years, there was a steady increase in RELATIVEMAI, followed by a leveling off of RELATIVEMAI (i.e., changes in growth rates < 5% annually) from years 14 to 17 (Figure 3A,B).
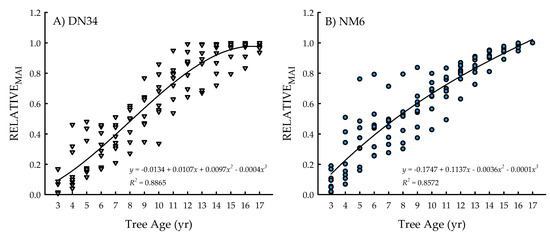
Figure 3.
Relative mean annual increment (RELATIVEMAI; proportion of current-year MAI relative to the greatest mean annual increment (MAI) across years) from tree age 3 to 17 years for two hybrid poplar clones [Populus deltoides Bart. ex Marsh. × P. nigra L. ‘DN34′; P. nigra × P. maximowiczii A. Henry ‘NM6′] grown for phytoremediation at the former Rhinelander City Landfill in Rhinelander, WI, USA.
The clone and plantation stage main effects were significant for lignin (p = 0.0468) and hemicellulose (p < 0.0001) fiber content, respectively, while the clone × plantation stage interaction governed cellulose content (p = 0.0013) (Table 1). Lignin was 3% greater for ‘DN34′ (29.4 ± 0.3%) than ‘NM6′ (28.6 ± 0.2%), across plantation stages. Hemicellulose content significantly decreased with tree age, with 20.6 ± 0.3%, 18.6 ± 0.2%, and 17.5 ± 0.3% for 0- to 4-, 5-, to 13-, and 14- to 17-year-old trees, respectively. Plantation stages 0 to 4 years and 14 to 17 years were significantly different than the overall mean of 18.9 ± 0.2% hemicellulose. Cellulose content ranged from 42.8 ± 0.7% (‘DN34′, 0 to 4 years) to 48.2 ± 0.9% (‘DN34′, 14 to 17 years), with an overall mean of 45.0 ± 0.4% (Figure 4). Trees of ‘DN34′ had the highest cellulose content during plantation stage 14 to 17 years, which was 12% and 11% greater than 0 to 4 and 5 to 13 years, respectively, which were not different from one another. For ‘NM6′, the cellulose content did not differ among plantation stages (Figure 4).
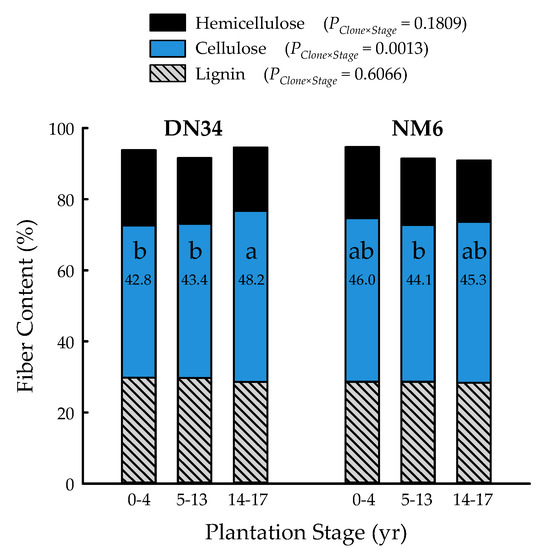
Figure 4.
Percent hemicellulose, cellulose, and lignin of two hybrid poplar clones [Populus deltoides Bart. ex Marsh. × P. nigra L. ‘DN34′; P. nigra × P. maximowiczii A. Henry ‘NM6′] at three developmental plantation stages (0 to 4, 5 to 13, 14, to 17 years) grown for phytoremediation at the former Rhinelander City Landfill in Rhinelander, WI, USA. Cellulose values with the same letters are not different at p < 0.05.
Differences between clones were negligible for height (p = 0.0588), total carbon (p = 0.5100), and branch moisture (p = 0.3334) (Table 2). The specific gravity of ‘DN34′ was 13% greater than ‘NM6′ (p = 0.0001), while ‘NM6′ outperformed ‘DN34′ for all other productivity- and wood-related traits. In particular, ‘NM6′ had 56% larger diameter, 236% greater leafless BIOMASSMAI, 233% greater total BIOMASSMAI, 229% greater leafless CARBONMAI, 243% greater total CARBONMAI, and 9% more bole moisture (p < 0.0001 for all traits) (Table 2).
Table 2.
Productivity- and wood-related traits (mean ± standard error) of two hybrid poplar clones [Populus deltoides Bart. ex Marsh. × P. nigra L. ‘DN34′; P. nigra × P. maximowiczii A. Henry ‘NM6′] grown for phytoremediation for seventeen years at the former Rhinelander City Landfill in Rhinelander, WI, USA. The probability values from analyses of variance are shown, with significant values bolded.
Phytoaccumulation and phytoextraction in leaves, boles, and branches were clone- and tissue-specific (Table 3), with ‘DN34′ generally having higher uptake levels than ‘NM6′, and differences in elemental concentrations being present in leaves and branches at greater frequencies and magnitudes than in the boles. There were no differences in the uptake of total N, total C, Cd, Cr, Ni, or Pb between clones for any of the tree tissues (p > 0.05). In contrast, ‘DN34′ exhibited 41 to 310% significantly higher concentrations of Fe, Mn, and Na than ‘NM6′ in all three tissues (Table 3). The leaf, bole, and branch Fe concentrations were 117%, 212%, and 105% greater for ‘DN34′, respectively, while those for Mn were 63% (leaf), 310% (bole), and 94% (branch) higher. Sodium concentrations in ‘DN34′ leaves, boles, and branches were 41%, 155%, and 68% greater, respectively. For K, ‘DN34′ exhibited 22% higher phytoaccumulation into leaves and 16% greater uptake into branches; differences in the bole K concentrations were negligible (Table 3). Four tissue × element combinations had significantly greater concentrations for ‘DN34′ than ‘NM6′: (1) BranchMg +26%, (2) BranchP +23%, (3) LeafCl +30%, and (4) BoleZn +31%. In contrast to the general trend of ‘DN34′ having greater uptake than ‘NM6′, five tissue × element combinations had significantly greater concentrations for ‘NM6′ than ‘DN34′: (1) LeafCa +85%, (2) BranchCa +34%, (3) LeafAl +53%, (4) BranchAl +267%, and (5) BranchCo +549%. There was one instance of ‘DN34′ and ‘NM6′ each having higher concentrations for the same element, depending on the tissue. In particular, ‘DN34′ had 139% more Cu than ‘NM6′ in branches, while ‘NM6′ exhibited 188% more Cu than ‘DN34′ in boles (Table 3).
Table 3.
Elemental phytoaccumulation and phytoextraction (mean ± standard error) in leaves, boles, and branches of two hybrid poplar clones [Populus deltoides Bart. ex Marsh. × P. nigra L. ‘DN34′; P. nigra × P. maximowiczii A. Henry ‘NM6′] grown for seventeen years for phytoremediation at the former Rhinelander City Landfill in Rhinelander, WI, USA. Significant probability values from analyses of variance are bolded. Units are: % for N, C; g kg−1 for Ca, K, Mg, P; mg kg−1 for all other elements.
2.2. Biofuels Recalcitrance
With the exception of recovery of furfural in spent liquor (p = 0.4385), the site main effects were significant for all biofuels recalcitrance traits (p < 0.05), while clone main effects and site × clone interactions were negligible (Table 1). Mannan, xylan, and glucan content was 37%, 21%, and 26% greater for biomass trees growing in Escanaba, Michigan than phytoremediation trees growing in Rhinelander, Wisconsin. In contrast, Rhinelander phytoremediation trees exhibited 15% greater lignin content than Escanaba biomass trees (Figure 5). For substrate enzymatic digestibility (SED), Escanaba biomass trees were 88% higher than Rhinelander phytoremediation trees, even though the latter had 17% more CTec3 loading than their Escanaba counterparts (Figure 6). The relationship between SED and lignin content, as well as SED and xylan dissolution, were significant, with cubic equations exhibiting the best model fit and coefficients of determination of R2 = 0.7975 and R2 = 0.6832, respectively (Figure 7). However, these relationships were different. In particular, there was an inverse relationship between SED and lignin content, with SED decreasing as wood lignin content increased, while SED increased with increasing xylan dissolution. The relationship between xylan retained in water insoluble solids (WIS) and lignin content was not significant (Figure 7). Despite the aforementioned lack of significance of furfural recovery in spent liquor between sites, the recovery of xylose in spent liquor was 118% greater for Escanaba biomass trees than Rhinelander phytoremediation trees, and the xylan retained in WIS was 59% greater for Rhinelander than Escanaba (Figure 8). Both enzymatic hydrolysis glucose yield (EHGY) and glucose recovery in spent liquor were the highest for Escanaba, with biomass trees exhibiting 74% and 78% greater glucan recovery than Rhinelander phytoremediation trees, respectively (Figure 9).
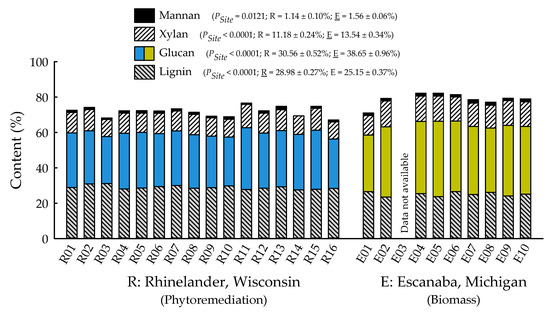
Figure 5.
Percent mannan, xylan, glucan, and lignin across two hybrid poplar clones [Populus deltoides Bart. ex Marsh. × P. nigra L. ‘DN34′; P. nigra × P. maximowiczii A. Henry ‘NM6′] grown for phytoremediation at the former Rhinelander City Landfill in Rhinelander, WI, USA, and biomass production at the Michigan State University, Forest Biomass Innovation Center (FBIC) in Escanaba, MI, USA. Probability values for site main effects are listed in parentheses, along with means ± one standard error. R01 to R16 = trees 1 to 16 in Rhinelander; E01 to E10 = trees 1 to 10 in Escanaba.
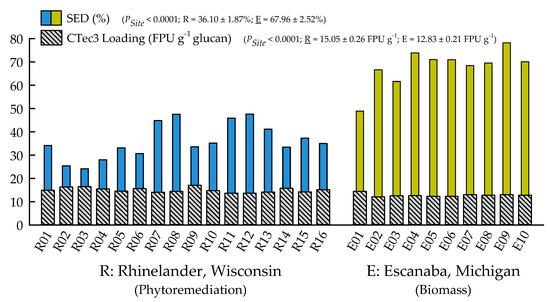
Figure 6.
Substrate enzymatic digestibility (SED; %) and CTec3 loading (FPU g−1 glucan) across two hybrid poplar clones [Populus deltoides Bart. ex Marsh. × P. nigra L. ‘DN34′; P. nigra × P. maximowiczii A. Henry ‘NM6′] grown for phytoremediation at the former Rhinelander City Landfill in Rhinelander, WI, USA, and biomass production at the Michigan State University, Forest Biomass Innovation Center (FBIC) in Escanaba, MI, USA. The probability values for site main effects are listed in parentheses, along with means ± one standard error. R01 to R16 = trees 1 to 16 in Rhinelander; E01 to E10 = trees 1 to 10 in Escanaba.
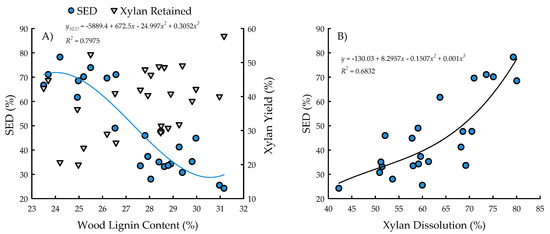
Figure 7.
Substrate enzymatic digestibility (SED; %) and xylan yield (%) versus wood lignin content (%) (A) and SED versus xylan dissolution (%) (B) across two hybrid poplar clones [Populus deltoides Bart. ex Marsh. × P. nigra L. ‘DN34′; P. nigra × P. maximowiczii A. Henry ‘NM6′] grown for phytoremediation at the former Rhinelander City Landfill in Rhinelander, WI, USA. The relationship between xylan yield and lignin was not significant at p < 0.05.
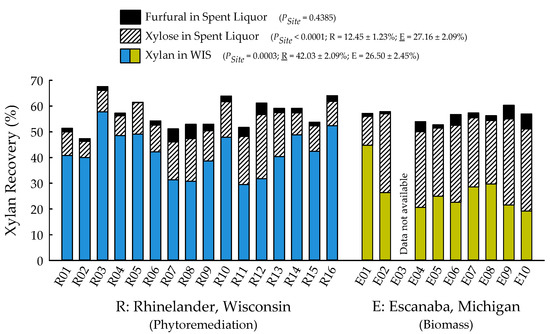
Figure 8.
Percent recovery of furfural in spent liquor, xylose in spent liquor, and xylan in water insoluble solids (WIS) across two hybrid poplar clones [Populus deltoides Bart. ex Marsh. × P. nigra L. ‘DN34′; P. nigra × P. maximowiczii A. Henry ‘NM6′] grown for phytoremediation at the former Rhinelander City Landfill in Rhinelander, WI, USA, and biomass production at the Michigan State University, Forest Biomass Innovation Center (FBIC) in Escanaba, MI, USA. The probability values for site main effects are listed in parentheses, along with means ± one standard error. R01 to R16 = trees 1 to 16 in Rhinelander; E01 to E10 = trees 1 to 10 in Escanaba.
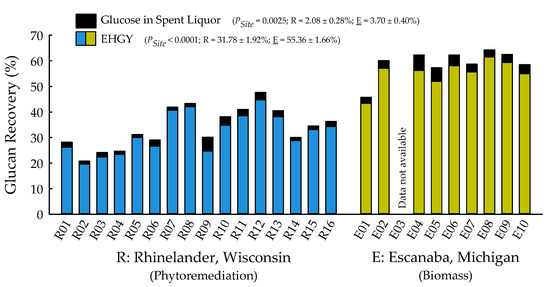
Figure 9.
Percent glucose in spent liquor and enzymatic hydrolysis glucose yield (EHGY) across two hybrid poplar clones [Populus deltoides Bart. ex Marsh. × P. nigra L. ‘DN34′; P. nigra × P. maximowiczii A. Henry ‘NM6′] grown for phytoremediation at the former Rhinelander City Landfill in Rhinelander, WI, USA, and biomass production at the Michigan State University, Forest Biomass Innovation Center (FBIC) in Escanaba, MI, USA. Probability values for site main effects are listed in parentheses, along with means ± one standard error. R01 to R16 = trees 1 to 16 in Rhinelander; E01 to E10 = trees 1 to 10 in Escanaba.
3. Discussion
The long-term success of phytoremediation systems is, by definition, quantified and valued based on contaminant stabilization, filtration, degradation, extraction, and/or volatilization into less harmful constituents [43,44]. While rotation-age phytoaccumulation and phytoextraction of carbon, nitrogen, and inorganic pollutants into leaves, boles, and branches of poplar clones ‘DN34′ and ‘NM6′ was a major focus of the current study, equally important results were elucidated for ecosystem services, such as aboveground biomass productivity and carbon storage potential. Oftentimes, such ecosystem services are not evaluated given resource constraints that are associated with budgets, personnel, and/or project duration [7]. However, combining these services with phytoremediation potential is useful for developing stand-level silvicultural prescriptions that relate to landscape-level phytomanagement of ecosystem services [21,45]. In addition to long-term phytoremediation effectiveness and the provision of ecosystem services throughout poplar rotations, data are also lacking for the identification and post-processing of the wood for specific applications once the trees have reached their phytoremediation life span [5,36]. More often than not, end uses of the feedstocks are not identified during project planning nor implementation. To address this need to inform end-use decisions, biofuels recalcitrance traits were compared between Rhinelander phytoremediation trees and Escanaba biomass trees in order to test whether the feedstocks grown on contaminated soils exhibited similar biofuel yields as their traditionally-grown, agricultural counterparts. Overall, the clone effects were negligible and site-related factors governed bioconversion potential. Rhinelander phytoremediation trees exhibited 15% greater lignin content than Escanaba biomass trees, contributing to 46% lower glucose yield for phytoremediation-grown trees.
The results of the current study corroborated the general trend of ‘NM6′ having greater biomass productivity, carbon storage potential, and additional ecosystem services than ‘DN34′ in the North Central United States [20,46]. For example, ‘NM6′ had 28% greater height than ‘DN34′ in a phytoremediation system with soils heavily contaminated with petroleum hydrocarbons near Gary, IN, USA (41.5° N, 87.3° W) [47]. In contrast, 11-year-old ‘DN34′ and ‘NM6′ trees that were grown for phytoremediation of salts, metals, and nitrates were not significantly different, despite ‘NM6′ having 6% greater biomass and carbon [7,48]. While both clones perform as generalists throughout the region, ‘DN34′ has a much greater latitudinal range, with ‘NM6′ experiencing reduced growth and increased disease incidence (e.g., Septoria canker, Septoria musiva Peck) below 43° N latitude [17,18,49]. At the Rhinelander landfill in the current study, ‘NM6′ exhibited 3.4 times greater biomass productivity and carbon storage than ‘DN34′, yet both the clones had similar carbon isotope discrimination (Δ), which differed for tree age rather than genotype (Table 1; Figure 1). Water use efficiency (WUE) and δ13C stable isotope ratios (and, therefore, Δ) have shown mixed results for their relationships with plant productivity. Previous studies have reported both the existence [50,51,52] and lack [53,54,55] of correlations among WUE, δ13C, or ∆ with growth parameters. For the Rhinelander phytoremediation trees, BIOMASSMAI was positively significantly correlated with Δ across clones and ages (p < 0.0001; r = 0.34) and within individual clones (‘DN34′ p < 0.0001, r = 0.49; ‘NM6′ p < 0.0001, r = 0.46) (data not reported). These positive correlations between biomass production and ∆ suggested that high productivity and low WUE characterized ‘DN34′ and ‘NM6′, which were likely driven by variations in stomatal conductance, resulting in high BIOMASSMAI at the expense of water use [56]. Therefore, despite being beyond the scope of the current study, ∆-assisted, multi-trait selection of productive clones should be carefully considered in future efforts, focusing on both growth and high WUE [51,57]. Such efforts are important, as they take into account linkages between WUE and phytoremediation that are associated with potential stress impacts from landfill soil properties and contamination sources [10,31,32,33,34,35].
In the current study, phytoaccumulation and phytoextraction were clone- and tissue-specific, with ‘DN34′ generally exhibiting higher pollutant concentrations in leaves, boles, and branches. Assessed independently based solely on these concentrations, it could be assumed that ‘DN34′ was more efficient at remediating the landfill. However, ‘NM6′ outperformed ‘DN34′ for all biomass- and carbon-related traits (Table 2). While using a mass balance approach, calculated stand-level, mean annual elemental uptake (PHYTOMAI) across contaminants was 28% (Mn) to 657% (Cr) greater for ‘NM6′ (Table 4), indicating its phytoremediation superiority despite ‘DN34′ having generally higher pollutant concentrations in all tree tissues. The universal phytoaccumulation/phytoextraction advantage of ‘DN34′ for Fe, Mn, and Na was of particular note (Table 3). Despite ‘DN34′ exhibiting 41 to 310% significantly higher concentrations than ‘NM6′ in all three tissues, ‘NM6′ had 28%, 54%, and 60% greater PHYTOMAI, respectively, thus illustrating the need to integrate ecosystem services with phytoprocess-related information before determining overall phytoremediation effectiveness [21].
Table 4.
Stand-level, mean annual elemental phytoaccumulation and phytoextraction (PHYTOMAI) in aboveground dry leafless biomass of two hybrid poplar clones [Populus deltoides Bart. ex Marsh. × P. nigra L. ‘DN34′; P. nigra × P. maximowiczii A. Henry ‘NM6′] grown for seventeen years for phytoremediation at the former Rhinelander City Landfill in Rhinelander, WI, USA. Calculations were made from the average of bole and branch uptake values in Table 3 and BIOMASSMAI (leafless) values in Table 2. Chloride (Cl) values are from leaf phytoaccumulation.
In contrast to ecosystem services and physiology, neither genotype nor genotype × environment interactions influenced biofuels recalcitrance traits. Instead, site effects governed substrate enzymatic digestibility (SED) and the recovery of most wood constituents (Figure 8). These results are unique given the broad genetic diversity within the genus Populus [58,59] and, more specifically, differences between these clones for various applications, ranging from biomass to phytotechnologies [7,18,28]. It is uncommon for clonal effects to be non-existent for such poplar clones, and even more uncommon for clonal responses to their environments to be negligible [17], although geographically robust clones have been identified [60,61]. Identifying clonal differences is a major component of successful pretreatment of woody biomass (including poplars) for biofuels production [38]. For example, tests of Populus tremuloides Michx. ‘native aspen collection’, Populus deltoides Bartr. ex Marsh × Populus nigra L. ‘NE222′ and ‘DN5′ (which both belong to the same genomic group as ‘DN34′ in the current study), and ‘NM6′ (as in the current study) identified stark contrasts among the genotypes for bioconversion potential [41]. In particular, following dilute acid (DA) pretreatment, the native aspen exhibited 29% greater total monomeric sugar yield and 143% greater ethanol yield than ‘NM6′, while sulfite pretreatment for overcoming recalcitrance of lignocelluloses (SPORL) pretreatment produced 12% and 82% greater sugar and ethanol yield for native aspen versus ‘NM6′, respectively. For both pretreatments, bioconversion potentials of ‘NE222′ and ‘DN5′ were between that of aspen and ‘NM6′ [41].
However, the results of the current study are unique, in that they elicited differences in site conditions (rather than genotypes) between the Rhinelander landfill trees and Escanaba biomass trees. Overall, climate conditions between the two sites were very similar throughout their respective rotations (Table 5), with the average growing season temperature differing by 0.3 °C and neither site experiencing extended periods of severe or extreme drought. However, water availability may have been a key growth-regulating factor contributing to recalcitrance between sites [52,55]. In particular, the maximum available soil water for the top 100 cm at Escanaba was nearly double that of Rhinelander (i.e., 15.01 versus 7.43 cm, respectively) (data from [62]), despite minimal differences in mean annual precipitation (i.e., 511 versus 571 mm, respectively) (Table 5). According to Monclus et al. [55], the selection of drought tolerant poplar genotypes may support movement of genetic material from moist sites to drier sites with less available water. Our assertion is that both ‘DN34′ and ‘NM6′ may be relatively drought tolerant (compared among the hundreds of genotypes tested in the North Central United States) and, therefore, clonal differences were negligible despite site-related variability in water availability. In addition, soil texture was similar (Rhinelander: sandy loam; Escanaba: fine sandy loam), yet the soil pH varied greatly, with Rhinelander being very strongly acidic (pH = 4.8) and Escanaba slightly alkaline (pH = 7.5). Despite this difference in edaphic conditions, ideal pH for poplars ranges from 5.0 to 7.5 [63], which indicates that Rhinelander and Escanaba are on opposite ends of the spectrum, yet still within its general limits. Typically, soils closer to pH of 4.0 have caused impacts to establishment and subsequent biomass production [64]. Variability in chemical soil properties may also have influenced recalcitrance levels between the clones, but chemical analytical testing of Escanaba soils (along with phytoaccumulation and phytoextraction) was beyond the scope of the current study. Such testing is warranted for future investigations.
Table 5.
Site- and climate-related characteristics of the former Rhinelander City Landfill in Rhinelander, WI, USA, and the Michigan State University, Forest Biomass Innovation Center (FBIC) in Escanaba, MI, USA, where ecosystem services, physiology, and biofuels recalcitrance of poplars grown for landfill phytoremediation were compared to those grown for biomass.
Overall, from the standpoint of wood chemical composition, Rhinelander phytoremediation trees had a higher lignin content and lower cellulose content than their Escanaba biomass counterparts (Figure 5). Increased lignification has been associated with drought-stress resistance, and examples of increased lignin synthesis were found for almost all abiotic stresses [65]. For example, responses for seedlings of white elm (Ulmus laevis Pall.) that were subjected to arsenic (As) contamination underpinned that some forms of pollution caused increased lignin content [66]. Specifically, Waliszewska et al. [66] reported a 10% increase in lignin above and beyond the 23.75% lignin content in reference material. Similarly, for the genus Populus, increased lignin deposition was observed in cuttings of Populus tremula L. × P. tremuloides hybrids that were exposed for 14 days to a chilling temperature of 10 °C. Lignin content started to increase within two days of treatment and continued until the end of chilling exposure [67].
The lignin content of individual trees ranged from 25.6 to 32.3% in the current study, which corroborated previous results [68,69,70]. In a review of compositional traits of poplars used as biofuels feedstocks, Sannigrahi et al. [69] reported a range in wood lignin content across poplar species and hybrids of 21.5 to 27.2%, while Klašjna et al. [68] tested four-year-old trees of 40 eastern cottonwood (Populus deltoides) clones and reported 19.8 to 24.8% wood lignin content, with a mean of 22.2%. When discussing phytoremediation potential of bioenergy plants, the impact on lignin content is not a major focus [71]. However, it has been shown that genotypes and species with high lignin content exhibited properties that were appropriate for thermochemical conversion to biofuels, while those with low lignin content were more suitable for biochemical conversion [71]. The lignin contents of extractive-free poplar wood samples that were determined by the acetyl bromide method ranged from 23.4 to 32.1%, with associated calorific values measured with a combustion calorimeter ranging from 17,260 to 19,767 J g−1, revealing that intraspecific variations in lignin and energy contents were independent of one another and that lignin content was a poor predictor of energy content [70].
Biofuels recalcitrance results of the current study are in agreement with previous studies [41,72]. Work has been conducted for testing biofuels yields from ‘NE222′ grown for biomass production while using SPORL pretreatment [39] and acid hydrotropic fractionation [40,73] to evaluate substrate enzymatic digestibility (SED), sugar yield, production of furfural, and other related traits. The lower lignin content in the Escanaba biomass trees may have resulted from differences in the presence of tension wood, given that tension wood contains higher glucan content and undergoes higher enzymatic conversion to fermentable sugars [74]. In the current study, under the same pretreatment conditions, Escanaba trees had much better SED (i.e., were less recalcitrant) than Rhinelander trees (Figure 6), indicating some site-related factors in their biofuel potential (see above).
For enzymatic cellulose saccharification, the variation in cellulase loading was minimal, with most samples being dosed at approximately 10 FPU g−1 of substrate glucan for all pretreated water insoluble solids (WISs); this was due to the hydrolysis experiments being carried out before wood carbohydrate data were available, and instead using a target of 64% substrate glucan from previous poplar research [39,41]. The elevated cellulose content of the Escanaba trees, as well as their pretreated WISs, resulted in lower CTec3 loading (per g glucan base) than the loadings for Rhinelander trees. Similarly, despite their aforementioned lower cellulase loadings, the higher SED of Escanaba trees can be attributed to their lower lignin content that facilitated more efficient pretreatment, which resulted in greater hemicellulose (xylan) dissolution and greater digestible substrates. It has been recognized that xylan dissolution is critically important to improve SED [75]. In the current study, the amount of xylan retained in WISs increased with increasing lignin content, resulting in a decrease of SED as lignin increased (Figure 7). Furthermore, the evaluation of the mass balance of xylan recovery showed that a substantial amount of xylan remained in pretreated WISs (Figure 8), especially those from Rhinelander trees that had high lignin content. These results corroborated those of Zhang et al. [39]. In particular, a substantial amount of dissolved xylan was hydrolyzed into xylose, dehydration of the dissolved xylan to furfural was minimal, and the residual xylan was mostly comprised of xylo-oligomers that were not analyzed [39]. Overall, the results from the current study showed more xylan dissolution and more xylose from Escanaba trees than Rhinelander trees given the higher lignin content of the Rhinelander trees that protected them from xylan dissolution. Evaluation of the mass balance of cellulose recovery showed that amounts of cellulose (i.e., glucan) retained after SPORL pretreatment on washed WISs were approximately 75% or higher, while the amount of dissolved glucan as glucose was less than 6% in spent liquor (Figure 9). The balances were oligomeric glucose in the spent liquor. The evaluation of total glucose recoveries from dissolved glucose in spent liquors and enzymatic hydrolysis glucose yields (EHGY) showed that Escanaba biomass trees had an average total glucose yield of approximately 65% of the wood cellulose. In contrast, Rhinelander phytoremediation trees had a total glucose yield of approximately 35%, due to lower enzymatic cellulose conversion.
During cellulosic hydrolysis, both hemicellulose and lignin restrain sugar release, yet there have been positive impacts while using pretreatments to partly remove them [76], such as SPORL tested in the current study [39,41]. Among the Salicaceae family, willow (Salix spp.) species and hybrids have been extensively studied for biofuels, bioenergy, and bioproducts [77]. Ray et al. [78] tested numerous willow genotypes and noted that wood lignin content was not correlated with the accessibility of glucan to enzymatic saccharification. They stated that minimal evidence exists to support assumptions that high glucan and low lignin contents are preferred qualities for all biofuel feedstocks [78]. Their findings showed that high lignin content of untreated biomass is not necessarily detrimental to final glucose yields and, therefore, selecting for genotypes with high lignin content may be beneficial, given the possible energy rewards of residue combustion [78], which may be a potential end use of phytoremedation-grown trees.
In addition, when considering poplar biomass as a feedstock for biofuels, elemental composition, as well as carbohydrate and lignin content and composition, are all relevant traits [69]. Lignin is mostly comprised of syringyl units, rendering it more labile to chemical pretreatments used for biomass to biofuels conversion. Bose et al. [79] used an optimized nitrobenzene oxidation method to determine the S/G ratios of 13 poplar samples from two different sites and obtained S/G ratios that range from 1.0 to 1.7. Further, they reported an inverse linear relationship (R2 = 0.85) between decreasing lignin content and increasing S/G ratios [79]. Davison et al. [80] studied the effects of varying S/G ratios and lignin content of poplars on xylose release during dilute acid hydrolysis. They tested poplar clones with natural S/G variation (from 1.8 to 2.3) and differences in lignin content (22.7 to 25.8%) and reported that small decreases in the S/G ratio resulted in significant increases in xylose release after dilute sulphuric acid hydrolysis [80]. Studer et al. [72] tested undomesticated Populus trichocarpa trees and showed a strong negative correlation between sugar release and lignin content only for pretreated samples with an S/G ratio < 2.0. For S/G ratios > 2.0, sugar release was generally higher, and the negative influence of lignin was less pronounced. When examined independently, only glucose release was correlated with lignin content and S/G ratio in this manner, whereas xylose release depended on the S/G ratio alone [72]. Although clones were not significantly different in the current study, these previous results warrant future testing of a greater number of unrelated genotypes in phytoremediation versus biomass applications for biofuels conversion and related traits. Studying parameters that are related to ecosystem services, physiology, and biofuels recalcitrance are complementary for clonal selection and they could increase phytoremediation effectiveness at landfills and similar phytotechnology sites.
4. Materials and Methods
4.1. Clone and Site Selection
Two hybrid poplar clones that belong to different genomic groups were tested: Populus deltoides Bartr. ex Marsh × P. nigra L. ‘DN34′ and P. nigra × P. maximowiczii A. Henry ‘NM6′. These genotypes are the most widely-planted of all commercial and experimental clones in the region [17,18] and, therefore, were readily available for phytotechnologies when the sites of the current study were established.
The former Rhinelander City Landfill in Rhinelander, WI, USA (45.6° N, 89.4° W) was the phytoremediation study site [27], while the Forest Biomass Innovation Center (FBIC) of Michigan State University in Escanaba, MI (45.8° N, 87.2° W) was the biomass production study site [62]. Table 5 illustrates site- and climate-related information, including latitude/longitude, county, year planted, stocking, and tree age, height, and diameter at harvest. In addition, climate and drought data were averaged monthly across each growing season (April to October) and summed/averaged to determine annual values for fifteen years at Rhinelander (2001 to 2015, when the trees were three to 17 years old) and seven years at Escanaba (2003 to 2009, when the trees were three to nine years old). The National Oceanic and Atmospheric Administration (NOAA) National Climate Data Center (NCDC, https://www.ncdc.noaa.gov/cdo-web/) was accessed to obtain precipitation (P, mm), and average (Tavg, °C), maximum (Tmax, °C), and minimum (Tmin, °C) air temperatures from Rhinelander (USW00004803) and Escanaba (USC00201802) weather stations. The difference between maximum and minimum temperatures (i.e., Tdiff = Tmax − Tmin, °C) was calculated for each site. The United States Drought Monitor (https://droughtmonitor.unl.edu/) was accessed in order to obtain drought index scores according to percent area within each county (i.e., Oneida, Wisconsin; Delta, Michigan) belonging to the following drought index categories: D0 (abnormally dry), D1 (moderate drought), D2 (severe drought), and D3 (extreme drought).
Given the phytoremediation objectives at Rhinelander, the physical and chemical soil properties for the landfill were tested and they are reported in Table 6. Phytoremediation was not studied at Escanaba and, therefore, the soil properties were not tested for the biomass planting. At the Rhinelander landfill, a 30- to 60-cm cap that consists of gravelly, mixed soil was installed in the late 1980s. In 1999, the trees were planted directly into this cap [27]. For the current study, one soil sample was collected 0.5 m from the base of each experimental tree (i.e., eight trees per clone, sixteen trees total) in the north cardinal direction (i.e., 0° N) while using a stainless steel soil core sampler (AMS Inc., American Falls, ID, USA) with a plastic liner measuring 3.8 cm diameter × 30 cm length (i.e., soils were sampled to a depth of 30 cm). The soil samples were brought back to the USDA Forest Service, Northern Research Station (USFS NRS) in Rhinelander and stored at 5 °C until processing, which consisted of carefully extracting soil from the liners at lengths (i.e., depths) of 0 to 10 cm and 10 to 30 cm. The soils were air-dried and separated into two portions, by depth. Samples of the first portion were sent to Waypoint Analytical (Memphis, TN, USA) for soil texture determination. According to the methods of Zalesny et al. [81], soils of the second portion were sieved in order to pass through a 2-mm mesh screen and then analyzed at the USFS NRS in Rhinelander for pH, chloride (Cl−), total nitrogen (N), total carbon (C), aluminum (Al), cadmium (Cd), calcium (Ca), cobalt (Co), chromium (Cr), copper (Cu), iron (Fe), potassium (K), magnesium (Mg), manganese (Mn), sodium (Na), nickel (Ni), lead (Pb), and zinc (Zn), as well as being sent to Northern Lake Service (Crandon, WI, USA) for analysis of phosphorus (P) (Table 6).
Table 6.
Physical and chemical soil properties of the former Rhinelander City Landfill in Rhinelander, WI, USA, where ecosystem services, physiology, and biofuels recalcitrance of poplars grown for landfill phytoremediation were tested.
A Fisher Scientific AccumetTM XL-50 m (Thermo Fisher Scientific, Carlsbad, CA, USA) was used to measure pH and Cl−. Specifically, pH was measured while using a FisherbrandTM AccuCapTM capillary junction pH electrode (Thermo Fisher Scientific, Carlsbad, CA, USA). The meter was calibrated using buffer standards that were prepared from Fisher Buffer Salt of pH 4.01 and 7.41 (Thermo Fisher Scientific, Carlsbad, CA, USA). Chloride was measured using a FisherbrandTM AccumetTM solid-state half-cell Cl−-specific electrode using standards prepared from a 1000 mg Cl− L−1 standard (Ricca Chemical, Arlington, TX, USA).
The soil concentrations of total N and total C were analyzed using a Flash EA1112 N-C analyzer (Thermo Electron, via CE Elantech, Inc., Lakewood, NJ, USA) with a model MAS 200 autosampler, while Al, Cd, Ca, Co, Cr, Cu, Fe, K, Mg, Mn, Na, Ni, Pb, and Zn were measured using an Agilent AA240FS fast sequential atomic absorption spectrometer (using Mehlich-3 extracting solution) (Agilent Technologies, Santa Clara, CA, USA). Phosphorus was determined while using an axial aligned Varian 720-ES ICP Optical Emission Spectrometer with a CCD detector (Varian Inc., Palo Alto, CA, USA).
4.2. Field Sampling
At Rhinelander, the diameter at breast height (i.e., DBH at 1.37 m) was measured to the nearest 0.1 cm, DBH was marked on eight randomly-selected trees per clone, and the sixteen study trees were felled. On the ground, the total tree height was measured to the nearest 0.1 m, and aboveground fresh biomass of leaves, boles, and branches was determined to the nearest 0.1 kg. Branch subsamples were collected for each tree and weighed to the nearest 0.1 kg for fresh biomass determination. At DBH, cross-sectional disks were harvested and weighed to the nearest 0.1 g for fresh mass determination. A 61-cm length of bole wood was extracted from directly above the DBH disk and chipped. Branch subsamples, disks, and chips were transported to the analytical laboratory at the USFS NRS in Rhinelander and then oven-dried at 55 °C until constant mass at a precision of 0.1 kg. Moisture content of bole and branch wood was calculated, and aboveground dry biomass per tree was determined to the nearest 0.1 kg. The mean annual increment (MAI) of harvest biomass (BIOMASSMAI) was calculated by dividing aboveground dry biomass [both leafless (boles + branches) and total biomass (leaves + boles + branches)] by harvest age (i.e., 17 years). After the dry biomass determinations were completed, a subsample of chips was ground and sent to the USFS Forest Products Laboratory (USFS FPL) in Madison, Wisconsin, for biofuels recalcitrance testing, which is described below. The leaves were ground, and all leaf and wood ground samples were analyzed in order to determine leaf, bole, and branch concentrations of total N, total C, Al, Cd, Ca, Cl (just leaves), Co, Cr, Cu, Fe, K, Mg, Mn, Na, Ni, P, Pb, and Zn, with methods being the same as for soil analyses.
At Escanaba, four trees per clone were harvested nine years after planting for a companion study [62] while using the same procedure as for the Rhinelander phytoremediation trees. An additional 11 and 15 trees of ‘DN34′ and ‘NM6′, respectively, were harvested for on-site FBIC needs. As with Rhinelander trees, a 61-cm length of bole wood was extracted above DBH and then chipped for all 34 trees. A subsample of wood chips from each Headlee et al. [62] tree was collected, as well as a bulked subsample of wood chips, by clone, from the FBIC trees. The ten wood chip subsamples from the Escanaba biomass trees were sent to the USFS FPL for biofuels recalcitrance testing.
4.3. Ring Width Measurements and Laboratory Sampling
One cross-sectional area of each Rhinelander DBH disk was sanded, wetted, and imaged for companion studies. The sanded disks were cut in half along a plane extending through the pith, and the cut face of each half-disk was sanded. One half-disk was used for specific gravity determination while using the same methods as Headlee et al. [62]. From the remaining half-disk, a wafer that was free of bark and defects was harvested. From each wafer, a Wild E5-86550 Stereomicroscope with 10× power eyepieces and a 6× power setting of the objective (Wild Company, Heerbrugg, Switzerland) was used in order to define and measure annual ring width measurements and total growth ring measurements [i.e., inside bark diameter (DIB)] to the nearest 0.1 cm. Following ring measurements, wood samples that ranged from 2 to 10 mg dry mass were extracted from each annual ring for the total N and total C analyses described above, and another set with samples ranging from 1 to 2 mg dry mass were extracted from each annual ring for carbon isotope (δ13C) analyses.
4.4. Total Carbon and Wood Composition
Total carbon of annual rings was determined while using a Flash EA1112 N-C analyzer (Thermo Electron, via CE Elantech, Inc., Lakewood, NJ, USA) with a model MAS 200 autosampler. The carbon concentrations were combined with BIOMASSMAI values to generate CARBONMAI estimates at harvest (both leafless (boles + branches) and total (leaves + boles + branches)).
Ground wood samples were combined by plantation stage (i.e., 0 to 4, 5 to 13, and 14 to 17 years) for each Rhinelander tree. In order to determine hemicellulose, cellulose, and lignin composition, neutral detergent fiber (NDF), acid detergent fiber (ADF), and acid detergent lignin (ADL) were measured with an ANKOM 200 Fiber Analyzer (ANKOM Technology, Macedon, NY, USA), according to methods that were outlined by ANKOM [82]. Hemicellulose content was calculated by subtracting ADF from NDF (i.e., NDF-ADF), cellulose by subtracting ADL from ADF (i.e., ADF-ADL), and lignin as ADL (plus ash). A modification to ANKOM’s protocol was used, drying samples at each stage for 16 h rather than the standard 2 to 4 h. As a result of this extended drying time (and the potential for an increase of pore size and loss of lignin from the ANKOM F57 filter bags), the cellulose values were greater than expected and lignin values less than expected for poplars [69]. We developed and applied a correction factor to the cellulose and lignin data generated from the ANKOM analyses based on the values that were obtained from the USFS FPL during biofuels recalcitrance testing for these identical trees. These corrected data were used in all analyses.
4.5. Carbon Isotope (δ13C) Analyses and Discrimination (Δ) Calculations
A FinniganTM MAT DELTAplusXL Mass Spectrometer (Thermo Fisher Scientific, Waltham, MA, USA) was operated in continuous flow mode and connected to a Costech 4010 Elemental Combustion System Elemental Analyzer (Costech Analytical Technologies, Inc., Valencia, CA, USA) to measure stable carbon isotope (δ13C) values. Caffeine (IAEA-600), cellulose (IAEA-CH-3), and Acetanilide (laboratory standard) reference standards were analyzed every ten samples for isotopic corrections and assigning the data to the appropriate isotopic scale. The data were corrected while using regression analyses, with combined uncertainty (analytical uncertainty and average correction factor) for δ13C of ± 0.03 to 0.15‰ (VPDB).
Carbon isotope discrimination (Δ) was calculated according to Farquhar et al. [30]:
where δa equals the isotopic composition of air that is assumed to be −8 ‰, and δp equals the isotopic composition (δ13C) of the wood sample analyzed. These Δ values were used in all analyses.
4.6. Annual Biomass Estimates
The following model from Bond–Lamberty et al. [83] was applied in order to calculate annual outside bark diameter (DOB) based on DIB from the Rhinelander trees:
DOB = DIB1.27
Genotype-specific biomass equations from Headlee and Zalesny [84] were used to calculate individual-tree biomass:
BIOMASSDN34 = 10−1.27 × DOB2.55
BIOMASSNM6 = 10−0.63 × DOB2.00
Individual-tree biomass estimates were multiplied by the stocking of 834 trees ha−1 in order to obtain stand-level biomass estimates, which were then divided by tree age to generate BIOMASSMAI values for three to 17 years of tree growth. Annual RELATIVEMAI values were determined based on the ratio of current-year BIOMASSMAI to maximum BIOMASSMAI for each of the 15 years of the study (i.e., for three- to 17-year-old trees).
4.7. Sulfite Pretreatment to Overcome Recalcitrance of Lignocelluloses (SPORL) Pretreatment
Rhinelander phytoremediation samples were received in ground form while the Escanaba biomass samples were received in chip form. Individual samples were oven dried on aluminum foil for a minimum of 12 h at 105 °C to determine the solids content for calculating chemical loading in the SPORL pretreatment. These oven-dried samples were then Wiley-milled (Thomas Scientific, Swedesboro, NJ, USA) to 30 mesh for compositional analyses. For comparison purposes between the particle sizes, one Escanaba sample (i.e., ES-09) was ground by placing 30 g into a 2-L Waring blender (Conair Corporation, Torrington, CT, USA) and running on high for one minute. This was repeated five times to accumulate enough material for pretreatment.
The SPORL pretreatment method was conducted for all of the samples using a dilute sulfite liquor and 100 g wood dry mass. The fresh sulfite liquor had a pH of 2.44. Chemical loadings on percent wood dry mass were 3% sodium bisulfite and 1.1% sulfuric acid (both ACS reagent grade; Sigma–Aldrich, St. Louis, MO, USA). The pretreatments were conducted using a liquor to wood ratio of 3:1 (v:w) in 1-L sealed cylindrical reactors, as described previously [39]. After loading, the reactors were mounted into a 21-L rotating wood pulping digester (1 rpm) that was heated by direct steam injection. The digester holds three reactors at a time. This tumbling was conducted for five minutes prior to the addition of steam in order to provide some mixing prior to the start of the reaction. After five minutes, the steam was injected into the interior of the digester with continuous removal of the condensate. In all runs, it took four minutes to reach the target temperature of 160 °C (note: this was the digester internal temperature and it was assumed that the reactors were in equilibrium). The digester was then held for 35 min. at 160 °C via manual valve control. At the end of the reaction time, the digester was relieved of pressure and quickly opened, after which the reactors were removed and cooled in a bucket of cold tap water. The elapsed time from the end of the reaction to cooled reactors was 14 min.
There were 33 samples in total, including the replicates, so a total of eleven digester runs were conducted over six different days. In order to account for potential time variations over the several days during which the reactions were conducted, each digester run included two Rhinelander phytoremediation samples and one Escanaba biomass sample.
After the reactors were cooled, they were opened and their contents poured into pre-weighed 1-L polyethylene bottles. An additional 150 g of DI water was used for each sample to thoroughly rinse the reactor and was combined with the contents in each bottle. The bottles were then weighed as a check of total mass recovery efficiency, which ranged from 96.5 to 98.9%.
Next, the solids and free liquid were separated using a 300 mesh nylon cloth. The free liquid (i.e., spent liquor) was transferred into a pre-weighed polyethylene bottle while the solids remained with the original bottle. Mass was recorded for each stream. An aliquot of solids and spent liquor was collected for total and dissolved solids measurements, respectively, along with pH and high performance liquid chromatography (HPLC) analysis of dissolved constituents while using an UltiMate 3000 HPLC System (Thermo Fisher Scientific, Carlsbad, CA, USA). The recovered solids were refined in an atmospheric refiner with D2B-505 plates at a gap of 0.25 mm while using 30 L of dilution water as washing. The resulting slurry was then dewatered in a canvas bag and vacuum pressed to a water insoluble solids (WIS) level of 20 to 30%. The dewatered solids were measured for solids content and subsamples were dried and ground with a Wiley mill (Thomas Scientific, Swedesboro, NJ, USA) for compositional analysis.
4.8. Enzymatic Hydrolysis
The refined WIS samples were enzymatically hydrolyzed on a shaker incubator at 50 °C. The solids loading was 2% in a 5.5-pH sodium acetate buffer (ACS reagent grade; Sigma–Aldrich, St. Louis, MO, USA). A commercial complex cellulase Cellic®CTec3 (i.e., CTec3) was complimentarily provided by Novozymes North America (Franklinton, NC, USA). CTec3 cellulase application was estimated at 10 FPU g−1 glucan. The actual cellulase loading per g glucan was calculated for each sample after subsequent carbohydrate analyses of the solids were completed.
A 2-g dry mass aliquot of each pretreated wood sample, based on the measured solids level, was added to a 125 mL Erlenmeyer flask. An appropriate volume of sodium acetate buffer was added to the flask after deduction for the volume of the 10:1 diluted CTec3 (217 FU mL−1) of 21.7 FPU mL−1 and water contained in the sample (ACS reagent grade; Sigma–Aldrich, St. Louis, MO, USA). The pH of the slurry was adjusted to 5.5 with calcium oxide powder. After the pH adjustment, 0.59 mL of 10:1 diluted CTec3 was added to each flask, which was covered with foil and placed on the shaker incubator. Approximately 1 mL samples were taken at 1, 2, 4, 6, 24, 48, and 72 h while using a pipette and placed into a 1.5 mL snap-top plastic vials.
The hydrolysis samples were centrifuged for three minutes in a small centrifuge to settle any insoluble solids. The samples were then measured using a YSI 2700 Biochemistry Analyzer (YSI Life Sciences, Yellow Springs, OH, USA). Replicate enzymatic hydrolyses were conducted on four Rhinelander samples and three Escanaba samples.
4.9. Chemical Composition Analyses
The washed WIS along with untreated poplar wood samples were Wiley-milled to 30 mesh for chemical composition analysis at the Analytical Chemistry and Microscopy Laboratory of the USFS FPL. The traditional two-step sulfuric acid analysis was first applied to the samples in order to solubilize carbohydrates. Hydrolysates were analyzed by high performance anion exchange chromatography with pulsed amperometric detection using a DionexTM ICS-5000 Capillary HPICTM System (Dionex Corporation, Sunnyvale, CA, USA), as described previously [85]. Klason lignin (acid insoluble) was quantified gravimetrically [86]. The spent liquors were analyzed by HPLC using an UltiMate 3000 HPLC System (Thermo Fisher Scientific, Carlsbad, CA, USA) for glucose, xylose, galactose, arabinose, mannose, formic acid, acetic acid, levulinic acid, hydroxymethylfurfural (HMF), and furfural, as described previously [87].
4.10. Experimental Design and Data Analysis
Height, diameter, BIOMASSMAI, CARBONMAI, specific gravity, bole and branch moisture, total N, total C, and all elemental concentration (Al, Cd, Ca, Cl, Co, Cr, Cu, Fe, K, Mg, Mn, Na, Ni, P, Pb, Zn) data were subjected to analyses of variance (ANOVA) and analyses of means (ANOM) while using SAS® (PROC GLM; PROC ANOM; SAS INSTITUTE, INC., Cary, NC, USA) assuming a one-factor design comparing clones (i.e., ‘DN34′ versus ‘NM6′). In addition, ANOVA and ANOM analyses in SAS® were used to test for differences using three separate two-way factorial designs: 1) two clones, fifteen tree ages (i.e., years 3 to 17), and their interactions for total C, Δ, BIOMASSMAI, and RELATIVEMAI; 2) two clones, three plantation stages (i.e., 0 to 4, 5 to 13, and 14 to 17 years), and their interactions for hemicellulose, cellulose, and lignin content; and, 3) two sites (i.e., Rhinelander, Escanaba), two clones, and their interactions for mannan, xylan, glucan, lignin, substrate enzymatic digestibility (SED), CTec3 loading, furfural, xylose, and glucose in spent liquor, xylan in water insoluble solids (WIS), and enzymatic hydrolysis glucose yield (EHGY). Fisher’s protected least significant difference (LSD) was used to identify significant differences among means at p < 0.05.
Regression analyses were conducted in SAS® (PROC REG SAS INSTITUTE, INC., Cary, NC, USA) in order to develop predictive response curves for interactions between RELATIVEMAI and tree age for both clones, as well as separate curves between SED and wood lignin content, and SED and xylan dissolution. The best-fit models were selected based on the highest coefficients of determination (i.e., R2).
Author Contributions
Conceptualization, E.O.B., B.A.B., R.G., W.L.H., A.H.W., J.Y.Z., R.S.Z.J.; methodology, E.O.B., B.A.B., R.G., W.L.H., A.H.W., J.Y.Z., R.S.Z.J.; validation, B.A.B., R.G., W.L.H., J.Y.Z., R.S.Z.J.; formal analysis, B.A.B., R.G., J.Y.Z., R.S.Z.J.; investigation, E.O.B., B.A.B., R.G., W.L.H., A.H.W., J.Y.Z., R.S.Z.J.; resources, B.A.B., R.G., A.H.W., J.Y.Z., R.S.Z.J.; data curation, B.A.B., R.G., J.Y.Z., R.S.Z.J.; writing—original draft preparation, R.G., A.P., J.V.A., J.Y.Z., R.S.Z.J.; writing—review and editing, E.O.B., B.A.B., R.G., W.L.H., A.P., J.V.A., A.H.W., J.Y.Z., R.S.Z.J.; visualization, J.Y.Z., R.S.Z.J.; supervision, J.Y.Z., R.S.Z.J.; project administration, J.Y.Z., R.S.Z.J. All authors have read and agreed to the published version of the manuscript.
Funding
This research received no external funding.
Acknowledgments
We are grateful to Raymond Miller and Bradford Bender of Michigan State University for access to and harvest of the Escanaba biomass trees. Also, we thank Amanda Foust, Ben Klosiewski, and John Schutts for field assistance; Elizabeth Rogers and anonymous journal reviewers for reviewing earlier versions of this manuscript.
Conflicts of Interest
The authors declare no conflict of interest.
References
- Carle, J. Trends & Perspectives in Poplar & Willow Cultivation: Global Synthesis. In Proceedings of the 25th Session of the FAO International Poplar Commission, Berlin, Germany, 12–16 September 2016. Available online: http://ipc25berlin2016.com/fileadmin/allgemein/pdf/veranstaltungen/IPC25_2016/Plenary_4/Carle_JB_Global_Synthesis_Keynote_Plenary_16_Sept_2016.pdf (accessed on 6 March 2020).
- Isebrands, J.G.; Aronsson, P.; Carlson, M.; Ceulemans, R.; Coleman, M.; Dickinson, N.; Dimitriou, J.; Doty, S.; Gardiner, E.; Heinsoo, K.; et al. Environmental applications of poplars and willows. In Poplars and Willows: Trees for Society and the Environment; Isebrands, J.G., Richardson, J., Eds.; Food and Agriculture Organization (FAO) of the United Nations: Rome, Italy; CAB International, Inc.: Boston, MA, USA, 2014; Chapter 6; pp. 258–336. ISBN 978-1-78064-108-9. [Google Scholar]
- Vance, E.D.; Maguire, D.A.; Zalesny, R.S., Jr. Research strategies for increasing productivity of intensively managed forest plantations. J. For. 2010, 108, 183–192. [Google Scholar] [CrossRef]
- Pilipović, A.; Orlović, S.; Rončević, S.; Nikolić, N.; Župunski, M.; Spasojević, J. Results of selection of poplars and willows for water and sediment phytoremediation. Agric. For. 2015, 61, 205–211. [Google Scholar] [CrossRef]
- Licht, L.A.; Isebrands, J.G. Linking phytoremediated pollutant removal to biomass economic opportunities. Biomass Bioenergy 2005, 28, 203–218. [Google Scholar] [CrossRef]
- Pilipović, A.; Zalesny, R.S., Jr.; Orlović, S.; Drekić, M.; Pekeć, S.; Katanić, M.; Poljaković-Pajnik, L. Growth and physiological responses of three poplar clones grown on soils artificially contaminated with heavy metals, diesel fuel, and herbicides. Int. J. Phytoremed. 2020, 22, 436–450. [Google Scholar] [CrossRef] [PubMed]
- Zalesny, R.S., Jr.; Headlee, W.L.; Gopalakrishnan, G.; Bauer, E.O.; Hall, R.B.; Hazel, D.W.; Isebrands, J.G.; Licht, L.A.; Negri, M.C.; Guthrie-Nichols, E.; et al. Ecosystem services of poplar at long-term phytoremediation sites in the Midwest and Southeast, United States. WIREs Energy Environ. 2019, e349. [Google Scholar] [CrossRef]
- Baldantoni, D.; Cicatelli, A.; Bellino, A.; Castiglione, S. Different behaviours in phytoremediation capacity of two heavy metal tolerant poplar clones in relation to iron and other trace elements. J. Environ. Manag. 2014, 146, 94–99. [Google Scholar] [CrossRef]
- Laureysens, I.; Blust, R.; De Temmerman, L.; Lemmens, C.; Ceulemans, R. Clonal variation in heavy metal accumulation and biomass production in a poplar coppice culture: I. seasonal variation in leaf, wood and bark concentrations. Environ. Pollut. 2004, 131, 485–494. [Google Scholar] [CrossRef]
- Pilipović, A.; Zalesny, R.S., Jr.; Rončević, S.; Nikolić, N.; Orlović, S.; Beljin, J.; Katanić, M. Growth, physiology, and phytoextraction potential of poplar and willow established in soils amended with heavy-metal contaminated, dredged river sediments. J. Environ. Manag. 2019, 239, 352–365. [Google Scholar] [CrossRef]
- Burken, J.G.; Schnoor, J.L. Distribution and volatilization of organic compounds following uptake by hybrid poplar trees. Int. J. Phytoremed. 1999, 1, 139–151. [Google Scholar] [CrossRef]
- Cook, R.L.; Landmeyer, J.E.; Atkinson, B.; Messier, J.-P.; Guthrie Nichols, E. Successful establishment of a phytoremediation system at a petroleum hydrocarbon contaminated shallow aquifer: Trends, trials, and tribulations. Int. J. Phytoremed. 2010, 12, 716–732. [Google Scholar] [CrossRef]
- Doty, S.L.; Freeman, J.L.; Cohu, C.M.; Burken, J.G.; Firrincieli, A.; Simon, A.; Khan, Z.; Isebrands, J.G.; Lukas, J.; Blaylock, M.J. Enhanced degradation of TCE on a superfund site using endophyte-assisted poplar tree phytoremediation. Environ. Sci. Technol. 2017, 51, 10050–10058. [Google Scholar] [CrossRef]
- Abichou, T.; Musagasa, J.; Yuan, L.; Chanton, J.; Tawfiq, K.; Rockwood, D.; Licht, L. Field performance of alternative landfill covers vegetated with cottonwood and eucalyptus trees. Int. J. Phytoremed. 2012, 14 (Suppl. 1), 47–60. [Google Scholar] [CrossRef]
- Zalesny, J.A.; Zalesny, R.S., Jr.; Wiese, A.H.; Hall, R.B. Choosing tree genotypes for phytoremediation of landfill leachate using phyto-recurrent selection. Int. J. Phytoremed. 2007, 9, 513–530. [Google Scholar] [CrossRef] [PubMed]
- Zupančič-Justin, M.; Pajk, N.; Zupanc, V.; Zupančič, M. Phytoremediation of landfill leachate and compost wastewater by irrigation of Populus and Salix: Biomass and growth response. Waste Manag. 2010, 30, 1032–1042. [Google Scholar] [CrossRef] [PubMed]
- Riemenschneider, D.E.; Berguson, W.E.; Dickmann, D.I.; Hall, R.B.; Isebrands, J.G.; Mohn, C.A.; Stanosz, G.R.; Tuskan, G.A. Poplar breeding and testing strategies in the north-central U.S.: Demonstration of potential yield and consideration of future research needs. For. Chron. 2001, 77, 245–253. [Google Scholar] [CrossRef]
- Zalesny, R.S., Jr.; Hall, R.B.; Zalesny, J.A.; Berguson, W.E.; McMahon, B.G.; Stanosz, G.R. Biomass and genotype × environment interactions of Populus energy crops in the Midwestern United States. BioEnergy Res. 2009, 2, 106–122. [Google Scholar] [CrossRef]
- Millennium Ecosystem Assessment (MEA). Ecosystems and Human Well-Being: Synthesis; Island Press: Washington, DC, USA, 2005; Available online: https://www.millenniumassessment.org/documents/document.356.aspx.pdf (accessed on 1 September 2020).
- Zalesny, R.S., Jr.; Stanturf, J.A.; Gardiner, E.S.; Perdue, J.H.; Young, T.M.; Coyle, D.R.; Headlee, W.L.; Bañuelos, G.S.; Hass, A. Ecosystem services of woody crop production systems. BioEnergy Res. 2016, 9, 465–491. [Google Scholar] [CrossRef]
- Burges, A.; Alkorta, I.; Epelde, L.; Garbisu, C. From phytoremediation of soil contaminants to phytomanagement of ecosystem services in metal contaminated sites. Int. J. Phytoremed. 2018, 20, 384–397. [Google Scholar] [CrossRef]
- Isebrands, J.G.; Richardson, J. Poplars and Willows: Trees for Society and the Environment; Food and Agriculture Organization (FAO) of the United Nations: Rome, Italy; CAB International, Inc.: Boston, MA, USA, 2014; ISBN 978-1-78064-108-9. [Google Scholar]
- Zalesny, R.S., Jr.; Headlee, W.L. Developing woody crops for the enhancement of ecosystem services under changing climates in the North Central United States. J. For. Exp. Sci. 2015, 31, 78–90. [Google Scholar] [CrossRef]
- Zalesny, R.S., Jr.; Bauer, E.O. Selecting and utilizing Populus and Salix for landfill covers: Implications for leachate irrigation. Int. J. Phytoremed. 2007, 9, 497–511. [Google Scholar] [CrossRef]
- Allen, S.; Hall, R.; Rosier, P. Transpiration by two poplar varieties grown as coppice for biomass production. Tree Physiol. 1999, 19, 493–501. [Google Scholar] [CrossRef] [PubMed]
- Vose, J.; Swank, W.; Harvey, G.; Clinton, B.; Sobek, C. Leaf water relations and sapflow in eastern cottonwood (Populus deltoides Bartr.) trees planted for phytoremediation of a groundwater pollutant. Int. J. Phytoremed. 2000, 2, 53–73. [Google Scholar] [CrossRef]
- Zalesny, R.S., Jr.; Wiese, A.H.; Bauer, E.O.; Riemenschneider, D.E. Sapflow of hybrid poplar (Populus nigra L. × P. maximowiczii A. Henry ‘NM6′) during phytoremediation of landfill leachate. Biomass Bioenergy 2006, 30, 784–793. [Google Scholar] [CrossRef]
- Zalesny, R.S., Jr.; Berndes, G.; Dimitriou, I.; Fritsche, U.; Miller, C.; Eisenbies, M.; Ghezehei, S.; Hazel, D.; Headlee, W.L.; Mola-Yudego, B.; et al. Positive water linkages of producing short rotation poplars and willows for bioenergy and phytotechnologies. WIREs Energy Environ. 2019, 8, e345. [Google Scholar] [CrossRef]
- Farquhar, G.D.; Richards, R.A. Isotopic composition of plant carbon correlates with water-use efficiency of wheat genotypes. Austral J. Plant Physiol. 1984, 11, 539–552. [Google Scholar] [CrossRef]
- Farquhar, G.D.; Hubick, K.T.; Condon, A.G.; Richards, R.A. Carbon isotope fractionation and plant water-use efficiency. In Stable Isotopes in Ecological Research; Rundel, P.W., Ehleringer, J.R., Nagy, K.A., Eds.; Springer: New York, NY, USA, 1989; pp. 21–40. [Google Scholar] [CrossRef]
- Radwanski, D.; Gallagher, F.; Vanderlinden, D.W.; Schafer, K.V.R. Photosynthesis and aboveground carbon allocation of two co-occurring poplar species in an urban brownfield. Environ. Pollut. 2017, 223, 497–506. [Google Scholar] [CrossRef]
- Martin, P.J.; Stephens, W. Willow growth in response to nutrients and moisture on a clay landfill cap soil. II: Water use. Biores. Technol. 2006, 97, 449–458. [Google Scholar] [CrossRef][Green Version]
- Schifman, L.A.; Stella, J.C.; Volk, T.A.; Teece, M.A. Carbon isotope variation in shrub willow (Salix spp.) ring-wood as an indicator of long-term water status, growth and survival. Biomass Bioenergy 2012, 36, 316–326. [Google Scholar] [CrossRef]
- Shrive, S.C.; McBride, R.A.; Gillespe, T.J. Physiological and spectral responses of sugar maple (Acer saccharinum Marsh.) to MSW leachate spray irrigation. Waste Manag. Res. 1990, 8, 3–19. [Google Scholar] [CrossRef]
- Clemens, S. Toxic metal accumulation, responses to exposure and mechanisms of tolerance in plants. Biochimie 2006, 88, 1707–1719. [Google Scholar] [CrossRef]
- Bert, V.; Neub, S.; Zdanevitch, I.; Friesl-Hanl, W.; Collet, S.; Gaucher, R.; Puschenreiter, M.; Müller, I.; Kumpiene, J. How to manage plant biomass originated from phytotechnologies? Gathering perceptions from end-users. Int. J. Phytoremed. 2017, 19, 947–954. [Google Scholar] [CrossRef] [PubMed]
- Johnson, J.M.-F.; Coleman, M.D.; Gesch, R.; Jaradat, A.; Mitchell, R.; Reicosky, D.; Wilhelm, W.W. Biomass-bioenergy crops in the United States: A changing paradigm. Am. J. Plant Sci. Biotechnol. 2007, 1, 1–28. [Google Scholar]
- Zhu, J.Y.; Pan, X.; Zalesny, R.S., Jr. Pretreatment of woody biomass for biofuel production: Energy efficiency, technologies, and recalcitrance. Appl. Microbiol. Biotechnol. 2010, 87, 847–857. [Google Scholar] [CrossRef] [PubMed]
- Zhang, J.; Gu, F.; Zhu, J.Y.; Zalesny, R.S., Jr. Using a combined hydrolysis factor to optimize high titer ethanol production from sulfite-pretreated poplar without detoxification. Bioresour. Technol. 2015, 186, 223–231. [Google Scholar] [CrossRef]
- Zhu, J.; Chen, L.; Gleisner, R.; Zhu, J.Y. Co-producing bioethanol and furfural from poplar using acid hydrotropic fractionation (AHF). Fuel 2019, 254, 115572. [Google Scholar] [CrossRef]
- Wang, Z.J.; Zhu, J.Y.; Zalesny, R.S., Jr.; Chen, K.F. Ethanol production potential from poplar wood through enzymatic saccharification and fermentation. Fuel 2012, 95, 606–614. [Google Scholar] [CrossRef]
- Zalesny, R.S., Jr.; Stanturf, J.A.; Gardiner, E.S.; Bañuelos, G.S.; Hallett, R.A.; Hass, A.; Stange, C.M.; Perdue, J.H.; Young, T.M.; Coyle, D.R.; et al. Environmental technologies of woody crop production systems. BioEnergy Res. 2016, 9, 492–506. [Google Scholar] [CrossRef]
- Cunningham, S.D.; Ow, D.W. Promises and prospects of phytoremediation. Plant Physiol. 1996, 110, 715–719. [Google Scholar] [CrossRef]
- Mirck, J.; Isebrands, J.G.; Verwijst, T.; Ledin, S. Development of short-rotation willow coppice systems for environmental purposes in Sweden. Biomass Bioenergy 2005, 28, 219–228. [Google Scholar] [CrossRef]
- Gopalakrishnan, G.; Negri, M.C.; Wang, M.; Wu, M.; Snyder, S.W.; Lafreniere, L. Biofuels, land, and water: A systems approach to sustainability. Environ. Sci. Technol. 2009, 43, 6094–6100. [Google Scholar] [CrossRef][Green Version]
- Miller, R.O. Growth variation among hybrid poplar varieties in Michigan, USA and the implications for commercial biomass production. BioEnergy Res. 2018, 11, 816–825. [Google Scholar] [CrossRef]
- Zalesny, R.S., Jr.; Bauer, E.O.; Hall, R.B.; Zalesny, J.A.; Kunzman, J.; Rog, C.J.; Riemenschneider, D.E. Clonal variation in survival and growth of hybrid poplar and willow in an in situ trial on soils heavily contaminated with petroleum hydrocarbons. Int. J. Phytoremed. 2005, 7, 177–197. [Google Scholar] [CrossRef] [PubMed]
- Zalesny, R.S., Jr.; Bauer, E.O. Genotypic variability and stability of poplars and willows grown on nitrate-contaminated soils. Int. J. Phytoremed. 2019, 21, 969–979. [Google Scholar] [CrossRef] [PubMed]
- Qin, R.; LeBoldus, J.M. The infection biology of Sphaerulina musiva: Clues to understanding a forest pathogen. PLoS ONE 2014, 9, e103477. [Google Scholar] [CrossRef]
- Gebrekirstos, A.; van Noordwijk, M.; Neufeldt, H.; Mitlohner, R. Relationships of stable carbon isotopes, plant water potential and growth: An approach to assess water use efficiency and growth strategies of dry land agroforestry species. Trees 2011, 25, 95–102. [Google Scholar] [CrossRef]
- Voltas, J.; Serrano, L.; Hernández, M.; Pemán, J. Carbon isotope discrimination, gas exchange and stem growth of four Euramerican hybrid poplars under different watering regimes. New Forests 2006, 31, 435–451. [Google Scholar] [CrossRef]
- Yin, C.; Wang, X.; Duan, B.; Luo, J.; Li, C. Early growth, dry matter allocation and water use efficiency of two sympatric Populus species as affected by water stress. Environ. Exp. Bot. 2005, 53, 315–322. [Google Scholar] [CrossRef]
- Dillen, S.; Marron, N.; Koch, B.; Ceulemans, R. Genetic variation of stomatal traits and carbon isotope discrimination in two hybrid poplar families (Populus deltoides ‘S9-2′ × P. nigra ‘Ghoy’ and P. deltoides ‘S9-2′ × P. trichocarpa ‘V24′). Annals Bot. 2008, 102, 399–407. [Google Scholar] [CrossRef]
- Monclus, R.; Dreyer, E.; Delmotte, F.M.; Villar, M.; Delay, D.; Boudouresque, E.; Petit, J.-M.; Marron, N.; Bréchet, C.; Brignolas, F. Productivity, leaf traits and carbon isotope discrimination in 29 Populus deltoides × P. nigra clones. New Phytol. 2005, 167, 53–62. [Google Scholar] [CrossRef]
- Monclus, R.; Dreyer, E.; Villar, M.; Delmotte, F.M.; Delay, D.; Petit, J.-M.; Barbaroux, C.; Le Thiec, D.; Bréchet, C.; Brignolas, F. Impact of drought on productivity and water use efficiency in 29 genotypes of Populus deltoides × P. nigra. New Phytol. 2006, 169, 765–777. [Google Scholar] [CrossRef]
- Maier, C.A.; Burley, J.; Cook, R.; Ghezehei, S.B.; Hazel, D.W.; Nichols, E.G. Tree water use, water use efficiency, and carbon isotope discrimination in relation to growth potential in Populus deltoides and hybrids under field conditions. Forests 2019, 10, 993. [Google Scholar] [CrossRef]
- Verlinden, M.S.; Fichot, R.; Broeckx, L.S.; Vanholme, B.; Boerjan, W.; Ceulemans, R. Carbon isotope compositions (δ13C) of leaf, wood and holocellulose differ among genotypes of poplar and between previous land uses in a short-rotation biomass plantation. Plant Cell Environ. 2015, 38, 144–156. [Google Scholar] [CrossRef] [PubMed]
- Orlović, S.; Galović, G.; Zorić, M.; Kovačević, B.; Pilipović, A.; Zoran, G. Evaluation of interspecific DNA variability in poplars using AFLP and SSR markers. Afr. J. Biotechnol. 2009, 8, 5241–5247. Available online: https://www.ajol.info/index.php/ajb/article/view/65955 (accessed on 25 August 2020).
- Eckenwalder, J.E. Natural intersectional hybridization between North American species of Populus (Salicaceae) in sections Aigeiros and Tacamahaca. II. Taxonomy. Can. J. Bot. 1984, 62, 325–335. [Google Scholar] [CrossRef]
- Nelson, N.D.; Berguson, W.E.; McMahon, B.G.; Cai, M.; Buchman, D.J. (2018) Growth performance and stability of hybrid poplar clones in simultaneous tests on six sites. Biomass Bioenergy 2018, 118, 115–125. [Google Scholar] [CrossRef]
- Nelson, N.D.; Berguson, W.E.; McMahon, B.G.; Meilan, R.; Smart, L.B.; Gouker, F.E.; Bloese, P.; Miller, R.; Volk, T.A.; Cai, M.; et al. Discovery of geographically robust hybrid poplar clones. Silvae Genet. 2019, 68, 101–110. [Google Scholar] [CrossRef]
- Headlee, W.L.; Zalesny, R.S., Jr.; Hall, R.B.; Bauer, E.O.; Bender, B.; Birr, B.A.; Miller, R.O.; Randall, J.A.; Wiese, A.H. Specific gravity of hybrid poplars in the north-central region, USA: Within-tree variability and site × genotype effects. Forests 2013, 4, 251–269. [Google Scholar] [CrossRef]
- Stanturf, J.A.; van Oosten, C.; Netzer, D.A.; Coleman, M.D.; Portwood, C.J. Ecology and silviculture of poplar plantations. Part A. In Poplar Culture in North America; Dickmann, D.I., Isebrands, J.G., Eckenwalder, J.G., Richardson, J., Eds.; NRC Research Press, National Research Council of Canada: Ottawa, ON, Canada, 2001; Chapter 5; pp. 153–206. ISBN 978-0-66018-145-5. [Google Scholar]
- Hjelm, K.; Rytter, L. The influence of soil conditions, with focus on soil acidity, on the establishment of poplar (Populus spp.). New Forests 2016, 47, 731–750. [Google Scholar] [CrossRef]
- Cabane, M.; Afif, D.; Hawkins, S. Lignins and abiotic stresses. Adv. Bot. Res. 2012, 61, 219–262. [Google Scholar] [CrossRef]
- Waliszewska, B.; Mleczek, M.; Zborowska, M.; Goliński, P.; Rutkowski, P.; Szentner, K. Changes in the chemical composition and the structure of cellulose and lignin in elm wood exposed to various forms of arsenic. Cellulose 2019, 26, 6303–6315. [Google Scholar] [CrossRef]
- Hausman, J.F.; Evers, D.; Thiellement, H.; Jouve, L. Compared responses of poplar cuttings and in vitro raised shoots to short-term chilling treatments. Plant Cell Rep. 2000, 19, 954–960. [Google Scholar] [CrossRef] [PubMed]
- Klašjna, B.; Kopitović, S.; Orlović, S. Variability of some wood properties of eastern cottonwood (Populus deltoides Bartr.) clones. Wood Sci. Technol. 2003, 37, 331–337. [Google Scholar] [CrossRef]
- Sannigrahi, P.; Ragauskas, A.J.; Tuskan, G.A. Poplar as a feedstock for biofuels: A review of compositional characteristics. Biofuels Bioprod. Bioref. 2010, 4, 209–226. [Google Scholar] [CrossRef]
- Zhou, G.; Taylor, G.; Polle, A. FTIR-ATR-based prediction and modelling of lignin and energy contents reveals independent intra-specific variation of these traits in bioenergy poplars. Plant Methods 2011, 7, 1–10. [Google Scholar] [CrossRef] [PubMed]
- Bauddh, K.; Singh, B.; Korstad, J. Phytoremediation Potential of Bioenergy Plants; Springer: Singapore, 2017. [Google Scholar] [CrossRef]
- Studer, M.H.; DeMartini, J.D.; Davis, M.F.; Sykes, R.W.; Davison, B.; Keller, M.; Tuskan, G.A.; Wyman, C.E. Lignin content in natural Populus variants affects sugar release. Proc. Natl. Acad. Sci. USA 2011, 108, 6300–6305. [Google Scholar] [CrossRef]
- Chen, L.; Dou, J.; Ma, Q.; Li, N.; Wu, R.; Bian, H.; Yelle, D.J.; Vuorinen, T.; Fu, S.; Pan, X.; et al. Rapid and near-complete dissolution of wood lignin at ≤80 °C using a recyclable acid hydrotrope. Sci. Adv. 2017, 3, e1701735. [Google Scholar] [CrossRef]
- Sawada, D.; Kalluri, U.C.; O’Neill, H.; Urban, V.; Langan, P.; Davison, B.; Pingali, S.V. Tension wood structure and morphology conducive for better enzymatic digestion. Biotechnol. Biofuels 2018, 11, 44. [Google Scholar] [CrossRef]
- Leu, S.Y.; Zhu, J.Y. Substrate-related factors affecting enzymatic saccharification of lignocelluloses: Our recent understanding. BioEnergy Res. 2013, 6, 405–415. [Google Scholar] [CrossRef]
- Yu, Q.; Zhuang, X.; Wang, W.; Qi, W.; Wang, Q.; Tan, X.; Kong, X.; Yuan, Z. Hemicellulose and lignin removal to improve the enzymatic digestibility and ethanol production. Biomass Bioenergy 2016, 94, 105–109. [Google Scholar] [CrossRef]
- Volk, T.A.; Verwijst, T.; Tharakan, P.J.; Abrahamson, L.P.; White, E.H. Growing fuel: A sustainability assessment of willow biomass crops. Front. Ecol. Environ. 2004, 2, 411–418. [Google Scholar] [CrossRef]
- Ray, M.J.; Brereton, N.J.; Shield, I.; Karp, A.; Murphy, R.J. Variation in cell wall composition and accessibility in relation to biofuel potential of short rotation coppice willows. BioEnergy Res. 2012, 5, 685–698. [Google Scholar] [CrossRef]
- Bose, S.K.; Francis, R.C.; Govender, M.; Bush, T.; Spark, A. Lignin content versus syringyl to guaiacyl ratio amongst poplars. Bioresour. Technol. 2009, 100, 1628–1633. [Google Scholar] [CrossRef] [PubMed]
- Davison, B.H.; Drescher, S.R.; Tuskan, G.A.; Davis, M.F.; Nghiem, N.P. Variation of S/G ratio and lignin content in a Populus family influences the release of xylose by dilute acid hydrolysis. Appl. Biochem. Biotechnol. 2006, 130, 427–435. [Google Scholar] [CrossRef]
- Zalesny, R.S., Jr.; Stange, C.M.; Birr, B.A. Survival, height growth, and phytoextraction potential of hybrid poplar and Russian Olive (Elaeagnus Angustifolia L.) established on soils varying in salinity in North Dakota, USA. Forests 2019, 10, 672–691. [Google Scholar] [CrossRef]
- ANKOM Technology. Fiber Analyzer A200; ANKOM Technology: Macedon, NY, USA, 2020; Available online: https://www.ankom.com/technical-support/fiber-analyzer-a200 (accessed on 1 September 2020).
- Bond-Lamberty, B.; Wang, C.; Gower, S.T. Aboveground and belowground biomass and sapwood area allometric equations for six boreal tree species of northern Manitoba. Can. J. For. Res. 2002, 32, 1441–1450. [Google Scholar] [CrossRef]
- Headlee, W.L.; Zalesny, R.S., Jr. Allometric relationships for aboveground woody biomass differ among hybrid poplar genomic groups and clones in the North-Central USA. BioEnergy Res. 2019, 12, 966–976. [Google Scholar] [CrossRef]
- Luo, X.; Gleisner, R.; Tian, S.; Negron, J.; Horn, E.; Pan, X.J.; Zhu, J.Y. Evaluation of mountain beetle infested lodgepole pine for cellulosic ethanol production by SPORL pretreatment. Ind. Eng. Chem. Res. 2010, 49, 8258–8266. [Google Scholar] [CrossRef]
- Dence, C.W. The determination of lignin. In Methods in Lignin Chemistry; Lin, S.Y., Dence, C.W., Eds.; Springer: Berlin, Germany, 1992; pp. 33–61. [Google Scholar] [CrossRef]
- Gu, F.; Gilles, W.; Gleisner, R.; Zhu, J.Y. Fermentative high titer ethanol production from a Douglas-fir forest residue without detoxification using SPORL: High SO2 loading at a low temperature. Ind. Biotechnol. 2016, 12, 168–175. [Google Scholar] [CrossRef]
Publisher’s Note: MDPI stays neutral with regard to jurisdictional claims in published maps and institutional affiliations. |
© 2020 by the authors. Licensee MDPI, Basel, Switzerland. This article is an open access article distributed under the terms and conditions of the Creative Commons Attribution (CC BY) license (http://creativecommons.org/licenses/by/4.0/).