Intraspecific Variation in Nectar Chemistry and Its Implications for Insect Visitors: The Case of the Medicinal Plant, Polemonium Caeruleum L.


 , ,
, ,
Abstract
1. Introduction
2. Results
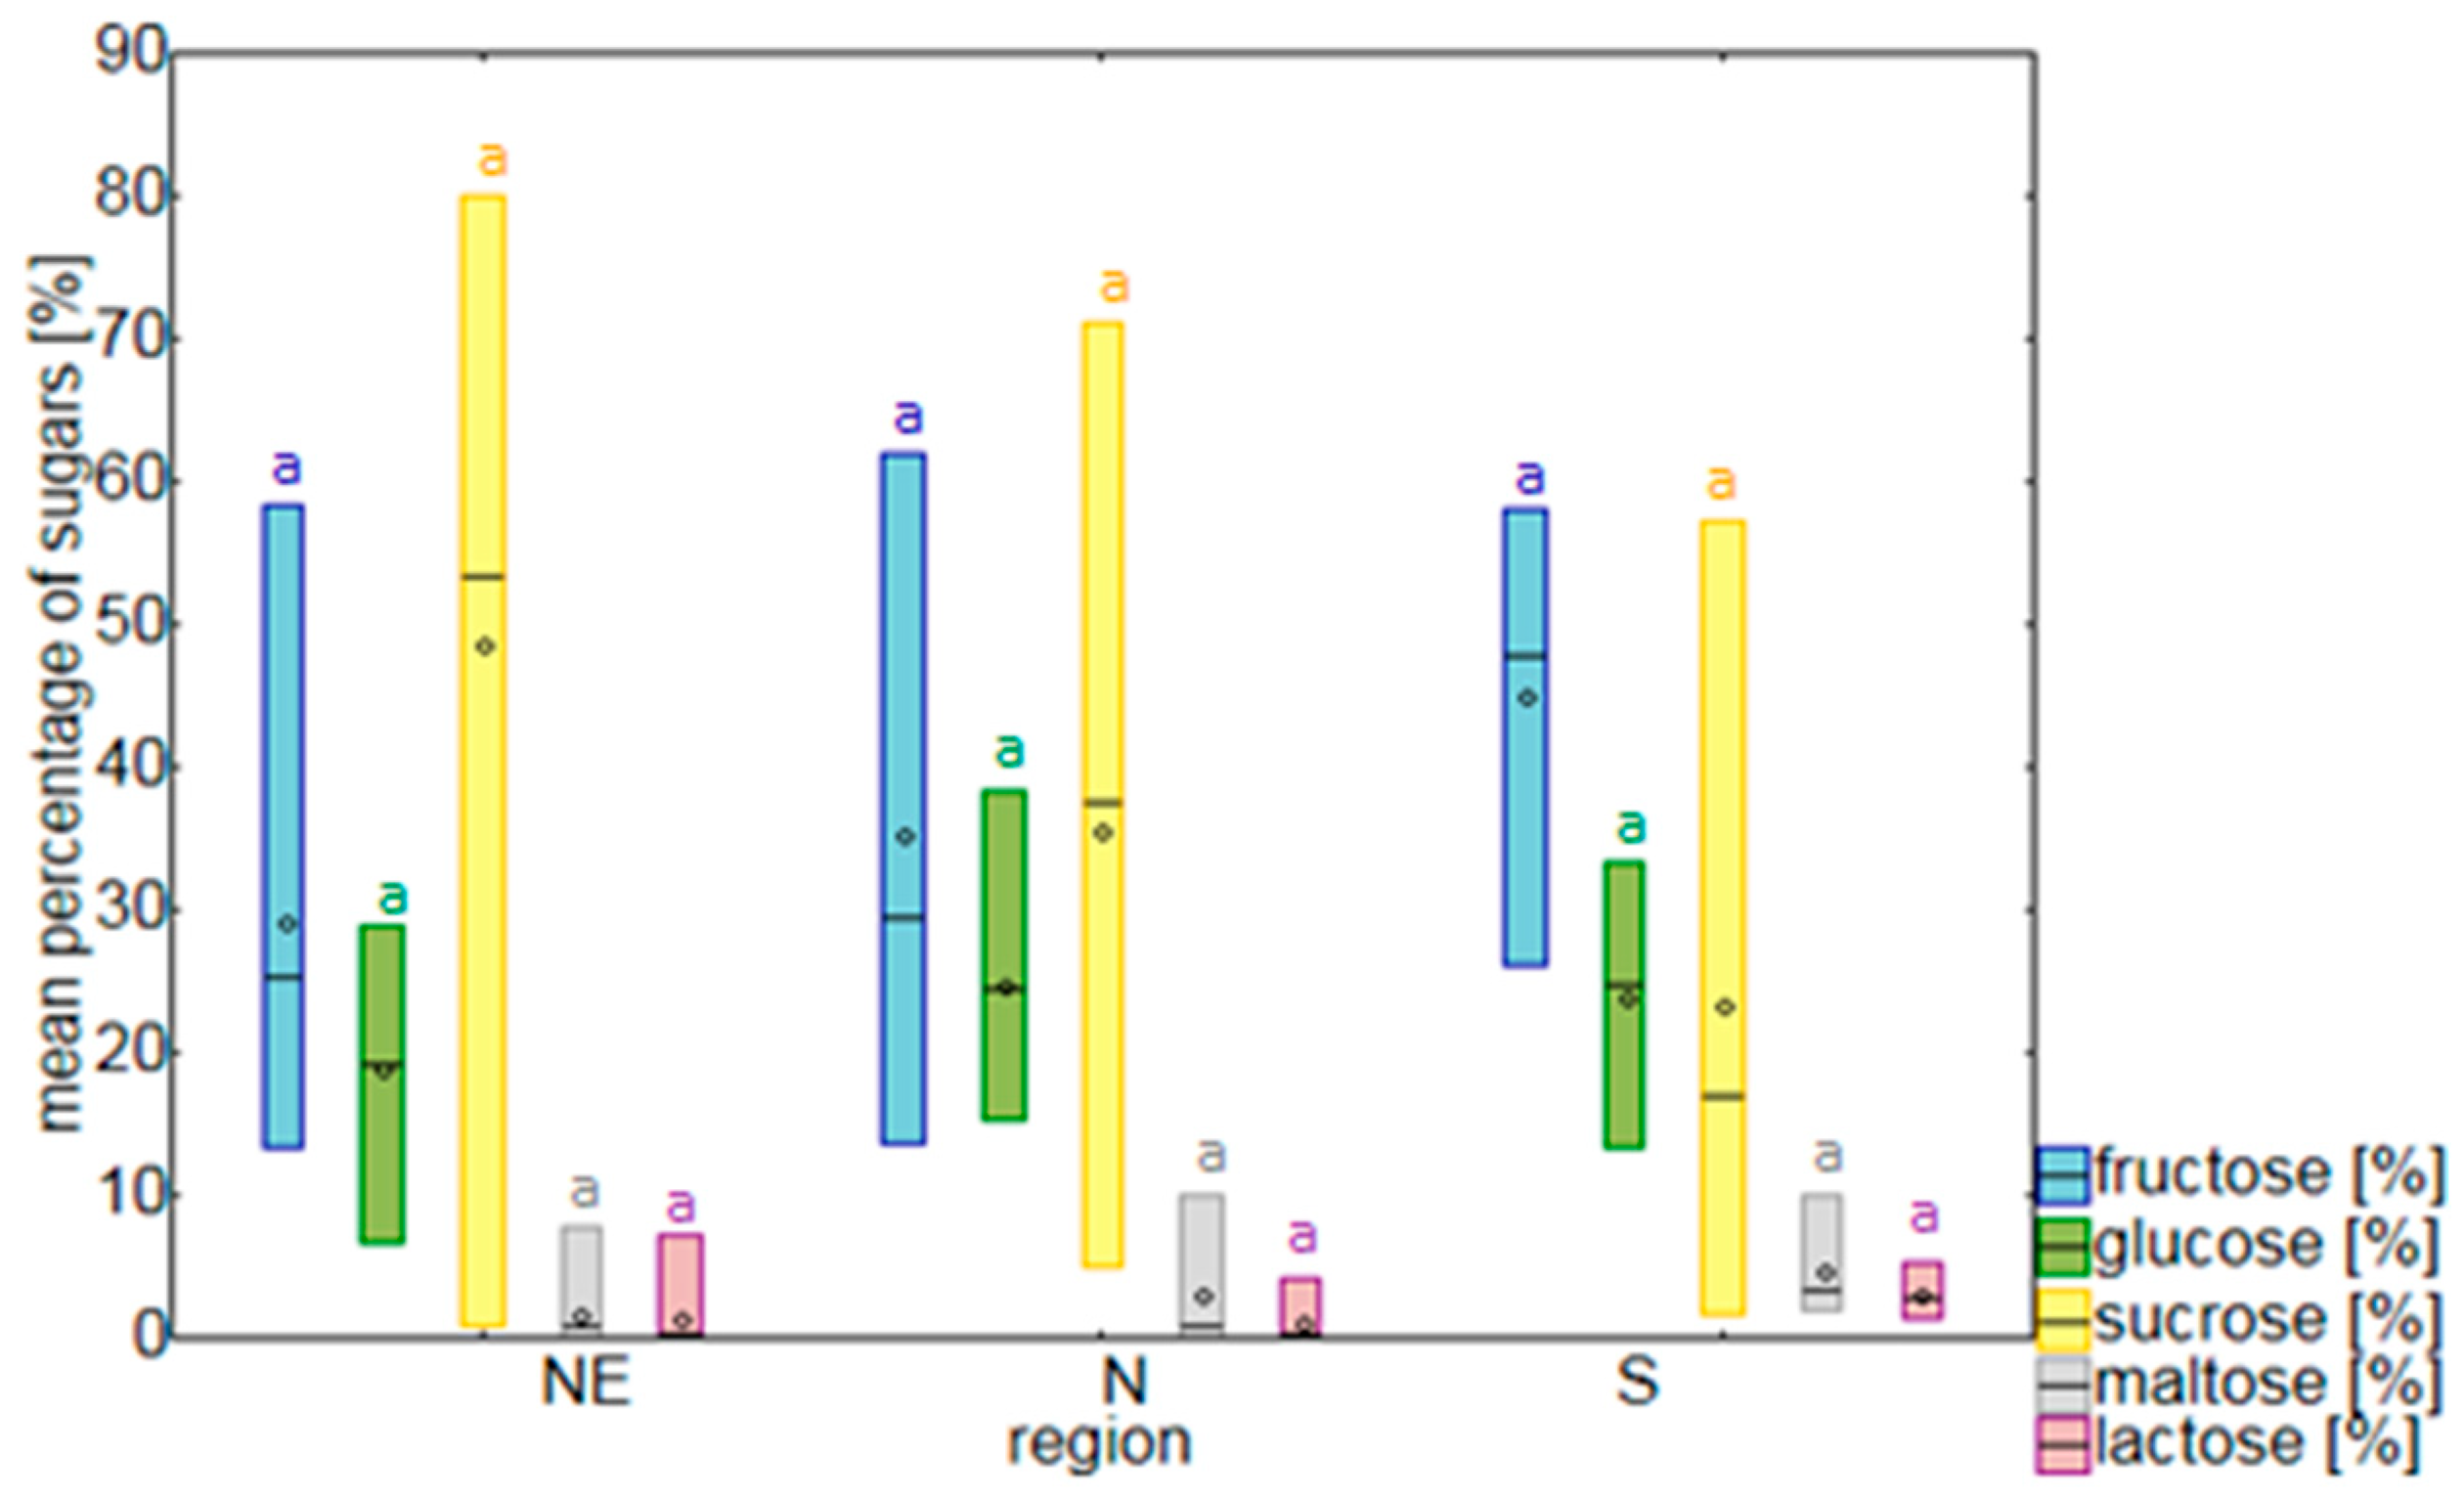
2.1. Sugars
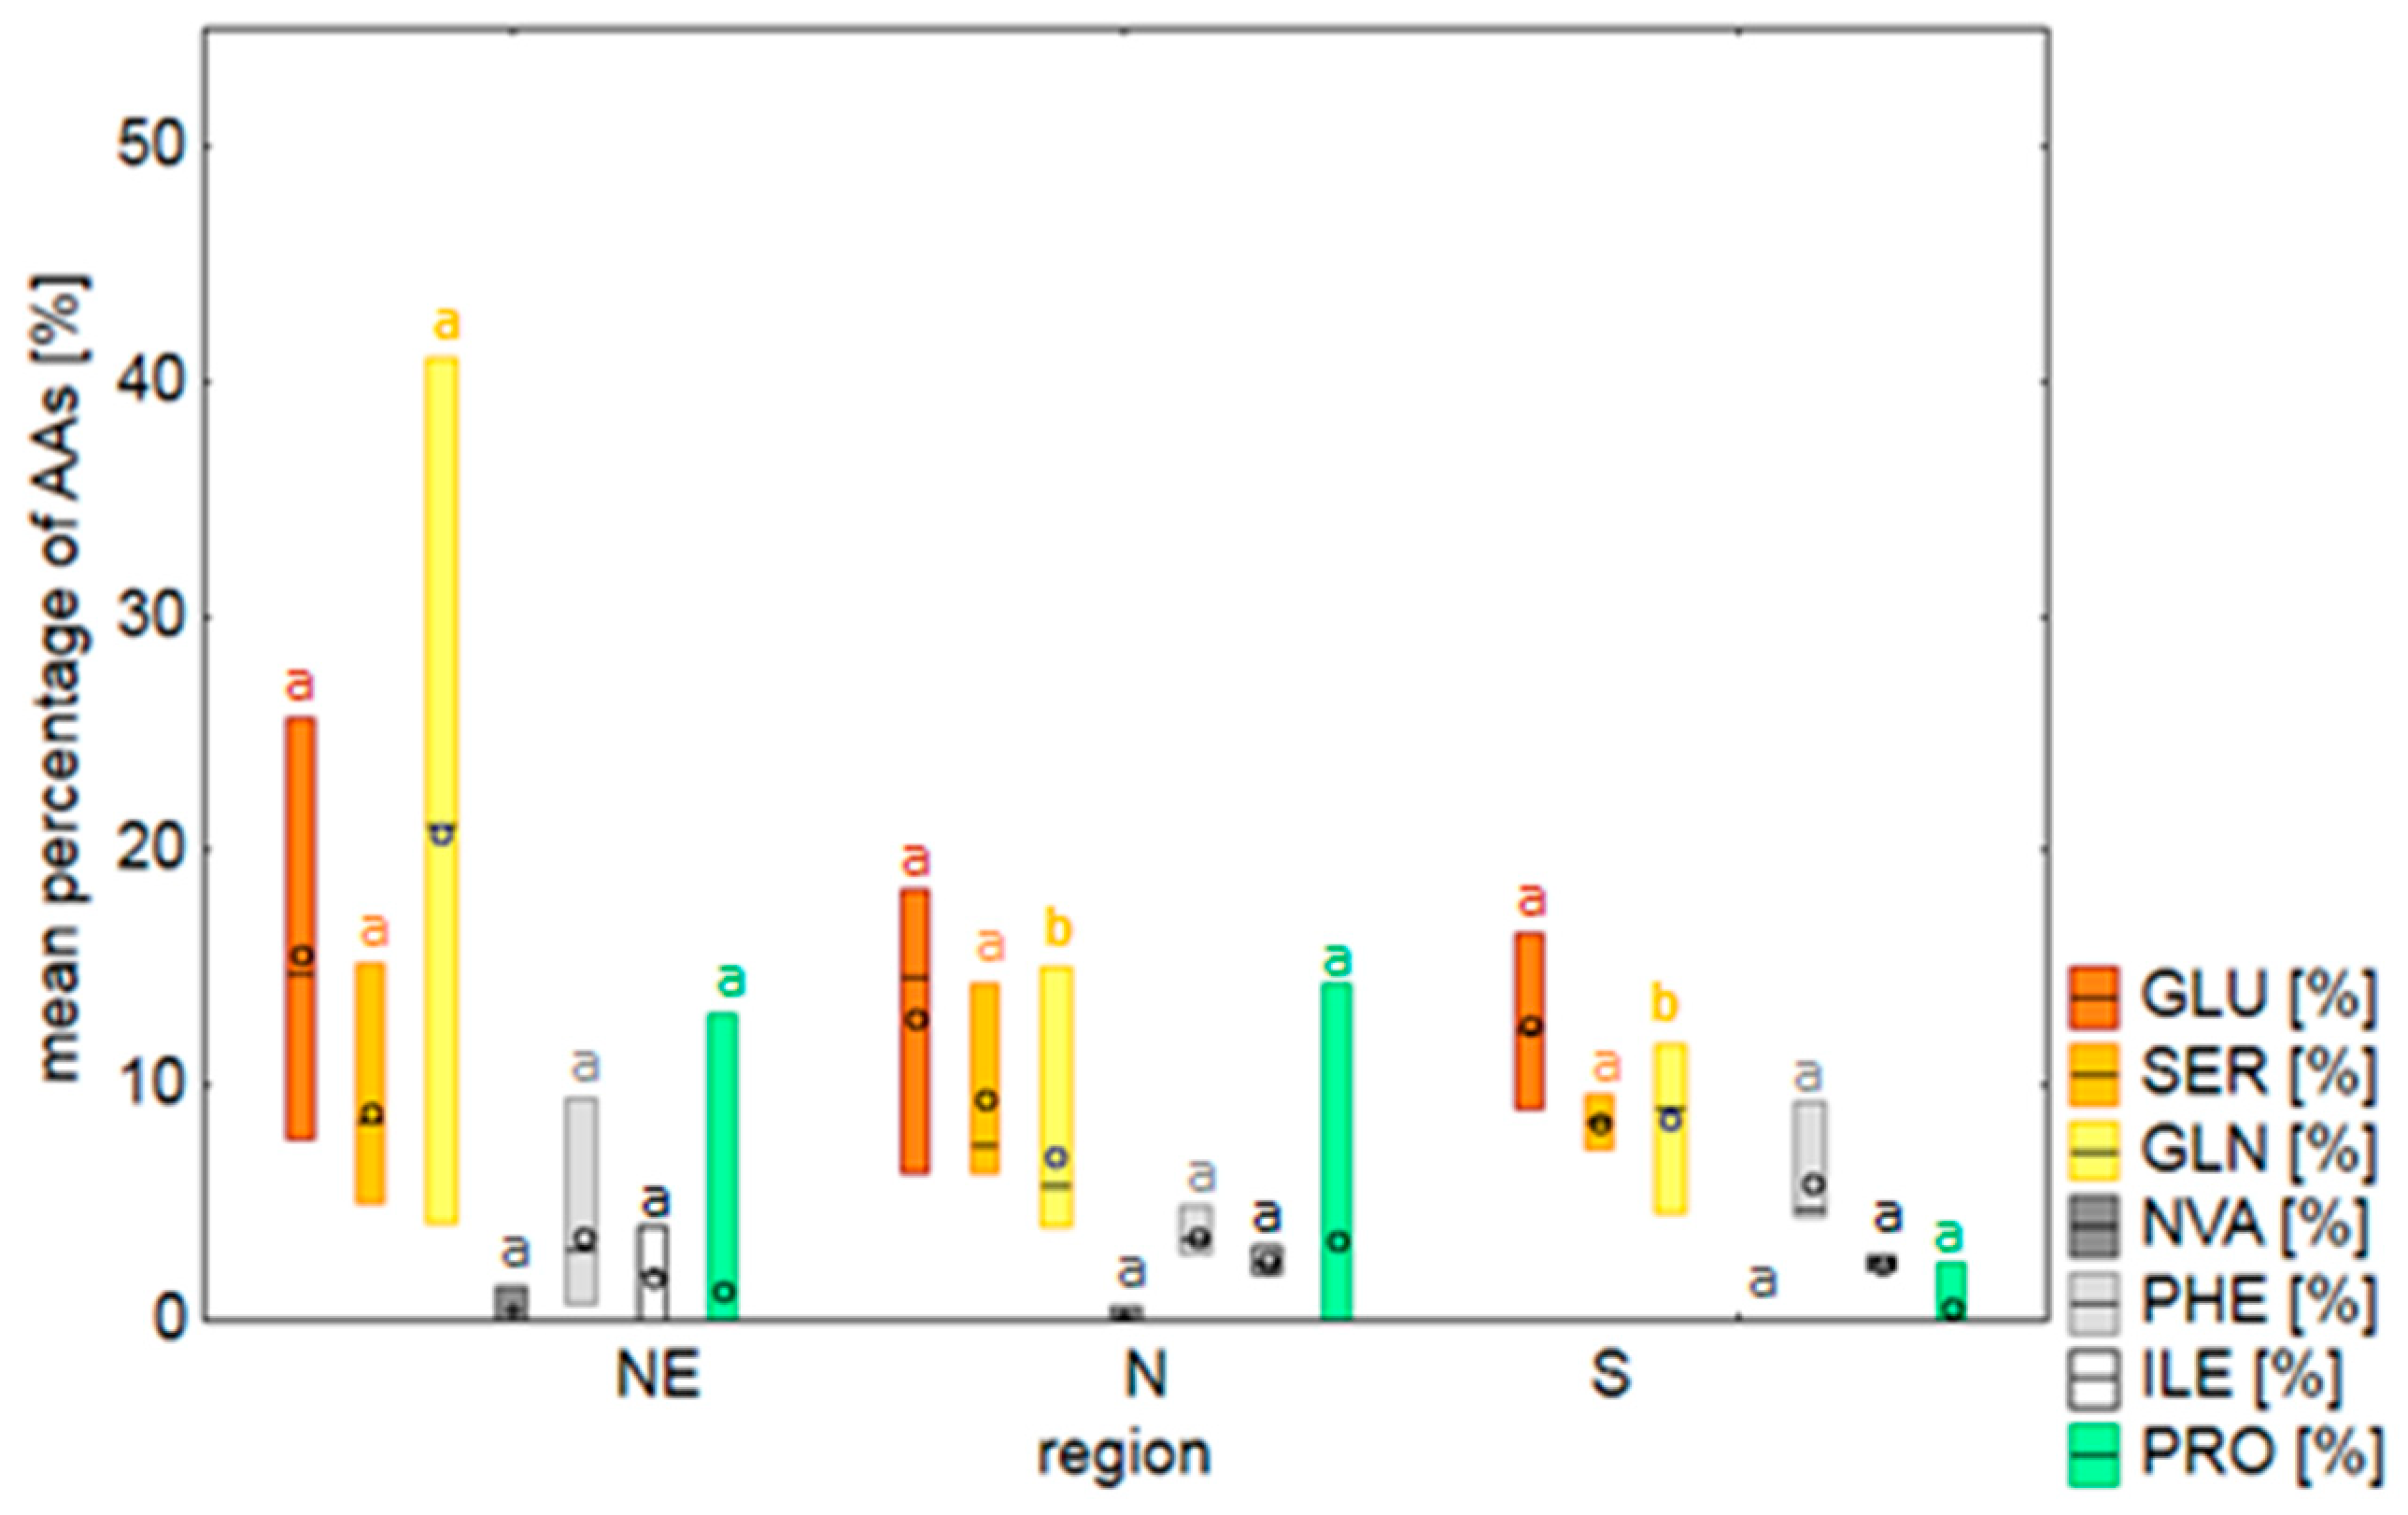
2.2. Amino Acids
2.3. Biomass and Soil Analysis
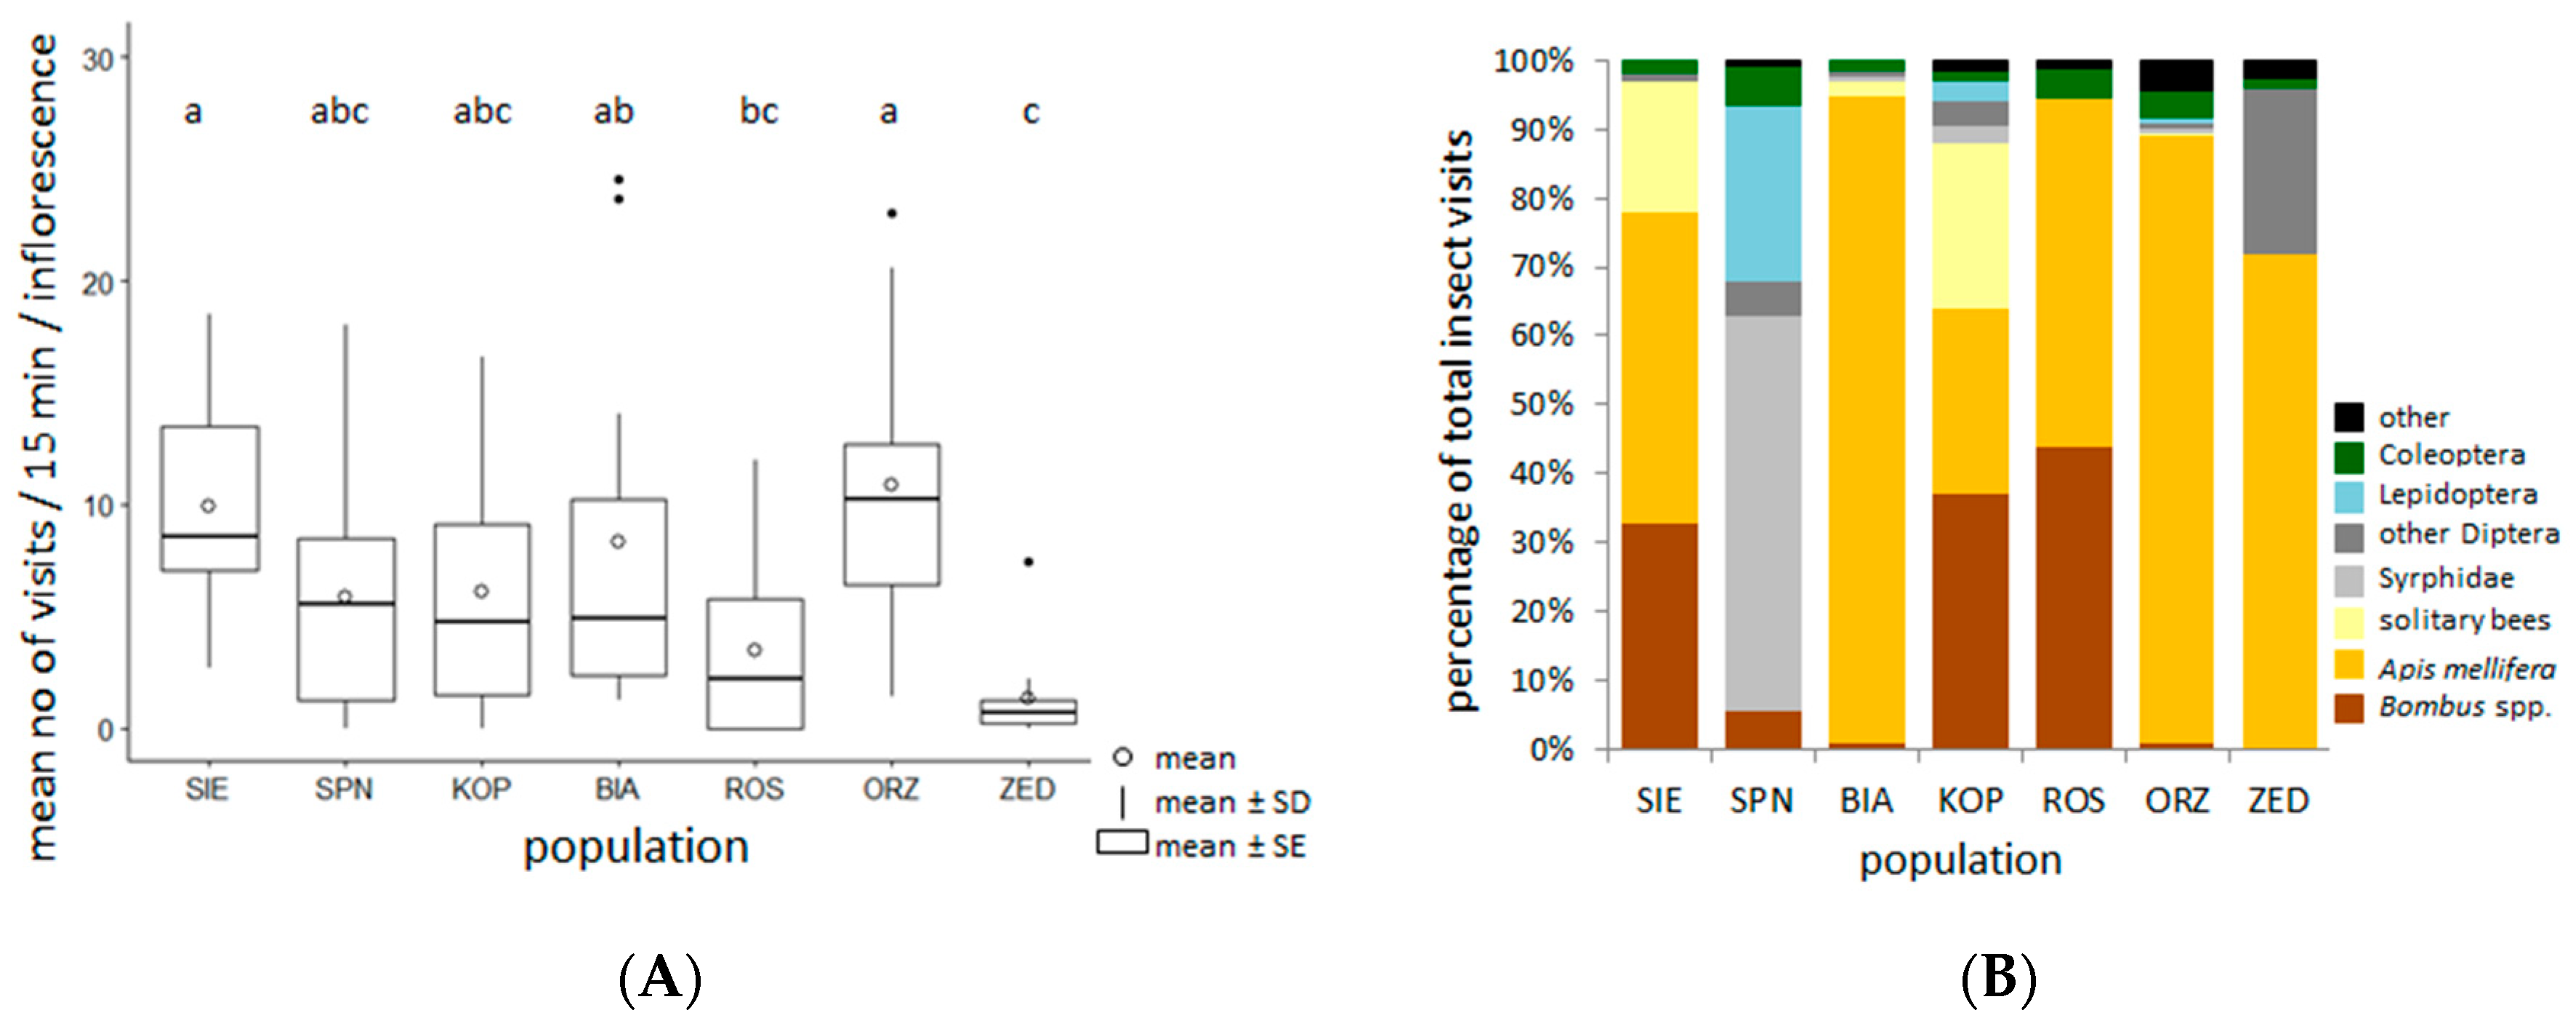
2.4. Taxonomic Composition and the Frequency of Insect Visits in the Selected Populations
3. Discussion
3.1. Nectar Sugars
3.2. Amino Acids
3.3. Other Factors that May Have Affected Nectar Properties and Mutualistic Interactions with Insects
4. Conclusions
5. Materials and Methods
5.1. Plant Description
5.2. Field Observations
5.3. Nectar Sampling and Analysing
5.4. Soil Samples Collection and Analysis
5.5. Biomass Sample Collection and Analysis
5.6. Insect Visitors
5.7. Data Analysis
Supplementary Materials
Author Contributions
Funding
Acknowledgments
Conflicts of Interest
References
- Willmer, P. Pollination and Floral Ecology; Princeton University Press: Princeton, NJ, USA, 2011; ISBN 9781400838943. [Google Scholar]
- Brandenburg, A.; Dell’Olivo, A.; Bshary, R.; Kuhlemeier, C. The sweetest thing. Advances in nectar research. Curr. Opin. Plant Biol. 2009, 12, 486–490. [Google Scholar] [CrossRef] [PubMed]
- Nepi, M.; Soligo, C.; Nocentini, D.; Abate, M.; Guarnieri, M.; Cai, G.; Bini, L.; Puglia, M.; Bianchi, L.; Pacini, E. Amino acids and protein profile in floral nectar: Much more than a simple reward. Flora Morphol. Distrib. Funct. Ecol. Plants 2012, 207, 475–481. [Google Scholar] [CrossRef]
- Nepi, M. Beyond nectar sweetness: The hidden ecological role of non-protein amino acids in nectar. J. Ecol. 2014, 102, 108–115. [Google Scholar] [CrossRef]
- Nepi, M.; Grasso, D.A.; Mancuso, S. Nectar in plant–insect mutualistic relationships: From food reward to partner manipulation. Front. Plant Sci. 2018, 9. [Google Scholar] [CrossRef] [PubMed]
- Parachnowitsch, A.L.; Manson, J.S.; Sletvold, N. Evolutionary ecology of nectar. Ann. Bot. 2019, 123, 247–261. [Google Scholar] [CrossRef] [PubMed]
- Baker, H.G.; Baker, I. Chemical constituents of nectar in relation to pollination mechanisms and phylogeny. In Biochemical Aspects of Evolutionary Biology; Nitecki, M.H., Ed.; University of Chicago Press: Chicago, IL, USA, 1982; pp. 131–171. [Google Scholar]
- Pacini, E.; Nepi, M. Nectar production and presentation. In Nectaries and Nectar; Nicolson, S.W., Nepi, M., Pacini, E., Eds.; Springer: Berlin, Germany, 2007; pp. 167–214. ISBN 9781402059377. [Google Scholar]
- Baker, H.G.; Baker, I. Floral nectar sugar constituents in relation to pollinator type. In Handbook of Experimental Pollination Ecology; Jones, C.E., Little, R.J., Eds.; Van Nostrand-Reinhold: New York, NY, USA, 1983; pp. 117–141. [Google Scholar]
- Baker, H.G.; Baker, I. The occurrence and significance of amino acids in floral nectar. Plant Syst. Evol. 1986, 151, 175–186. [Google Scholar] [CrossRef]
- Baker, H.G. Non-sugar chemical constituents of nectar. Apidologie 1977, 8, 349–356. [Google Scholar] [CrossRef]
- Zych, M.; Junker, R.R.; Nepi, M.; Stpiczyńska, M.; Stolarska, B.; Roguz, K. Spatiotemporal variation in the pollination systems of a supergeneralist plant: Is Angelica sylvestris (Apiaceae) locally adapted to its most effective pollinators? Ann. Bot. 2019, 123, 415–428. [Google Scholar] [CrossRef]
- Gijbels, P.; Van den Ende, W.; Honnay, O. Landscape scale variation in nectar amino acid and sugar composition in a Lepidoptera pollinated orchid species and its relation with fruit set. J. Ecol. 2014, 102, 136–144. [Google Scholar] [CrossRef]
- Lanza, J.; Smith, G.C.; Sack, S.; Cash, A. Variation in nectar volume and composition of Impatiens capensis at the individual, plant, and population levels. Oecologia 1995, 102, 113–119. [Google Scholar] [CrossRef]
- Gardener, M.C.; Gillman, M.P. Analyzing variability in nectar amino acids: Composition is less variable than concentration. J. Chem. Ecol. 2001, 27, 2545–2558. [Google Scholar] [CrossRef] [PubMed]
- Herrera, C.M.; Pérez, R.; Alonso, C. Extreme intraplant variation in nectar sugar composition in an insect-pollinated perennial herb. Am. J. Bot. 2006, 93, 575–581. [Google Scholar] [CrossRef] [PubMed]
- Gijbels, P.; Van den Ende, W.; Honnay, O. Phenotypic selection on nectar amino acid composition in the Lepidoptera pollinated orchid species Gymnadenia conopsea. Oikos 2015, 124, 421–427. [Google Scholar] [CrossRef]
- Gijbels, P.; Ceulemans, T.; Van den Ende, W.; Honnay, O. Experimental fertilization increases amino acid content in floral nectar, fruit set and degree of selfing in the orchid Gymnadenia conopsea. Oecologia 2015, 179, 785–795. [Google Scholar] [CrossRef] [PubMed]
- Antoń, S.; Denisow, B.; Komoń-Janczara, E.; Targoński, Z. Nectary and gender-biased nectar production in dichogamous Chamaenerion angustifolium (L.) Scop. (Onagraceae). Plant Species Biol. 2017, 32, 380–391. [Google Scholar] [CrossRef]
- Brzosko, E.; Bajguz, A. Nectar composition in moth-pollinated Platanthera bifolia and P. chlorantha and its importance for reproductive success. Planta 2019, 250, 263–279. [Google Scholar] [CrossRef]
- Nicolson, S.W.; Thornburg, R.W. Nectar chemistry. In Nectaries and Nectar; Nicolson, S.W., Nepi, M., Pacini, E., Eds.; Springer: Berlin, Germany, 2007; ISBN 9781402059377. [Google Scholar]
- Herrera, C.M.; García, I.M.; Pérez, R. Invisible floral larcenies: Microbial communities degrade floral nectar of bumble bee-pollinated plants. Ecology 2008, 89, 2369–2376. [Google Scholar] [CrossRef] [PubMed]
- Vannette, R.L.; Fukami, T. Contrasting effects of yeasts and bacteria on floral nectar traits. Ann. Bot. 2018, 121, 1343–1349. [Google Scholar] [CrossRef] [PubMed]
- Zych, M.; Stpiczyńska, M.; Roguz, K. Reproductive biology of the Red List species Polemonium caeruleum (Polemoniaceae). Bot. J. Linn. Soc. 2013, 173, 92–107. [Google Scholar] [CrossRef]
- Ostrowiecka, B.; Brzosko, E.; Jermakowicz, E.; Wróblewska, A.; Mirski, P.; Roguz, K.; Ryniewicz, J.; Zych, M.; Tałałaj, I. Breeding system variability, pollination biology, and reproductive success of rare Polemonium caeruleum L. in NE Poland. Acta Agrobot. 2017, 70. [Google Scholar] [CrossRef]
- Ryniewicz, J.; Decewicz, P.; Dziewit, L.; Zych, M. Is bacterial microbiome from the Polemonium caeruleum L. (Polemoniaceae) nectar geographically variable? Acta Soc. Bot. Pol. 2019, 88. [Google Scholar] [CrossRef]
- Antoń, S.; Komoń-Janczara, E.; Denisow, B. Floral nectary, nectar production dynamics and chemical composition in five nocturnal Oenothera species (Onagraceae) in relation to floral visitors. Planta 2017, 246, 1051–1067. [Google Scholar] [CrossRef] [PubMed]
- Wykes, G.R. An investigation of the sugars present in the nectar of flowers of various species. New Phytol. 1952, 51, 210–215. [Google Scholar] [CrossRef]
- Waller, G.D. Evaluating Responses of Honey Bees1 to Sugar Solutions Using an Artificial-Flower Feeder2. Ann. Entomol. Soc. Am. 1972. [Google Scholar] [CrossRef]
- Abrahamczyk, S.; Kessler, M.; Hanley, D.; Karger, D.N.; Müller, M.P.J.; Knauer, A.C.; Keller, F.; Schwerdtfeger, M.; Humphreys, A.M. Pollinator adaptation and the evolution of floral nectar sugar composition. J. Evol. Biol. 2017, 30, 112–127. [Google Scholar] [CrossRef] [PubMed]
- Farkas, Á.; Molnár, R.; Morschhauser, T.; Hahn, I. Variation in nectar volume and sugar concentration of allium ursinum L. Ssp. Ucrainicum in three habitats. Sci. World J. 2012, 2012. [Google Scholar] [CrossRef] [PubMed]
- Gowda, V.; Kress, W.J. A Geographic Mosaic of Plant-Pollinator Interactions in the Eastern Caribbean Islands. Biotropica 2013, 45, 224–235. [Google Scholar] [CrossRef]
- Baude, M.; Leloup, J.; Suchail, S.; Allard, B.; Benest, D.; Mériguet, J.; Nunan, N.; Dajoz, I.; Raynaud, X. Litter inputs and plant interactions affect nectar sugar content. J. Ecol. 2011, 99, 828–837. [Google Scholar] [CrossRef]
- Ceulemans, T.; Hulsmans, E.; Vanden Ende, W.; Honnay, O. Nutrient enrichment is associated with altered nectar and pollen chemical composition in Succisa pratensis Moench and increased larval mortality of its pollinator Bombus terrestris L. PLoS ONE 2017, 12, e0175160. [Google Scholar] [CrossRef]
- Knopper, L.D.; Dan, T.; Reisig, D.D.; Johnson, J.D.; Bowers, L.M. Sugar concentration in nectar: A quantitative metric of crop attractiveness for refined pollinator risk assessments. Pest Manag. Sci. 2016, 72, 1807–1812. [Google Scholar] [CrossRef]
- Romeis, J.; Wäckers, F.L. Feeding responses by female Pieris brassicae butterflies to carbohydrates and amino acids. Physiol. Entomol. 2000, 25, 247–253. [Google Scholar] [CrossRef]
- Kelber, A. Sugar preferences and feeding strategies in the hawkmoth Macroglossum stellatarum. J. Comp. Physiol. A Neuroethol. Sens. Neural Behav. Physiol. 2003, 189, 661–666. [Google Scholar] [CrossRef] [PubMed]
- Barker, R.J.; Lehner, Y. Acceptance and sustenance value of naturally occurring sugars fed to newly emerged adult workers of honey bees (Apis mellifera L.). J. Exp. Zool. 1974, 187, 277–285. [Google Scholar] [CrossRef]
- Petanidou, T. Sugars in Mediterranean floral nectars: An ecological and evolutionary approach. J. Chem. Ecol. 2005, 31, 1065–1088. [Google Scholar] [CrossRef] [PubMed]
- Tiedge, K.; Lohaus, G. Nectar sugars and amino acids in day- and night-flowering Nicotiana species are more strongly shaped by pollinators’ preferences than organic acids and inorganic ions. PLoS ONE 2017, 12, e0176865. [Google Scholar] [CrossRef]
- Nepi, M.; Pacini, E.; Nencini, C.; Collavoli, E.; Franchi, G.G. Variability of nectar production and composition in Linaria vulgaris (L.) Mill. (Scrophulariaceae). Plant Syst. Evol. 2003, 238, 109–118. [Google Scholar] [CrossRef]
- Petanidou, T.; Van Laere, A.N.; Ellis, W.; Smets, E. What shapes amino acid and sugar composition in Mediterranean floral nectars? Oikos 2006, 115, 155–169. [Google Scholar] [CrossRef]
- Canto, A.; Herrera, C.M.; García, I.M.; Pérez, R.; Vaz, M. Intraplant variation in nectar traits in Helleborus foetidus (Ranunculaceae) as related to floral phase, environmental conditions and pollinator exposure. Flora Morphol. Distrib. Funct. Ecol. Plants 2011, 206, 668–675. [Google Scholar] [CrossRef]
- Stpiczyńska, M.; Nepi, M.; Zych, M. Nectaries and male-biased nectar production in protandrous flowers of a perennial umbellifer Angelica sylvestris L. (Apiaceae). Plant Syst. Evol. 2015, 301, 1099–1113. [Google Scholar] [CrossRef][Green Version]
- Carlson, J.E.; Harms, K.E. The evolution of gender-biased nectar production in hermaphroditic plants. Bot. Rev. 2006, 72, 179–205. [Google Scholar] [CrossRef]
- Gardener, M.C.; Gillman, M.P. The taste of nectar—A neglected area of pollination ecology. Oikos 2002, 98, 552–557. [Google Scholar] [CrossRef]
- Gardener, M.C.; Gillman, M.P. The effects of soil fertilizer on amino acids in the floral nectar of corncockle, Agrostemma githago (Caryophyllaceae). Oikos 2001, 92, 101–106. [Google Scholar] [CrossRef]
- Rout, G.R.; Sahoo, S. Role of iron in plant growth and metabolism. Rev. Agric. Sci. 2015, 3, 1–24. [Google Scholar] [CrossRef]
- Kevan, P.G.; Baker, H.G. Insects as flower visitors and pollinators. Annu. Rev. Entomol. 1983, 28, 407–453. [Google Scholar] [CrossRef]
- Roguz, K.; Bajguz, A.; Chmur, M.; Gołębiewska, A.; Roguz, A.; Zych, M. Diversity of nectar amino acids in the Fritillaria (Liliaceae) genus: Ecological and evolutionary implications. Sci. Rep. 2019, 23. [Google Scholar] [CrossRef] [PubMed]
- Carter, C.; Shafir, S.; Yehonatan, L.; Palmer, R.G.; Thornburg, R. A novel role for proline in plant floral nectars. Naturwissenschaften 2006, 93, 72–79. [Google Scholar] [CrossRef]
- Dadd, R.H. Insect Nutrition: Current Developments and Metabolic Implications. Annu. Rev. Entomol. 1973, 18, 381–420. [Google Scholar] [CrossRef]
- Mustard, J.A. Neuroactive nectar: Compounds in nectar that interact with neurons. Arthropod. Plant. Interact. 2020, 14, 151–159. [Google Scholar] [CrossRef]
- De Groot, A.P. Protein and Amino Acis Requirements of the Honeybee (Apis mellifera L.). Physiol. Comp. Oecol. 1953, 8, 192–194. [Google Scholar]
- Stabler, D.; Paoli, P.P.; Nicolson, S.W.; Wright, G.A. Nutrient balancing of the adult worker bumblebee (Bombus terrestris) depends on the dietary source of essential amino acids. J. Exp. Biol. 2015, 218, 793–802. [Google Scholar] [CrossRef]
- Shiraishi, A.; Kuwabara, M. The effects of amino acids on the labellar hair chemosensory cells of the fly. J. Gen. Physiol. 1970, 56, 768–782. [Google Scholar] [CrossRef] [PubMed]
- Inouye, D.W.; Waller, G.D. Responses of honey bees (Apis mellifera) to amino acid solutions mimicking floral nectars. Ecology 1984, 65, 618–625. [Google Scholar] [CrossRef]
- Borycz, J.; Borycz, J.A.; Edwards, T.N.; Boulianne, G.L.; Meinertzhagen, I.A. The metabolism of histamine in the Drosophila optic lobe involves an ommatidial pathway: β-alanine recycles through the retina. J. Exp. Biol. 2012, 215, 1399–1411. [Google Scholar] [CrossRef] [PubMed]
- Hammer, M.; Menzel, R. Multiple sites of associative odor learning as revealed by local brain microinjections of octopamine in honeybees. Learn. Mem. 1998, 5, 146–156. [Google Scholar] [CrossRef] [PubMed]
- Micheu, S.; Crailsheim, K.; Leonhard, B. Importance of proline and other amino acids during honeybee flight (Apis mellifera carnica POLLMANN). Amino Acids 2000, 17, 189–198. [Google Scholar] [CrossRef]
- Zhang, L.; Martin, A.; Perry, M.W.; van der Burg, K.R.L.; Matsuoka, Y.; Monteiro, A.; Reed, R.D. Genetic basis of melanin pigmentation in butterfly wings. Genetics 2017, 205, 1537–1550. [Google Scholar] [CrossRef]
- Hall, J.P.W.; Willmott, K.R. Patterns of feeding behaviour in adult male riodinid butterflies and their relationship to morphology and ecology. Biol. J. Linn. Soc. 2000, 69, 1–23. [Google Scholar] [CrossRef]
- Pohl, N.B.; Van Wyk, J.; Campbell, D.R. Butterflies show flower color preferences but not constancy in foraging at four plant species. Ecol. Entomol. 2011, 36, 290–300. [Google Scholar] [CrossRef]
- Gilbert, F.S. Foraging ecology of hoverflies: Morphology of the mouthparts in relation to feeding on nectar and pollen in some common urban species. Ecol. Entomol. 1981, 6, 245–262. [Google Scholar] [CrossRef]
- Raguso, R.A. Why are some floral nectars scented? Ecology 2004, 85, 1486–1494. [Google Scholar] [CrossRef]
- Bertsch, A. Nectar production of Epilobium angustifolium L. at different air humidities; nectar sugar in individual flowers and the optimal foraging theory. Oecologia 1983, 59, 40–48. [Google Scholar] [CrossRef] [PubMed]
- Vannette, R.L.; Gauthier, M.P.L.; Fukami, T. Nectar bacteria, but not yeast, weaken a plant - Pollinator mutualism. Proc. R. Soc. B Biol. Sci. 2013, 280. [Google Scholar] [CrossRef] [PubMed]
- Lenaerts, M.; Pozo, M.I.; Wäckers, F.; Van den Ende, W.; Jacquemyn, H.; Lievens, B. Impact of microbial communities on floral nectar chemistry: Potential implications for biological control of pest insects. Basic Appl. Ecol. 2016, 17, 189–198. [Google Scholar] [CrossRef]
- Rering, C.C.; Beck, J.J.; Hall, G.W.; McCartney, M.M.; Vannette, R.L. Nectar-inhabiting microorganisms influence nectar volatile composition and attractiveness to a generalist pollinator. New Phytol. 2018, 220, 750–759. [Google Scholar] [CrossRef] [PubMed]
- Burdon, R.C.F.; Junker, R.R.; Scofield, D.G.; Parachnowitsch, A.L. Bacteria colonising Penstemon digitalis show volatile and tissue-specific responses to a natural concentration range of the floral volatile linalool. Chemoecology 2018, 28, 11–19. [Google Scholar] [CrossRef] [PubMed]
- Freeman, C.E.; Wilken, D.H. Variation in Nectar Sugar Composition at the Intraplant Level in Ipomopsis longiflora (Polemoniaceae). Am. J. Bot. 1987, 74, 1681–1689. [Google Scholar] [CrossRef]
- Pigott, C.D. Polemonium Caeruleum L. J. Ecol. 1958, 46, 507–525. [Google Scholar] [CrossRef]
- Łaska, G.; Sieniawska, E.; Świątek, Ł.; Zjawiony, J.; Khan, S.; Boguszewska, A.; Stocki, M.; Angielczyk, M.; Polz-Dacewicz, M. Phytochemistry and biological activities of Polemonium caeruleum L. Phytochem. Lett. 2019, 30, 314–323. [Google Scholar] [CrossRef]
- Rutkowski, L. Polemonium caeruleum L. Wielosił błękitny. In Polska Czerwona Księga Roślin. Paprotniki i Rośliny Kwiatowe; Kaźmierczakowa, R., Zarzycki, K., Eds.; Instytut Botaniki im. W. Szafera PAN i Instytut Ochrony Przyrody PAN: Kraków, Poland, 2000; pp. 310–311. [Google Scholar]
- Grant, V.; Grant, K.A. Flower Pollination in the Phlox Family; Columbia University Press: New York, NY, USA; London, UK, 1965. [Google Scholar]
- Stpiczyńska, M.; Kamińska, M.; Zych, M. Nectary structure in dichogamous flowers of Polemonium caeruleum L. (Polemoniaceae). Acta Biol. Crac. 2012, 54, 61–68. [Google Scholar] [CrossRef]
- Chwil, M. The structure of some floral elements and the nectar production rate of Polemonium caeruleum L. Acta Agrobot. 2012, 63, 25–32. [Google Scholar] [CrossRef][Green Version]
- Bielecki, M. Nowe stanowisko Polemonium coeruleum (Polemoniaceae) w dolinie rzeki Łośnej koło Małogoszczy (Wyżyna Małopolska). Fragm. Florist. Geobot. Pol. 2010, 17, 245–252. [Google Scholar]
- Babczyńska-Sendek, B.; Henel, A. Kresowe stanowisko Polemonium coeruleum (Polemoniaceae) w okolicy Czarnego Lasu koło Szczekocin. Fragm. Florist. Geobot. Pol. 2011, 18, 184–188. [Google Scholar]
- Zych, M.; Werblan-Jakubiec, H. Nowe, liczne stanowisko Polemonium caeruleum (Polemoniaceae) na Mazowszu. Fragm. Florist. Geobot. 2004, 11, 400–402. [Google Scholar]
- Środoń, A. Polemonium caeruleum L. – rozmieszczenie współczesne oraz występowanie w plejstocenie Polski. Fragm. Florist. Geobot. 1973, 19, 9–21. [Google Scholar]
- Roguz, K.; Bajguz, A.; Gołębiewska, A.; Chmur, M.; Hill, L.; Kalinowski, P.; Schönenberger, J.; Stpiczyńska, M.; Zych, M. Functional diversity of nectary structure and nectar composition in the genus fritillaria (liliaceae). Front. Plant Sci. 2018, 24. [Google Scholar] [CrossRef]
- Kotowski, W.; Van Diggelen, R. Light as environmental filter in vegetation. J. Veg. Sci. 2004, 15, 583–594. [Google Scholar] [CrossRef]
- Kuhn, M. Building predictive models in R using the caret package. J. Stat. Softw. 2008, 28, 1–26. [Google Scholar] [CrossRef]


| Pop | Total Sugar [µg/µL] | Total AAs [pmol/µL] | r = S/(F + G) | Fructose [%] | Glucose [%] | Sucrose [%] | Maltose [%] | Lactose [%] | GLN [%] | GLU [%] | SER [%] | ILE [%] | PHE [%] | NVA [%] | % of EAAs |
|---|---|---|---|---|---|---|---|---|---|---|---|---|---|---|---|
| BIA | 200.13 b | 973.1 | 0.28 | 50.63 | 20.44 | 19.80 | 6.11 ab | 3.02 | 10.26 defg | 21.45 ab | 5.17 | 2.01 | 4.82 bc | 0.39 | 24.12 ab |
| BOB | 157.94 b | 252.6 | 0.20 | 49.14 | 26.60 | 15.12 | 6.61 a | 2.53 | 5.32 g | 16.95 bcd | 11.37 | 2.40 | 3.20 cdef | 0.20 | 16.36 bcde |
| CZL | 145.72 b | 110.2 | 0.74 | 36.50 | 18.94 | 41.05 | 1.94 ab | 1.57 | 11.44 cdefg | 10.73 de | 8.51 | 2.43 | 6.93 ab | 0.00 | 24.36 ab |
| DRO | 479.81 ab | 461.5 | 1.09 | 27.93 | 19.04 | 51.32 | 0.90 ab | 0.81 | 17.25 abcde | 12.64 cde | 11.64 | 1.59 | 1.76 fg | 0.33 | 10.25 de |
| KCZ | 276.20 b | 474.8 | 1.55 | 19.30 | 19.93 | 60.77 | 0.00 b | 0.00 | 11.21 cdefg | 11.74 cde | 6.91 | 2.29 | 4.14 bcde | 0.00 | 22.34 bc |
| KLE | 201.58 b | 216.3 | 1.86 | 20.25 | 14.77 | 64.98 | 0.00 b | 0.00 | 24.02 abc | 14.21 cde | 8.52 | 1.86 | 2.43 def | 1.05 | 16.42 bcde |
| KOP | 266.10 b | 117.7 | 0.66 | 33.92 | 22.22 | 37.23 | 3.46 ab | 3.17 | 6.42 efg | 18.61 abc | 9.28 | 1.39 | 4.10 bcde | 0.00 | 20.20 bcd |
| MAL | 149.26 b | 132.2 | 0.07 | 53.58 | 28.99 | 5.51 | 7.39 a | 4.53 | 5.82 fg | 14.37 cde | 8.48 | 2.44 | 4.73 bcd | 0.00 | 26.88 ab |
| ORZ | 1060.51 a | 328.8 | 1.03 | 26.32 | 23.00 | 50.68 | 0.00 b | 0.00 | 30.45 ab | 13.81 cde | 5.32 | 2.31 | 4.01 bcde | 1.19 | 16.42 bcde |
| ROS | 522.12 ab | 3416.3 | 0.63 | 35.73 | 20.02 | 34.87 | 4.50 ab | 4.88 | 29.17 ab | 23.34 a | 10.79 | 0.47 | 0.81 g | 0.17 | 8.38 e |
| SIE | 527.58 ab | 793.4 | 1.02 | 27.81 | 20.51 | 49.36 | 0.79 ab | 1.53 | 15.88 bcdef | 7.87 e | 11.83 | 3.23 | 2.92 cdef | 0.00 | 11.89 cde |
| SPN | 290.64 b | 133.2 | 0.72 | 30.95 | 26.55 | 41.33 | 0.75 ab | 0.42 | 5.33 fg | 8.17 e | 9.19 | 2.95 | 3.62 cde | 0.00 | 22.60 bc |
| WPN | 484.96 ab | 200.5 | 2.24 | 17.51 | 13.32 | 69.17 | 0.00 b | 0.00 | 19.76 abcd | 15.83 bcd | 6.55 | 1.35 | 9.07 a | 0.00 | 39.46 a |
| ZED | 1102.71 a | 823.1 | 1.61 | 21.97 | 16.19 | 61.43 | 0.38 ab | 0.03 | 33.49 a | 12.37 cde | 10.60 | 1.76 | 2.43 efg | 0.00 | 15.28 bcde |
| mean | 409.9 ± 344.8 | 590.3 ± 1006 | 1.1 ± 0.9 | 32.8 ± 14.4 | 21.0 ± 7.1 | 42.1 ± 22.7 | 2.5 ± 3.2 | 1.6 ± 2.1 | 15.8 ± 10.4 | 14.5 ± 4.8 | 9.0 ± 3.1 | 2.0 ± 0.7 | 3.9 ± 2.2 | 0.2 ± 0.4 | 19.5 ± 8.5 |
| p | 0.043 | ns | 0.040 | ns | ns | 0.023 | 0.025 | ns | 0.000 | 0.000 | ns | ns | 0.000 | ns | 0.046 |
| Sex Phase | Total Sugar [µg/µL] | Total AAs [pmol/µL] | r = S/(F + G) | Fructose [%] | Glucose [%] | Sucrose [%] | EAAs [%] |
|---|---|---|---|---|---|---|---|
| M | 400.9 ± 403.4 | 762.6 ± 1325 | 1.10 ± 0.5 * | 28.23 ± 14.2 | 17.96 ± 7.7 * | 50.34 ± 22.3 * | 17.70 ± 7.2 |
| F | 419.7 ± 283.8 | 405.7 ± 467.4 | 0.73 ± 0.4 * | 37.8 ± 13.4 | 24.16 ± 4.7 * | 33.23 ± 20.2 * | 21.48 ± 9.5 |
| TC Biomass | TN Biomass | TK Biomass | TP Biomass | Ca Soil | Fe Soil | |||||||
|---|---|---|---|---|---|---|---|---|---|---|---|---|
| Estimate | Std. Error | Estimate | Std. Error | Estimate | Std. Error | Estimate | Std. Error | Estimate | Std. Error | Estimate | Std. Error | |
| Total sugar [ug/uL] | 57.406 | 50.168 | −90.250 | 122.435 | 94.622 | 113.410 | 1872.687 | 991.600 | −53.469 | 153.980 | −12.357 | 49.731 |
| Fructose [%] | −0.555 | 2.693 | 0.781 | 5.976 | 4.048 | 6.006 | 16.026 | 48.742 | 3.136 | 7.387 | −1.367 | 2.258 |
| Glucose [%] | −0.054 | 1.477 | 0.171 | 2.785 | 0.281 | 3.190 | −7.378 | 22.373 | 3.744 | 3.344 | −1.240 | 0.937 |
| Sucrose [%] | 0.274 | 4.007 | −2.075 | 9.169 | −7.747 | 8.977 | −12.987 | 74.689 | −7.099 | 11.394 | 2.320 | 3.542 |
| Maltose [%] | −0.00001 | 0.005 | 0.009 | 0.012 | 0.012 | 0.012 | 0.020 | 0.100 | 0.002 | 0.015 | 0.001 | 0.005 |
| Lactose [%] | −0.003 | 0.004 | 0.008 | 0.008 | 0.006 | 0.009 | −0.061 | 0.068 | −0.005 | 0.010 | 0.003 | 0.003 |
| Total AAs [pmol/uL] | −137.005 | 183.533 | −357.063 | 366.971 | −380.308 | 401.647 | −2436.125 | 2978.642 | −684.877 | 445.451 | 289.963 * | 128.893 |
| GLN [%] | 0.006 | 0.014 | 0.017 | 0.034 | −0.037 | 0.031 | 0.188 | 0.274 | −0.055 | 0.043 | 0.023 | 0.014 |
| GLU [%] | −0.0003 | 0.006 | −0.004 | 0.016 | 0.005 | 0.015 | −0.111 | 0.131 | −0.037 | 0.021 | 0.006 | 0.007 |
| SER [%] | −0.004 | 0.006 | 0.006 | 0.011 | −0.026 * | 0.013 | −0.200 * | 0.089 | −0.028 * | 0.013 | 0.007 | 0.004 |
| PHE [%] | −0.004 | 0.003 | 0.003 | 0.007 | −0.001 | 0.007 | −0.071 | 0.060 | −0.005 | 0.009 | −0.002 | 0.003 |
| ILE [%] | 0.0003 | 0.001 | −0.001 | 0.003 | −0.006 | 0.003 | 0.003 | 0.025 | 0.003 | 0.004 | −0.002 | 0.001 |
| NVA [%] | −0.0003 | 0.0005 | −0.001 | 0.001 | −0.003 ** | 0.001 | 0.022 * | 0.010 | −0.0003 | 0.002 | −0.00004 | 0.001 |
| Trait 1 | Trait 2 | r |
|---|---|---|
| Frequency of visits by Bombus spp. | TRP [%] | −0.80 |
| LYS [%] | −0.79 | |
| Frequency of visits by A. mellifera | NVA [%] | 0.81 |
| Frequency of visits by Syrphidae | glucose [%] | 0.85 |
| Total AAs [pmol/uL] | −0.78 | |
| GLY [%] | 0.85 | |
| Frequency of visits by Lepidoptera | glucose [%] | 0.93 |
| Total AAs [pmol/uL] | −0.93 | |
| ALA [%] | 0.92 | |
| BABA [%] | 0.82 | |
| TYR [%] | 0.85 | |
| AABA [%] | −0.86 | |
| VAL [%] | 0.85 |
© 2020 by the authors. Licensee MDPI, Basel, Switzerland. This article is an open access article distributed under the terms and conditions of the Creative Commons Attribution (CC BY) license (http://creativecommons.org/licenses/by/4.0/).
Share and Cite
Ryniewicz, J.; Skłodowski, M.; Chmur, M.; Bajguz, A.; Roguz, K.; Roguz, A.; Zych, M. Intraspecific Variation in Nectar Chemistry and Its Implications for Insect Visitors: The Case of the Medicinal Plant, Polemonium Caeruleum L. Plants 2020, 9, 1297. https://doi.org/10.3390/plants9101297
Ryniewicz J, Skłodowski M, Chmur M, Bajguz A, Roguz K, Roguz A, Zych M. Intraspecific Variation in Nectar Chemistry and Its Implications for Insect Visitors: The Case of the Medicinal Plant, Polemonium Caeruleum L. Plants. 2020; 9(10):1297. https://doi.org/10.3390/plants9101297
Chicago/Turabian StyleRyniewicz, Justyna, Mateusz Skłodowski, Magdalena Chmur, Andrzej Bajguz, Katarzyna Roguz, Agata Roguz, and Marcin Zych. 2020. "Intraspecific Variation in Nectar Chemistry and Its Implications for Insect Visitors: The Case of the Medicinal Plant, Polemonium Caeruleum L." Plants 9, no. 10: 1297. https://doi.org/10.3390/plants9101297
APA StyleRyniewicz, J., Skłodowski, M., Chmur, M., Bajguz, A., Roguz, K., Roguz, A., & Zych, M. (2020). Intraspecific Variation in Nectar Chemistry and Its Implications for Insect Visitors: The Case of the Medicinal Plant, Polemonium Caeruleum L. Plants, 9(10), 1297. https://doi.org/10.3390/plants9101297