Article

The Kinetics of Mesophyll Conductance and Photorespiration During Light Induction

1
Kunming Institute of Botany, Chinese Academy of Sciences, Kunming 650201, China
2
Yunnan Academy of Forestry and Grassland, Kunming 650201, China
3
University of Chinese Academy of Sciences, Beijing 100049, China
*
Author to whom correspondence should be addressed.
Plants 2025, 14(6), 850; https://doi.org/10.3390/plants14060850
Submission received: 23 January 2025 / Revised: 28 February 2025 / Accepted: 6 March 2025 / Published: 8 March 2025
(This article belongs to the Section Plant Physiology and Metabolism)

Abstract

Mesophyll conductance to CO2 (gm) act as a significant limiting factor influencing the CO2 assimilation rate (AN) during photosynthetic induction. However, the effect of vapor pressure deficit (VPD) on gm kinetics during light induction is not well clarified. We combined gas exchange with chlorophyll fluorescence measurements to assess the induction kinetics of gm during light induction under contrasting vapor pressure deficit (VPD) in two tree species with different stomatal conductance (gs) behavior, Catalpa fargesii and Pterocarya stenoptera. Our results revealed three key findings: (1) the coordination of gm and gs kinetics during light induction occurred in C. fargesii but not in P. stenoptera, and the model of gs kinetics largely determines whether the coordination of gs and gm exist in a given species; (2) a high VPD induced simultaneous changes in gs and gm kinetics in C. fargesii but had separated effects on gs and gm kinetics in P. stenoptera, indicating that the response of gm kinetics during light induction to VPD differs between species; and (3) the relative contribution of photorespiration to total electron flow was flexible in response to the change in relative diffusional and biochemical limitations, pointing out that photorespiration has a significant role in the regulation of photosynthetic electron flow during light induction. These results provide new sight into the species-dependent kinetics of gm and photorespiration during light induction.

1. Introduction

In natural environments, plants experience rapid fluctuations in light intensity on their leaves due to various factors such as shading by neighboring vegetation, cloud cover, and wind-induced changes in leaf orientation. These fluctuations can occur within seconds to minutes and significantly impact photosynthetic processes [1,2,3]. When plants transition from shade to direct sunlight, photosynthesis enters an induction phase, characterized by a gradual increase in the rate of photosynthesis until a new steady state is achieved [4,5,6]. The duration of this induction period, which can range from a few minutes to several tens of minutes, is influenced by plant species, prior light exposure, and environmental conditions [7]. This dynamic response in photosynthesis is crucial for carbon fixation and, ultimately, plant growth [8,9,10,11].
Many previous studies have demonstrated that in fluctuating light environments, the induction phase of photosynthesis can significantly reduce daily carbon assimilation in many crop species compared to an ideal scenario where photosynthetic rates achieve a steady state immediately following a change in light intensity [3,8,12,13]. This highlights the critical importance of understanding the physiological mechanisms underlying photosynthetic induction to potentially improve crop yield [14,15,16,17,18]. The induction process, particularly following a transition from low to high light, is primarily governed by three key physiological processes: the induction rate of photosynthetic electron transport in the thylakoid membrane, the activation of Calvin–Benson cycle enzymes (notably Rubisco), and CO2 diffusion conductance.
Photosynthetic electron transport induction is a rapid process that significantly limits photosynthetic efficiency only within the first 1–2 min after the onset of light induction [19]. In contrast, Rubisco activity limits photosynthetic efficiency over a longer period, as it takes 5–20 min for Rubisco to reach its maximum activity level after illumination [20,21]. CO2 diffusion conductance involves two sequential components along the CO2 diffusion pathway: stomatal conductance (gs) from the leaf surface to the intercellular spaces and mesophyll conductance (gm), from the intercellular spaces to the carboxylation sites within the chloroplasts [22]. Over the past decade, research has focused on stomatal kinetics and their impact on photosynthetic induction, revealing significant variations in stomatal opening speeds among and within species [5,23,24,25]. Stomatal conductance typically takes much longer to reach a steady state (from tens of minutes to over an hour) compared to the activation of Rubisco [26,27,28,29]. The slow induction of gs imposes a significant limitation on photosynthesis in some crops, such as African cassava germplasm and tomato species [17].
Compared to the well-studied stomatal limitation, the impact of gm on photosynthetic induction is less understood. Studies measuring gm at different light levels suggest that gm generally increases in response to short-term irradiance increases in a range of plant species, with some exceptions [25,30,31,32,33,34]. However, the response of gm to a light shift is not equivalent to its induction kinetics. Only a few studies have attempted to track the time course of gm during light induction in model herbaceous species such as Arabidopsis [4,20], tobacco [4,20], and tomato [35,36,37]. These results indicated that the full induction of gm requires approximately 7–20 min, which imposes a significant limitation on photosynthesis during light induction. In contrast, the nonsteady-state kinetics of gm in response to light induction remains poorly understood in tree species.
A recent study indicated that in the “open stomata” mutant (ost1) of Arabidopsis, enhanced gs during light induction was accompanied by a more rapid induction rate of gm, leading to higher photosynthetic efficiency under fluctuating light [4]. Conversely, tomato plants with nitrogen deficiency exhibited simultaneous delays in the induction speeds of both gs and gm after transitioning from low to high light [37]. Under drought stress, the decrease in gs is associated with a slower induction rate of gm in tomato plants, thereby restricting photosynthetic efficiency during light induction [35,36]. These results suggest that during light induction, the kinetics of gs significantly influence the induction speed of gm. However, the hypothesis that gs and gm kinetics are coordinated during light induction requires further investigation.
Fluctuating light is often accompanied by variations in vapor pressure deficit (VPD) due to diurnal changes in air temperature and relative humidity. VPD is an important environmental factor that affects steady-state photosynthesis primarily by influencing gs [38,39,40]. Additionally, high VPD conditions can restrict photosynthesis under fluctuating light by decreasing both the absolute value and the induction rate of gs [40,41]. Some studies have reported that elevated VPD induces simultaneous decreases in gs and gm under fluctuating light in species such as tomato and rose [40,41]. However, the effects of changing VPD on gm kinetics in tree species remain poorly understood. Moreover, it is unclear whether the coordination of gs and gm kinetics during light induction can be altered by changes in VPD. Future research should focus on elucidating these interactions to better understand how VPD influences photosynthetic efficiency under dynamic light conditions.
Within the first minutes after transitioning from low to high light, relatively low diffusional conductance results in a reduced chloroplast CO2 concentration [20]. This, in turn, leads to a decreased rate of CO2 assimilation, which induces a decline in the ADP/ATP ratio. The reduced ADP/ATP ratio can inactivate chloroplast ATP synthase [42]. Concurrently, the low chloroplast CO2 concentration makes photorespiration a significant primary metabolic pathway. Photorespiration consumes a substantial fraction of ATP and NADPH, thereby preventing the feedback inhibition of chloroplast ATP synthase [43]. Therefore, photorespiration may play a crucial role in regulating the photosynthetic electron transport rate during light induction [44]. While the response of photorespiration to light intensity has been studied at a steady state, few investigations have examined the temporal dynamics of photorespiration following an immediate transition from low to high light [45,46].
In the present study, we combined measurements of gas exchange and chlorophyll fluorescence to estimate the kinetics of gm during light induction in two tree species with different gs behaviors. The main aims were to (1) examine whether the coordination of gs and gm during light induction is affected by gs behavior; (2) characterize the effect of VPD on gm kinetics during photosynthetic induction; and (3) quantify the relationship between photorespiration and gm kinetics during light induction.

2. Results

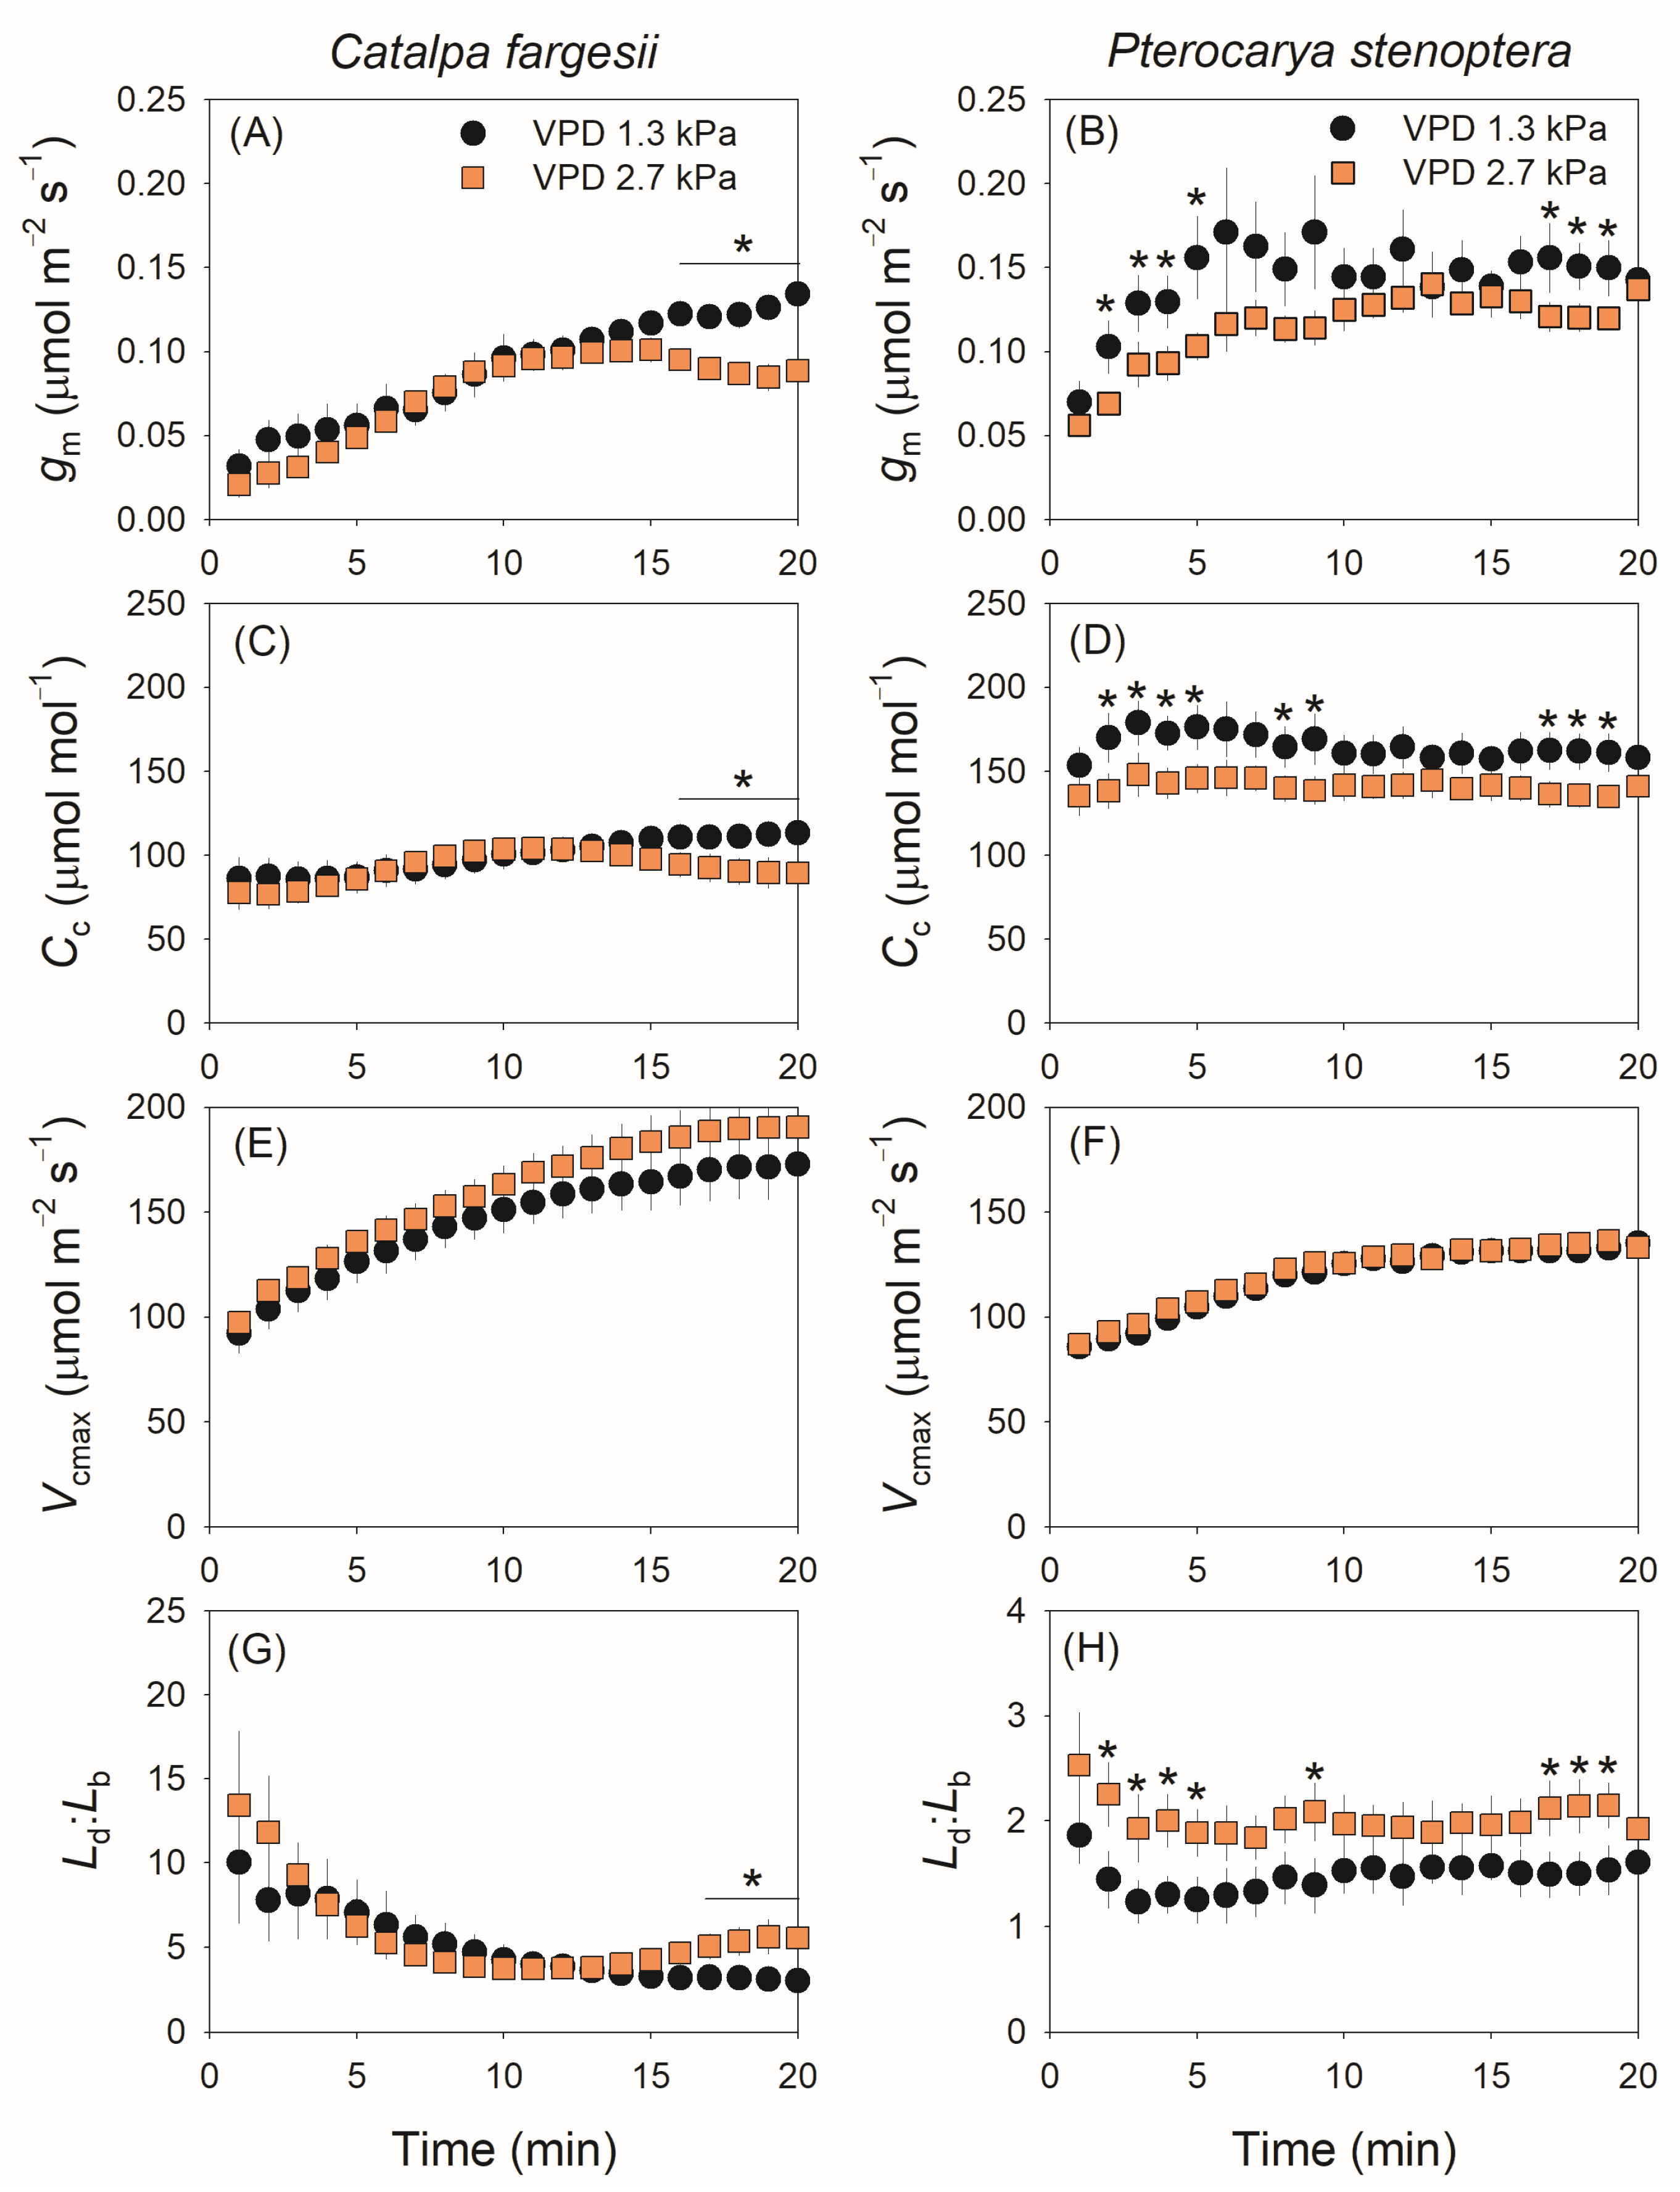
2.1. The Response of The Induction Kinetics of CO2 Assimilation, gs and gm to VPD

We first measured the gs kinetics in fluctuating light at a moderate VPD of 1.3 kPa. Upon the transfer from high to low light, gs gradually decreased in C. fargesii with an exponential decline model (Figure 1A). By comparison, in the other species P. stenoptera, gs largely decreased in the first minute and then gradually decreased with a linear model (Figure 1B). After the transition from low to high light, gs gradually increased in C. fargesii with a model of exponential rise to the maximum (Figure 1A), whereas gs largely increased in the first minute and then gradually increased with a linear model (Figure 1B). Therefore, these two tree species showed different gs kinetics model in fluctuating light.
When the vapor pressure deficit (VPD) increased from 1.3 to 2.7 kPa, the gs kinetics during light induction were altered in both species. In C. fargesii, gs first increased to a peak in 10 min and then gradually decreased to a lower steady-state value. By comparison, in P. stenoptera the absolute value of gs was depressed over time. The kinetics of the net CO2 assimilation rate (AN) showed similar trends to gs in both species (Figure 1C,D). In C. fargesii, AN gradually increased to the steady-state value at 1.3 kPa VPD but first increased to a peak and then gradually decreased at 2.7 kPa VPD, leading to a lower steady-state AN at 2.7 kPa than at 1.3 kPa. In P. stenoptera, AN gradually increased to the steady-state value during light induction, and the absolute value was substantially depressed by the high VPD condition. However, the increased VPD condition had no significant effect on photosynthetic electron transport rate (ETR) during light induction (Figure 1E,F).
During light induction, the kinetics of gm was altered by the high vapor pressure deficit in both species. In C. fargesii, gm gradually increased in the light induction period (20 min) at 1.3 kPa VPD but first increased to a peak in 15 min and then slightly decreased at 2.7 kPa VPD (Figure 2A). In P. stenoptera, gm gradually increased to its peak in approximately 6 and 13 min at 1.3 and 2.7 kPa VPD conditions, respectively, and then remained stable (Figure 2B). Compared with 1.3 kPa VPD, the steady-state value of gm at 2.7 kPa VPD was depressed in C. fargesii but remained stable in P. stenoptera (Figure 2A,B). The kinetics of chloroplast CO2 concentration (Cc) in light induction showed a similar response to VPD as well as gm (Figure 2C,D). By comparison, the rise in VPD hardly affected the kinetics of the Rubisco carboxylation rate (Vcmax) in both species (Figure 2E,F). Owing to the different effects of VPD on CO2 diffusion and Vcmax, the ratio between diffusional and biochemical photosynthesis limitations (Ld:Lb) at 2.7 kPa VPD substantially increased at a steady state in C. fargesii (Figure 2G) and increased in P. stenoptera during light induction (Figure 2H).

2.2. Correlation Between gs and gm During Light Induction

The relationships between gs, gm and AN during the induction period are examined in Figure 3. In C. fargesii, AN was positively correlated to gs and gm (Figure 3A,C), and a coordination between gs and gm was observed (Figure 3E). In P. stenoptera, the relationship between AN and gs differed between 1.3 and 2.7 kPa VPD conditions and the same AN was accompanied by a much lower gs at 2.7 kPa VPD (Figure 3B). Similarly to C. fargesii, AN was tightly related to gm in P. stenoptera, especially at 2.7 kPa VPD (Figure 3D). The coordination between gs and gm in P. stenoptera was observed at 2.7 kPa VPD but disappeared at 1.3 kPa VPD, suggesting that the induction of gm was independent of gs in P. stenoptera.

2.3. The Time-Integrated Limitations of AN During Light Induction

At 60% relative humidity, the time-integrated limitations of gsstom), gmmesophyll), and biochemistry (σbiochem) during light induction were 45%, 42%, and 13%, respectively, in C. fargesii (Figure 4A). When the atmospheric VPD increased from 1.3 to 2.7 kPa, σstom, σmesophyll, and σbiochem changed to 30%, 58%, and 12%, respectively (Figure 4A). Therefore, CO2 diffusional conductance imposed a major limitation on AN during light induction in C. fargesii. In P. stenoptera, the values for σstom, σmesophyll, and σbiochem at 1.3 kPa VPD were 17%, 28%, and 56%, respectively; and they changed to 42%, 37%, and 21% at 2.7 kPa VPD, respectively. This result suggests that a high VPD shifted the major limitation of AN from biochemistry to CO2 diffusional conductance in P. stenoptera.

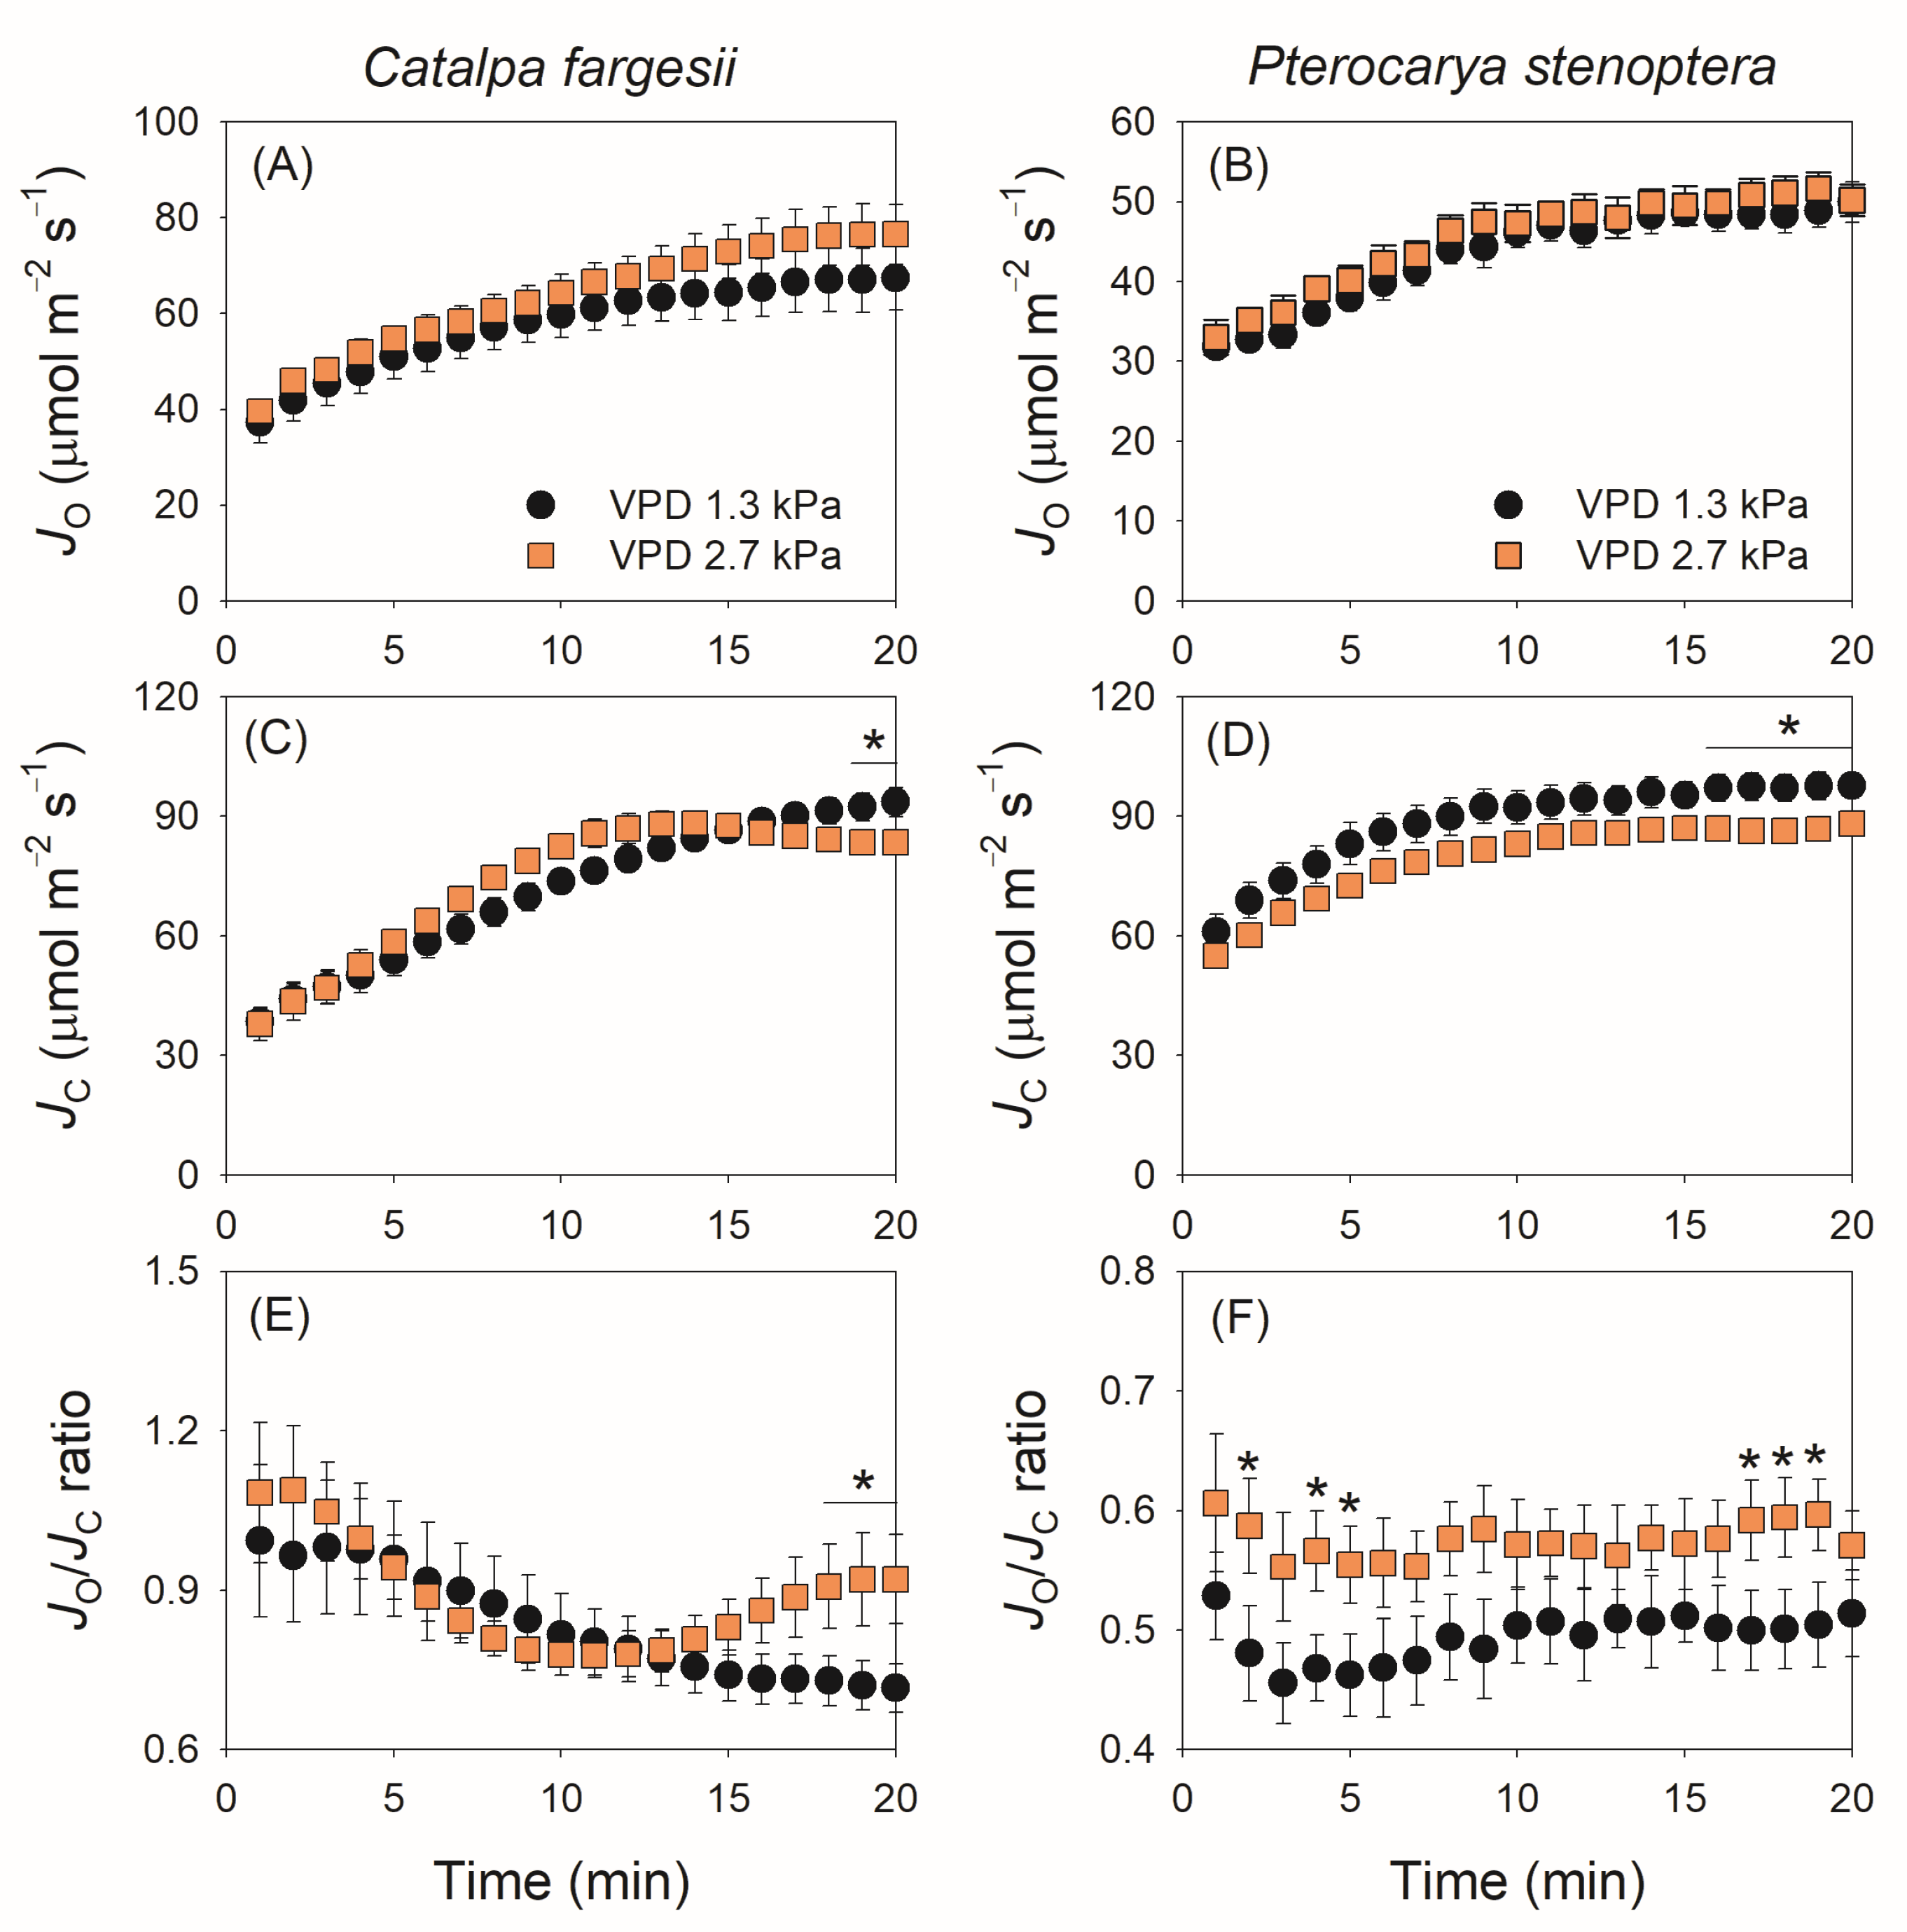
2.4. Induction Kinetics of Photorespiration

The kinetics of photorespiration is shown in Figure 5. Photosynthetic electron flow to Rubisco oxygenation (JO) gradually increased during light induction in both species, and the changing VPD did not significantly influence the kinetics of JO in them (Figure 5A,B). Similarly, the changing VPD slightly affected the kinetics of photosynthetic electron flow to Rubisco carboxylation (JC). In C. fargesii, JC gradually increased during the induction period (20 min) at 1.3 kPa VPD but reached the maximum in 12 min at 2.7 kPa VPD (Figure 5C). In P. stenoptera, the changing VPD condition did not alter the increase trend in JC but decreased the absolute value (Figure 5D). Owing to the different effects of changing VPD on JO and JC in C. fargesii, the JO/JC ratio gradually decreased at 1.3 kPa VPD but first decreased and then gradually increased at 2.7 kPa VPD (Figure 5E). As a result, after light induction for 20 min, the JO/JC ratio at 2.7 kPa VPD was substantially higher than that at 1.3 kPa VPD (Figure 5E). By comparison, in P. stenoptera, the JO/JC ratio remained stable at 0.5 and 0.6 during light induction under 1.3 and 2.7 kPa VPD conditions, respectively (Figure 5F). Plotting the data of JO/JC ratio and Ld:Lb indicated that a non-linear positive relationship was found (Figure 6). When Ld:Lb was extremely high within the first seconds after the transition to high light, photorespiration acted as a major electron sink to favor the operation of photosynthetic electron flow. When Ld:Lb was lowered at the later phase of light induction, the contribution of photorespiration to the total electron flow was diminished. Therefore, electron flow to photorespiration is flexible according to the change in Ld:Lb.

3. Discussion

3.1. Relationship Between gs and gm During Light Induction Is Species-Dependent

During light induction, gs gradually increases and imposes significant limitations on photosynthesis in model species such as Arabidopsis thaliana, tobacco, tomato and Aferican cassava [4,17,20,35,36]. A few studies have investigated the dynamic kinetics of gm during light induction; the results of these studies proposed a hypothesis that gs and gm coordinated to optimize photosynthesis during light induction [4,20]. We found that the tree species C. fargesii exhibited a fine coordination between gs and gm kinetics during light induction (Figure 3E). However, such a coordination between gs and gm disappeared in the other tree species P. stenoptera (Figure 3F), suggesting that the induction kinetics of gs is independent of that of gm in P. stenoptera. Therefore, coordination between gs and gm kinetics during light induction is not universal in angiosperms.
After the transition from low to high light, all studied angiosperms showed a similar trend of gm kinetics with a model of exponential increase to the maximum, as shown in Arabidopsis thaliana [4,20], tobacco [4,20], tomato [35], and the studied tree species C. fargesii and P. stenoptera (Figure 2A,B). However, the model of gs kinetics during light induction varied between species. Generally, there are three different models of gs kinetics during light induction among angiosperms: (1) an exponential increase to the maximum, as shown in Arabidopsis thaliana [4,20], tobacco [20], and the studied tree species C. fargesii (Figure 1C), (2) a sigmoidal increase to the maximum, as shown in tomato [35,37], and (3) a rapid increase in the first minute and then a gradual increase with a linear model, as shown in the studied tree species P. stenoptera (Figure 1D). Apparently, in P. stenoptera, the different induction models of gs and gm led to the discoordination between gs and gm during light induction. Therefore, the model of gs kinetics largely determines whether the coordination of gs and gm exist in a given species.

3.2. Differential Effects of VPD on gm Kinetics During Light Induction

A high VPD can delay the induction rate of photosynthetic CO2 assimilation. One explanation is that a high VPD slows the induction rate of gs [5,40,41], but the effect of VPD on gm kinetics during light induction is not well understood [41]. Here, we found that the response of gm kinetics to VPD was similar to that of gs in C. fargesii (Figure 1C and Figure 2A). In detail, under the high VPD condition, gm first gradually increased to its peak and then gradually decreased to the steady state, with a significantly lower steady-state value than that under the low VPD condition (Figure 2A). By comparison, a high VPD had different effects on the induction kinetics of gs and gm in P. stenoptera (Figure 1D and Figure 2B). Specifically, a high VPD just delayed the induction rate of gm but did not significantly affect the steady-state value (Figure 2B). Therefore, the response of gm kinetics during light induction to VPD differs between species.
In the tree species P. stenoptera, gs imposed a minor limitation on AN during light induction at a low VPD but acted as a major limitation at a high VPD (Figure 4B). By comparison, the limitation of gm imposed on AN just increased slightly under the high VPD condition (Figure 4B). Furthermore, the same value of AN during light induction was accompanied with a lower gs when illuminated at a high VPD (Figure 3B). As a result, the intrinsic water use efficiency (WUEi) was enhanced at a high VPD compared to a low VPD. Concomitantly, the maximum velocity of Rubisco carboxylation (Vcmax) was not altered by the increase in VPD (Figure 2F). Therefore, such an increase in dynamic WUEi under the high VPD condition could not be explained by the change in Vcmax. Alternatively, the dynamic gm was slightly affected by the increase in VPD, which compensated for the large decrease in gs. Consequently, the extent of the decrease in chloroplast CO2 concentration (Cc) under the high VPD condition was much lower than that of gs (Figure 1D and Figure 2D), which was accompanied by a slight decrease in AN (Figure 1B). Therefore, the insusceptibility of gm kinetics to VPD has the potential to increase WUEi under high VPD conditions.

3.3. Modulation of Photorespiration in Response to Photosynthetic Limitation

Here, we found that within the first few minutes after the transition to high light, photorespiration was a major alternative electron sink in the C. fargesii, with the JO/JC ratio being approximately 1.0 (Figure 5E). By comparison, the JO/JC ratio was substantially lower in P. stenoptera than in C. fargesii (Figure 5E). Therefore, the contribution of photorespiration to total electron flow during light induction significantly differed between C. fargesii and P. stenoptera. Photorespiration is determined by Rubisco activity and chloroplast CO2 concentration (Cc). As shown in Figure 2, the value of Vcmax was higher in C. fargesii than in P. stenoptera, while the value of Cc was lower in C. fargesii than in P. stenoptera. Therefore, the higher JO/JC in C. fargesii than in P. stenoptera was mainly caused by their differences in Rubisco activity and chloroplast CO2 concentration.
In addition, we found a non-linear positive relationship between the JO/JC ratio and Ld:Lb in these two studied species (Figure 6), indicating that the relative contribution of photorespiration to total electron flow was flexible in response to the change in relative diffusional and biochemical limitations. When CO2 assimilation was limited by the high Ld:Lb within the first few minutes after the transition from low to high light, the restriction of CO2 assimilation increased the ATP/ADP and NADPH/NADP+ ratios, rendering chloroplast ATP synthase activity and electron transport from photosystem I to NADP+ limited [42]. Photorespiration consumes a significant fraction of ATP and NADPH to maintain the regeneration of RuBP [47] and consequently prevents the feedback inhibition of chloroplast ATP synthase activity and facilitates the operation of the electron downstream of photosystem I [43]. Consistently, photorespiration acted as the major electron sink pathway when Ld:Lb was extreme high. Alternatively, when CO2 assimilation operated efficiently under low Ld:Lb conditions, the contribution of photorespiration to total electron flow was diminished. Therefore, photorespiration has a significant role in the regulation of photosynthetic electron flow during light induction.

4. Materials and Methods

4.1. Plant Materials and Growing Conditions

In this study, we used the seedlings of two tree species with different stomatal conductance (gs) behavior, Catalpa fargesii and Pterocarya stenoptera. They are deciduous, arboreal trees native to the subtropical regions of southwestern China. The two tree species are light-demanding and typically thrive under full sunlight. Therefore, they have similar light requirements. All plants were cultivated in greenhouses in Kunming, Yunnan, China. The day/night temperature is 30/20 °C, the relative humidity is about 60%, and the maximum light intensity to which leaves are exposed is approximately 1000 μmol photons m−2 s−1. To avoid any water and nutrient stress, plants were cultivated using a soilless substrate and drip irrigation techniques.

4.2. Gas Exchange and Chlorophyll Fluorescence Measurements

Leaves were exposed to high light (1500 µmol photons m−2 s−1, composed of 90% red light and 10% blue light) using the chlorophyll fluorescence probe of the LI-6400XT portable photosynthesis system for at least 30 min on a sunny summer morning. Steady-state data for gas exchange and chlorophyll fluorescence were then recorded. Subsequently, the light intensity was reduced to 100 µmol photons m−2 s−1 to simulate a sun-to-shade transition, lasting for 20 min. The light intensity was then returned to 1500 µmol photons m−2 s−1 to simulate a shade-to-sun transition, also lasting for 20 min. During both sun-to-shade and shade-to-sun transitions, data were recorded at 1-minute intervals. The air temperature was maintained at 25 °C, and the vapor pressure deficit (VPD) was controlled at 1.3 kPa (relative humidity of 60%) and 2.7 kPa (relative humidity of 15%) for different experimental conditions.
In our study, we utilized the multi-phase flash (MPF) protocol following standard procedures to determine the parameters of chlorophyll fluorescence [48]. The light intensity for the measurement was set at 1 µmol m−2 s−1, while the maximum flash intensity reached 8000 µmol m−2 s−1. During the second phase of the MPF, the flash intensity was reduced by 60%, with the three flash phases lasting 0.3 s, 0.7 s, and 0.4 s, respectively. Subsequently, we calculated the effective quantum yield of photochemistry for photosystem II (ΦPSII) and the total electron transport rate through photosystem II (ETR) using the following equations [49]:
Φ P S I I = F m F s F m
E T R = Φ P S I I × P P F D × 0.45
where PPFD represents the light intensity and 0.45 represents the proportion of light energy absorbed by leaves allocated to photosystem II [50].

4.3. Calculation of the Mesophyll Conductance

Mesophyll conductance (gm) was calculated by combining the gas exchange data and chlorophyll fluorescence data with the following equation [51]:
g m = A N C i Γ * ( E T R + 8 A N + R d ) / ( E T R 4 A N + R d )
where AN represents the net photosynthetic rate, Ci represents the intercellular CO2 concentration, Γ* represents the CO2 compensation point in the absence of mitochondrial respiration, and a typical value of 40 μmol mol−1 is used; Rd represents the dark respiration rate measured at night.
The chloroplast CO2 concentration (Cc) was calculated as follows [52,53]:
C c = C i A N g m
The maximum carboxylation rate of Rubisco (Vcmax) was calculated as follows [54]:
V c m a x = ( A N + R d ) ( C c + K c ( 1 + O / K o ) ) ( C c Γ * )
where Kc (404 μmol mol−1) and Ko (278 mmol mol−1) are the Rubisco Michaelis–Menten constants for CO2 and oxygen, respectively; O (210 mmol mol−1) is the oxygen concentration in the chloroplasts.

4.4. Quantitative Calculation of Photosynthetic Limitation

The quantitative calculation formula for the photosynthetic limiting factor is as follows [55]:
L s = g t o t / g s × A N / C c g t o t + A N / C c
L m = g t o t / g m × A N / C c g t o t + A N / C c
L b = g t o t g t o t + A N / C c
where Ls, Lm, and Lb represent the degree of the limitation of photosynthesis by gs, gm, and biochemical capacity, respectively, and gtot represents the overall CO2 diffusive conductance, with gtot and ∂AN/∂Cc calculated as follows, respectively:
g t o t = g s × g m g s + g m
A N / C c = V c m a x Γ * + K c ( 1 + O / K o ) ( C c + K c ( 1 + O / K o ) ) 2
The total CO2 diffusional limitation (Ld) was calculated as follows:
L d = L s + L m
The time-integrated relative limitations imposed by Vcmaxbiochem), gmmesophyll) and gsstom) during the 20 min light induction were calculated according to the detailed method described in [4].

4.5. Calculation of Electron Flow for Photorespiration

The rate of electron flow for photorespiration (JO) and Rubisco carboxylation (JC) were calculated according to the following equations [56]:
J O = 2 / 3 × ( E T R 4 × ( A N + R d ) )
J C = 1 / 3 × ( E T R + 8 × ( A N + R d ) )

4.6. Statistical Analysis

Six independent leaves from six different plants were used for each measurement. One-way ANOVA (the Tukey comparison test) was used to determine whether significant differences (α = 0.05) existed between the low and high VPD treatments. The software SigmaPlot 10.0 was used for graphing and fitting.

5. Conclusions

Our findings indicate that the coordination of gs and gm during light induction is determined by gs kinetics. The effect of VPD on gm kinetics during light induction is species-dependent. Concomitantly, the flexibility of photorespiration plays an important role in the regulation of photosynthetic electron flow in response to the kinetics of gm. Therefore, we call for more studies to investigate the role of photorespiration during light induction with the change in gm kinetics under environmental stresses.

Author Contributions

Conceptualization, W.H.; Methodology, N.L., J.C. and W.H.; Software, N.L. and W.H.; Validation, N.L.; Formal analysis, W.H.; Investigation, N.L., J.C., M.Y. and Y.L.; Resources, J.C.; Data curation, N.L.; Writing—original draft, W.H.; Project administration, W.H.; Funding acquisition, W.H. All authors have read and agreed to the published version of the manuscript.

Funding

This work was supported by the Major Science and Technology Projects in Yunnan Province (202202AE090012), by the National Natural Science Foundation of China (31971412, 32171505), and by the West Light Foundation of the Chinese Academy of Sciences.

Data Availability Statement

The raw data supporting the conclusions of this article will be made available by the authors on request.

Acknowledgments

The authors thank the biological technology open platform, the Kunming Institute of Botany, the Chinese Academy of Sciences, for the measurement of leaf nutrient contents.

Conflicts of Interest

The authors declare no conflicts of interest.

References

  1. Slattery, R.A.; Walker, B.J.; Weber, A.P.M.; Ort, D.R. The Impacts of Fluctuating Light on Crop Performance. Plant Physiol. 2018, 176, 990–1003. [Google Scholar] [CrossRef] [PubMed]
  2. Roden, J.S.; Pearcy, R.W. Photosynthetic Gas Exchange Response of Poplars to Steady-State and Dynamic Light Environments. Oecologia 1993, 93, 208–214. [Google Scholar] [CrossRef]
  3. Pearcy, R.W. Sunflecks and Photosynthesis in Plant Canopies. Annu. Rev. Plant Physiol. Plant Mol. Biol. 1990, 41, 421–453. [Google Scholar] [CrossRef]
  4. Liu, T.; Barbour, M.M.; Yu, D.; Rao, S.; Song, X. Mesophyll Conductance Exerts a Significant Limitation on Photosynthesis during Light Induction. New Phytol. 2022, 233, 360–372. [Google Scholar] [CrossRef]
  5. Kaiser, E.; Kromdijk, J.; Harbinson, J.; Heuvelink, E.; Marcelis, L.F.M. Photosynthetic Induction and Its Diffusional, Carboxylation and Electron Transport Processes as Affected by CO2 Partial Pressure, Temperature, Air Humidity and Blue Irradiance. Ann. Bot. 2017, 119, 191–205. [Google Scholar] [CrossRef]
  6. Kaiser, E.; Morales, A.; Harbinson, J. Fluctuating Light Takes Crop Photosynthesis on a Rollercoaster Ride. Plant Physiol. 2018, 176, 977–989. [Google Scholar] [CrossRef]
  7. Way, D.A.; Pearcy, R.W. Sunflecks in Trees and Forests: From Photosynthetic Physiology to Global Change Biology. Tree Physiol. 2012, 32, 1066–1081. [Google Scholar] [CrossRef] [PubMed]
  8. Kimura, H.; Hashimoto-Sugimoto, M.; Iba, K.; Terashima, I.; Yamori, W. Improved Stomatal Opening Enhances Photosynthetic Rate and Biomass Production in Fluctuating Light. J. Exp. Bot. 2020, 71, 2339–2350. [Google Scholar] [CrossRef]
  9. Kromdijk, J.; Głowacka, K.; Leonelli, L.; Gabilly, S.T.; Iwai, M.; Niyogi, K.K.; Long, S.P. Improving Photosynthesis and Crop Productivity by Accelerating Recovery from Photoprotection. Science 2016, 354, 857–861. [Google Scholar] [CrossRef]
  10. De Souza, A.P.; Burgess, S.J.; Doran, L.; Hansen, J.; Manukyan, L.; Maryn, N.; Gotarkar, D.; Leonelli, L.; Niyogi, K.K.; Long, S.P. Soybean Photosynthesis and Crop Yield Are Improved by Accelerating Recovery from Photoprotection. Science 2022, 377, 851–854. [Google Scholar] [CrossRef]
  11. Basso, L.; Sakoda, K.; Kobayashi, R.; Yamori, W.; Shikanai, T. Flavodiiron Proteins Enhance the Rate of CO2 Assimilation in Arabidopsis under Fluctuating Light Intensity. Plant Physiol. 2022, 189, 375–387. [Google Scholar] [CrossRef] [PubMed]
  12. Long, S.P.; Taylor, S.H.; Burgess, S.J.; Carmo-Silva, E.; Lawson, T.; De Souza, A.P.; Leonelli, L.; Wang, Y. Into the Shadows and Back into Sunlight: Photosynthesis in Fluctuating Light. Annu. Rev. Plant Biol. 2022, 73, 617–648. [Google Scholar] [CrossRef]
  13. Yamori, W.; Kusumi, K.; Iba, K.; Terashima, I. Increased Stomatal Conductance Induces Rapid Changes to Photosynthetic Rate in Response to Naturally Fluctuating Light Conditions in Rice. Plant. Cell Environ. 2020, 43, 1230–1240. [Google Scholar] [CrossRef]
  14. Acevedo-Siaca, L.G.; Coe, R.; Wang, Y.; Kromdijk, J.; Quick, W.P.; Long, S.P. Variation in Photosynthetic Induction between Rice Accessions and Its Potential for Improving Productivity. New Phytol. 2020, 227, 1097–1108. [Google Scholar] [CrossRef]
  15. Salter, W.T.; Merchant, A.M.; Richards, R.A.; Trethowan, R.; Buckley, T.N. Rate of Photosynthetic Induction in Fluctuating Light Varies Widely among Genotypes of Wheat. J. Exp. Bot. 2019, 70, 2787–2796. [Google Scholar] [CrossRef]
  16. Soleh, M.A.; Tanaka, Y.; Nomoto, Y.; Iwahashi, Y.; Nakashima, K.; Fukuda, Y.; Long, S.P.; Shiraiwa, T. Factors Underlying Genotypic Differences in the Induction of Photosynthesis in Soybean [Glycine max (L.) Merr.]. Plant Cell Environ. 2016, 39, 685–693. [Google Scholar] [CrossRef]
  17. De Souza, A.P.; Wang, Y.; Orr, D.J.; Carmo-Silva, E.; Long, S.P. Photosynthesis across African Cassava Germplasm Is Limited by Rubisco and Mesophyll Conductance at Steady State, but by Stomatal Conductance in Fluctuating Light. New Phytol. 2020, 225, 2498–2512. [Google Scholar] [CrossRef] [PubMed]
  18. Yoshiyama, Y.; Wakabayashi, Y.; Mercer, K.L.; Kawabata, S.; Kobayashi, T.; Tabuchi, T.; Yamori, W. Natural Genetic Variation in Dynamic Photosynthesis Is Correlated with Stomatal Anatomical Traits in Diverse Tomato Species across Geographical Habitats. J. Exp. Bot. 2024, 75, 6762–6777. [Google Scholar] [CrossRef] [PubMed]
  19. Yamori, W.; Makino, A.; Shikanai, T. A Physiological Role of Cyclic Electron Transport around Photosystem I in Sustaining Photosynthesis under Fluctuating Light in Rice. Sci. Rep. 2016, 6, 20147. [Google Scholar] [CrossRef]
  20. Sakoda, K.; Yamori, W.; Groszmann, M.; Evans, J.R. Stomatal, Mesophyll Conductance, and Biochemical Limitations to Photosynthesis during Induction. Plant Physiol. 2021, 185, 146–160. [Google Scholar] [CrossRef]
  21. Yamori, W.; Masumoto, C.; Fukayama, H.; Makino, A. Rubisco Activase Is a Key Regulator of Non-Steady-State Photosynthesis at Any Leaf Temperature and, to a Lesser Extent, of Steady-State Photosynthesis at High Temperature. Plant J. 2012, 71, 871–880. [Google Scholar] [CrossRef] [PubMed]
  22. Evans, J.R.; Kaldenhoff, R.; Genty, B.; Terashima, I. Resistances along the CO2 Diffusion Pathway inside Leaves. J. Exp. Bot. 2009, 60, 2235–2248. [Google Scholar] [CrossRef] [PubMed]
  23. Ögren, E.; Sundin, U. Photosynthetic Responses to Variable Light: A Comparison of Species from Contrasting Habitats. Oecologia 1996, 106, 18–27. [Google Scholar] [CrossRef] [PubMed]
  24. Zhang, Q.; Peng, S.; Li, Y. Increase Rate of Light-Induced Stomatal Conductance Is Related to Stomatal Size in the Genus Oryza. J. Exp. Bot. 2019, 70, 5259–5269. [Google Scholar] [CrossRef]
  25. Xiong, D.; Douthe, C.; Flexas, J. Differential Coordination of Stomatal Conductance, Mesophyll Conductance, and Leaf Hydraulic Conductance in Response to Changing Light across Species. Plant. Cell Environ. 2018, 41, 436–450. [Google Scholar] [CrossRef]
  26. Lawson, T.; Blatt, M.R. Stomatal Size, Speed, and Responsiveness Impact on Photosynthesis and Water Use Efficiency. Plant Physiol. 2014, 164, 1556–1570. [Google Scholar] [CrossRef]
  27. Faralli, M.; Matthews, J.; Lawson, T. Exploiting Natural Variation and Genetic Manipulation of Stomatal Conductance for Crop Improvement. Curr. Opin. Plant Biol. 2019, 49, 1–7. [Google Scholar] [CrossRef]
  28. McAusland, L.; Vialet-Chabrand, S.; Davey, P.; Baker, N.R.; Brendel, O.; Lawson, T. Effects of Kinetics of Light-induced Stomatal Responses on Photosynthesis and Water-use Efficiency. New Phytol. 2016, 211, 1209–1220. [Google Scholar] [CrossRef]
  29. Eyland, D.; van Wesemael, J.; Lawson, T.; Carpentier, S. The Impact of Slow Stomatal Kinetics on Photosynthesis and Water Use Efficiency under Fluctuating Light. Plant Physiol. 2021, 186, 998–1012. [Google Scholar] [CrossRef]
  30. Flexas, J.; Diaz-Espejo, A.; Galmés, J.; Kaldenhoff, R.; Medrano, H.; Ribas-Carbo, M. Rapid Variations of Mesophyll Conductance in Response to Changes in CO2 Concentration around Leaves. Plant Cell Environ. 2007, 30, 1284–1298. [Google Scholar] [CrossRef]
  31. Douthe, C.; Dreyer, E.; Epron, D.; Warren, C.R. Mesophyll Conductance to CO2, Assessed from Online TDL-AS Records of 13CO2 Discrimination, Displays Small but Significant Short-Term Responses to CO2 and Irradiance in Eucalyptus Seedlings. J. Exp. Bot. 2011, 62, 5335–5346. [Google Scholar] [CrossRef]
  32. Douthe, C.; Dreyer, E.; Brendel, O.; Warren, C.R. Is Mesophyll Conductance to CO2 in Leaves of Three Eucalyptus Species Sensitive to Short-Term Changes of Irradiance under Ambient as Well as Low O2? Funct. Plant Biol. 2012, 39, 435–448. [Google Scholar] [CrossRef]
  33. Xiong, D.; Liu, X.; Liu, L.; Douthe, C.; Li, Y.; Peng, S.; Huang, J. Rapid Responses of Mesophyll Conductance to Changes of CO2 Concentration, Temperature and Irradiance Are Affected by N Supplements in Rice. Plant Cell Environ. 2015, 38, 2541–2550. [Google Scholar] [CrossRef]
  34. Campany, C.E.; Tjoelker, M.G.; von Caemmerer, S.; Duursma, R.A. Coupled Response of Stomatal and Mesophyll Conductance to Light Enhances Photosynthesis of Shade Leaves under Sunflecks. Plant Cell Environ. 2016, 39, 2762–2773. [Google Scholar] [CrossRef] [PubMed]
  35. Sun, H.; Shi, Q.; Liu, N.-Y.; Zhang, S.-B.; Huang, W. Drought Stress Delays Photosynthetic Induction and Accelerates Photoinhibition under Short-Term Fluctuating Light in Tomato. Plant Physiol. Biochem. 2023, 196, 152–161. [Google Scholar] [CrossRef]
  36. Zeng, Z.-L.; Wang, X.-Q.; Zhang, S.-B.; Huang, W. Mesophyll Conductance Limits Photosynthesis in Fluctuating Light under Combined Drought and Heat Stresses. Plant Physiol. 2024, 194, 1498–1511. [Google Scholar] [CrossRef] [PubMed]
  37. Sun, H.; Zhang, Y.-Q.; Zhang, S.; Huang, W. Photosynthetic Induction Under Fluctuating Light Is Affected by Leaf Nitrogen Content in Tomato. Front. Plant Sci. 2022, 13, 835571. [Google Scholar] [CrossRef]
  38. Merilo, E.; Yarmolinsky, D.; Jalakas, P.; Parik, H.; Tulva, I.; Rasulov, B.; Kilk, K.; Kollist, H. Stomatal VPD Response: There Is More to the Story Than ABA. Plant Physiol. 2018, 176, 851–864. [Google Scholar] [CrossRef] [PubMed]
  39. Sancho-Knapik, D.; Mendoza-Herrer, Ó.; Alonso-Forn, D.; Saz, M.Á.; Martín-Sánchez, R.; dos Santos Silva, J.V.; Ogee, J.; Peguero-Pina, J.J.; Gil-Pelegrín, E.; Ferrio, J.P. Vapor Pressure Deficit Constrains Transpiration and Photosynthesis in Holm Oak: A Comparison of Three Methods during Summer Drought. Agric. For. Meteorol. 2022, 327, 109218. [Google Scholar] [CrossRef]
  40. Shi, Q.; Wang, X.; He, B.; Yang, Y.; Huang, W. Differential Impact of Decreasing Relative Humidity on Photosynthesis under Fluctuating Light between Maize and Tomato. Physiol. Plant 2024, 176, e14179. [Google Scholar] [CrossRef]
  41. Liu, N.-Y.; Yang, Q.-Y.; Wang, J.-H.; Zhang, S.-B.; Yang, Y.-J.; Huang, W. Differential Effects of Increasing Vapor Pressure Deficit on Photosynthesis at Steady State and Fluctuating Light. J. Plant Growth Regul. 2024, 43, 2329–2339. [Google Scholar] [CrossRef]
  42. Kanazawa, A.; Kramer, D.M. In Vivo Modulation of Nonphotochemical Exciton Quenching (NPQ) by Regulation of the Chloroplast ATP Synthase. Proc. Natl. Acad. Sci. USA 2002, 99, 12789–12794. [Google Scholar] [CrossRef] [PubMed]
  43. Smith, K.; Strand, D.D.; Kramer, D.M.; Walker, B.J. The Role of Photorespiration in Preventing Feedback Regulation via ATP Synthase in Nicotiana Tabacum. Plant Cell Environ. 2024, 47, 416–428. [Google Scholar] [CrossRef] [PubMed]
  44. Timm, S.; Sun, H.; Huang, W. Photorespiration—Emerging Insights into Photoprotection Mechanisms. Trends Plant Sci. 2024, xx, 1–4. [Google Scholar] [CrossRef]
  45. Shi, Q.; Sun, H.; Timm, S.; Zhang, S.; Huang, W. Photorespiration Alleviates Photoinhibition of Photosystem I under Fluctuating Light in Tomato. Plants 2022, 11, 195. [Google Scholar] [CrossRef]
  46. Huang, W.; Hu, H.; Zhang, S.-B. Photorespiration Plays an Important Role in the Regulation of Photosynthetic Electron Flow under Fluctuating Light in Tobacco Plants Grown under Full Sunlight. Front. Plant Sci. 2015, 6, 621. [Google Scholar] [CrossRef]
  47. Walker, B.J.; VanLoocke, A.; Bernacchi, C.J.; Ort, D.R. The Costs of Photorespiration to Food Production Now and in the Future. Annu. Rev. Plant Biol. 2016, 67, 107–129. [Google Scholar] [CrossRef]
  48. Loriaux, S.D.; Avenson, T.J.; Welles, J.M.; Mcdermitt, D.K.; Eckles, R.D.; Riensche, B.; Genty, B. Closing in on Maximum Yield of Chlorophyll Fluorescence Using a Single Multiphase Flash of Sub-Saturating Intensity. Plant Cell Environ. 2013, 36, 1755–1770. [Google Scholar] [CrossRef]
  49. Krall, J.P.; Edwards, G.E. Relationship between Photosystem II Activity and CO2 Fixation in Leaves. Physiol. Plant. 1992, 86, 180–187. [Google Scholar] [CrossRef]
  50. Yin, X.; Struik, P.C.; Romero, P.; Harbinson, J.; Evers, J.B.; VAN DER Putten, P.E.L.; Vos, J. Using Combined Measurements of Gas Exchange and Chlorophyll Fluorescence to Estimate Parameters of a Biochemical C Photosynthesis Model: A Critical Appraisal and a New Integrated Approach Applied to Leaves in a Wheat (Triticum aestivum) Canopy. Plant Cell Environ. 2009, 32, 448–464. [Google Scholar] [CrossRef]
  51. Harley, P.C.; Loreto, F.; Di Marco, G.; Sharkey, T.D. Theoretical Considerations When Estimating the Mesophyll Conductance to CO2 Flux by Analysis of the Response of Photosynthesis to CO2. Plant Physiol. 1992, 98, 1429–1436. [Google Scholar] [CrossRef] [PubMed]
  52. Yamori, W.; Evans, J.R.; Von Caemmerer, S. Effects of Growth and Measurement Light Intensities on Temperature Dependence of CO2 Assimilation Rate in Tobacco Leaves. Plant Cell Environ. 2010, 33, 332–343. [Google Scholar] [CrossRef]
  53. Warren, C.R.; Dreyer, E. Temperature Response of Photosynthesis and Internal Conductance to CO2: Results from Two Independent Approaches. J. Exp. Bot. 2006, 57, 3057–3067. [Google Scholar] [CrossRef] [PubMed]
  54. Moualeu-Ngangue, D.P.; Chen, T.; Stützel, H. A New Method to Estimate Photosynthetic Parameters through Net Assimilation Rate-Intercellular Space CO2 Concentration (A-Ci ) Curve and Chlorophyll Fluorescence Measurements. New Phytol. 2017, 213, 1543–1554. [Google Scholar] [CrossRef] [PubMed]
  55. Grassi, G.; Magnani, F. Stomatal, Mesophyll Conductance and Biochemical Limitations to Photosynthesis as Affected by Drought and Leaf Ontogeny in Ash and Oak Trees. Plant. Cell Environ. 2005, 28, 834–849. [Google Scholar] [CrossRef]
  56. Valentini, R.; Epron, D.; Angelis, P.D.E.; Matteucci, G.; Dreyer, E. In Situ Estimation of Net CO2 Assimilation, Photosynthetic Electron Flow and Photorespiration in Turkey Oak (Q. cerris L.) Leaves: Diurnal Cycles under Different Levels of Water Supply. Plant Cell Environ. 1995, 18, 631–640. [Google Scholar] [CrossRef]
Figure 1. Dynamic change in net CO2 assimilation rate (AN), stomatal conductance (gs), and electron transport rate (ETR) under fluctuating light for leaves of Catalpa fargesii (A,C,E) and Pterocarya stenoptera (B,D,F). Fluctuating light alternates between 1500 and 100 µmol m−2 s−1 every 20 min at 25 °C at different vapor pressure conditions (1.3 and 2.7 kPa). Data are means ± SE (n = 6). Asterisk indicates a significant difference between 1.3 and 2.7 kPa VPD conditions (Tukey comparison test, p < 0.05).
Plants 14 00850 g001
Figure 2. The dynamic change in mesophyll conductance (gm) and chloroplast CO2 concentration (Cc). The maximum carboxylation rate of Rubisco (Vcmax), and the ratio between diffusional and biochemical photosynthesis limitations (Ld:Lb) under fluctuating light for leaves of Catalpa fargesii (A,C,E,G) and Pterocarya stenoptera (B,D,F,H). Fluctuating light alternates between 1500 and 100 µmol m−2 s−1 every 20 min at 25 °C at different vapor pressure conditions (1.3 and 2.7 kPa). Data are means ± SE (n = 6). Asterisk indicates a significant difference between 1.3 and 2.7 kPa VPD conditions (Tukey comparison test, p < 0.05).
Plants 14 00850 g002
Figure 3. Relationship between net CO2 assimilation rate (AN), stomatal conductance (gs), and mesophyll conductance (gm) during light induction for leaves of Catalpa fargesii (A,C,E) and Pterocarya stenoptera (B,D,F). Data are means ± SE (n = 6).
Plants 14 00850 g003
Figure 4. The time-integrated relative limitations by gsstom), gmmesophyll) and Vcmaxbiochem) throughout photosynthetic induction for leaves of Catalpa fargesii (A) and Pterocarya stenoptera (B). Data are means ± SE (n = 6). The two extreme lines of the boxplot (whiskers) show the 10 and 90% percentiles, the two bounds of the box the 25 and 75% percentiles, and the center thick line the median. Dots represent independent data. The asterisk indicates a significant difference between 1.3 and 2.7 kPa VPD conditions (Tukey comparison test, p < 0.05).
Plants 14 00850 g004
Figure 5. Dynamic change in electron flow for Rubisco oxygenation (JO) and carboxylation (JC), and JO/JC ratio during light induction for leaves of Catalpa fargesii (A,C,E) and Pterocarya stenoptera (B,D,F). Data are means ± SE (n = 6). Asterisk indicates a significant difference between 1.3 and 2.7 kPa VPD conditions (Tukey comparison test, p < 0.05).
Plants 14 00850 g005
Figure 6. Relationship between Ld:Lb and JO/JC ratio during light induction for leaves of Catalpa fargesii and Pterocarya stenoptera. Data are means ± SE (n = 6).
Plants 14 00850 g006
Disclaimer/Publisher’s Note: The statements, opinions and data contained in all publications are solely those of the individual author(s) and contributor(s) and not of MDPI and/or the editor(s). MDPI and/or the editor(s) disclaim responsibility for any injury to people or property resulting from any ideas, methods, instructions or products referred to in the content.

