1. Introduction
Sweetness is a key quality trait in fleshy fruits, which is primarily determined by their soluble sugar content. These sugars serve three critical physiological functions: providing metabolic substrates for energy production and carbon skeletons, maintaining osmotic potential for cellular expansion through turgor pressure regulation, and functioning as signaling molecules that orchestrate developmental processes and mediate stress responses [
1,
2]. In fruit crops, sucrose, sorbitol, and occasionally trehalose or raffinose are synthesized in leaves (source organs) and transported to sink tissues such as fruits, tubers, and seeds [
2]. Notably, apple (
Malus domestica) predominantly transports sorbitol and sucrose [
3], while citrus varieties mainly utilize sucrose as the primary translocated sugar [
4].
The metabolic conversion of transported photosynthates in developing fruits primarily yields hexose sugars, particularly fructose and glucose, which form the biochemical basis for assimilate partitioning in sink tissues. In higher plants, this process is tightly regulated by two key enzymes:
FRK and
hexokinase (HXK). These enzymes serve as crucial gatekeepers of hexose phosphorylation and subsequent metabolic flux [
5]. Although both enzymes exhibit fructose phosphorylation capacity,
FRK demonstrates superior substrate specificity and catalytic efficiency for fructose compared to
HXK [
6,
7]. As the principal fructose-phosphorylating enzyme,
FRK catalyzes the irreversible conversion of fructose to fructose-6-phosphate (F6P), thereby establishing F6P as a central metabolic node in sink tissues [
8].
Extensive functional characterization of
FRKs across diverse fruit species has revealed their pivotal role in sugar metabolism regulation. Studies in satsuma mandarin (
Citrus unshiu) [
9], apple, and Japanese pear (
Pyrus pyrifolia) [
10] consistently demonstrate an inverse relationship between FRK activity decline and fructose accumulation during fruit maturation. This phenomenon reflects a conserved expression pattern where
FRK genes are predominantly expressed during early fruit development but downregulated during ripening phases. Such expression dynamics have been documented in multiple species, including
EjFRK in loquat (
Eriobotrya japonica) [
11],
MrFRK2 in Chinese bayberry (
Myrica rubra) [
12],
LbFRK7 in wolfberry (
Lycium barbarum) [
13],
HpFRK1 in red-fleshed pitaya (
Hylocereus undatus) [
14],
McFRK2 in noni (
Morinda citrifolia) [
15],
FaFRK3 in strawberry (
Fragaria ananassa) [
16], and
MdFRK2 in apple [
17].
Functional studies reveal that
FRKs can differentially regulate sugar metabolism. Overexpression of
MdFRK2 [
18] and
PbFRK1 [
19] in tomato (
Solanum lycopersicum) enhances FRK activity while reducing fructose, glucose, and sucrose levels, suggesting a role in sugar catabolism. Conversely,
PpyFRK5 in pear exhibits a positive correlation with sucrose accumulation. Transient overexpression of
PpyFRK5 significantly elevates the sucrose content, where its overexpression elevates while silencing diminishes the sucrose content, demonstrating its promotive role in sugar metabolism [
20].
Beyond their metabolic roles,
FRKs also play critical roles in organogenesis and stress responses. In tomato,
SlFRK1 and
SlFRK2 not only regulate flowering time but also significantly influence root architecture, stem elongation, and seed development [
21]. Notably,
LeFRK2 is essential for phloem and xylem differentiation, facilitating sugar and water transport [
22]. In apple,
MdFRK2 exhibits remarkable functional plasticity in abiotic stress responses, including its well-characterized role in salinity tolerance [
23]. Notably, under drought conditions, transgenic overexpression of
MdFRK2 promotes root system development through coordinated regulation of carbohydrate metabolism, hormone signaling, and osmotic adjustment, thereby improving drought resistance [
24].
Mango (
Mangifera indica L.), widely acclaimed as the ‘King of Tropical Fruits’, is particularly valued for its distinctive aroma and characteristically sweet, succulent flesh, with sweetness constituting a fundamental quality determinant in mango fruits. Its sugar accumulation pattern follows the typical model of early-stage starch accumulation followed by subsequent starch degradation into soluble sugars [
25]. The predominant soluble sugars in ripe mango fruit are sucrose, fructose, and glucose [
26]. In our previous study, we identified two
MiFRKs that may be involved in regulating the differential fructose content between the low-sugar mango cultivar ‘Renong No. 1’ and the high-sugar cultivar ‘Tainong No. 1’ [
27]. To further investigate their functions, this study conducted genetic transformation of these two
MiFRKs in tomato and analyzed the physiological characteristics and gene expression profiles of the transgenic tomato plants. The aim was to elucidate their roles in mango sugar metabolism and provide a theoretical basis for the foundation regulation of fruit sweetness.
2. Results
2.1. Comparative Analysis of MiFRK1 and MiFRK2 Genes in Two Mango Varieties
In our previous studies [
27], we successfully amplified the coding DNA sequences (CDSs) of
MiFRK1 and
MiFRK2 from the fruit pulp cDNA of two mango cultivars, ‘Renong No. 1’ and ‘Tainong No. 1’. Notably, the
MiFRK1 gene exhibited complete sequence identity between the two cultivars and was thus uniformly designated
MiFRK1 (
Figure S1). In contrast, the
MiFRK2 sequences displayed 12 nucleotide polymorphisms within the coding region, resulting in amino acid variations at positions 33, 87, 139, 252, 277, 293, and 317 (
Figures S2 and S3). Consequently, the two variants were designated
R-MiFRK2 (from ‘Renong No. 1’) and
T-MiFRK2 (from ‘Tainong No. 1’).
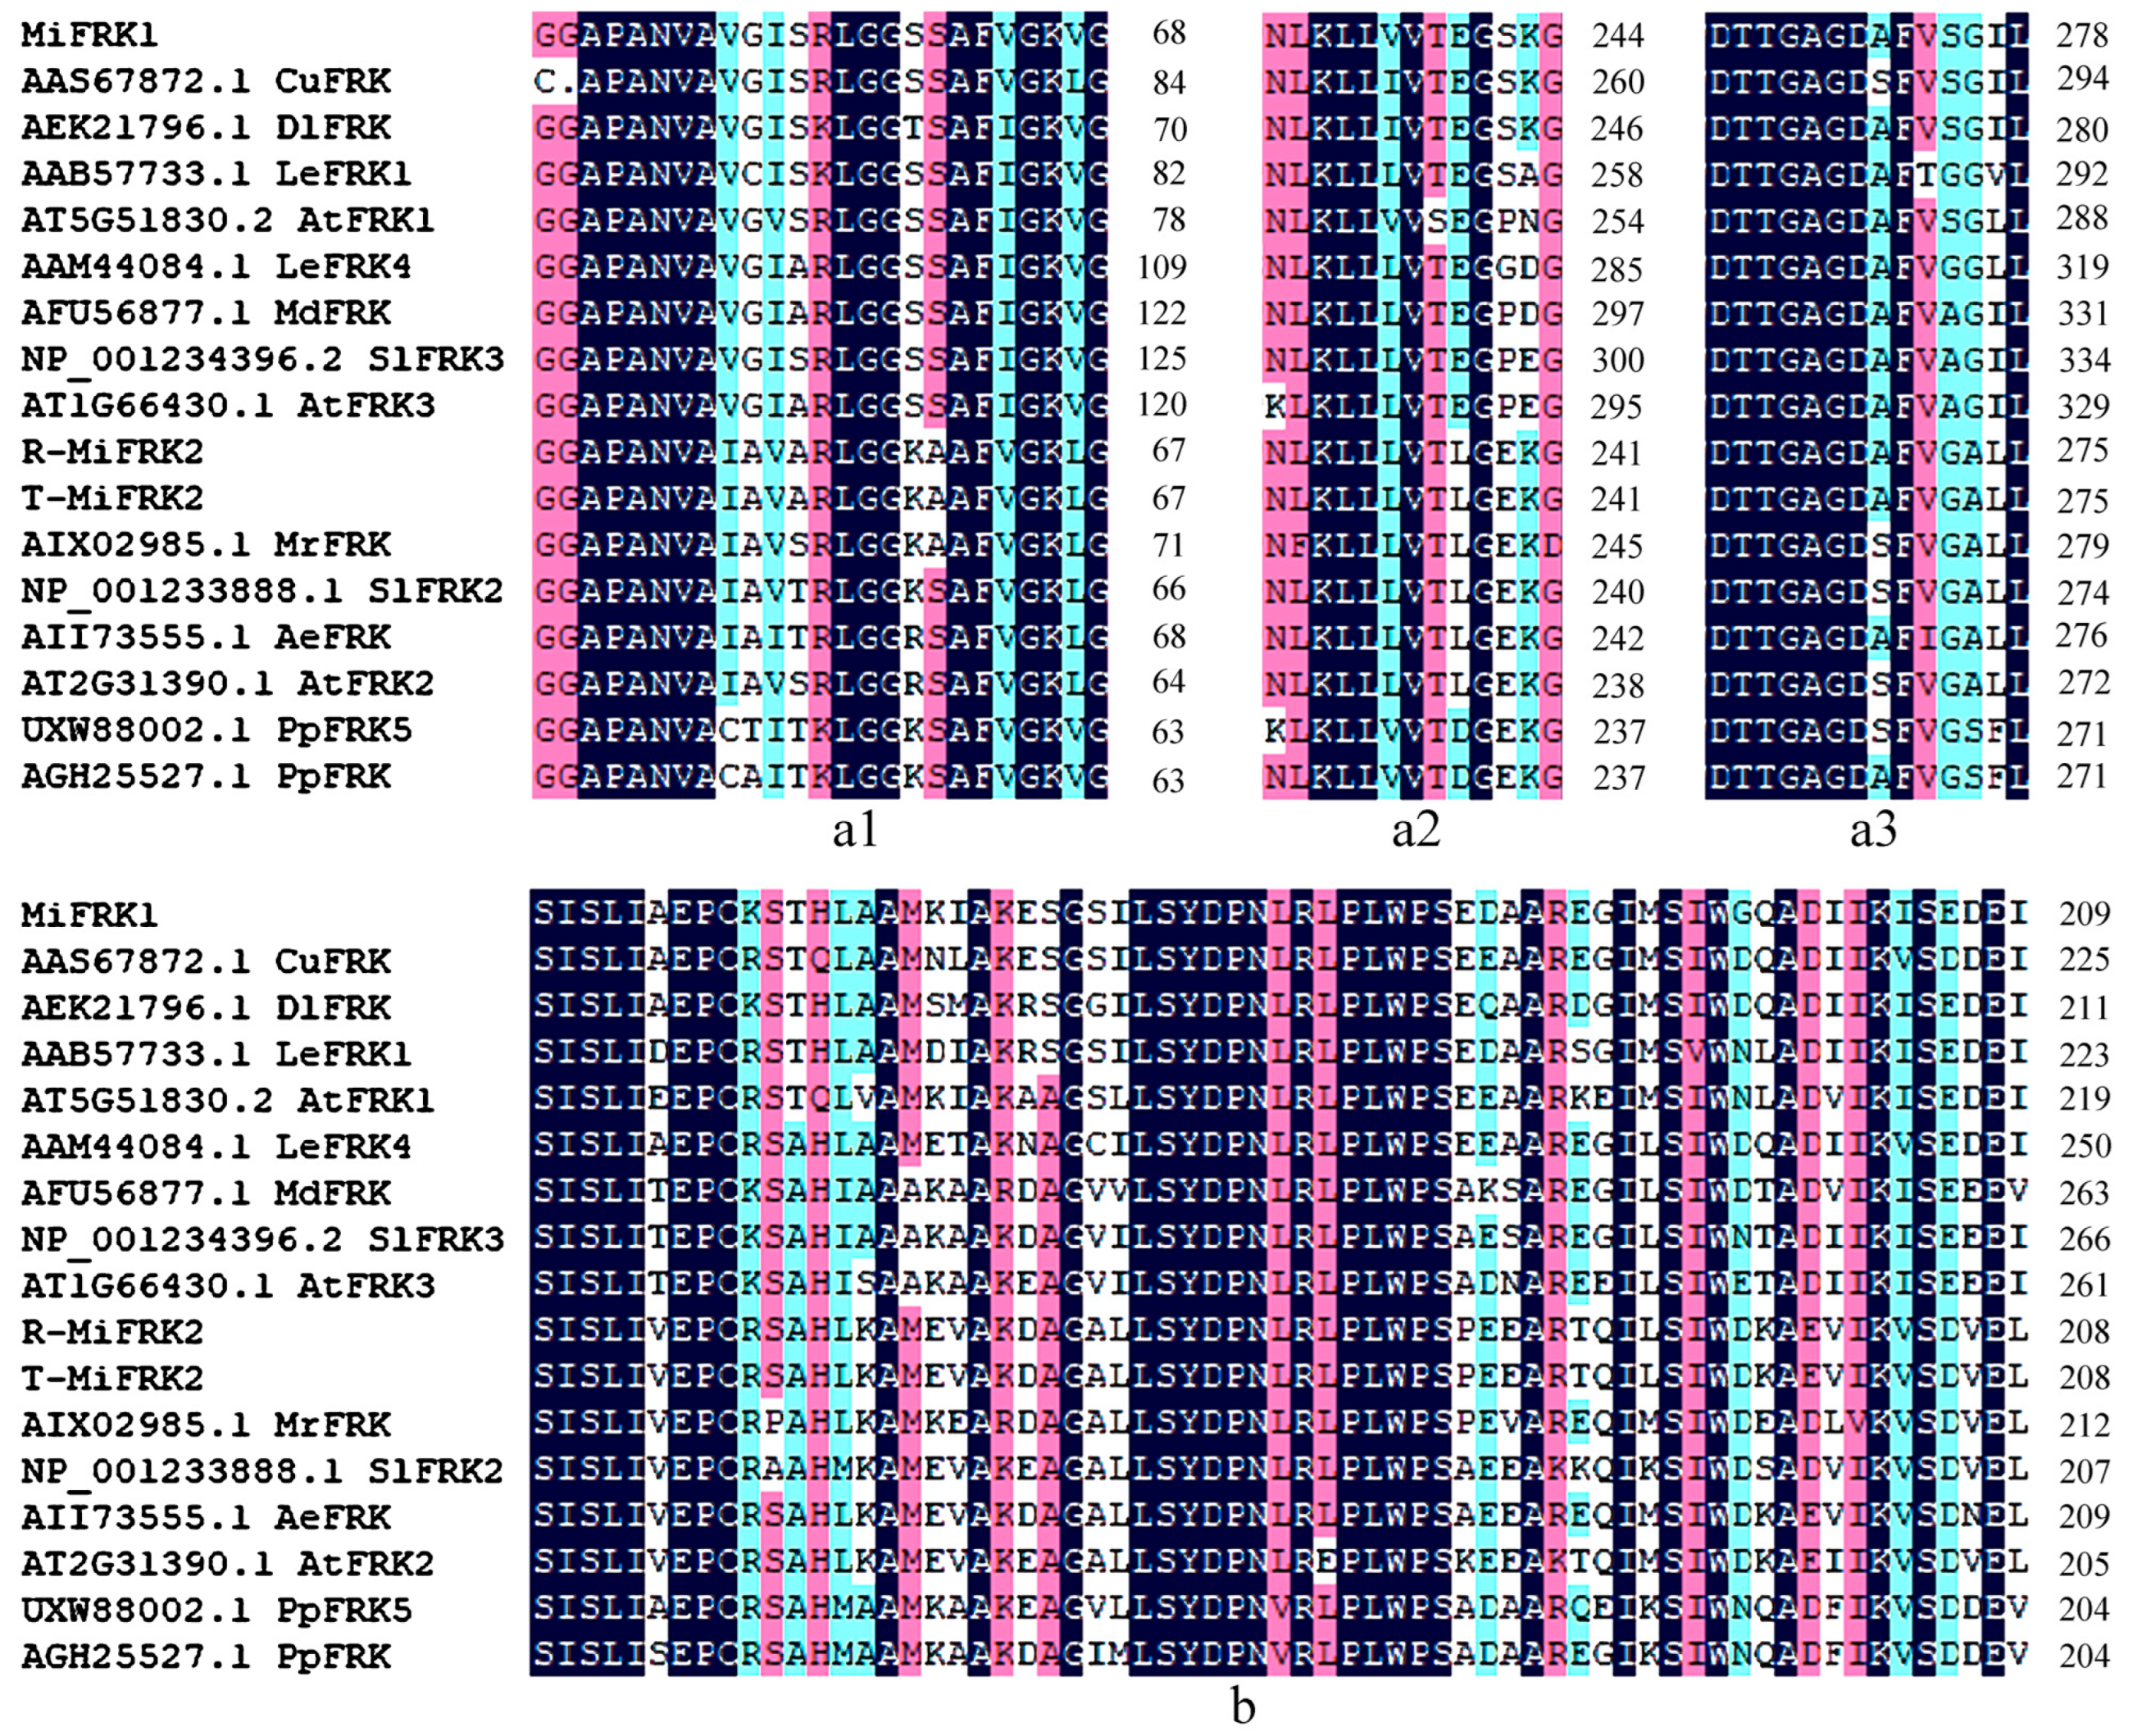
Structural characterization demonstrated that both MiFRK1 and MiFRK2 proteins contain highly conserved functional domains, including the characteristic pfkB family signature sequence, FRK-specific sugar-binding domains, and ATP-binding motifs (
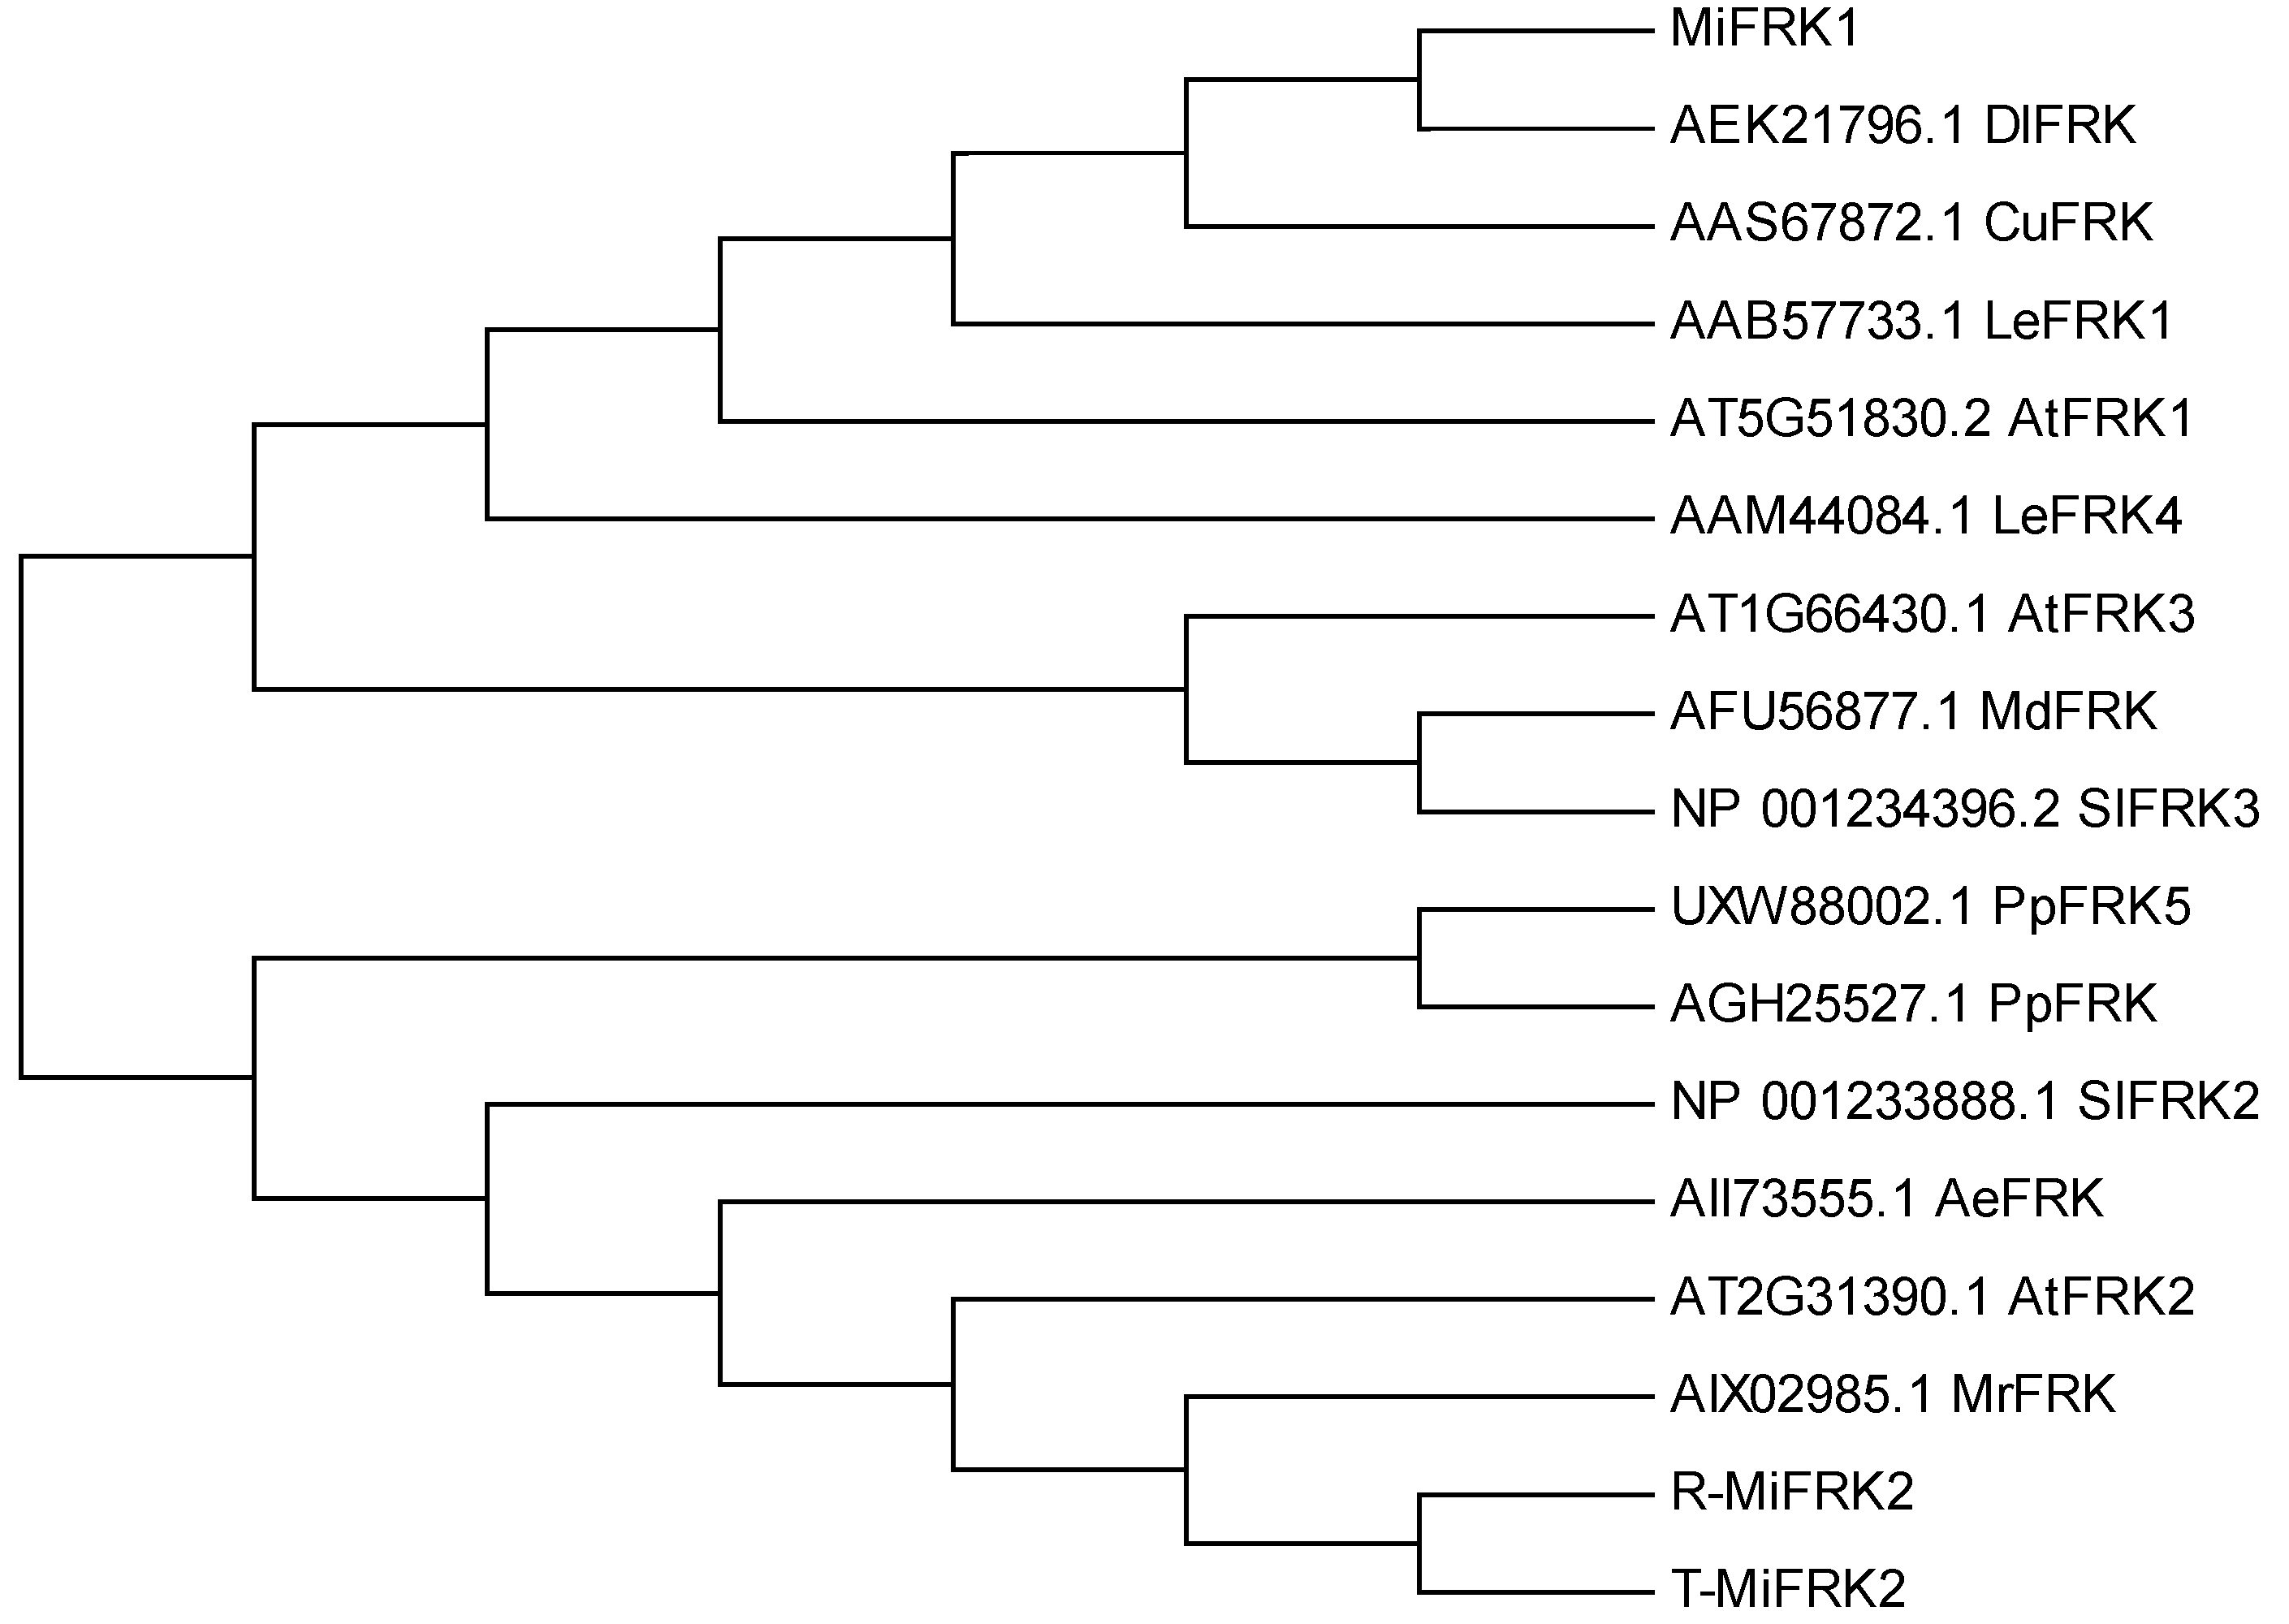
Figure 1). Phylogenetic analysis revealed distinct evolutionary relationships among these proteins. MiFRK1 exhibited the closest homology with DlFRK (RefSeq: AEK21796.1) from longan (
Dimocarpus longan) and CuFRK (RefSeq: AAS67872.1) from satsuma mandarin. In contrast, MiFRK2 clustered more closely with AtFRK2 (RefSeq: AT2G31390.1) from
Arabidopsis thaliana and MrFRK protein (RefSeq: AIX02985.1) from Chinese bayberry (
Figure 2).
2.2. Generation and Phenotypic Analysis of Transgenic Tomato
To functionally characterize mango
MiFRK1 and
MiFRK2 and examine the potential effects of intervarietal SNPs on gene function, we successfully transformed three FRK genes (
R-MiFRK2,
T-MiFRK2, and
MiFRK1) into Micro-Tom tomato. PCR-based screening identified four independent
MiFRK1-positive transgenic lines, six
T-MiFRK2-positive lines, and eight
R-MiFRK2-positive lines (
Figure S4).
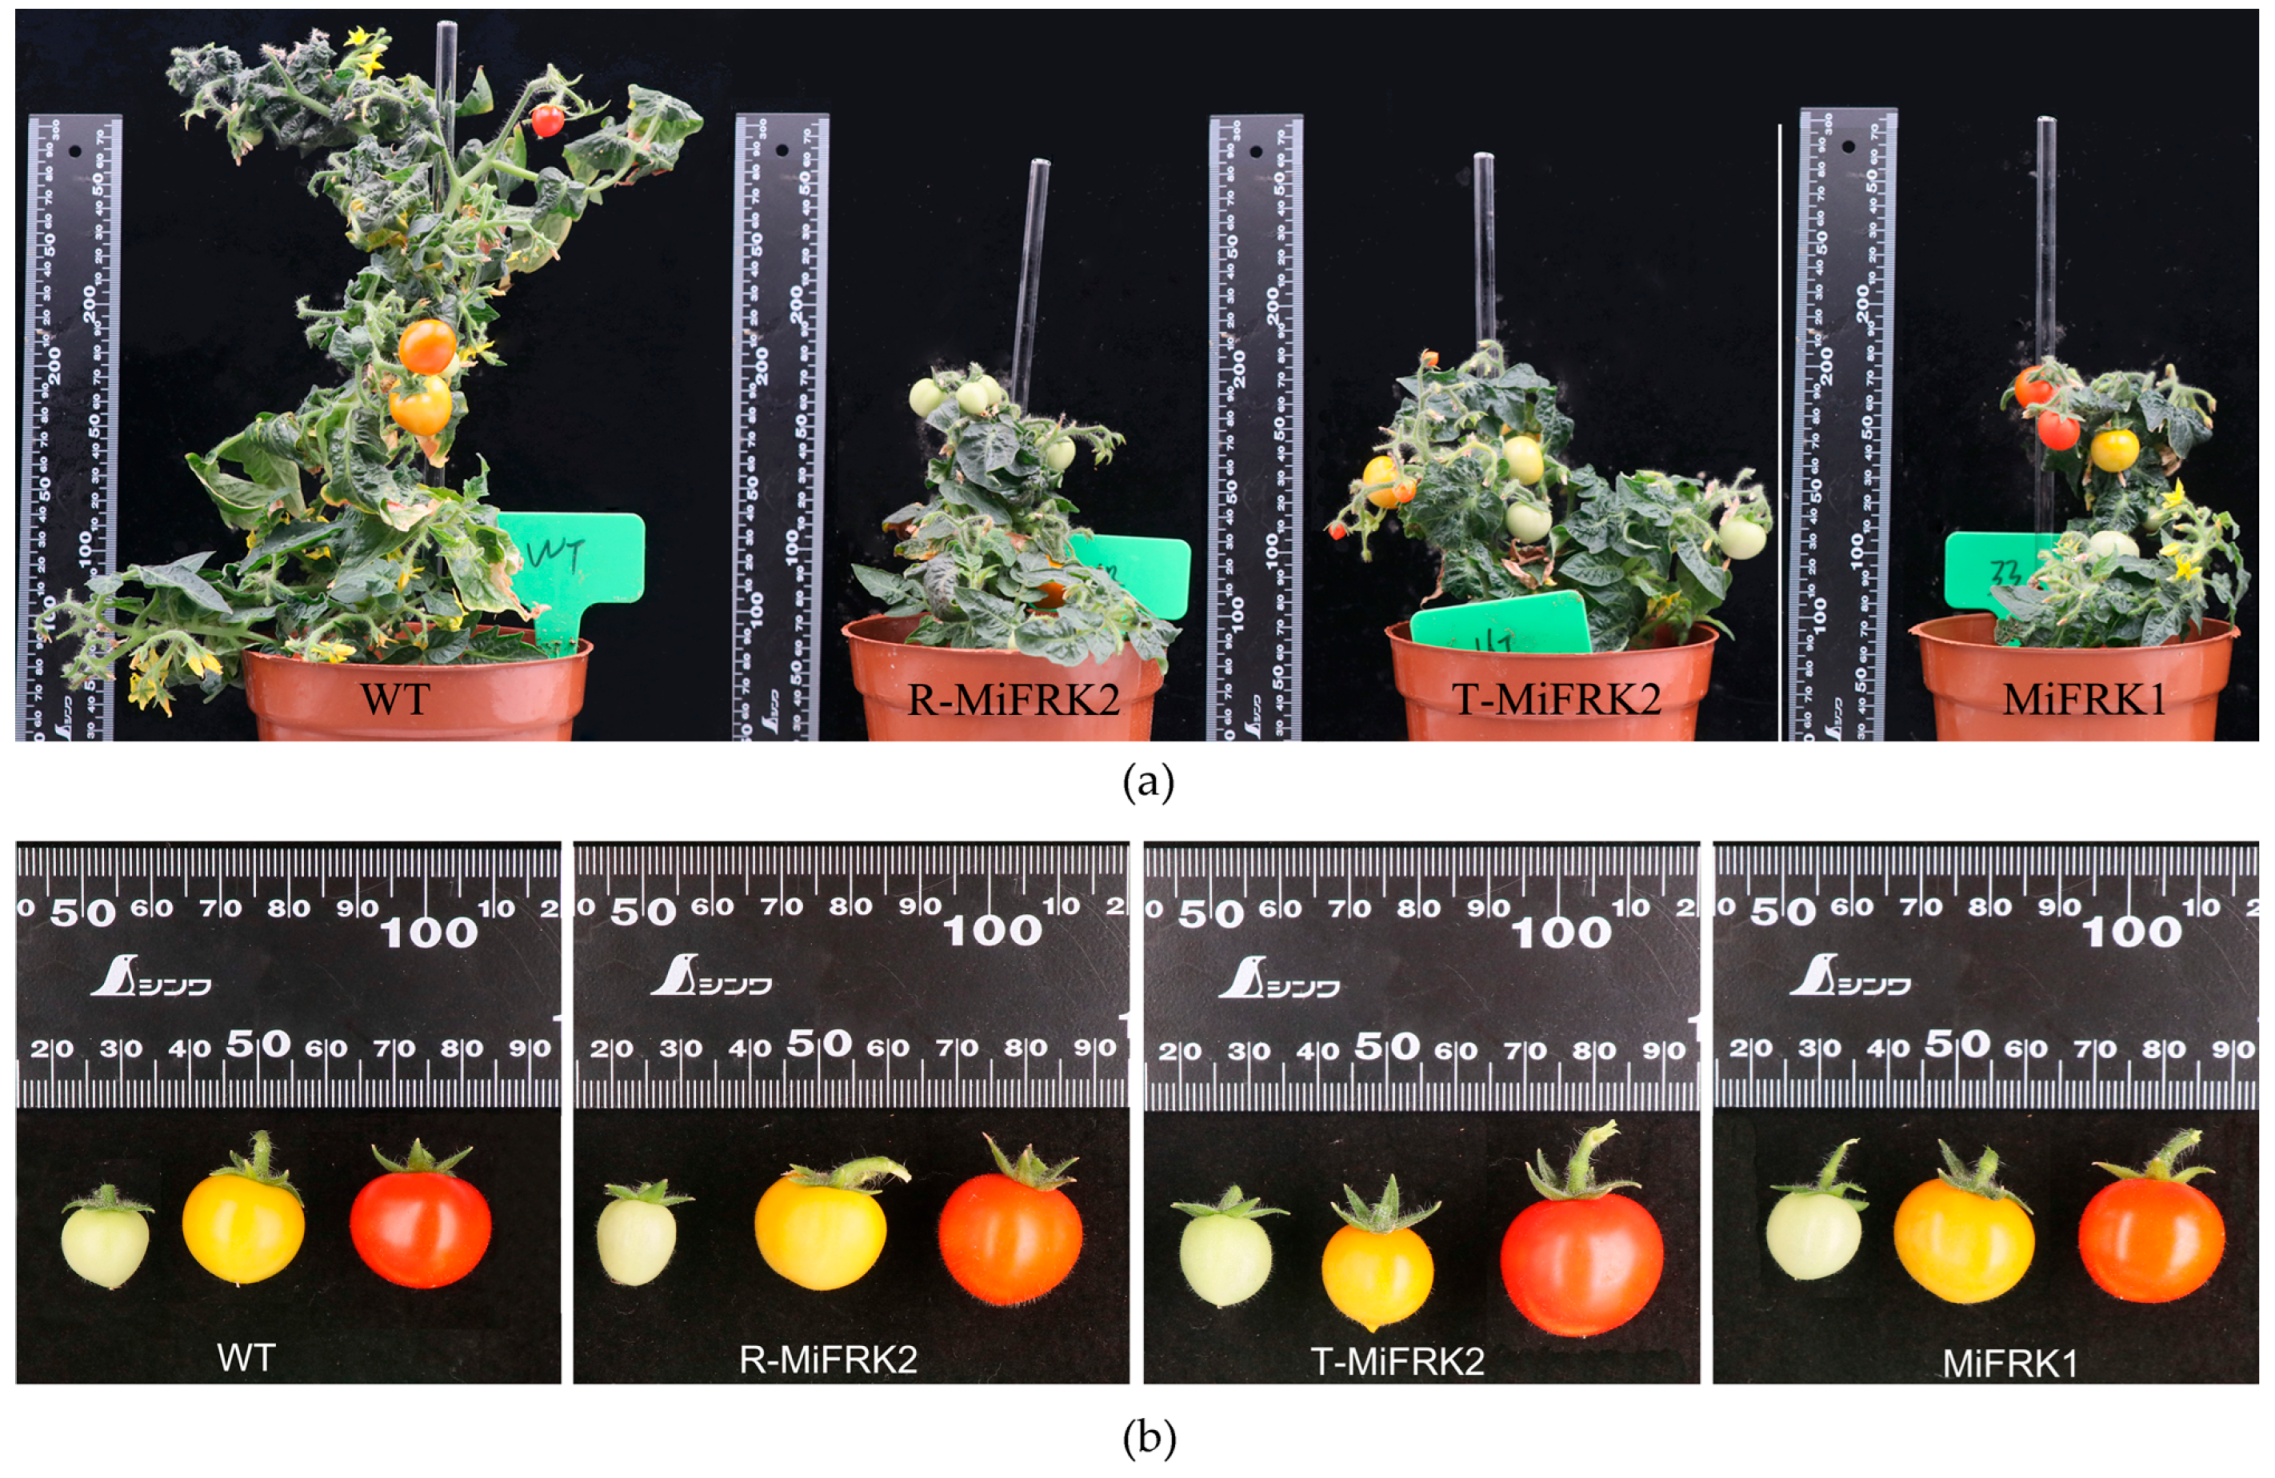
Following the germination of resistant seedlings from the seeds of positive transgenic lines, the T
1 plants were transplanted into growth containers for phenotypic analysis. The results demonstrated that all T
1 transgenic tomato plants individually expressing the three mango
FRK genes were significantly shorter than the controls, with no notable differences in fruit shape or size (
Figure 3).
2.3. Enzymatic Activity Analysis in MiFRK-Overexpressing Tomato Fruits
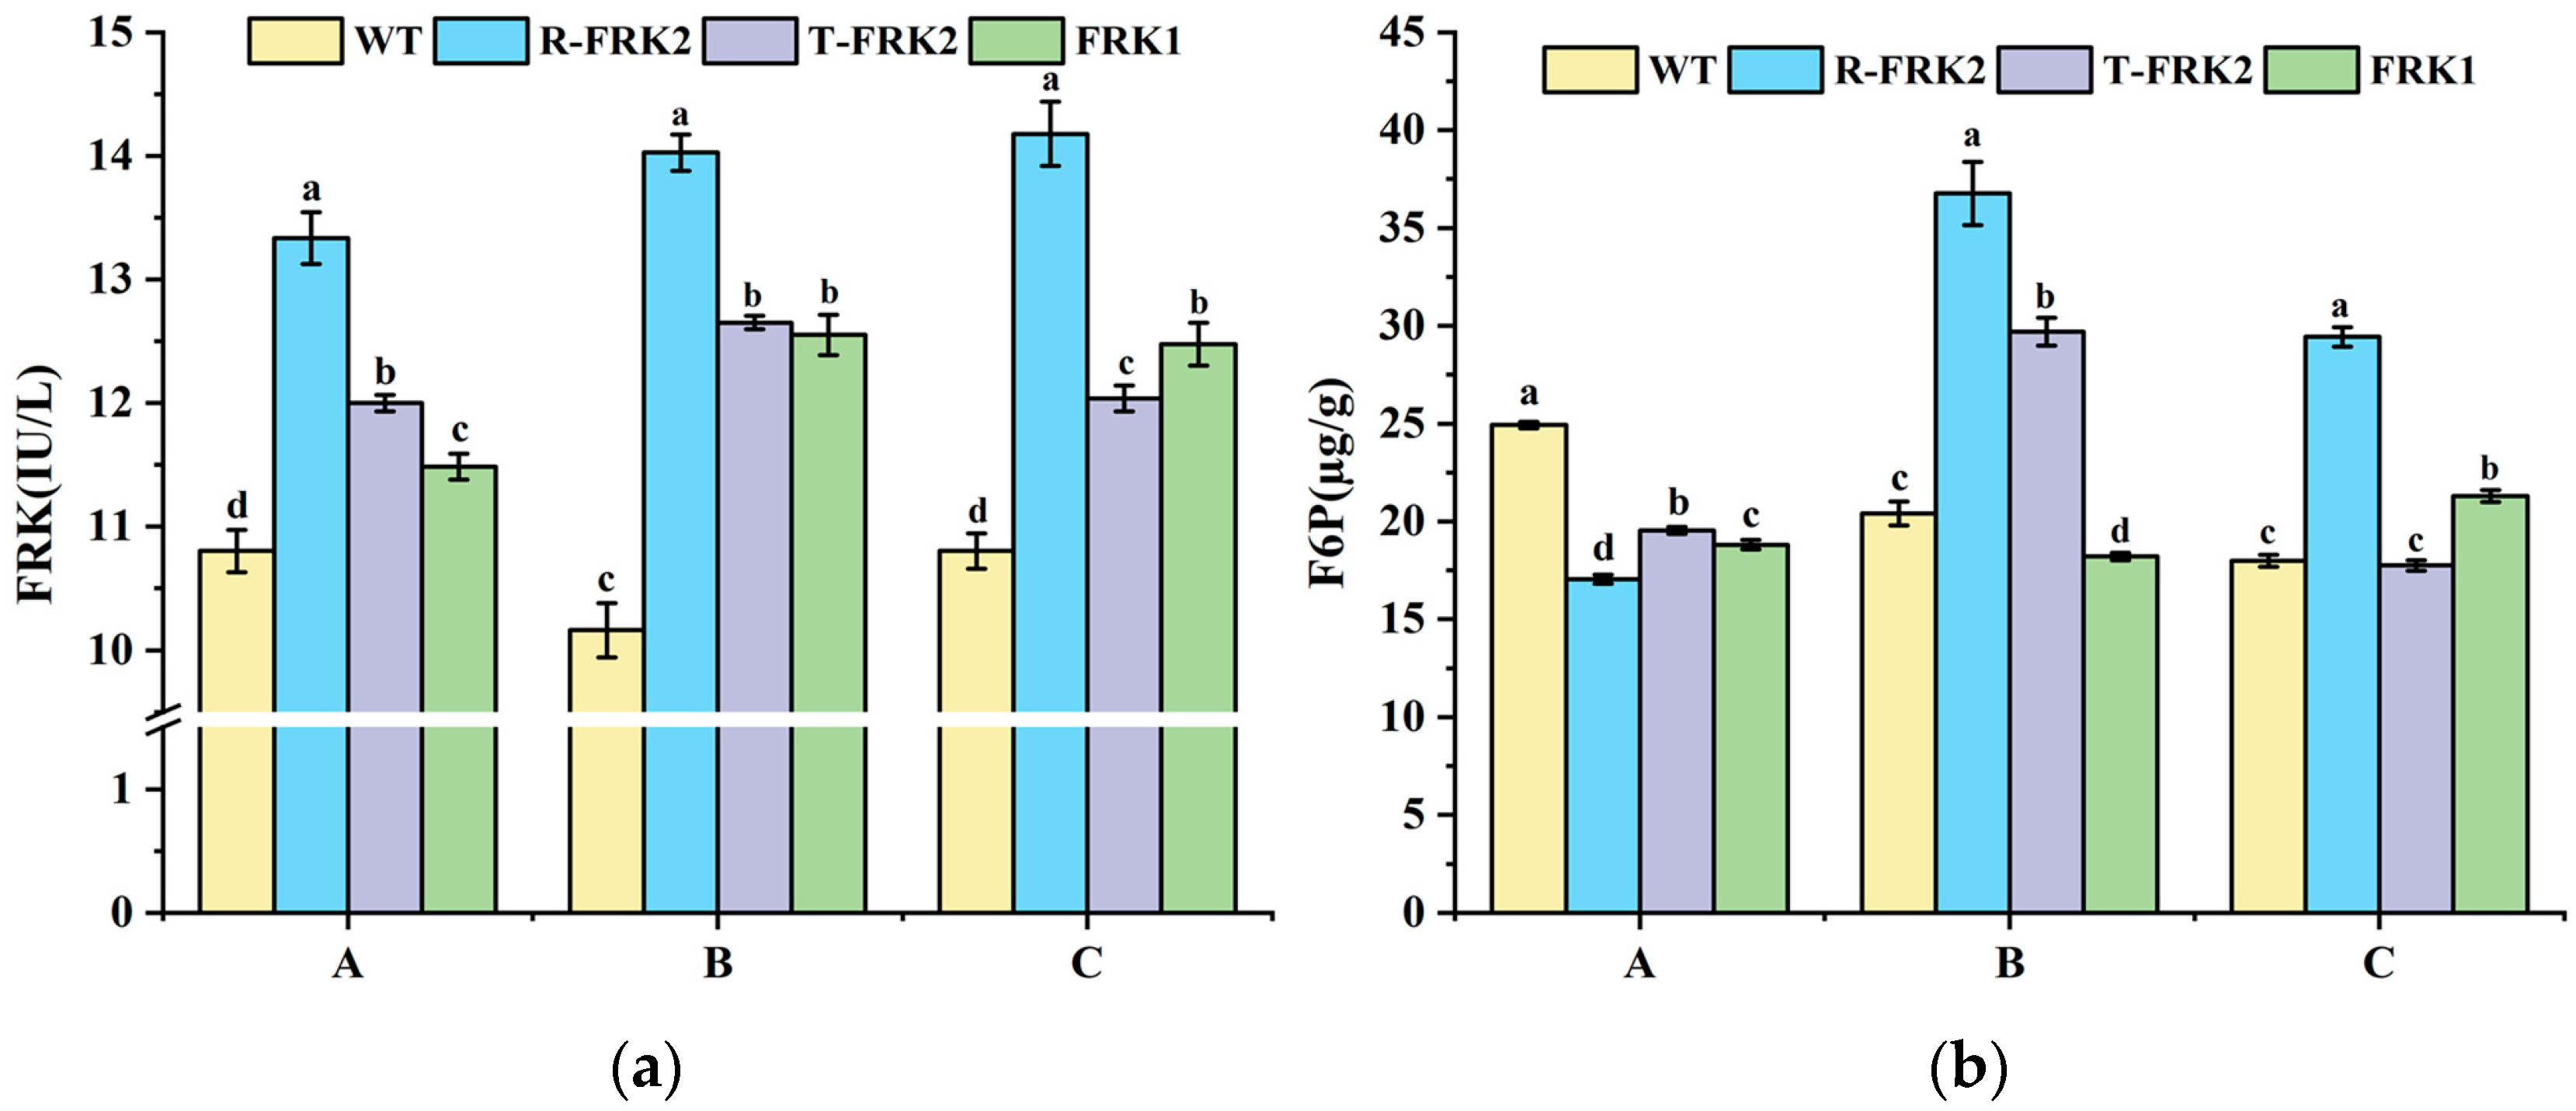
Fruits from the T
1 generation transgenic plants exhibited significantly higher FRK enzymatic activity across all developmental stages compared to WT (
Figure 4a), demonstrating that both
MiFRK1 and
MiFRK2 isoforms encode functional enzymes capable of catalyzing fructose phosphorylation to F6P. Notably,
R-MiFRK2-positive plants consistently exhibited the highest FRK activity across all three developmental phases, suggesting that the identified SNPs may enhance the catalytic efficiency of the encoded protein.
F6P, as the catalytic product of FRK, displayed a non-linear relationship with FRK enzyme activity across different developmental stages in the transgenic lines of three
MiFRKs (
Figure 4b): At the young fruit stage, all transgenic lines of three
MiFRK genes exhibited significantly lower F6P levels than WT. At the color-turning stage, only
R-MiFRK2 and
T-MiFRK2 transgenic lines accumulated higher F6P contents compared to WT, while
MiFRK1 lines retained reduced F6P contents. Notably, at the ripening stage, an elevated F6P content was detected exclusively in
R-MiFRK2 and
MiFRK1 transgenic plants. These findings indicate that F6P undergoes dynamic developmental-stage-specific regulation.
2.4. Carbohydrate Content Analysis in MiFRK-Overexpressing Tomato Fruits
Metabolic analysis of major carbohydrate components (starch, sucrose, fructose, and glucose) in T
1 generation transgenic tomato fruits expressing mango
FRK genes revealed significant alterations in carbohydrate metabolism compared to WT plants (
Figure 5). Starch content analysis showed a consistent developmental decline across all lines, with all three
MiFRK-overexpressing transgenic lines exhibiting significantly lower starch accumulation than WT at each developmental stage (
p < 0.05), suggesting FRK-mediated acceleration of starch catabolism.
Sucrose accumulation patterns differed markedly between genotypes. While WT tomatoes displayed the characteristic progressive decline in sucrose content during development, the three
FRK transgenic lines showed distinct accumulation patterns (
Figure 5b). Quantitative analysis demonstrated that
FRK-overexpressing lines maintained significantly lower sucrose levels than WT controls throughout development (
p < 0.05), except for
T-MiFRK lines at the ripening stage. These results indicate that mango
MiFRK1 and
MiFRK2 overexpression significantly inhibits sucrose accumulation in tomato fruits.
The hexose (fructose and glucose) accumulation profiles revealed developmental stage-specific regulation (
Figure 5c,d). At the young fruit stage,
MiFRK1-overexpressing lines accumulated significantly higher fructose contents while
R-MiFRK2-overexpressing lines showed elevated glucose levels compared to WT controls (
p < 0.05). However, during both color-turning and ripening stages, all FRK-overexpressing fruits exhibited significantly reduced accumulation of both sugars relative to WT (
p < 0.05), demonstrating substantial suppression of hexose accumulation during late fruit development.
2.5. Sugar Metabolism-Related Parameter Analysis in FRK-Overexpressing Tomato Fruits
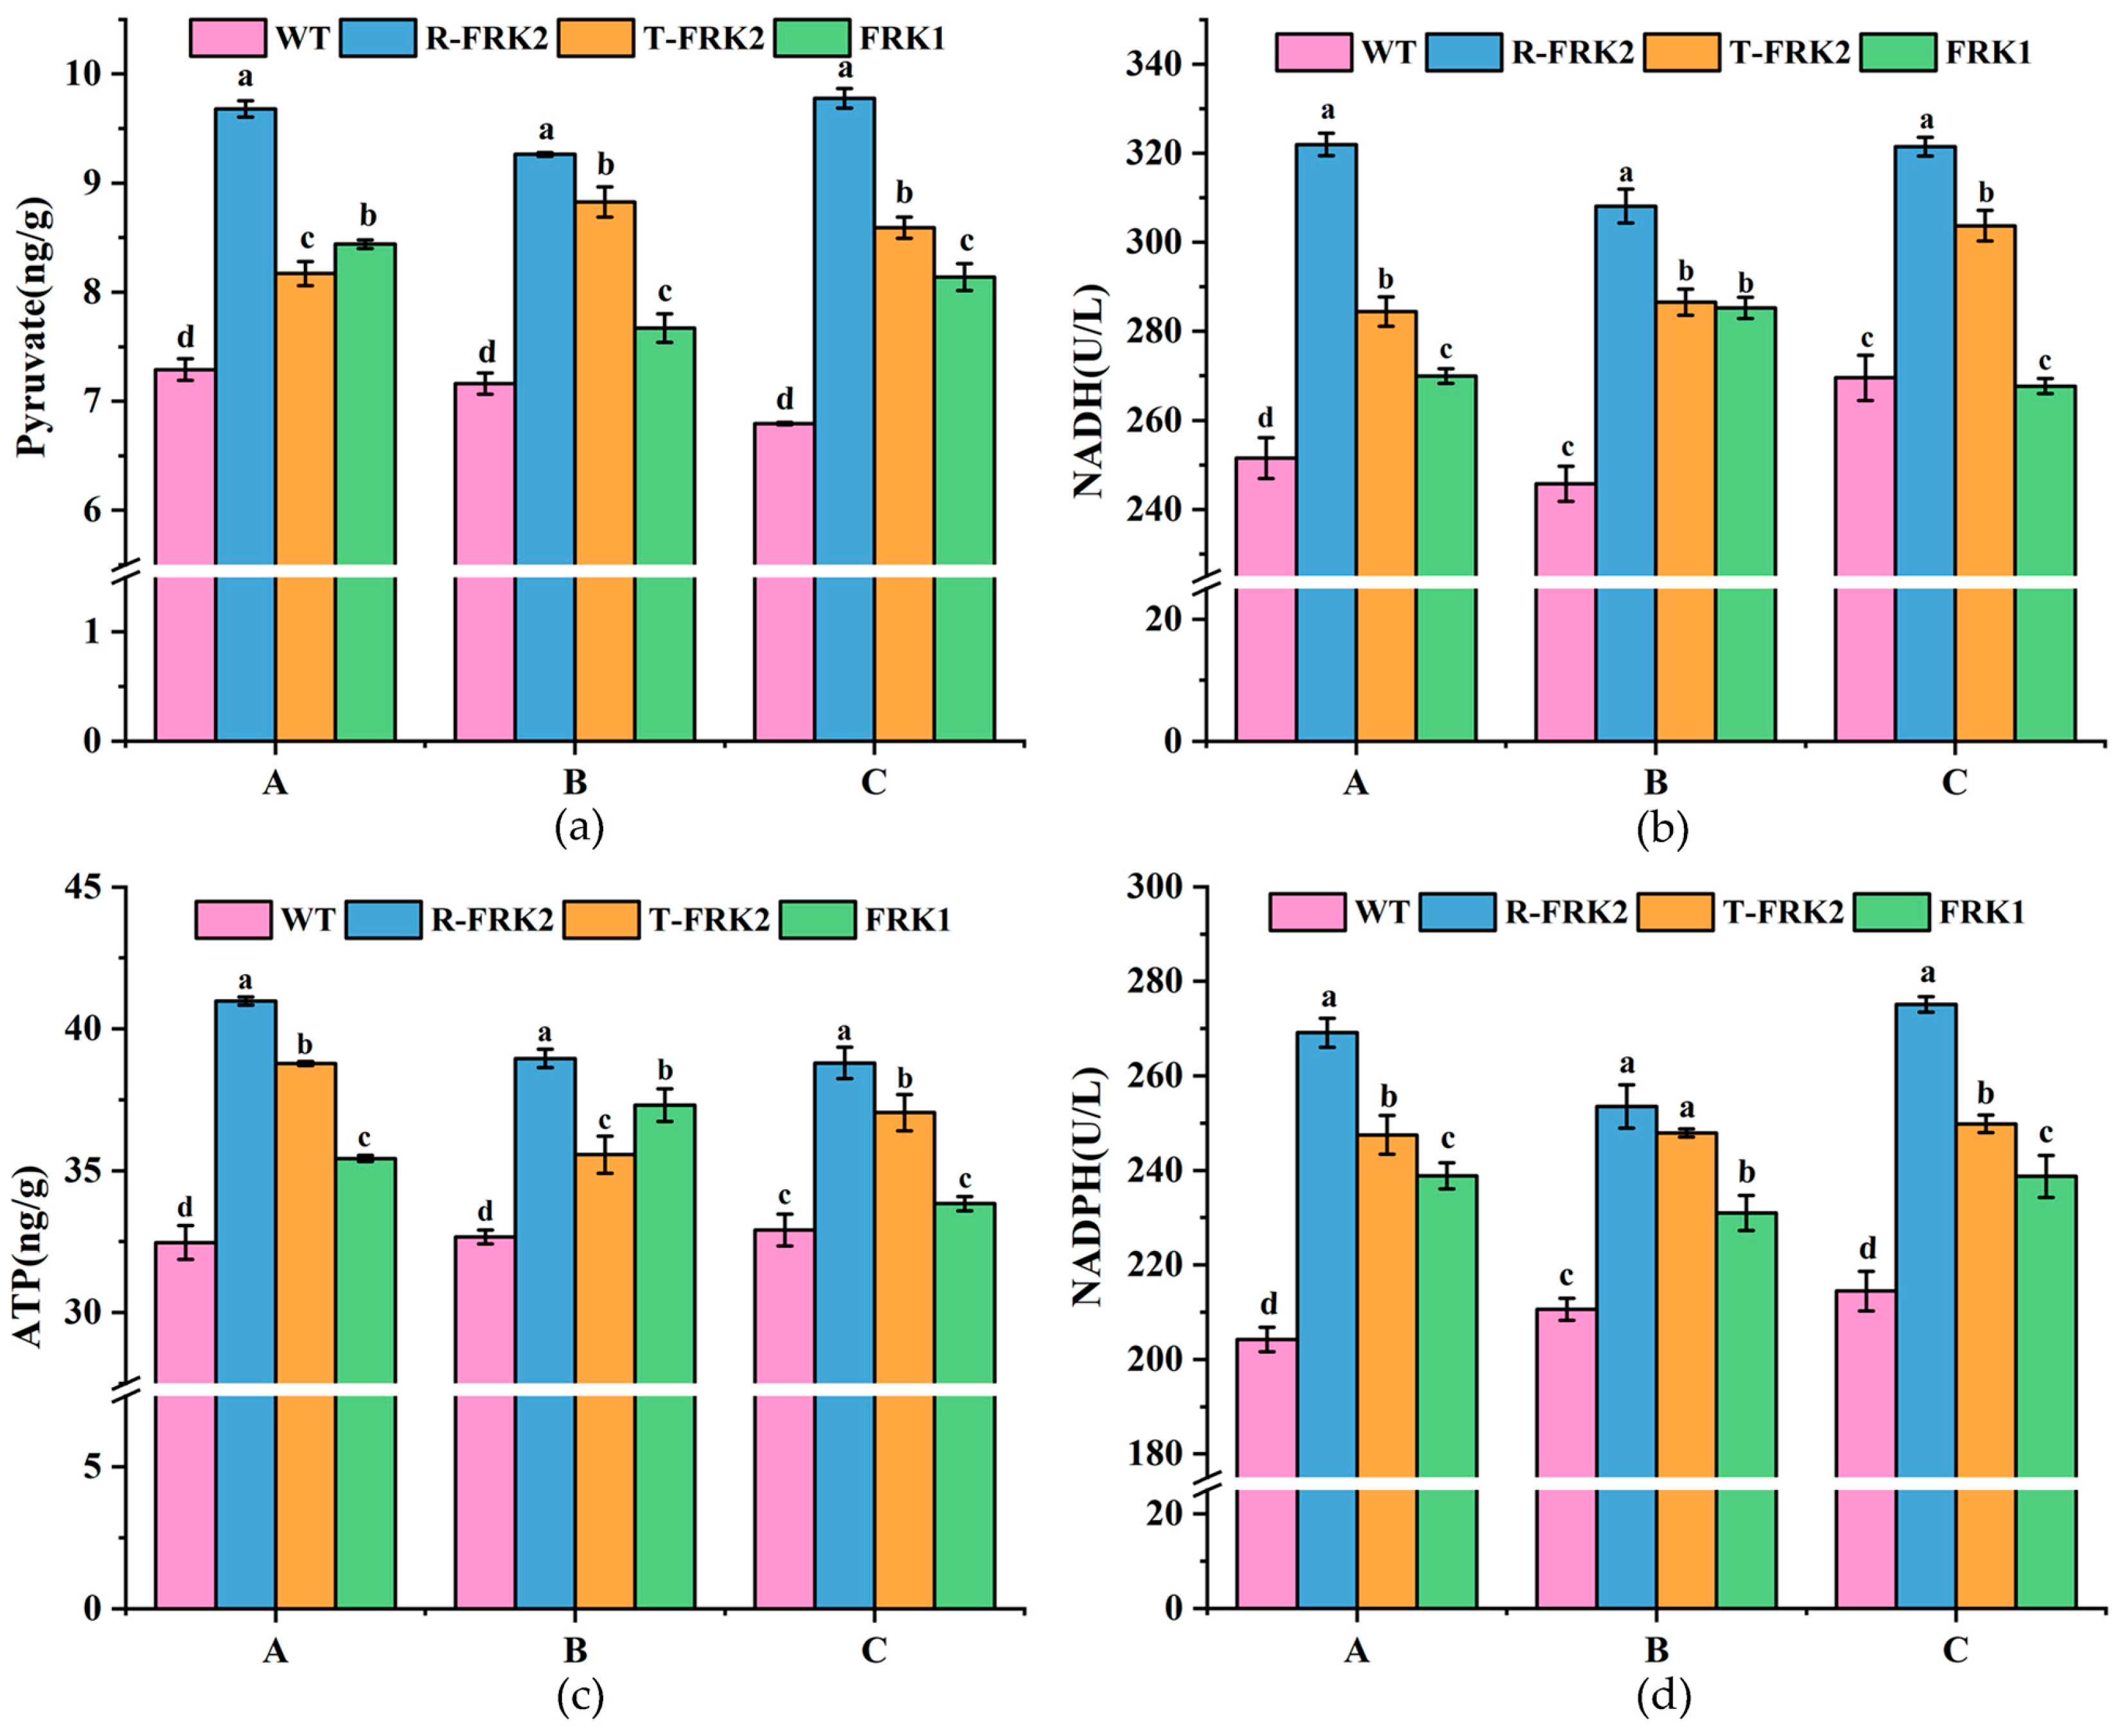
Metabolic profiling of key glycolytic intermediates revealed significant alterations in pyruvate, NADH, and ATP levels during fruit development in
MiFRK-overexpressing lines (
Figure 6). Comparative analysis with WT controls demonstrated that T
1 transgenic fruits accumulated substantially higher pyruvate contents (
p < 0.05), with
R-MiFRK1 lines exhibiting the most pronounced elevation across all developmental stages. Quantitative measurements showed concurrent increases in both NADH activity and ATP content in transgenic lines (
p < 0.05), except in
MiFRK1 lines at the ripening stage, which showed no significant difference relative to controls. Notably,
R-MiFRK2 lines maintained the highest NADH activity and ATP content throughout fruit development.
Analysis of NADPH (
Figure 6d), a critical metabolic indicator of pentose phosphate pathway activity, showed significantly enhanced levels in all
MiFRK transgenic lines relative to WT controls (
p < 0.05). Among the transgenic variants,
R-MiFRK2 lines exhibited the most substantial NADPH levels, with both
R-MiFRK2 and
T-MiFRK2 lines demonstrating significantly greater activity than
MiFRK1 lines (
p < 0.05). These findings collectively indicate that
FRK overexpression enhances glycolytic flux and promotes sugar metabolism conversion in tomato fruits. The consistent metabolic advantage observed in
R-MiFRK2 lines suggests that this particular variant may have a superior metabolic activation capacity compared to the other transgenic lines.
2.6. Correlation Analysis of Physiological Parameters in MiFRK-Overexpressing Tomato Fruits
To systematically evaluate the metabolic network regulated by
MiFRK genes, we performed Pearson correlation analysis of key physiological parameters in T
1 transgenic tomato fruits (
Table 1). The analysis revealed that FRK enzyme activity showed highly significant positive correlations with multiple glycolytic intermediates and energy metabolites, including pyruvate (
p < 0.01), NADPH (
p < 0.01), NADH (
p < 0.01), ATP (
p < 0.01), and F6P (
p < 0.01). In contrast, inverse correlations were observed between FRK activity and both fructose (
p < 0.01) and starch (
p < 0.05) contents. Notably, starch content showed highly significant positive correlations (all
p < 0.01) with sucrose, glucose, and fructose levels. Additionally, F6P content showed significant positive associations with pyruvate (
p < 0.01), NADH (
p < 0.05), ATP (
p < 0.05), and NADPH (
p < 0.01).
These results collectively demonstrate that MiFRK overexpression preferentially activates sugar catabolic pathways while simultaneously inhibiting sugar accumulation, indicating a metabolic shift from carbohydrate storage toward energy production and biosynthetic precursor generation.
2.7. Transcriptome Analysis of T1 Generation Transgenic Tomato Fruits
To investigate the molecular mechanisms underlying the metabolic alterations induced by MiFRK overexpression, we performed comparative transcriptomic profiling of transgenic and WT tomato fruits.
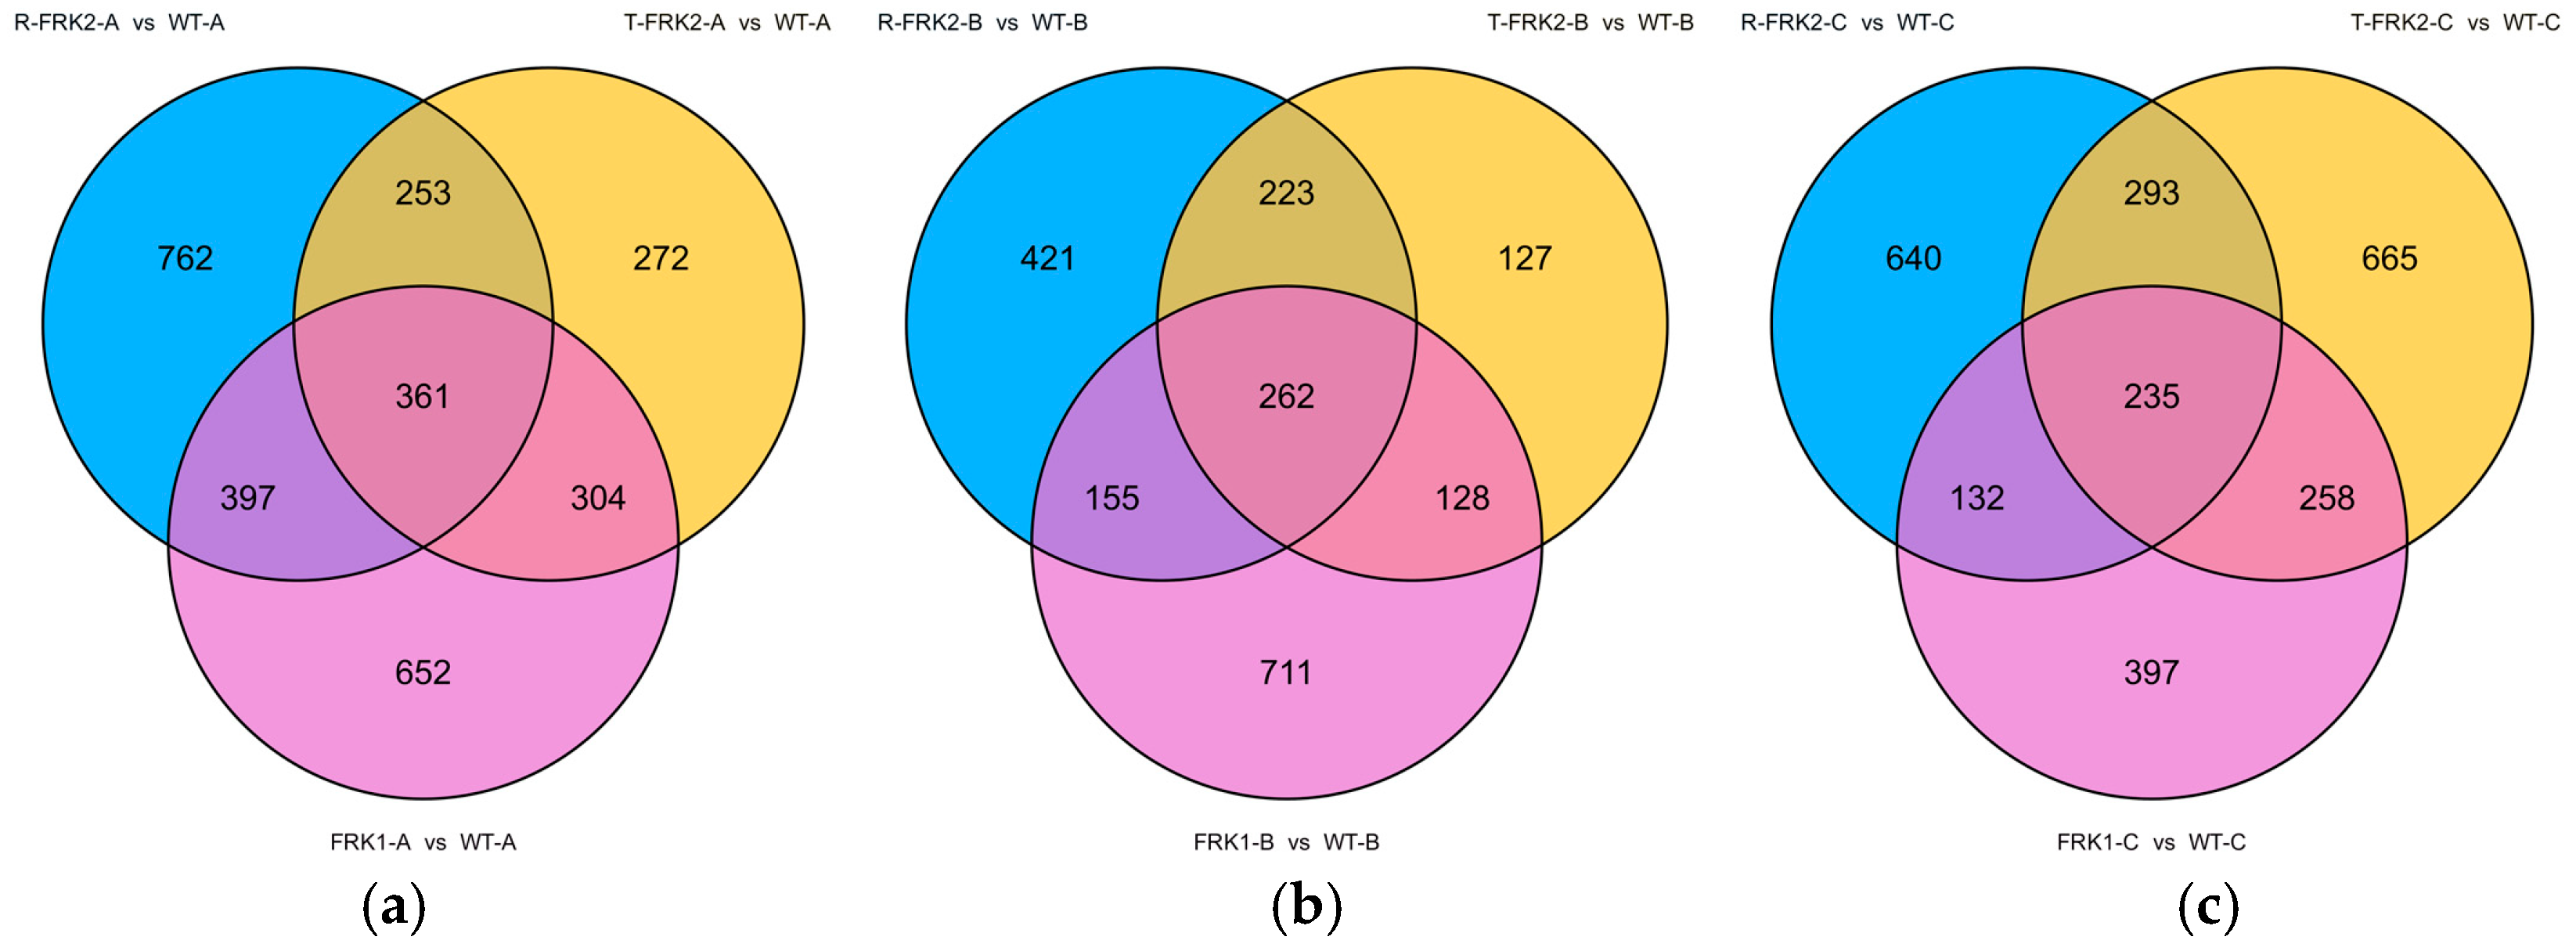
In the young fruit stage, our comparative transcriptomic analysis identified 361 consistently differentially expressed genes (DEGs) shared across all three
MiFRK-overexpressing T
1 transgenic lines compared to WT controls (
Figure 7a). Notably, within the glycolysis/gluconeogenesis pathway (ko00010),
6-phosphofructokinase (Solyc05g024230.2)—a key regulatory enzyme catalyzing the irreversible conversion of F6P to fructose-1,6-bisphosphate—was significantly upregulated, indicating enhanced glycolytic flux at this major regulatory checkpoint. Additionally, two
alcohol dehydrogenase genes (Solyc09g015070.3 and Solyc04g064710.3), which mediate the interconversion of acetaldehyde and ethanol, exhibited coordinated upregulation. Beyond glycolysis, we observed upregulation of
succinate dehydrogenase (Solyc04g055020.2, Solyc04g055030.2) from the TCA cycle (ko00020) and
transketolase (Solyc01g018020.2) from the pentose phosphate pathway.
During the color-turning stage, transcriptomic comparison between T
1 transgenic plants (harboring three
FRK genes) and WT plants revealed 262 common DEGs in fruit tissues (
Figure 7b). Within the glycolysis/gluconeogenesis pathway (ko00010), key enzymes—including
pyruvate kinase (Solyc06g051930.3),
acetate/butyrate-CoA ligase (Solyc02g082910.3), and
phosphoenolpyruvate carboxylase (Solyc04g076880.3)—were significantly downregulated. Conversely, in the pentose and glucuronate interconversion pathway, two
pectinesterase isoforms (Solyc08g079235.1 and novel.141) showed consistent upregulation.
In ripening-stage fruits, transcriptomic analysis of T
1 FRK transgenic plants identified 235 common DEGs relative to WT (
Figure 7c). Within the pentose and glucuronate interconversion pathway, key cell wall-modifying enzymes—
polygalacturonase (Solyc05g005170.3) and
pectinesterase (Solyc11g019910.1)—were significantly upregulated. In the starch and sucrose metabolism pathway (ko00500),
endoglucanase (Solyc08g083210.3) was upregulated, which could facilitate cellulose breakdown into cellodextrin and cellobiose, whereas
glucan endo-1,3-β-glucosidase 4 (Solyc01g059965.1, Solyc01g060020.3) was downregulated, potentially inhibiting the conversion of 1,3-β-glucan to D-glucose. Furthermore, in the Calvin cycle carbon fixation pathway, two critical enzymes—
phosphoribulokinase (Solyc08g076220.3) and
glyceraldehyde-3-phosphate dehydrogenase (Solyc04g009030.3)—were upregulated, suggesting enhanced carbon assimilation.
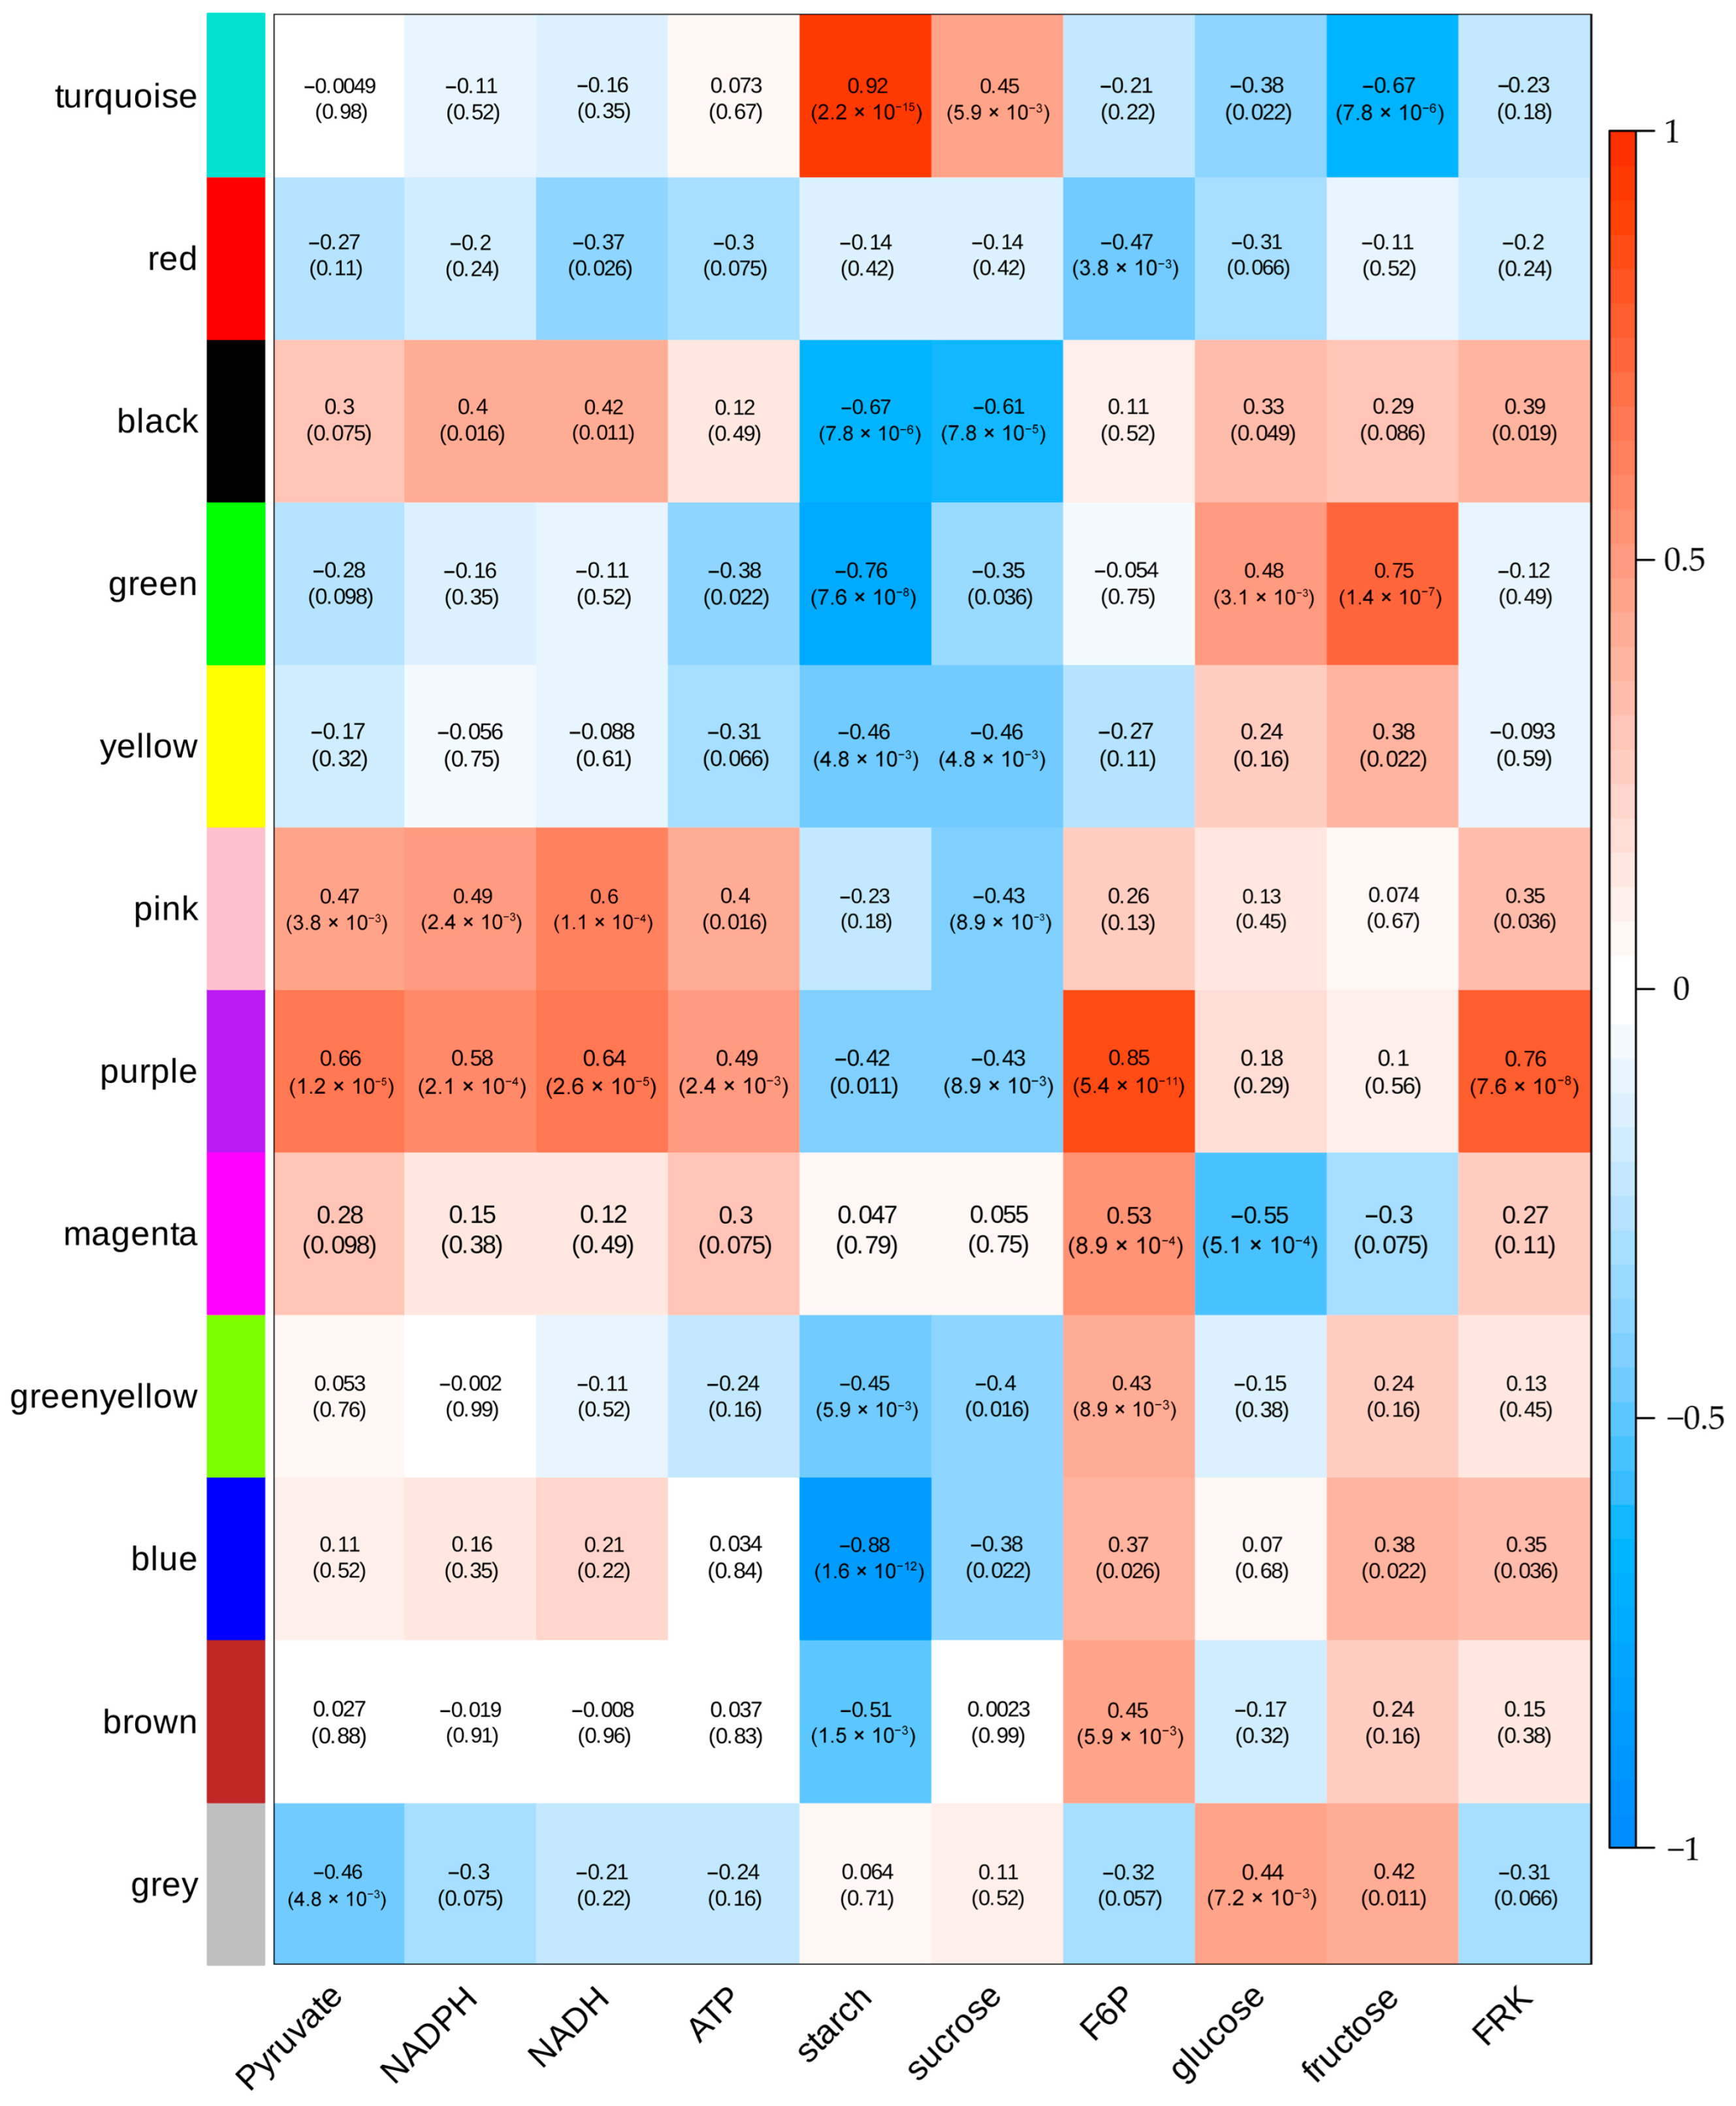
To identify key regulatory genes involved in sugar metabolism-related physiological traits, we conducted WGCNA, which grouped the DEGs into 12 distinct modules (
Figure 8). Among these, the turquoise module exhibited a strong positive correlation with starch and sucrose accumulation but significant negative correlations with fructose levels. Within this module, we identified 21 glycolysis/gluconeogenesis-associated genes, including downregulated
aldehyde dehydrogenase (NAD+) (Solyc06g060250.3) and
acetate/butyrate-CoA ligase (Solyc08g075800.2), along with upregulated
enolase (
ENO, Solyc02g063255.1) in
FRK transgenic T
1 fruits (
Table S2). Additionally, the turquoise module contained 33 starch/sucrose metabolism genes comprising seven
endoglucanases (Solyc08g082250.3 et al.), nine
glucan endo-1,3-β-glucosidases (Solyc07g056310.3 et al.), three
β-glucosidases (Solyc01g074040.2 et al.), three
trehalose-6-phosphate phosphatases (Solyc03g007290.3 et al.), and three
trehalose-6-phosphate synthase/phosphatases (Solyc02g071590.2 et al.) (
Table S2). In contrast, the blue module exhibited a strong negative correlation with starch content and contained two key starch and sucrose metabolism pathway genes:
starch synthase (Solyc03g083095.1) and
β-amylase (Solyc07g052695.1).
The green module also showed significant negative correlation with starch accumulation, but positive correlations with glucose and fructose levels. This module contained two genes from the glycolysis/gluconeogenesis pathway including phosphoenolpyruvate carboxylase (Solyc04g076880.3), which catalyzes the conversion of phosphoenolpyruvate to oxaloacetate, and 6-phosphofructokinase 1 (Solyc07g045160.3), a rate-limiting enzyme in glycolysis. Additionally, we identified two starch metabolism-related genes, glucan endo-1,3-β-glucosidase 4 (Solyc01g060020.3), which are involved in β-glucan degradation, and β-amylase (β-AMY, Solyc07g052690.3), which catalyzes starch breakdown to maltose, that displayed significantly higher expression levels in young fruits of the overexpression lines compared to controls.
The purple module was highly significantly positively correlated with pyruvate, NADPH, NADH, ATP, F6P, and FRK, but highly significantly negatively correlated with starch and sucrose. Notably, it contained β-fructofuranosidase (Solyc03g083910.3), which irreversibly catalyzes the breakdown of sucrose into glucose and fructose. potentially explaining its inverse relationship with sucrose.
The magenta module also showed a positive correlation with F6P but negative correlation with glucose. This module included glucan endo-1,3-β-glucosidase (Solyc12g014420.2) from the starch and sucrose metabolism pathway, which liberates glucose from 1,3-β-glucan, and malate dehydrogenase (Solyc08g066360.3), linking pyruvate metabolism to the TCA cycle.
2.8. Validation of Key Genes by qRT-PCR
To validate the relative expression patterns of key genes identified through transcriptome analysis, two critical genes involved in sugar metabolism (
ENO and
SP) were selected for qRT-PCR analysis. The expression patterns were examined in fruits of both wild-type and MiFRK-overexpressing tomato lines across different developmental stages. As shown in
Supplementary Figure S5, the relative expression levels of all selected genes demonstrated high consistency with the FPKM values, with a coefficient of determination (R
2) of 0.938 in the linear regression analysis. These results confirm the reliability of the transcriptome data and subsequent interpretations.
3. Discussion
FRKs play pivotal regulatory roles in carbon partitioning, developmental processes, and abiotic stress responses [
28]. In apple, the expression dynamics of
FRK isoforms exhibit distinct temporal patterns during fruit development: while
MdFK2 shows peak expression in young fruits followed by a sharp decline in later developmental stages,
MdFK1 demonstrates progressive upregulation as fruits approach maturity [
29]. In our preliminary studies, we observed distinct expression patterns of mango
MiFRK1 and
MiFRK2 during fruit development. Notably, multiple SNP variations were identified in
MiFRK2 between high-sugar and low-sugar mango cultivars. To elucidate the functions of mango
MiFRK1 and
MiFRK2 and investigate whether the intervarietal SNPs affect gene functionality, we conducted genetic transformations of tomato with
MiFRK1 and two allelic variants of
MiFRK2 (
R-MiFRK2 and
T-MiFRK2) from the respective cultivars. Transgenic analysis demonstrated that all three
FRK transgenes significantly enhanced FRK activity in T
1 generation plants throughout fruit development. Quantitative assessment revealed that the
R-MiFRK2 overexpression lines consistently exhibited the highest enzymatic activity across all developmental timepoints, confirming that both
FRK isoforms possess functional fructokinase activity capable of phosphorylating fructose to F6P. Notably, the observed activity difference between
R-MiFRK2 and
T-MiFRK2 suggests that the identified SNPs may confer functional modifications to the encoded proteins, with the
MiFRK2 allele from the low-sugar cultivar (‘Renong NO. 1’) unexpectedly displaying superior catalytic efficiency. Notably, although FRK activity was significantly elevated, the F6P accumulation profile showed inconsistent patterns. In particular, F6P levels in transgenic tomato fruits at early developmental stages were significantly lower than those in wild-type controls. This phenomenon may be attributed to either (1) substrate limitation caused by accelerated fructose phosphorylation, or (2) enhanced F6P utilization through FRK-mediated regulation of downstream metabolic pathways.
Analysis of starch, sucrose, fructose, and glucose levels revealed that
MiFRK overexpression significantly reduced starch and sucrose accumulation in transgenic plants across all fruit developmental stages, while fructose and glucose levels were notably decreased only during mid-to-late development. Consistent with these findings, functional characterization of pear
FRK (
PbFRK1) demonstrated its ability to enhance hexokinase activity and reduce the sugar content in transgenic tomato plants [
19]. Interestingly, no significant alteration in fructose content was observed in young tomato fruits overexpressing the
MiFRK transgene. This finding implies that the marked decrease in F6P levels likely stems from
MiFRK-induced activation of downstream glycolytic pathways, consequently enhancing F6P metabolic flux and turnover. These findings further demonstrate that mango
FRK exerts different regulatory effects on tomato fruit metabolism across distinct developmental stages. This stage-specific phenomenon aligns with previous observations in tomato research, where
LeFRK2 was shown to be dispensable for starch biosynthesis during fruit development [
30].
Key glycolytic metabolites (pyruvate, ATP, NADH) and PPP-derived NADPH were quantified in
MiFRK-overexpressing tomato fruits at various developmental stages. Compared to wild-type controls,
FRK-overexpressing lines consistently showed significantly higher pyruvate and NADPH accumulation compared to wild-type controls at all developmental stages. Notably, while
FRK1-overexpressing fruits exhibited comparable ATP levels and NADH activity to wild-type controls specifically during ripening, all other transgenic lines showed significant increases in both parameters across all developmental phases. Among these, the
R-MiFRK2 line displayed the highest values for all analyzed metabolites throughout fruit development. These findings provide compelling evidence that heterologous expression of
MiFRK in tomato actively promotes carbon partitioning through both the glycolytic and pentose phosphate pathways. Correlation analysis further supported these findings. FRK activity exhibited significant negative correlations with fructose (
p < 0.01) and starch (
p < 0.05) contents. Conversely, FRK enzyme activity showed highly significant positive correlations with pyruvate (
p < 0.01), NADPH (
p < 0.01), NADH (
p < 0.01), ATP (
p < 0.01), and F6P (
p < 0.01). These findings suggest a potential regulatory role of FRK in carbon partitioning and energy metabolism, and thus it could serve as a target gene for the manipulation of these processes using gene-editing technologies. Interestingly, our findings appear to contrast with previous reports in other plant systems. For instance, Zhang et al. [
31] observed that overexpression of
OsFRK3 in rice (
Oryza sativa) seeds led to suppressed fructose accumulation while promoting starch biosynthesis. Similarly, Yang et al. [
17] reported that elevated
MdFRK2 activity in apple leaves resulted in enhanced sorbitol metabolism and reduced sucrose metabolism, ultimately favoring starch accumulation. These opposing effects highlight the potential system-specific or isoform-dependent regulatory mechanisms of FRK in different plant tissues and species.
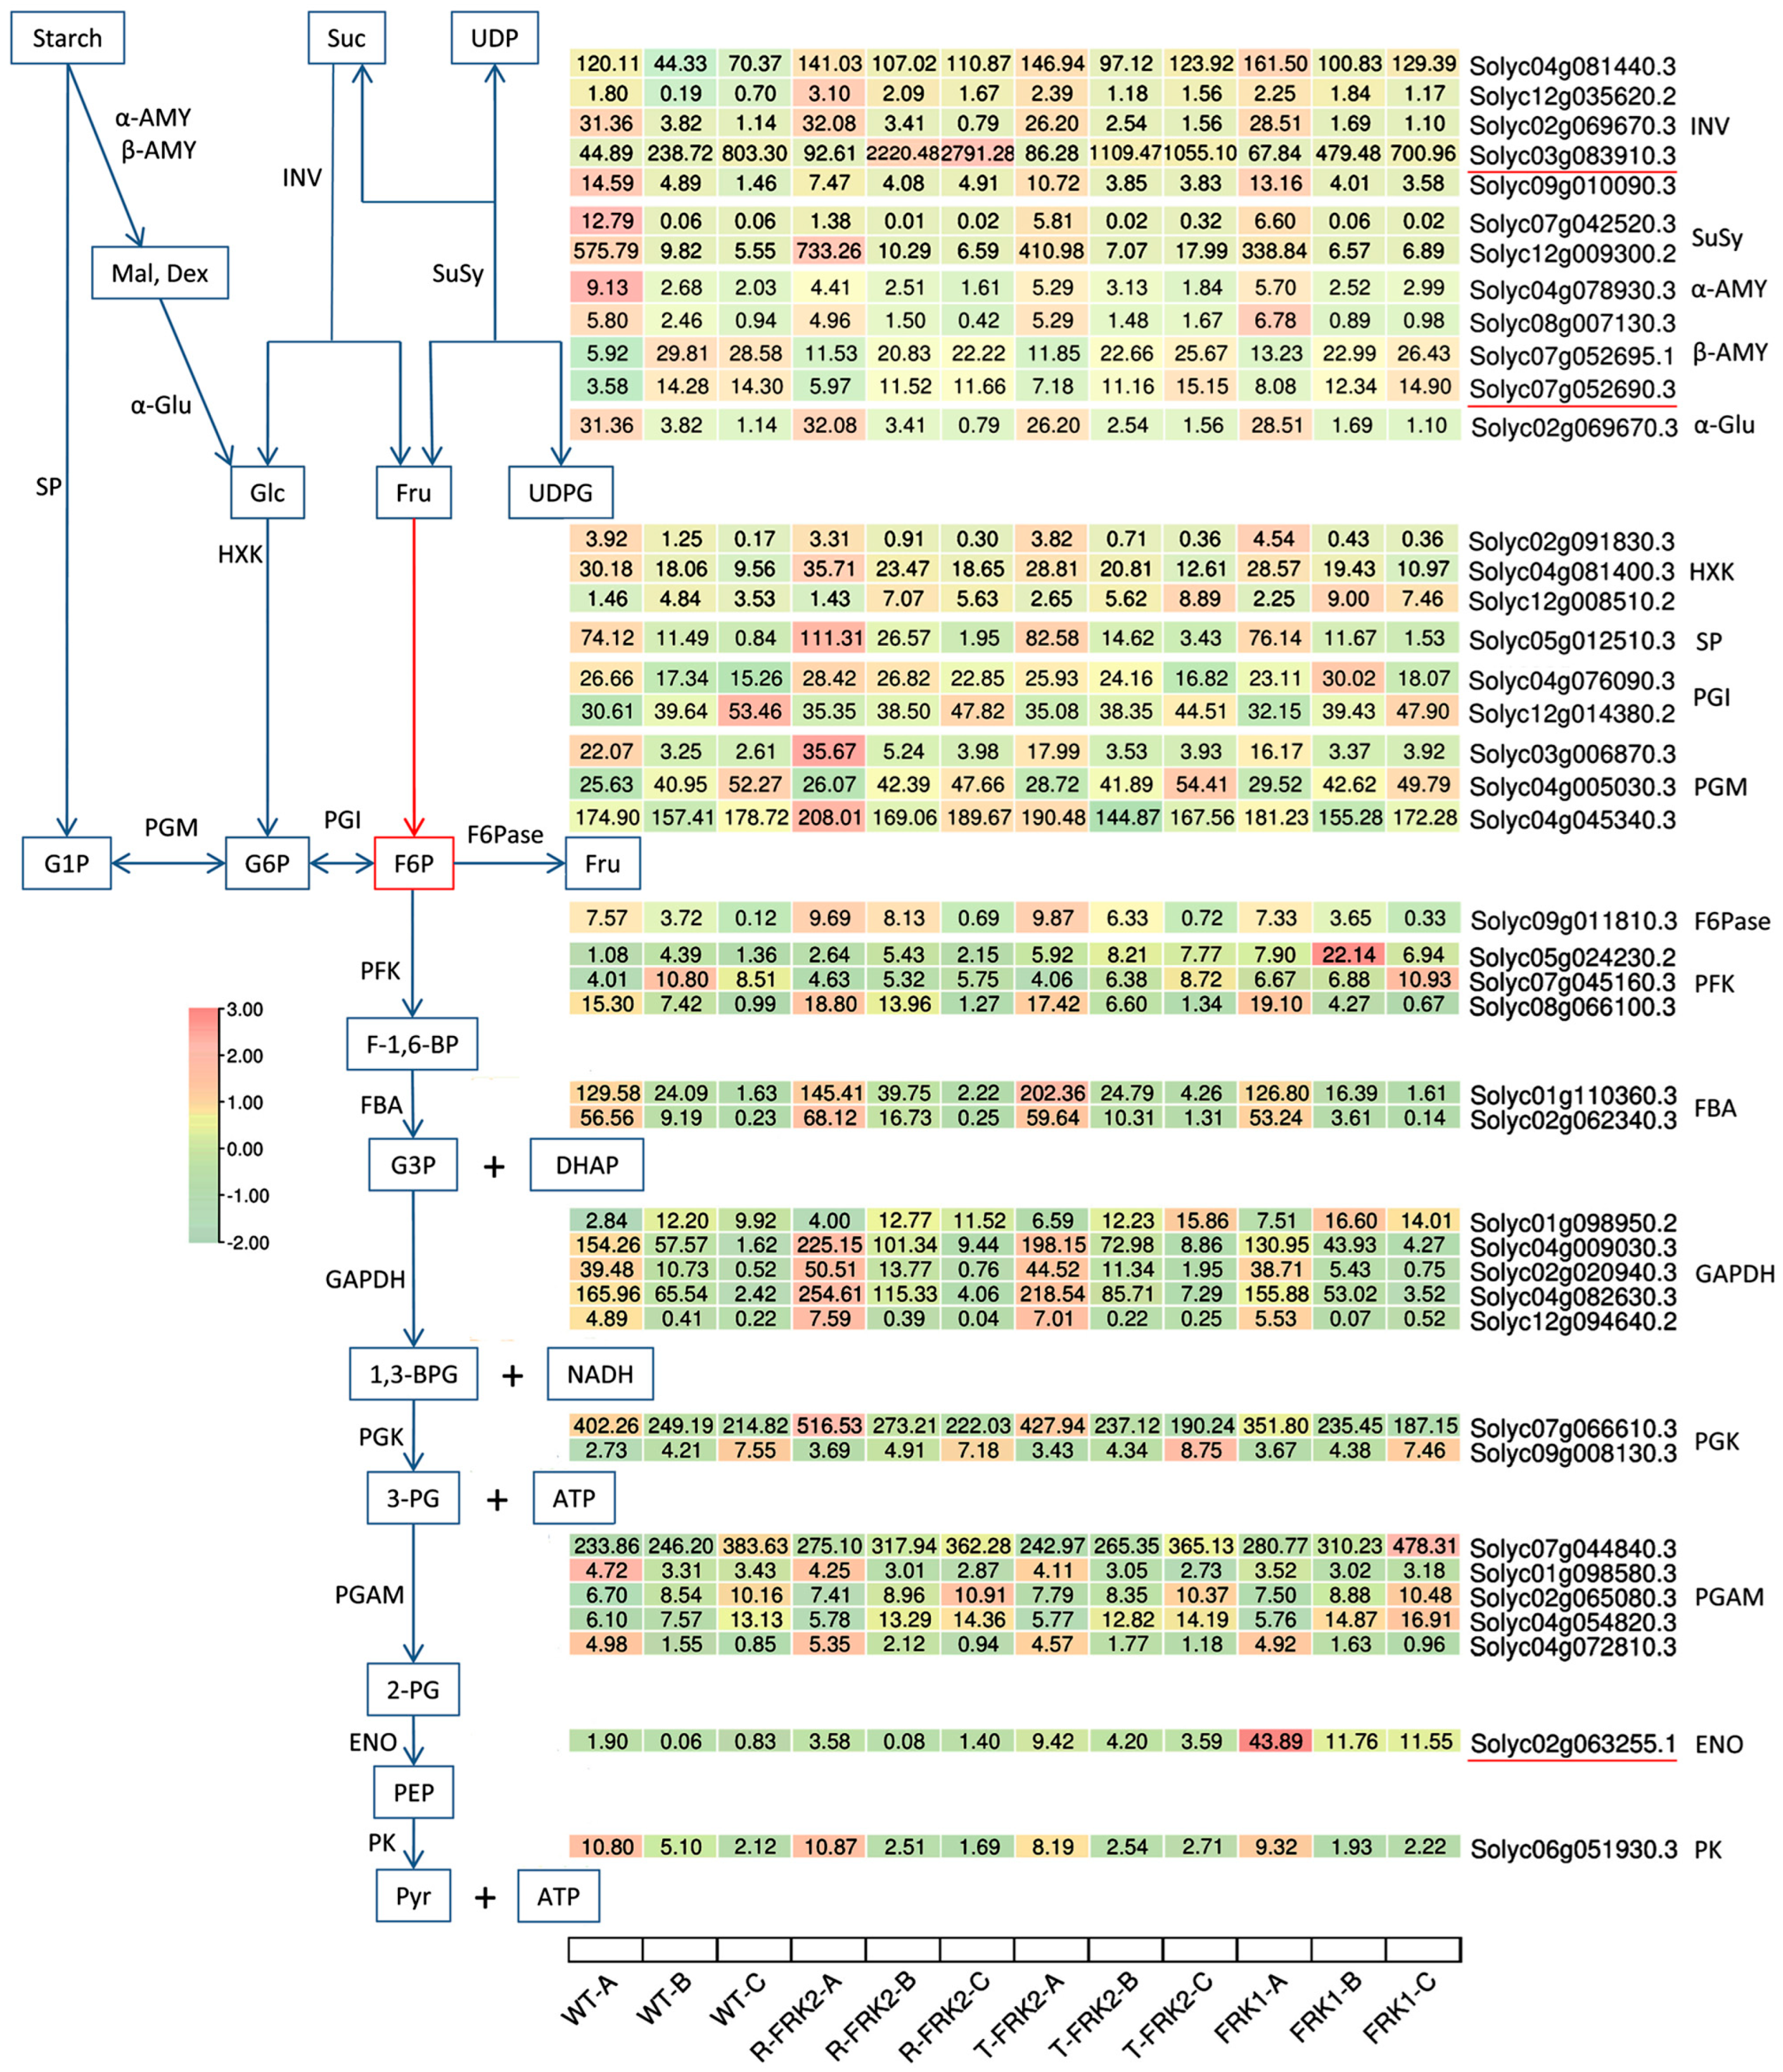
Based on transcriptomic and WGCNA analyses, we identified a set of key genes involved in the fructose kinase overexpression-mediated regulation of sugar metabolism (
Figure 9). These include
β-fructofuranosidase (Solyc03g083910.3), which catalyzes the irreversible hydrolysis of sucrose into glucose and fructose,
β-amylase (Solyc07g052690.3), which exhibited a significant negative correlation with starch accumulation but positive correlations with glucose and fructose levels and mediates starch degradation to maltose, and
ENO (Solyc02g063255.1), a key glycolytic enzyme that catalyzes the conversion of 2-phosphoglycerate to phosphoenolpyruvate (PEP), thereby directly facilitating pyruvate synthesis and enhancing energy metabolism efficiency.
β-Fructofuranosidase (
invertase, Solyc03g083910.3) exhibited significant upregulation across all fruit developmental stages in
T-MiFRK2 and
R-MiFRK2 overexpression lines, whereas its expression was only markedly elevated at the young fruit and color-turning stages in
MiFRK1-overexpressing lines. Notably,
alkaline/neutral invertase (Solyc04g081440.3), which shares similar enzymatic activity, showed significantly increased expression throughout all developmental phases in all overexpression lines. These findings suggest that both enzymes coordinately participate in sucrose degradation in transgenic fruits. This observation aligns with previous studies in date palm (
Phoenix dactylifera) [
32] and rice [
33], further confirming the pivotal role of invertases in plant sucrose metabolism. Regarding starch metabolism,
β-amylase (Solyc07g052690.3) and its homologous gene (Solyc07g052695.1) displayed significantly higher expression levels in young fruits of overexpression lines compared to controls. Concurrently,
starch phosphorylase (
SP, Solyc05g012510.3) was also markedly upregulated in most transgenic fruit samples. These results indicate that
β-amylase and
SP collectively contribute to starch degradation in overexpression lines. This discovery is consistent with the functional evolution of the
β-amylase gene family reported by Thalmann et al. [
34] and the established role of
SP in starch metabolism [
35]. Of particular interest,
ENO (Solyc02g063255.1) showed significantly enhanced expression in all transgenic lines, with a more than 10-fold upregulation observed at three developmental stages in
MiFRK1-overexpressing lines. This dramatic increase likely promotes glycolytic flux and pyruvate accumulation. Correspondingly, the key glycolytic gene
GAPDH was significantly upregulated in
R-MiFRK1 and
T-MiFRK1 overexpression lines. Previous studies in tobacco (
Nicotiana tabacum) [
36] and
Arabidopsis [
37] have demonstrated that both
enolase and
GAPDH participate in pyruvate synthesis and energy metabolism regulation, which corroborates our findings. These results provide novel insights into the regulatory mechanisms of sugar metabolism in fruits mediated by
FRK gene overexpression.
