Abstract
The micronutrient content is a major aspect of food quality and has been under threat after a gain in production post-green revolution. Calcium (Ca) and magnesium (Mg) are the micronutrients that are cofactors for many enzymes and play a critical role in human physiology. Deciphering the accumulation of these micronutrients in wheat and the identification of QTLs associated with these elements is very significant for cutting the risk of malnutrition in humans. Here, a genome-wide association study (GWAS) of 105 lines from an elite panel of the Wheat Association Mapping Initiative (WAMI) was performed for the two cropping seasons of 2021–2022 and 2022–2023 for the grain calcium and magnesium content (GCaC and GMgC). Notably, two marker trait associations (MTAs), wsnp_Ex_c2718_5038582, Kukri_c11327_977, and RAC875_c9984_1003, were found for the GCaC, and similarly three MTAs (Tdurum_contig28802_213, wsnp_Ex_c34597_42879693, and RFL_Contig6053_3082) were identified for the GMgC in both the cropping seasons, proving their utility and non-redundancy. An MTA associated with a SNP marker (wsnp_Ex_c34597_42879718) was also identified in the two seasons and was significant for both the GCaC and GMgC. Candidate gene analysis showed the association of these MTAs with some of the very vital genes associated with activities where Ca and Mg play significant roles. Our study widens the insights on the genetic control of Ca and Mg accumulation in wheat and the utilization of this information for future breeding programs, wherein wheat improvement with enhanced Ca and Mg may be designed and conducted.
1. Introduction
Wheat (Triticum aestivum L.) is one of the world’s leading food crops and is the cradle for the human civilization, with an annual production of 797.86 million tons over about 223.01 million hectares [1]. It plays a fundamental role in providing global food security, with an average of 19% calories and 21% of the protein required for the daily human diet [2]. However, reports have shown that, worldwide, one out of three people suffer from some form of malnutrition. Almost 45% of deaths below the age of 5 years result from malnutrition, which predominantly occurs in poor or middle-income nations [3]. Combating malnutrition is a global health challenge, for which the United Nations declared 2016 to 2025 as the United Nations Decade of Action on Nutrition. Since it is a decade to address malnutrition in every form and achieve the Sustainable Development Goals, studies and sustainable approaches are required to remove this micronutrient malnutrition.
Calcium (Ca) in the human body forms the structure of bones and is responsible for normal body movements, including tissue rigidity, strength, and flexibility, and it undergoes continuous remodeling through the constant deposition and resorption of Ca into the bone [4]. Ca deficiency leads to osteomalacia and bone softening, which occur in children and adults. Since Ca binds to fatty acids in the body, it reduces lipid absorption and is therefore involved in lowering the risk of cardiovascular disease [5].
Another important micronutrient in human body, magnesium (Mg), is a cofactor for more than 300 enzyme systems, regulating various biochemical reactions, including blood glucose regulation, nerve and muscle functions, blood pressure regulation, and protein synthesis [6]. It is involved in the active transportation of calcium and potassium ions across the cell membrane, which is required for nerve impulse conduction, muscle contractions, and a normal heart rhythm. Essential for energy generation, glycolysis, and oxidative phosphorylation, it also plays an important role in DNA and RNA synthesis [7,8]. According to the WHO, recommended Ca allowances range from 200–400 mg/day for infants to 1300 mg/day for children of 9–18 years and 1000–1200 mg/day for older adults. Similarly, for Mg, it ranges from 30–75 mg for infants to around 400 mg for children and adults [3].
Molecular breeding is an efficient method for facilitating crop improvements targeting micronutrient-related traits. Marker-trait associations (MTAs) associated with micronutrients and various other traits in wheat have been reported using genome-wide association studies (GWASs) [9,10,11,12,13]. With the arrival of next-generation sequencing (NGS) technologies, opportunities for the evaluation of genetic variations and discovery of novel markers have occurred, via the implementation of a genotyping-by-sequencing (GBS) strategy. Deciphering complex agronomical traits by utilizing SNPs through genome-wide association studies (GWAS) has been achieved for various crops and has resulted in the detection of genomic regions, which may be either markers, QTLs, or genes for desired traits [14,15,16].
In GWASs, differentiation between true associations and false-positive MTAs resulting from the population structure and kinship has been a big hurdle [17]. To overcome such associations, various statistical models have been developed, namely the single-locus mixed linear model and multi-locus models. In the single-locus model, the incorporation of two confounding factors is considered for analysis as covariates [17]. However, this may lead to false-negative MTAs due to overfits, which results in missing chances to uncover the loci associated with targeted traits [18]. To overcome such incidences of false-negative MTAs, a variety of multi-locus models has been developed, such as fixed and random model circulating probability unification (FarmCPU) and Bayesian-information and linkage disequilibrium iteratively nested keyway (BLINK). The FarmCPU model includes multiple markers, simultaneously, as the covariates, which eliminates the confounding effect of markers and kinship, and therefore, this removes the false-positive MTAs without compromising true associations. It utilizes a fixed-effect and random effect model for the complete removal of cofounding factors. However, FarmCPU is time-consuming, wherein the numbers of markers and individuals are high. In comparison, BLINK is statistically better and time-efficient, using the Bayesian information criterion. Unlike FarmCPU, BLINK utilizes linkage disequilibrium (LD) to eliminate the assumption that causal genes are evenly distributed across the genome [19,20]. The proper execution of GWASs reveals novel genomic regions associated with targeted traits and hence facilitates an identification of the genes that control such traits. In the present investigation, a GWAS was performed for 105 diverse wheat genotypes from the Wheat Association Mapping Initiative (WAMI) panel for the characterization of the grain calcium and magnesium concentration (GCaC and, GMgC) utilizing 21,132 single nucleotide polymorphisms (SNPs), using FarmCPU and BLINK models. The identification of MTAs and the candidate genes associated with significant and non-redundant MTAs showed that the regions play a significant role in vital activities that are related to the GCaC and GMgC. These genomic regions are useful as novel markers and could be designed to study their introgression in future breeding programs.
2. Results
2.1. Variability of Grain Ca and Mg Concentrations
An estimation of the micronutrient concentrations of Ca and Mg in all 105 grain samples from the cropping seasons 2021–2022 and 2022–2023 was performed. Variations were observed in the concentrations of the estimated micronutrients (Table 1). The frequency distribution of Ca and Mg, in two consecutive cropping seasons, are presented in Figure 1. The phenotypic data for both micronutrients used in this study have been provided in Table S1.
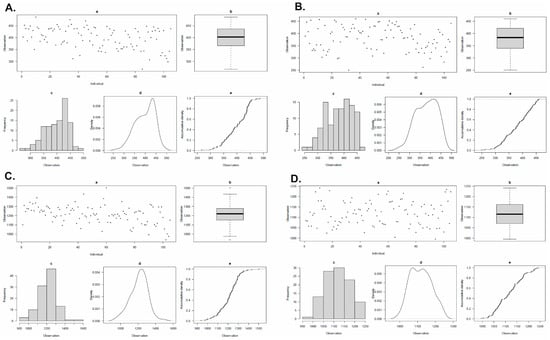
Figure 1.
Histograms and boxplots showing the frequency distribution. (A) GCaC for 2021-2022, (B) GCaC for 2022-2023, (C) GMgC for 2021-2022 and (D) GMgC for 2022-2023 in WAMI panel.

Table 1.
Combined ANOVA table for grain micronutrients in the WAMI panel constituting 105 wheat accessions.
Table 1.
Combined ANOVA table for grain micronutrients in the WAMI panel constituting 105 wheat accessions.
| Source | Df | Ca_SS | Mg_SS |
|---|---|---|---|
| Year | 1 | 42.2 * | 476 * |
| Entry | 104 | 8.79 * | 9.68 * |
| Replication | 2 | 10.3 | 60.5 |
| Year × Entry | 104 | 5.35 * | 7.61 * |
SS: sum of squares; Df: degrees of freedom; *: significant at p ≤ 0.001.
Based on the samples obtained during 2021–2022, the mean GCaC for all three replicates was 398.62 ppm, and for 2022–2023, it was 380.42 ppm, with a final mean of 389.52 ppm (Table 2). The mean GMgC for the years 2021–2022 for all three replicates was 1211.87 ppm, and for 2022–2023, it was 1118.01 ppm, with the final mean being 1164.94 ppm. The frequency distribution of variation for Ca and Mg in two consecutive cropping seasons is presented in Figure 1.
Table 2.
Statistical analysis of the GCaC and GMgC in the WAMI panel constituting two consecutive years for 2021–2022 and 2022–2023.
Table 2.
Statistical analysis of the GCaC and GMgC in the WAMI panel constituting two consecutive years for 2021–2022 and 2022–2023.
| Statistics | 2021–2022 | 2022–2023 | ||
|---|---|---|---|---|
| BLUP Ca | BLUP Mg | BLUP Ca | BLUP Mg | |
| Heritability | 0.66 | 0.73 | 0.68 | 0.78 |
| Genotypic variance | 2312.00 | 10,528.4 | 2786.74 | 4323.17 |
| Grand Mean | 398.62 | 1211.88 | 380.42 | 1118.02 |
| LSD | 49.83 | 73.2 | 49.36 | 85.21 |
| CV | 8.36 | 3.88 | 8.55 | 5.34 |
LSD = least significant difference; CV = coefficient of variation.
2.2. Population Structure Analysis
The allele frequencies in the WAMI panel were found to be distributed evenly based on principal components analysis (Figure 2A). The number of components was determined by the “elbow” in the scree plot, which strongly suggested retaining three principal components (Figure S1). PC1 explained 17.9% of the variance, whereas PC2 explained 5.5% and PC3 explained 3.9%. These findings imply that PC1, PC2, and PC3 collectively account for a significant amount of the panel’s underlying genetic variation, making it possible to recognize and distinguish the subgroups that make up the WAMI population.
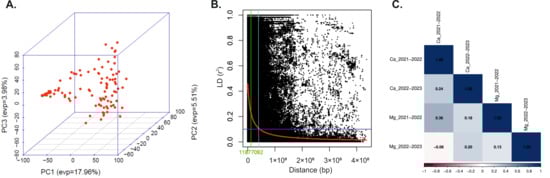
Figure 2.
Population structure, linkage disequilibrium (LD), and correlation coefficients. (A). Scatterplot depicting the results of the principal component analysis (PCA), analyzed based on the genotypic data of the WAMI panel, consisting of 105 wheat accessions. It highlights the population structure of the WAMI panel, as shown by the three components (PC1, PC2, and PC3), providing insights into the genetic relationships among the individuals [21]. (B). Scatter plot of r2 values of pairwise markers representing disequilibrium decay for 105 accessions. The curve shown in red color represents the smoothing spline regression model fitted for LD decay. The horizontal and vertical lines represent the standard critical r2 value and physical distance in base pairs (bp), respectively. The sky blue vertical line represents the physical distance (23,754,184 bp), where the LD half decay intersects the LD decay curve [21]. (C). Pearson’s correlation between two consecutive years for Ca and Mg grain micronutrients.
2.3. MTAs for the Target Trait Utilizing GWASs
To identify the significant associations between Ca and Mg contents and SNP markers in the lines, GWAS analyses were carried out. A scatter plot of r2 values of paired markers was developed, demonstrating genome-wide linkage disequilibrium (LD) degradation for 105 WAMI genotypes, assessed using the Hill and Weir formula [20]. LD analysis was performed using Trait Analysis by aSSociation, Evolution and Linkage (TASSEL) data with a sliding window of 100 SNPs. The average genome-wide r2 was 0.11, with the LD decline starting at r2 = 0.46 and ending at r2 = 0.23 (Figure 2B). The LD decay curve intersected the half-decay and standard critical (r2 = 0.3) lines at 23,754,184 and 11,877,092 base pairs (bp), respectively. This establishes 11,877,092 bp as the genome-wide threshold distance for detecting linkage, as performed in previous works [9,19].
The MTAs were investigated utilizing two multi-locus models, FarmCPU and BLINK, which identified 86 SNP loci with prominent associations with the trait studied and utilization of the Manhattan plots and Quantile-Quantile plot (Q-Q) plots (Figure 3). Genotypic data was available for 26,814 SNPs, but only 21,132 SNPs were utilized for the GWAS. We found 49 SNPs significantly associated with Ca and located on the 12 chromosomes (1A, 1B, 1D, 2A, 2B, 2D, 3A, 3B, 3D, 5A, 6B, and 7A), which was confirmed in the data provided for the consecutive years of cropping seasons using both models (Tables S2–S5). About 37 significant SNPs were found for the GMgC, located significantly on chromosomes 1B, 2A, 2B, 3A, 4A, 4B, 4D, 5B, 6A, 6B, 7A, 7B, and 7D (Tables S6–S9).
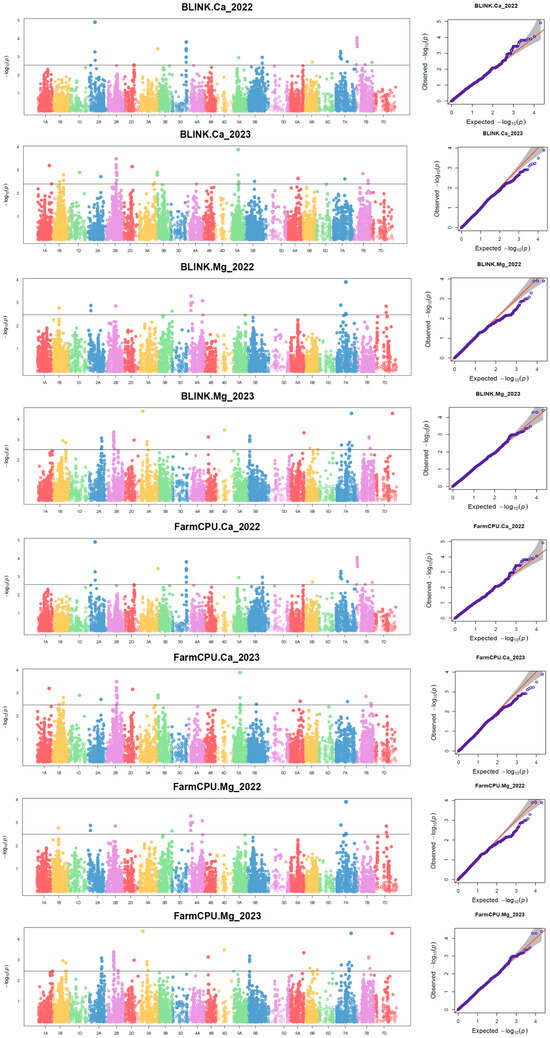
Figure 3.
Manhattan and Q-Q plots of SNPs associated with the GCaC and GMgC, obtained using BLINK and FarmCPU. Q-Q (Quantile-Quantile) plots consist of grey areas, indicating the 95% confidence interval under the null hypothesis, with no association between the SNP and the investigated trait. The significance threshold was −log10(p) = 3.0, and SNPs above this threshold are significantly associated with the GCaC and GMgC in the plots.
2.3.1. MTAs for GCaC
For the initial crop year 2021–2022, the MTAs were found to be distributed on multiple chromosomes, and they were found notably on chromosome 2A (4 MTAs), 3D (13 MTAs), 5A (2 MTAs), 6A (3 MTAs), 7B (6 MTAs), and 7A (5 MTAs). Interestingly, a dense concentration of 13 MTAs were observed between the physical position of 604.6–746.6 Mb on chromosome 3D, exhibiting a significant and rich association. This striking presence potentially underscores a genomic hotspot associated with the Ca content. The presence of four MTAs on 7B was observed within the range of 35.4–37 Mb. Another profound presence of MTAs was on 7A, with three MTAs co-located on 52.9 Mb and one on 49.8 Mb. For the year 2022–2023, these seven MTAs were identified on 2B and 5A. Notably, these four MTAs were consistent in both cropping seasons of 2021–2022 and 2022–2023, with each located on chromosome 2A and 6B and two MTAs on chromosome 5A (Table 3). There were four loci for the GCaC, which showed the presence in both cropping years, Kukri_c11327_977 on chromosome 2A, wsnp_Ex_c2718_5038582 and RAC875_c9984_1003 both on 5A, and wsnp_Ex_c34597_42879718 on 6B.
Table 3.
Description of marker–trait associations (MTAs) detected for the GCaC and GMgC in the WAMI panel for the years 2021–2022 and 2022–2023.
2.3.2. MTAs for GMgC
In the study year 2021–2022, MTAs for the GMgC extended on various chromosomes with a notable presence on 4A (six MTAs), 6A (three MTAs), and 7A (four MTAs). At a specific position of 99.2 Mb on chromosome 4A, two MTAs were found to be co-located. Moreover, two pairs of co-located MTAs on 7A with positions at 159.5 Mb and 696.9 Mb were identified. In the cropping year 2022–2023, a prominent number of MTAs was observed on 2B (six MTAs), 4B (two MTAs), 5B (three MTAs), and 6A (four MTAs). The most prominent observation for MTAs associated with Mg, which were consistent in both the cropping seasons, were on 6A and 6B. There were four loci for the GMgC, which showed the presence in both cropping years. Interestingly out of these, three of them were located on 6A, at 597.8 Mb, i.e., Tdurum_contig28802_213, wsnp_Ex_c34597_42879693, and RFL_Contig6053_3082, while the fourth one, wsnp_Ex_c34597_42879718, was found on 6B at 597.8 Mb.
2.3.3. Multi-Effect MTA Locus for Ca and Mg
A multi-effect MTA locus, represented by wsnp_Ex_c34597_42879718 on chromosome 6B at 597.8 Mb, was found to be responsible for controlling both the traits simultaneously and was consistent for both the consecutive crop seasons.
3. Discussion
One of the biggest global health concerns, which needs immediate attention, is micronutrient malnutrition. High-throughput genotyping technologies, coupled with statistics, provide us with vast information and a better understanding of genomes. Genome-wide association mapping is an effective strategy to facilitate the identification of genes that regulate traits of interest, and its efficiency is dependent on the genetic diversity within the germplasm that is utilized as association panels. Since genome sequencing and genotyping technologies have advanced so quickly, GWASs have been widely used for wheat and many other crops [23,24,25,26,27]. Preliminary work on the WAMI population was undertaken to investigate these advanced wheat lines for SNPs associated with complex traits, without the confounding effects of phenology and plant height [28]. Gene discovery and cloning have been made easier by the wheat reference genome and a wealth of transcriptomic resources [29,30]. Additionally, this has made it much easier to investigate the QTLs for traits related to wheat yields and quality. Since wheat is one of the most important crops in the world, breeding it to accumulate more nutrients will help reduce nutrient deficiencies. For fulfilling such objectives, GWASs are used to identify genomic regions associated with micronutrient traits. The pyramiding of different micronutrients related markers into high-yield genotypes can remove micronutrient deficiency in populations. The availability of multiple micronutrient-related QTLs/MTAs in wheat germplasms utilized from different countries has also been studied previously [31,32]. Various panels for investigating QTLs associated with grain Ca have been used earlier, one of which utilized a European wheat diversity panel of 353 varieties with 90k and 35k SNP markers [27]. Moreover, for the mitigation of false positive associations, it is important to consider population structure in GWASs [32].
In the present investigation, for deciphering the novel GCaC- and GMgC-associated MTAs, the crops grown in the years 2021–2022 and 2022–2023 were used, utilizing the diverse wheat panel of the WAMI. The study decoded the involvement of multiple QTLs that contribute to the desired traits and highlighted a total of 86 MTAs (49 for the GCaC and 37 for the GMgC). Many MTAs identified in our studies have not been reported earlier, and therefore, they are potentially novel MTAs controlling the GCaC and GMgC. This may be due to the different origins of the panels/populations and different methods used for their detection. Here, chromosomes 1A, 1B, 1D, 2A,2B, 2D, 3A, 3B, 3D, 5A, 6B, 7A, and 7B were found to carry QTLs for the GCaC in wheat, as reported earlier [33,34,35,36,37,38,39,40], indicating the potential role of these chromosomes in different populations in the GCaC. The QTLs wsnp_Ex_c2718_5038582, Kukri_c11327_977, and RAC875_c9984_1003 were found to be associated with the GCaC earlier [26] and are consistent with the QTLs detected in the present investigation for both cropping seasons, making them the most significant loci for the GCaC and its accumulation. The QTLs Excalibur_c23906_303 and wsnp_Ra_c193_406396 were found to be in proximity of another QTL reported [41] on 1D for the GCaC under hydroponic conditions, indicating their utility as potential markers under different conditions.
For the GMgC, chromosomes 1B, 2A, 2B, 3A, 4A, 4B, 4D, 5B, 6A, 6B, 7A, 7B, and 7D were found to carry QTLs for the indicated traits that were found to be involved in previous studies [34,39,36,42,43,44,45]. The QTLs Tdurum_contig28802_213, wsnp_Ex_c34597_42879693, and RFL_Contig6053_3082 were associated with the GMgC and reported in the present investigation for both cropping seasons, and they have been identified [24] in another study, but under different environmental conditions, and thus, they promise to be genuine for GMgC accumulation. The QTL wsnp_Ex_c34597_42879718, located on 6B at 597.8 Mb, had been associated with the GCaC [24] and was also found to be present in both cropping seasons and thus promises to be a genuine locus for the GCaC.
In this study, we identified credible candidate genes for major MTAs, including Kukri_c11327_977 (TraesCS2A03G0585200), which has a major role in the STI1/HOP, DP domain. Sti1/Hop (Stress-inducible phosphoprotein 1 or Hsp-organizing protein) is a cochaperone exclusive to eukaryotes and is highly involved in regulating the heat shock proteins Hsp70 and Hsp90 through ATP binding or hydrolysis, the delivery of client proteins, or the modulation of intermediate conformations, for effectiveness against the stress response in plants [46]. This association of Hsp with STIP1 occurs in a calcium-dependent manner [47]. Moreover, STI1 is involved in protein folding and cellular homeostasis, eventually protecting cells from stress, resulting in cellular resistance and normal growth [48].
An effective marker for GCaC, wsnp_Ex_c2718_5038582, encodes stomatal closure-related actin-binding protein (TraesCS5A03G0124000). A recent report validated the role of stomatal closure-related actin-binding protein (SCAB), which is considered a molecular switch for F-actin, resulting in stomatal closure [49]. Additionally, phosphorylation through calcium sensors, such as calcium-dependent protein kinase (CPK), acts as a sensor for the increase and decrease in Ca concentrations. This leads to the regulation and activation of various transcription factors, enzymes, ion channels, and genes. CPKs have important functions in plant adaptation under salinity, drought, heat, and cold stress environments [50]. Another candidate gene, TraesCS5A03G0126700, is associated with the bHLH transcription factor MYC, which is responsible for plant hormone signal transduction.. Calcium signaling is perceived by calcium-binding proteins, activating downstream pathways involving protein kinases and transcription factors (bHLH transcription factor MYC2) [51]. It is transcription-regulatory activity that modulates the transcription of gene sets through selective and non-covalent binding to a specific double-stranded genomic DNA sequence (sometimes referred to as a motif). The function of this gene has also been studied in wheat for plant hormone signal transduction during biotic stress [52]. The role of Ca2+ has been studied in plant stress adaptation, which fluctuates in response to the stress signals. The Ca2+ level modulates various physiological processes responsible for stress adaptation, which is accomplished via Ca2+/calmodulin (CaM)-binding transcription factors involved in the stress signaling pathway [53].
We noted that another major MTA, i.e., RAC875_c9984_1003 encoding TraesCS5A03G0926200, is involved in the biological process of photosystem II, where Ca2+ acts as functional and structural cofactor [54,55]. The MTAs identified in this region were involved in gene-coding regions related to the extracellular region, cellular component, calmodulin binding, and signaling, as reported in previous studies [56,57,58,59]. Likewise, significant work by Taneja et al. [60,61] suggested the diversified role of Ca2+ ATPases, antiporters in wheat. The MTA for GMgC, RFL_Contig6053_3082, encodes nucleobase-containing compound metabolic processes (TraesCS6A03G0934500). It is involved in hydrolase activity, nuclease activity, and any cellular metabolic process involving nucleobases, nucleotides, nucleosides, and nucleic acids [62]. Similarly, we detected TraesCS6A03G0937800, which participates in phytohormone signaling, transcriptional regulatory factors, and post-translation modifications, where Mg plays a crucial role in influencing the grain weight and processes leading to wheat seed formation [63,64]. It is accomplished via carbohydrate metabolism and ATP-dependent processes, which are significant for energy-consuming grain development and dry matter accumulation [65].
Considering the GMgC, one of the major MTAs, Tdurum_contig28802_213, encodes the Ribonuclease H-like superfamily (TraesCS6A03G0934500), which has been found to be involved in the catalytic activity of the Ribonuclease H-like superfamily [66]. The same region has a gene encoding the GroES-like superfamily (TraesCS6A03G0939400). GroES harnesses ATP hydrolysis for power generation and catalyzes protein folding, where Mg2+ is essentially involved y in this process of protein folding and refolding [67]. For the region wsnp_Ex_c34597_42879693, a gene encoding oxidoreductase activity (TraesCS6A03G0939400) in plants was found, where Mg2+ acts as an essential cofactor for enzymes including RuBisCO [68,69]. This enzyme has a key role in carbon fixation involving electron-transfer reactions. A major MTA, wsnp_Ex_c34597_42879718, associated with the GCaC and GMgC, harbors gene TraesCS6A03G0936800 (EF-hand domain). The EF-hand domain consists of proteins with motifs that actively bind Ca2+ and occasionally Mg2+, which brings about conformational changes for protein activation and downstream signaling [70,71]. EF-hand-containing calcium-binding proteins include calcium-dependent protein kinases (CDPK/CPKs), calmodulins (CaMs), CPK-related protein kinases (CRKs), calmodulin-like (CML), calcium calmodulin-dependent protein kinases (CCaMKs), and calcineurin B-like (CBL) [72,73,74]. In an interesting study on wheat, EF-hand domain-containing proteins were identified, along with Ca2+-mediated signals regulated by EF-hand proteins [75].
4. Materials and Methods
4.1. Genetic Material and Experimental Conditions
The grain micronutrient concentrations (Ca and Mg) were investigated using spring wheat lines from the Wheat Association Mapping Initiative (WAMI) population from the International Maize and Wheat Improvement Center (CIMMYT), Mexico [29]. This consisted of 105 elite and genetically diverse wheat lines, the distribution of which was assessed via the International Wheat Improvement Network (IWIN) by CIMMYT. Due to the presence of a narrow range of variation in the days to heading and plant height, this is suitable for gene discovery with no confounding effects of plant height and phenology. The crops were grown for two consecutive cropping seasons in the years 2021–2022 and 2022–2023 at the research farm of Eternal University, Baru Sahib, Himachal Pradesh, India, using three replications. Each block of a 2 m row with a 0.10 m plant spacing was designated to represent a genotype. The fertilizers used were 120 kg N, 40 kg K2O, and 60 kg P2O5, with the thorough use of all fertilizers at the time of sowing, except nitrogen. The dose of N was used in three parts: half at sowing, one-fourth on initial irrigation i.e., 21 days after sowing, and the remaining one-fourth during the second irrigation i.e., 45 days after sowing. The distance in the plantation was 20 cm, with 5 cm between the plants.
4.2. DNA Extraction and Genotyping
The extraction of DNA, genotyping of the samples, and data processing were performed as previously described [76]. Further, genotyping was carried out by the USDA-ARS Small Grain Genotyping Center, Fargo, ND, USA using an Illumina 90K Infinium iSelect assay (Illumina Inc., San Diego, CA, USA) [45]. The process of SNP calling used the default clustering algorithm integrated into Genome Studio v2011.1 (Illumina Inc., San Diego, CA, USA), which resulted in the identification of a total of 26,814 bi-allelic SNPs [44,76]. For upholding standards in data quality, SNPs characterized with a minor allele frequency (MAF) lower than 0.05 were eliminated from the analysis, including monomorphic and low-quality SNPs. Such thorough filtration resulted in the retention of around 21,132 polymorphic SNPs, which were utilized for the GWAS in our study [44,77].
4.3. Elemental Analysis of GCaC and GMgC
Approximately 0.5 g of homogenized seed material was measured into a digestion tube and subjected to digestion with suprapure nitric acid with a microwave digester. The digestate was filtered using Whatman® filter paper no. 42 and diluted to a volume of 10 mL using ultrapure water in a calibrated volumetric flask.
The concentrations of analytes were quantified utilizing inductively coupled plasma–optical emission spectroscopy (ICP-OES; Manufacturer: Perkin Elmer, Shelton, CT, USA, Model: 7300DV). Calibration was conducted using blanks and five matrix-matched standards. The calibration curve was generated based on linear regression, requiring a minimum correlation coefficient of 0.995. The GCaC and GMgC were examined in radial mode, using the standard approach (approach 984.27).
4.4. Statistical Analyses
The analysis of Pearson’s correlation coefficients was conducted utilizing the Agricolae (version 1.2–4) package of R (version 4.0.3) software [78]. Components of variance were studied using the restricted maximum likelihood (REML) method implemented in META-R software v6.0.4 [79]. Data of BLUP was extracted utilizing the ‘lme40 package in R [80], using the following formula:
y = Xb + Zu + e
Of these, y is the observed phenotype, Xb is the fixed effects (environment), Zu is the random effect (genotype), and e is the residual effect.
Statistical analysis, including the mean, coefficient of variation (CV), and standard deviation, was performed utilizing SPSS v. 17.0 (SPSS Inc., Chicago, IL, USA, 2008). Variance components were used to calculate the broad sense heritability (hb2) of micronutrient-related traits, as follows:
where σg2, σge2, and σε2 represent the genotype, genotype × environment interaction, and residual error variances, respectively, and e and r are the numbers of environments and replicates per environment, respectively.
hb2 = σg2/(σg2 + σge2/r + σε2/re)
4.5. Population Structure, Kinship Matrix, and Principal Components Analyses (PCAs)
The population structure matrix or Q matrix was modeled utilizing a PCA for the genotypic data of a total of 21,132 high-quality SNPs, as described earlier [15]. The kinship matrix (relatedness or K matrix) was evaluated using R (version 4.0.3) software, utilizing the parameters given by VanRaden and Yin et al. [81,82]. Utilizing the Bayesian information criterion (BIC), the optimum numbers of PCAs were identified [83]. A scatter plot was formed using the first two principal components, which demonstrated the genotype distribution.
4.6. Genome-Wide Association Analyses
The GWAS was performed utilizing 21,132 high-quality SNPs available from the CIMMYT, Mexico website (https://data.cimmyt.org/dataset.xhtml?persistentId=hdl:11529/10714; accessed on 22 December 2023). Among the SNP markers, pairwise squared allele–frequency correlations (r2) were determined using TASSEL software (Trait Analysis by aSSociation, Evolution, and Linkage) ver. 5.2.9, with a sliding window size of 100. A plot between the r2 values and genetic distance (cM) was made for assessing the LD between the loci. Forming a smoothing spline regression line at the genome level, the LD decay curve utilizing the Hill and Weir method [20] in the R environment was achieved with a script utilized by Marroni et al. [84]. Following earlier studies for the identification of significant MTAs, a significant threshold of p < 0.001 (−log10(p) > 3.0) was considered [9,85,86]. However, as no MTAs passed the false discovery rate (FDR) test, those with p ≤ 0.001 in both FarmCPU and BLINK models were considered significantly associated with traits in the present study. In the present study, this QTL was also identified for the GMgC for both cropping seasons, proving its non-redundancy and ability to be used for detecting the contents of multiple micronutrients in wheat. When breeding for higher GCaC and GMgC contents, attention may be paid to these MTAs. These identified MTAs provide valuable insights into the molecular mechanisms corresponding to grain micronutrients in wheat. However, it is a prerequisite to consider the environmental factors while making breeding decisions, with proper validation using independent populations, which plays a crucial role in the performance of the traits.
4.7. Putative Candidate Gene Predictions
The Ensembl Plants database was employed for extracting the molecular and biological information of MTAs by utilizing IWGSC RefSeq v.2.1 [Available at: https://plants.ensembl.org/biomart/martview/6898327221e3d05165d778da85766c12; accessed 21 July 2025]. A window of a physical distance of 2 Mb in the genomic area, both in the upstream and downstream vicinity of the selected SNPs, was utilized for the prediction of candidate genes influencing the trait.
5. Conclusions
The MTAs reported in this study were found to be significant in both the cropping seasons, and the non-redundancy was further confirmed using the two GWAS models. This makes them robust enough to be used for breeding for a higher GCaC and GMgC, and therefore, attention may be paid to these MTAs. These identified MTAs provide valuable insights into the molecular mechanisms corresponding to grain micronutrients in wheat. However, it is prerequisite to consider the environmental factors while making breeding decisions, with proper validation using independent populations, which plays a crucial role in the performance of the traits.
Supplementary Materials
The following supporting information can be downloaded at: https://www.mdpi.com/article/10.3390/plants14223472/s1. Figure S1. Scree plot of Principal Component Analysis (PCA) eigenvalues for genotype data. Table S1. Concentrations of calcium (Ca) and magnesium (Mg) in 105 WAMI panel lines. Table S2. Identification of Marker-Trait Associations (MTAs) for Ca concentration using Blink (2021–2022). Table S3. Identification of Marker-Trait Associations (MTAs) for Ca concentration using FarmCPU (2021–2022). Table S4. Identification of Marker-Trait Associations (MTAs) for Ca concentration using Blink (2022–2023). Table S5. Identification of Marker-Trait Associations (MTAs) for Ca concentration using Farm CPU (2022–2023). Table S6: Identification of Marker-Trait Associations (MTAs) for Mg concentration using Blink (2021-2022). Table S7. Identification of Marker-Trait Associations (MTAs) for Mg concentration using Farm CPU (2021–2022). Table S8. Identification of Marker-Trait Associations (MTAs) for Mg concentration using Blink (2022-2023). Table S9. Identification of Marker-Trait Associations (MTAs) for Mg concentration using Farm CPU (2022–2023).
Author Contributions
Conceptualization, N.K.V.; methodology, C.N. and N.K.V.; formal analysis, C.N. and N.K.V.; investigation, C.N., N.K.V., and K.K.; resources, K.K., P.V., and N.K.V.; data curation, N.K.V. and C.N.; writing—original draft preparation, C.N. and N.K.V.; writing—review and editing, R.D., P.V., and N.K.V.; visualization, C.N., R.D., and N.K.V.; supervision, N.K.V. and K.K.; project administration, N.K.V.; funding acquisition, N.K.V. All authors have read and agreed to the published version of the manuscript.
Funding
This research was funded by the Science and Engineering Research Board, New Delhi, grant number SRG/2020/000091.
Data Availability Statement
The single-nucleotide polymorphism (SNP) genotyping data of the Wheat Association Mapping Initiative (WAMI) germplasm panel of spring wheat, which are used for the present study, have been published previously by Sukumaran et al. [44] and are available publicly to download from the link: http://hdl.handle.net/11529/10714 (accessed on 12 July 2024). All other data generated or analyzed during this study are included in this published article.
Acknowledgments
We sincerely acknowledge the International Maize and Wheat Improvement Center (CIMMYT), Mexico, for generously providing the WAMI population and granting access to the molecular data used in this study.
Conflicts of Interest
The authors declare no conflicts of interest. The funders had no role in the design of the study; in the collection, analyses, or interpretation of data; in the writing of the manuscript; or in the decision to publish the results.
Abbreviations
The following abbreviations are used in this manuscript:
| BIC | Bayesian information criterion |
| BLINK | Bayesian-information and linkage disequilibrium iteratively nested keyway |
| BLUP | Best Linear Unbiased Prediction |
| CIMMYT | International Maize and Wheat Improvement Center |
| CV | Coefficient of variation |
| FarmCPU | Fixed, and random model circulating probability unification |
| GCaC | Grain calcium content |
| GMgC | Grain magnesium content |
| GWAS | Genome-wide association study |
| ICP-OES | Inductively coupled plasma–optical emission spectroscopy |
| Mg | Magnesium |
| MTAs | Marker trait associations |
| PCA | Principal component analysis |
| QTL | Quantitative trait loci |
| r2 | Pairwise squared allele–frequency correlations |
| REML | Restricted maximum likelihood |
| TASSEL | Trait Analysis by aSSociation, Evolution and Linkage |
| WAMI | Wheat Association Mapping Initiative |
| Ca | Calcium |
| IWIN | International Wheat Improvement Network |
| LD | Utilizes linkage disequilibrium |
| LSD | Least significant difference |
| MAF | Minor allele frequency |
| Q-Q | Quantile–Quantile |
References
- FAOSTAT. Food and Agriculture Organization. 2025. Available online: https://www.fao.org/faostat/en/#data/QCL (accessed on 7 May 2025).
- Jiang, T.; Wang, B.; Xu, X.; Cao, Y.; Li-Liu, D.; He, L.; Jin, N.; Ma, H.; Chen, S.; Zhao, K.; et al. Identifying sources of uncertainty in wheat production projections with consideration of crop climatic suitability under future climate. Agric. For. Meteorol. 2022, 319, 108933. [Google Scholar] [CrossRef]
- World Health Organization. Fact Sheets. 2025. Available online: https://www.who.int/health-topics/nutrition/infographics-wasting#tab=tab_2 (accessed on 10 May 2025).
- Weaver, C.M. Calcium. In Present Knowledge in Nutrition; Marriott, B.P., Birt, D.F., Stallings, V.A., Yates, A.A., Eds.; Wiley-Blackwell: Cambridge, MA, USA, 2022; pp. 21–48. [Google Scholar]
- Mulet-Cabero, A.I.; Wilde, P.J. Role of calcium on lipid digestion and serum lipids: A review. Crit. Rev. Food Sci. Nutr. 2023, 63, 813–826. [Google Scholar] [CrossRef]
- Institute of Medicine (IOM). Food and Nutrition Board. Dietary Reference Intakes: Calcium, Phosphorus, Magnesium, Vitamin D and Fluoride; National Academy Press: Washington, DC, USA, 1997. [Google Scholar]
- Rude, R.K. Magnesium. In Modern Nutrition in Health and Disease; Ross, A.C., Caballero, B., Cousins, R.J., Tucker, K.L., Ziegler, T.R., Eds.; Lippincott Williams & Wilkins: Baltimore, MA, USA, 2012; pp. 159–175. [Google Scholar]
- Rude, R.K.; Singer, F.R.; Gruber, H.E. Skeletal and hormonal effects of magnesium deficiency. J. Am. Coll. Nutr. 2009, 28, 131–141. [Google Scholar] [CrossRef] [PubMed]
- Alemu, A.; Brazauskas, G.; Gaikpa, D.S.; Henriksson, T.; Islamov, B.; Jørgensen, L.N.; Koppel, M.; Koppel, R.; Liatukas, Ž.; Svensson, J.; et al. Genome-wide association analysis and genomic prediction for adult-plant resistance to Septoria tritici blotch and powdery mildew in winter wheat. Front. Genet. 2021, 12, 661742. [Google Scholar] [CrossRef] [PubMed]
- Rabieyan, E.; Bihamta, M.R.; Moghaddam, M.E.; Alipour, H.; Mohammadi, V.; Azizyan, K.; Javid, S. Analysis of genetic diversity and genome-wide association study for drought tolerance related traits in Iranian bread wheat. BMC Plant Biol. 2023, 23, 431. [Google Scholar] [CrossRef]
- Tadesse, W.; Gataa, Z.; Rachdad, F.E.; El Baouchi, A.; Kehel, Z.; Alemu, A. Single- and multi-trait genomic prediction and genome-wide association analysis of grain yield and micronutrient-related traits in ICARDA wheat under drought environment. Mol. Genet. Genom. 2023, 298, 1515–1526. [Google Scholar] [CrossRef] [PubMed]
- Krishnappa, G.; Khan, H.; Krishna, H.; Kumar, S.; Mishra, C.N.; Parkash, O.; Devate, N.B.; Nepolean, T.; Rathan, N.D.; Mamrutha, H.M.; et al. Genetic dissection of grain iron and zinc, and thousand kernel weight in wheat (Triticum aestivum L.) using genome-wide association study. Sci. Rep. 2022, 12, 12444. [Google Scholar] [CrossRef]
- Emam, A.I.I.; Kamal, N.M.; Gorafi, Y.S.A.; Tahir, I.S.A.; Balla, M.Y.; Tsujimoto, H.; Ishii, T. Enriched grain minerals in Aegilops tauschii-derived common wheat population under heat-stress environments. Sci. Rep. 2025, 15, 5624. [Google Scholar] [CrossRef]
- Bhadana, D.; Kaur, P.; Kaur, R.; Ravat, V.K.; Ashutosh; Kumar, R.; Vasistha, N.K. Genome-wide association study for powdery mildew resistance in CIMMYT’s spring wheat germplasm. Plant Pathol. 2024, 74, 455–464. [Google Scholar] [CrossRef]
- Kaler, A.S.; Gillman, J.D.; Beissinger, T.; Purcell, L.C. Comparing different statistical models and multiple testing corrections for association mapping in soybean and maize. Front. Plant Sci. 2020, 10, 1794. [Google Scholar] [CrossRef]
- Price, A.L.; Patterson, N.J.; Plenge, R.M.; Weinblatt, M.E.; Shadick, N.A.; Reich, D. Principal components analysis corrects for stratification in genome-wide association studies. Nat. Genet. 2006, 38, 904–909. [Google Scholar] [CrossRef]
- Liu, X.; Huang, M.; Fan, B.; Buckler, E.S.; Zhang, Z. Iterative usage of fixed and random effect models for powerful and efficient genome-wide association studies. PloS Genet. 2016, 12, e1005767. [Google Scholar] [CrossRef]
- Huang, M.; Liu, X.; Zhou, Y.; Summers, R.M.; Zhang, Z. BLINK: A package for the next level of genome-wide association studies with both individuals and markers in the millions. Giga Sci. 2019, 8, giy154. [Google Scholar] [CrossRef]
- Kaur, R.; Vasistha, N.K.; Ravat, V.K.; Mishra, V.K.; Sharma, S.; Joshi, A.K.; Dhariwal, R. Genome-wide association study reveals novel powdery mildew resistance loci in bread wheat. Plants 2023, 12, 3864. [Google Scholar] [CrossRef]
- Hill, W.G.; Weir, B.S. Variances and covariances of squared linkage disequilibria in finite populations. Theor. Popul. Biol. 1988, 33, 54–78. [Google Scholar] [CrossRef] [PubMed]
- Elkelish, A.; Alqudah, A.M.; Alomari, D.Z.; Alammari, B.S.; Alsubeie, M.S.; Hamed, S.M.; Thabet, S.G. Targeting candidate genes for the macronutrient accumulation of wheat grains for improved human nutrition. Cereal Res. Commun. 2024, 53, 719–732. [Google Scholar] [CrossRef]
- Aljabri, M.; El-Soda, M. Genome-wide association mapping of macronutrient mineral accumulation in wheat (Triticum aestivum L.) grain. Plants 2024, 13, 3472. [Google Scholar] [CrossRef] [PubMed]
- Edwards, D.; Batley, J.; Snowdon, R.J. Accessing complex crop genomes with next-generation sequencing. Theor. Appl. Genet. 2013, 126, 1–11. [Google Scholar] [CrossRef]
- Yu, P.; Ye, C.; Li, L.; Yin, H.; Zhao, J.; Wang, Y.; Zhang, Z.; Li, W.; Long, Y.; Hu, X.; et al. Genome-wide association study and genomic prediction for yield and grain quality traits of hybrid rice. Mol. Breed. 2022, 42, 16. [Google Scholar] [CrossRef]
- Pang, Y.; Liu, C.; Wang, D.; Amand, P.S.; Bernardo, A.; Li, W.; He, F.; Li, L.; Wang, L.; Yuan, X.; et al. High-resolution genome-wide association study identifies genomic regions and candidate genes for important agronomic traits in wheat. Mol. Plant. 2020, 13, 1311–1327. [Google Scholar] [CrossRef]
- Shariatipour, N.; Heidari, B.; Tahmasebi, A.; Richards, C. Comparative genomic analysis of quantitative trait loci associated with micronutrient contents, grain quality, and agronomic traits in wheat (Triticum aestivum L.). Front. Plant Sci. 2021, 12, 709817. [Google Scholar] [CrossRef]
- Alomari, D.Z.; Eggert, K.; von Wirén, N.; Pillen, K.; Röder, M.S. Genome-wide association study of calcium accumulation in grains of European wheat cultivars. Front. Plant Sci. 2017, 8, 1797. [Google Scholar] [CrossRef]
- Lopes, M.S.; Dreisigacker, S.; Pena, R.J.; Sukumaran, S.; Reynolds, M.P. Genetic characterization of the wheat association mapping initiative (WAMI) panel for dissection of complex traits in spring wheat. Theor. Appl. Genet. 2015, 128, 453–464. [Google Scholar] [CrossRef]
- Kang, Y.; Barry, K.; Cao, F.; Zhou, M. Genome-wide association mapping for adult resistance to powdery mildew in common wheat. Mol. Biol. Rep. 2020, 47, 1241–1256. [Google Scholar] [CrossRef]
- Mazumder, A.K.; Yadav, R.; Kumar, M.; Babu, P.; Kumar, N.; Singh, S.K.; Solanke, A.U.; Wani, S.H.; Alalawy, A.I.; Alasmari, A.; et al. Discovering novel genomic regions explaining adaptation of bread wheat to conservation agriculture through GWAS. Sci. Rep. 2024, 14, 16351. [Google Scholar] [CrossRef] [PubMed]
- Ma, J.; Ren, J.; Yuan, X.; Yuan, M.; Zhang, D.; Li, C.; Zeng, Q.; Wu, J.; Han, D.; Jiang, L. Genome-wide association study reveals the genetic variation and candidate gene for grain calcium content in bread wheat. Plant Cell Rep. 2023, 42, 1379–1390. [Google Scholar] [CrossRef]
- Bhatta, M.; Baenziger, P.S.; Waters, B.M.; Poudel, R.; Belamkar, V.; Poland, J.; Morgounov, A. Genome-wide association study reveals novel genomic regions associated with 10 grain minerals in synthetic hexaploid wheat. Int. J. Mol. Sci. 2018, 19, 3237. [Google Scholar] [CrossRef] [PubMed]
- Shi, X.; Zhou, Z.; Li, W.; Qin, M.; Yang, P.; Hou, J.; Huang, F.; Lei, Z.; Wu, Z.; Wang, J. Genome-wide association study reveals the genetic architecture for calcium accumulation in grains of hexaploid wheat (Triticum aestivum L.). BMC Plant Biol. 2022, 22, 229. [Google Scholar] [CrossRef] [PubMed]
- Rathan, N.D.; Krishna, H.; Ellur, R.K.; Sehgal, D.; Govindan, V.; Ahlawat, A.K.; Krishnappa, G.; Jaiswal, J.P.; Singh, J.B.; Sv, S. Genome-wide association study identifies loci and candidate genes for grain micronutrients and quality traits in wheat (Triticum aestivum L.). Sci. Rep. 2022, 12, 7037. [Google Scholar] [CrossRef]
- Wang, W.; Guo, H.; Wu, C.; Yu, H.; Li, X.; Chen, G.; Tian, J.; Deng, Z. Identification of novel genomic regions associated with nine mineral elements in Chinese winter wheat grain. BMC Plant Biol. 2021, 21, 311. [Google Scholar] [CrossRef]
- Sigalas, P.P.; Shewry, P.R.; Riche, A.; Wingen, L.; Feng, C.; Siluveru, A.; Chayut, N.; Burridge, A.; Uauy, C.; Castle, M.; et al. Improving wheat grain composition for human health by constructing a QTL atlas for essential minerals. Commun. Biol. 2024, 7, 1001. [Google Scholar] [CrossRef]
- Yang, F.; Dong, F.S.; Hu, F.H.; Liu, Y.W.; Chai, J.F.; Zhao, H.; Lv, M.Y.; Zhou, S. Genome-wide identification and expression analysis of the calmodulin-binding transcription activator (CAMTA) gene family in wheat (Triticum aestivum L.). BMC Genet. 2020, 21, 105. [Google Scholar] [CrossRef]
- Peleg, Z.; Cakmak, I.; Ozturk, L.; Yazici, A.; Jun, Y.; Budak, H.; Korol, A.B.; Fahima, T.; Saranga, Y. Quantitative trait loci conferring grain mineral nutrient concentrations in durum wheat × wild emmer wheat RIL population. Theor. Appl. Genet. 2009, 119, 353–369. [Google Scholar] [CrossRef]
- Genc, Y.; Taylor, J.; Rongala, J.; Oldach, K. A major locus for chloride accumulation on chromosome 5A in bread wheat. PLoS ONE 2014, 9, 98845. [Google Scholar] [CrossRef]
- Alqudah, A.M.; Elkelish, A.; Abu-Elsaoud, A.M.; Hassan, S.E.D.; Thabet, S.G. Genome-wide association study reveals the genetic basis controlling mineral accumulation in wheat grains under potassium deficiency. Genet. Res. Crop Evol. 2025, 72, 783–796. [Google Scholar] [CrossRef]
- Zhang, F.S. Characterization of quantitative trait loci for grain minerals in hexaploid wheat (Triticum aestivum L.). J. Integr. Agric. 2013, 12, 1512–1521. [Google Scholar] [CrossRef]
- Hao, Y.; Kong, F.; Wang, L.; Zhao, Y.; Li, M.; Che, N.; Li, S.; Wang, M.; Hao, M.; Zhang, X.; et al. Genome-wide association study of grain micronutrient concentrations in bread wheat. J. Integr. Agri. 2024, 23, 1468–1480. [Google Scholar] [CrossRef]
- Alomari, D.Z.; Alqudah, A.M.; Pillen, K.; von Wirén, N.; Röder, M.S. Toward identification of a putative candidate gene for nutrient mineral accumulation in wheat grains for human nutrition purposes. J. Exp. Bot. 2021, 72, 6305–6318. [Google Scholar] [CrossRef]
- Sukumaran, S.; Crossa, J.; Jarquín, D.; Lopes, M.; Reynolds, M.P. Genomic and pedigree prediction with genotype x environment interaction in spring wheat grown in South and Western Asia, North Africa, and Mexico. G3 Genes|Genomes|Genet. 2016, 7, 481–495. [Google Scholar] [CrossRef] [PubMed]
- Wang, S.; Wong, D.; Forrest, K.; Allen, A.; Chao, S.; Huang, B.E.; Maccaferri, M.; Salvi, S.; Milner, S.G.; Cattivelli, L. Characterization of polyploid wheat genomic diversity using a high-density 90,000 single nucleotide polymorphism array. Plant Biotechnol. J. 2014, 12, 787–796. [Google Scholar] [CrossRef] [PubMed]
- Dean, M.E.; Johnson, J.L. Human Hsp90 cochaperones: Perspectives on tissue-specific expression and identification of cochaperones with similar in vivo functions. Cell Stress Chaperones 2021, 26, 3–13. [Google Scholar] [CrossRef]
- Maciejewski, A.; Prado, V.F.; Prado, M.A.M.; Choy, W.-Y. Molecular basis for the interaction between stress-inducible phosphoprotein 1 (STIP1) and S100A1. Biochem. J. 2017, 474, 1853–1866. [Google Scholar] [CrossRef]
- Gao, F.; Han, X.; Wu, J.; Zheng, S.; Shang, Z.; Sun, D.; Zhou, R.; Li, B. A heat-activated calcium-permeable channel–Arabidopsis cyclic nucleotide-gated ion channel 6–is involved in heat shock responses. Plant J. 2012, 70, 1056–1069. [Google Scholar] [CrossRef] [PubMed]
- Valmonte-Cortes, G.R.; Higgins, C.M.; MacDiarmid, R.M. Arabidopsis Calcium Dependent Protein Kinase 3, and Its Orthologues OsCPK1, OsCPK15, and AcCPK16, Are Involved in Biotic and Abiotic Stresses. Plants 2025, 14, 294. [Google Scholar] [CrossRef]
- Atif, R.M.; Shahid, L.; Waqas, M.; Ali, B.; Rashid, M.A.R.; Azeem, F.; Nawaz, M.A.; Wani, S.H.; Chung, G. Insights on Calcium-Dependent Protein Kinases (CPKs) Signaling for Abiotic Stress Tolerance in Plants. Int. J. Mol. Sci. 2019, 20, 5298. [Google Scholar] [CrossRef]
- Khan, F.S.; Goher, F.; Paulsmeyer, M.N.; Hu, C.G.; Zhang, J.Z. Calcium (Ca2+) sensors and MYC2 are crucial players during jasmonates-mediated abiotic stress tolerance in plants. Plant Biol. 2023, 25, 1025–1034. [Google Scholar] [CrossRef]
- Cao, P.; Wang, Y.; Ma, Z.; Xu, X.; Ma, D.; Yang, L. Genome-wide identification of long intergenic non-coding RNAs of responsive to powdery mildew stress in wheat (Triticum aestivum). Front. Plant Sci. 2023, 14, 1297580. [Google Scholar] [CrossRef] [PubMed]
- Reddy, A.S.; Ali, G.S.; Celesnik, H.; Day, I.S. Coping with stresses: Roles of calcium- and calcium/calmodulin-regulated gene expression. Plant Cell 2011, 23, 2010–2032. [Google Scholar] [CrossRef] [PubMed]
- Avramov, A.P.; Hwang, H.J.; Burnap, R.L. The role of Ca2+ and protein scaffolding in the formation of nature’s water oxidizing complex. Proc. Natl. Acad. Sci. USA 2020, 117, 28036–28045. [Google Scholar] [CrossRef]
- Shi, H.; Yang, K.; Xiong, L. Effect of calcium ions on the secondary structures of photosystem II and its relations with photoinhibition. Chin. Sci. Bull. 1998, 43, 1722–1727. [Google Scholar] [CrossRef]
- Knight, H. Calcium signaling during abiotic stress in plants. Int. Rev. Cytol. 2000, 195, 269–324. [Google Scholar]
- Wu, Z.; Liang, F.; Hong, B.; Young, J.C.; Sussman, M.R.; Harper, J.F.; Sze, H. An endoplasmic reticulum-bound Ca2+/Mn2+ pump, ECA1, supports plant growth and confers tolerance to Mn2+ stress. Plant Physiol. 2002, 130, 128–137. [Google Scholar] [CrossRef]
- Wdowiak, A.; Podgórska, A.; Szal, B. Calcium in plants: An important element of cell physiology and structure, signaling, and stress responses. Acta Physiol. Plant. 2024, 46, 108. [Google Scholar] [CrossRef]
- DeFalco, T.A.; Bender, K.W.; Snedden, W.A. Breaking the code: Ca2+ sensors in plant signalling. Biochem. J. 2010, 425, 27–40. [Google Scholar] [CrossRef]
- Taneja, M.; Upadhyay, S.K. Molecular characterization and differential expression suggested diverse functions of P-type II Ca2+ ATPases in Triticum aestivum L. BMC Genomics 2018, 19, 389. [Google Scholar]
- Taneja, M.; Tyagi, S.; Sharma, S.; Upadhyay, S.K. Ca2+/cation antiporters (CaCA): Identification, characterization and expression profiling in bread wheat (Triticum aestivum L.). Front. Plant Sci. 2016, 7, 1775. [Google Scholar] [CrossRef]
- Kleczkowski, L.A.; Igamberdiev, A.U. Magnesium signaling in plants. Int. J. Mol. Sci. 2021, 22, 1159. [Google Scholar] [CrossRef]
- Qiu, H.; Nadaud, I.; Ledoigt, G.; Piquet-Pissaloux, A.; Branlard, G. Interruption of magnesium supply at heading influenced proteome of peripheral layers and reduced grain dry weight of two wheat (Triticum aestivum L.) genotypes. J. Proteom. 2016, 143, 83–92. [Google Scholar] [CrossRef]
- Gao, Y.; Li, Y.; Xia, W.; Dai, M.; Dai, Y.; Wang, Y.; Ma, H.; Ma, H. The regulation of grain weight in wheat. Seed Biol. 2023, 2, 17. [Google Scholar] [CrossRef]
- Shao, Y.; Li, S.; Gao, L.; Sun, C.; Hu, J.; Ullah, A.; Gao, J.; Li, X.; Liu, S.; Jiang, D.; et al. Magnesium application promotes rubisco activation and contributes to high-temperature stress alleviation in wheat during the grain filling. Front. Plant Sci. 2021, 12, 675582. [Google Scholar] [CrossRef] [PubMed]
- Pang, J.; Guo, Q.; Lu, Z. The catalytic mechanism, metal dependence, substrate specificity, and biodiversity of ribonuclease H. Front. Microbiol. 2022, 13, 1034811. [Google Scholar] [CrossRef] [PubMed]
- Walker, T.E.; Shirzadeh, M.; Sun, H.M.; McCabe, J.W.; Roth, A.; Moghadamchargari, Z.; Clemmer, D.E.; Laganowsky, A.; Rye, H.; Russell, D.H. Temperature regulates stability, ligand binding (Mg2+ and ATP), and stoichiometry of GroEL–GroES complexes. J. Am. Chem. Soc. 2022, 144, 2667–2678. [Google Scholar] [CrossRef]
- Dukic, E.; Van Maldegem, K.A.; Shaikh, K.M.; Fukuda, K.; Töpel, M.; Solymosi, K.; Hellsten, J.; Hansen, T.H.; Husted, S.; Higgins, J.; et al. Chloroplast magnesium transporters play essential but differential roles in maintaining magnesium homeostasis. Front. Plant Sci. 2023, 14, 221436. [Google Scholar] [CrossRef]
- Ahmed, N.; Zhang, B.; Bozdar, B.; Chachar, S.; Rai, M.; Li, J.; Li, Y.; Hayat, F.; Chachar, Z.; Tu, P. The power of magnesium: Unlocking the potential for increased yield, quality, and stress tolerance of horticultural crops. Front. Plant Sci. 2023, 14, 1285512. [Google Scholar] [CrossRef]
- Grabarek, Z. Insights into modulation of calcium signaling by magnesium in calmodulin, troponin C and related EF-hand proteins. BBA Mol. Cell Res. 2011, 1813, 913–921. [Google Scholar] [CrossRef]
- Mohanta, T.K.; Yadav, D.; Khan, A.L.; Hashem, A.; Abd_Allah, E.F.; Al-Harrasi, A. Molecular players of EF-hand containing calcium signaling event in plants. Int. J. Mol. Sci. 2019, 20, 1476. [Google Scholar] [CrossRef]
- Mohanta, T.K.; Mohanta, N.; Mohanta, Y.K.; Parida, P.; Bae, H. Genome-wide Identification of Calcineurin B-Like (CBL) Gene Family of Plants Reveals Novel Conserved Motifs and Evolutionary Aspects In Calcium Signaling Events. BMC Plant Biol. 2015, 15, 189. [Google Scholar] [CrossRef]
- Mohanta, T.; Mohanta, N.; Mohanta, Y.; Bae, H. Genome-Wide Identification of Calcium Dependent Protein Kinase Gene Family in Plant Lineage Shows Presence of Novel D-x-D and D-E-L Motifs in EF-Hand Domain. Front. Plant Sci. 2015, 6, 1146. [Google Scholar] [CrossRef]
- Mohanta, T.K.; Kumar, P.; Bae, H. Genomics and evolutionary aspect of calcium signaling event in calmodulin and calmodulin-like proteins in plants. BMC Plant Biol. 2017, 17, 38. [Google Scholar] [CrossRef]
- Kaur, A.; Sharma, A.; Verma, P.C.; Upadhyay, S.K. EF-hand domain-containing proteins in Triticum aestivum: Insight into their roles in stress response and signalling. S. Afr. J. Bot. 2022, 149, 663–681. [Google Scholar] [CrossRef]
- Sukumaran, S.; Lopes, M.; Dreisigacker, S.; Reynolds, M. Genetic analysis of multi-environmental spring wheat trials identifies genomic regions for locus-specific trade-offs for grain weight and grain number. Theor. Appl. Genet. 2018, 131, 985–998. [Google Scholar] [CrossRef]
- Ahirwar, R.N.; Mishra, V.K.; Chand, R.; Budhlakoti, N.; Mishra, D.C.; Kumar, S.; Singh, S.; Joshi, A.K. Genome-wide association mapping of spot blotch resistance in wheat association mapping initiative (WAMI) panel of spring wheat (Triticum aestivum L.). PLoS ONE 2018, 13, e0208196. [Google Scholar] [CrossRef]
- R Core Team. R: A Language and Environment for Statistical Computing; R Foundation for Statistical Computing: Vienna, Austria, 2013. [Google Scholar]
- Alvarado, G.; Rodríguez, F.M.; Pacheco, A.; Burgueño, J.; Crossa, J.; Vargas, M.; Pérez-Rodríguez, P.; Lopez-Cruz, M.A. META-R: A Software to analyze data from multi-environment plant breeding trials. Crop J. 2020, 8, 745–756. [Google Scholar] [CrossRef]
- Bates, D.; Mächler, M.; Bolker, B.; Walker, S. Fitting linear mixed-effects models using lme4. J. Stat. Softw. 2015, 67, 1–48. [Google Scholar] [CrossRef]
- VanRaden, P.M. Efficient Methods to compute genomic predictions. J. Dairy Sci. 2008, 91, 4414–4423. [Google Scholar] [CrossRef]
- Yin, L.; Zhang, H.; Tang, Z.; Xu, J.; Yin, D.; Zhang, Z.; Yuan, X.; Zhu, M.; Zhao, S.; Li, X.; et al. rMVP: A Memory-efficient, visualization-enhanced, and parallel-accelerated tool for genome-wide association study. Genom. Proteom. Bioinform. 2021, 19, 619–628. [Google Scholar] [CrossRef]
- Schwarz, G. Estimating the dimension of a model. Ann. Stat. 1978, 6, 461–464. [Google Scholar] [CrossRef]
- Marroni, F.; Pinosio, S.; Zaina, G.; Fogolari, F.; Felice, N.; Cattonaro, F.; Morgante, M. Nucleotide diversity and linkage disequilibrium in Populus nigra cinnamyl alcohol dehydrogenase (CAD4) Gene. Tree Genet. Genomes 2011, 7, 1011–1023. [Google Scholar] [CrossRef]
- Singh, S.; Gaurav, S.S.; Vasistha, N.K.; Joshi, A.K.; Mishra, V.K.; Chand, R.; Gupta, P.K. Genetics of spot blotch resistance in bread wheat (Triticum aestivum L.) using five models for GWAS. Front. Plant Sci. 2023, 13, 1036064. [Google Scholar] [CrossRef]
- Maccaferri, M.; El-Feki, W.; Nazemi, G.; Salvi, S.; Canè, M.A.; Colalongo, M.C.; Stefanelli, S.; Tuberosa, R. Prioritizing quantitative trait loci for root system architecture in tetraploid wheat. J. Exp. Bot. 2016, 67, 1161–1178. [Google Scholar] [CrossRef]
Disclaimer/Publisher’s Note: The statements, opinions and data contained in all publications are solely those of the individual author(s) and contributor(s) and not of MDPI and/or the editor(s). MDPI and/or the editor(s) disclaim responsibility for any injury to people or property resulting from any ideas, methods, instructions or products referred to in the content. |
© 2025, Chandranandani Negi, Krishan Kumar, Pritesh Vyas, Neeraj Kumar Vasistha, and His Majesty the King in Right of Canada, as represented by the Minister of Agriculture and Agri-Food Canada for the contribution of Raman Dhariwal. This is an open-access article distributed under the terms of the Creative Commons Attribution License (CC BY). The use, distribution or reproduction in other forums is permitted, provided the original author(s) and the copyright owner(s) are credited and that the original publication in this journal is cited, in accordance with accepted academic practice. No use, distribution or reproduction is permitted which does not comply with these terms.