Abstract
The aromatic compound (E)-anethol is widely used in the flavor, fragrance, and medicinal industries. This compound is commonly produced through steam distillation of fennel, star anise, and anise seed. Given the cost of production, these natural and authentic essential oils are commonly adulterated with lower-cost natural materials or synthetic alternatives. The current study investigates essential oil profiles (gas chromatography/mass spectrometry) and stable isotope ratios (gas chromatography/isotope ratio mass spectrometry) of the abundant compound (E)-anethol in both authentic reference standards (n = 15) and commercially available samples (n = 30). This multifaceted analytical approach establishes techniques for ensuring the authenticity of essential oil sources of (E)-anethol and was then used to evaluate the current essential oil market sources of (E)-anethol. These findings report that adulteration of (E)-anethol-containing natural products takes various forms, and a multifaceted analytical approach is recommended for authentication. Of the commercial samples analyzed for this report, 27% were adulterated.
1. Introduction
(E)-anethol is a phenylpropanoid and an important flavoring agent and food ingredient (Figure 1). This compound is commonly used in confectioneries, beverages, personal care products, pharmaceutical flavorings, and natural medicines [1,2,3]. (E)-anethol is produced naturally by several plant species and is commonly extracted as the prominent compound from the essential oils of fennel (Foeniculum vulgare Mill.), star anise (Illicium verum Hook.f.), and anise (Pimpinella anisum L.) [4,5,6,7].
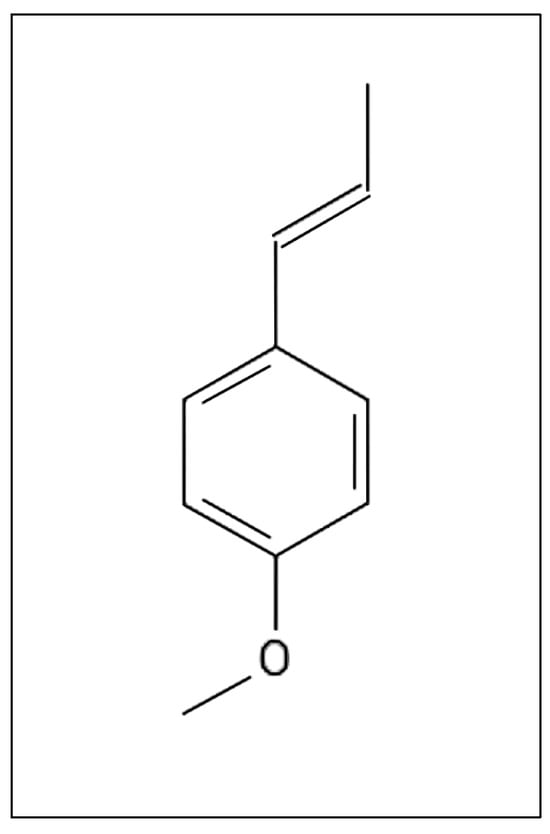
Figure 1.
Structure of the compound (E)-anethol [8].
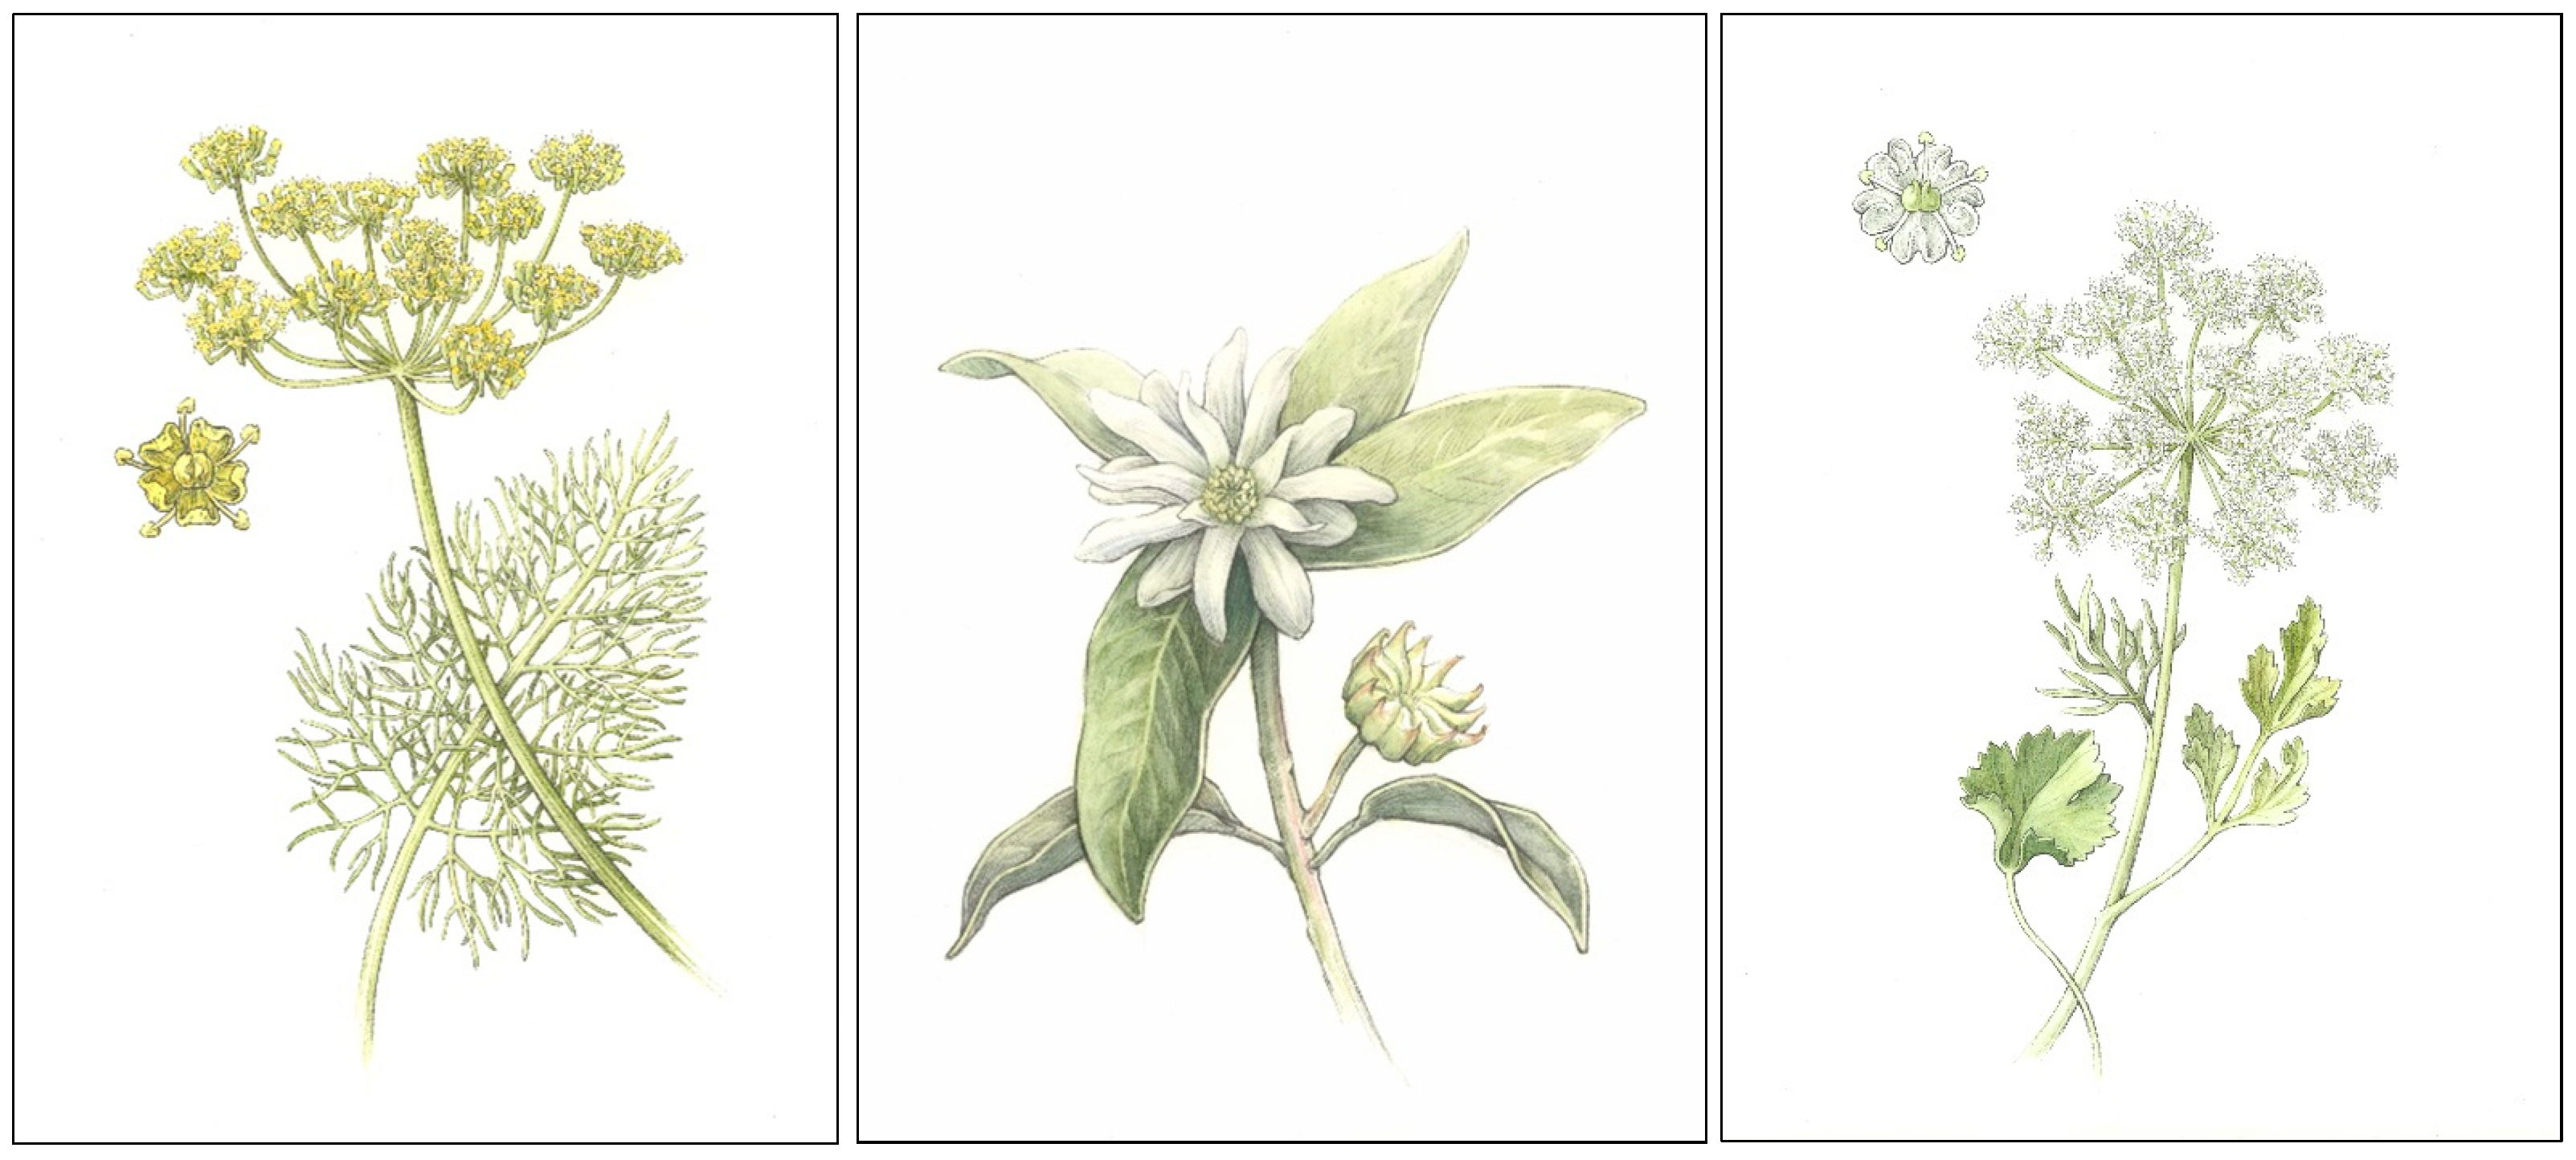
Standardized qualities have been defined for fennel (bitter and sweet varieties), star anise, and anise essential oils, which are all distilled from the seeds of each plant species, respectively (Figure 2) [9,10,11,12]. The volatile profile of each essential oil is defined as containing high concentrations of (E)-anethol: 50–78% (bitter fennel), 60–80% (sweet fennel), 86–93% (star anise), and 87–94% (anise) [9,10,11,12]. While constituent profiles of the three species are similar, each essential oil contains unique marker compounds that distinguish one from the others. Additionally, profiles may display natural variation, and (E)-anethol values may fall outside expected ranges due to any number of abiotic or biotic factors. These factors include cultivation practices, chemotype and provenance of plant, distillation or extraction technique employed, and inherent plant-to-plant variability, among other factors [13,14,15,16,17,18,19,20,21,22,23].

Figure 2.
From left to right, botanical illustrations of fennel (Foeniculum vulgare Mill.), star anise (Illicium vulgare Hook.f.), and anise (Pimpinella anisum L.). Plant parts bearing the aromatic seeds are depicted. Botanical illustrations by Zach Nielsen.
Given the variability of essential oil profiles and the prohibitive costs of natural products, essential oils containing (E)-anethol are often adulterated with lower-priced natural or synthetically produced alternatives [3,24,25,26]. To ensure the authentication of natural compounds, gas chromatography/mass spectrometry (GC/MS) and gas chromatography/isotope ratio mass spectrometry (GC/IRMS), among other analytical techniques, have been reported as powerful analytical tools [26,27,28,29,30,31,32]. These same researchers have reported that identification of specific marker compounds by GC/MS and stable isotope analysis of prominent compounds assists in detecting adulteration with synthetic compounds and/or distinguishing natural compounds based on the origin of plant species, chemotype, and provenance.
Two groups of researchers have previously investigated authentication of (E)-anethol from fennel and anise by means of chiral analysis and/or GC/IRMS [25,33]. However, both groups found that identifying adulteration and distinguishing the origin of (E)-anethol was not always easily performed, as established ranges for natural and synthetic origins somewhat overlapped. The current study also investigates the authenticity of (E)-anethol originating from fennel and anise; however, it also incorporates stable isotope data from star anise (a lower-cost natural source of (E)-anethol) and essential oil profiles from all three species (GC/MS) and investigates authenticity of commercially available essential oil samples (n = 30) from the three species. Findings from the current study confirm previously established stable isotope ratio data and further the field of essential oil authentication, demonstrating that multifaceted analytical approaches are ideal for identifying adulterants in essential oils containing (E)-anethol.
2. Results
2.1. Volatile Compound Profiles (GC/MS)
Authentic essential oils for fennel (Foeniculum vulgare) (n = 5), star anise (Illicium verum) (n = 5), and anise (Pimpinella anisum) (n = 5) were produced by steam distillation and used as reference standards (see Section 4). Additionally, volatile compound reference ranges for these species have been previously established and have identified key compounds that can be used to identify and distinguish the quality of each essential oil [9,10,11,12]. GC/MS analysis of authentic standards (n = 15) prepared for this research confirmed the presence of these key marker compounds in each authentic standard, respective to the plant species (Table 1).

Table 1.
Established ranges of key compounds by the International Organization for Standardization (ISO) for the oils of bitter fennel (ISO 17412) [9], star anise (ISO 11016) [11], and anise (ISO 3475) [12] and by the Association Française de Normalisation (AFNOR) for sweet fennel (NF T75-257) [10]. Average values (GC/MS) from authentic standards of fennel (n = 5), star anise (n = 5), and anise (n = 5) provided. Values less than 0.1% are denoted as trace (tr) and those not detected (nd). For compounds not included in the ISO or AFNOR standards, “n/a” is denoted. KI is the Kovat’s Index value and was previously calculated by Robert Adams using a linear calculation on a DB-5 column [34].
Select compounds were identified in authentic essential oils as being unique to each species and present in relatively substantial amounts (≥ 0.2%). As such, these marker compounds can be used in authentication (Table 2) by GC/MS analysis.
Table 2.
Volatile compounds identified as unique markers in the essential oils (reference standards) of fennel, star anise, or anise. The compound name, KI, and if the compound was detected or not detected (nd) are indicated. KI is the Kovat’s Index value and was previously calculated by Robert Adams using a linear calculation on a DB-5 column [34].
2.2. Stable Isotope Ratio Analysis (GC/IRMS)
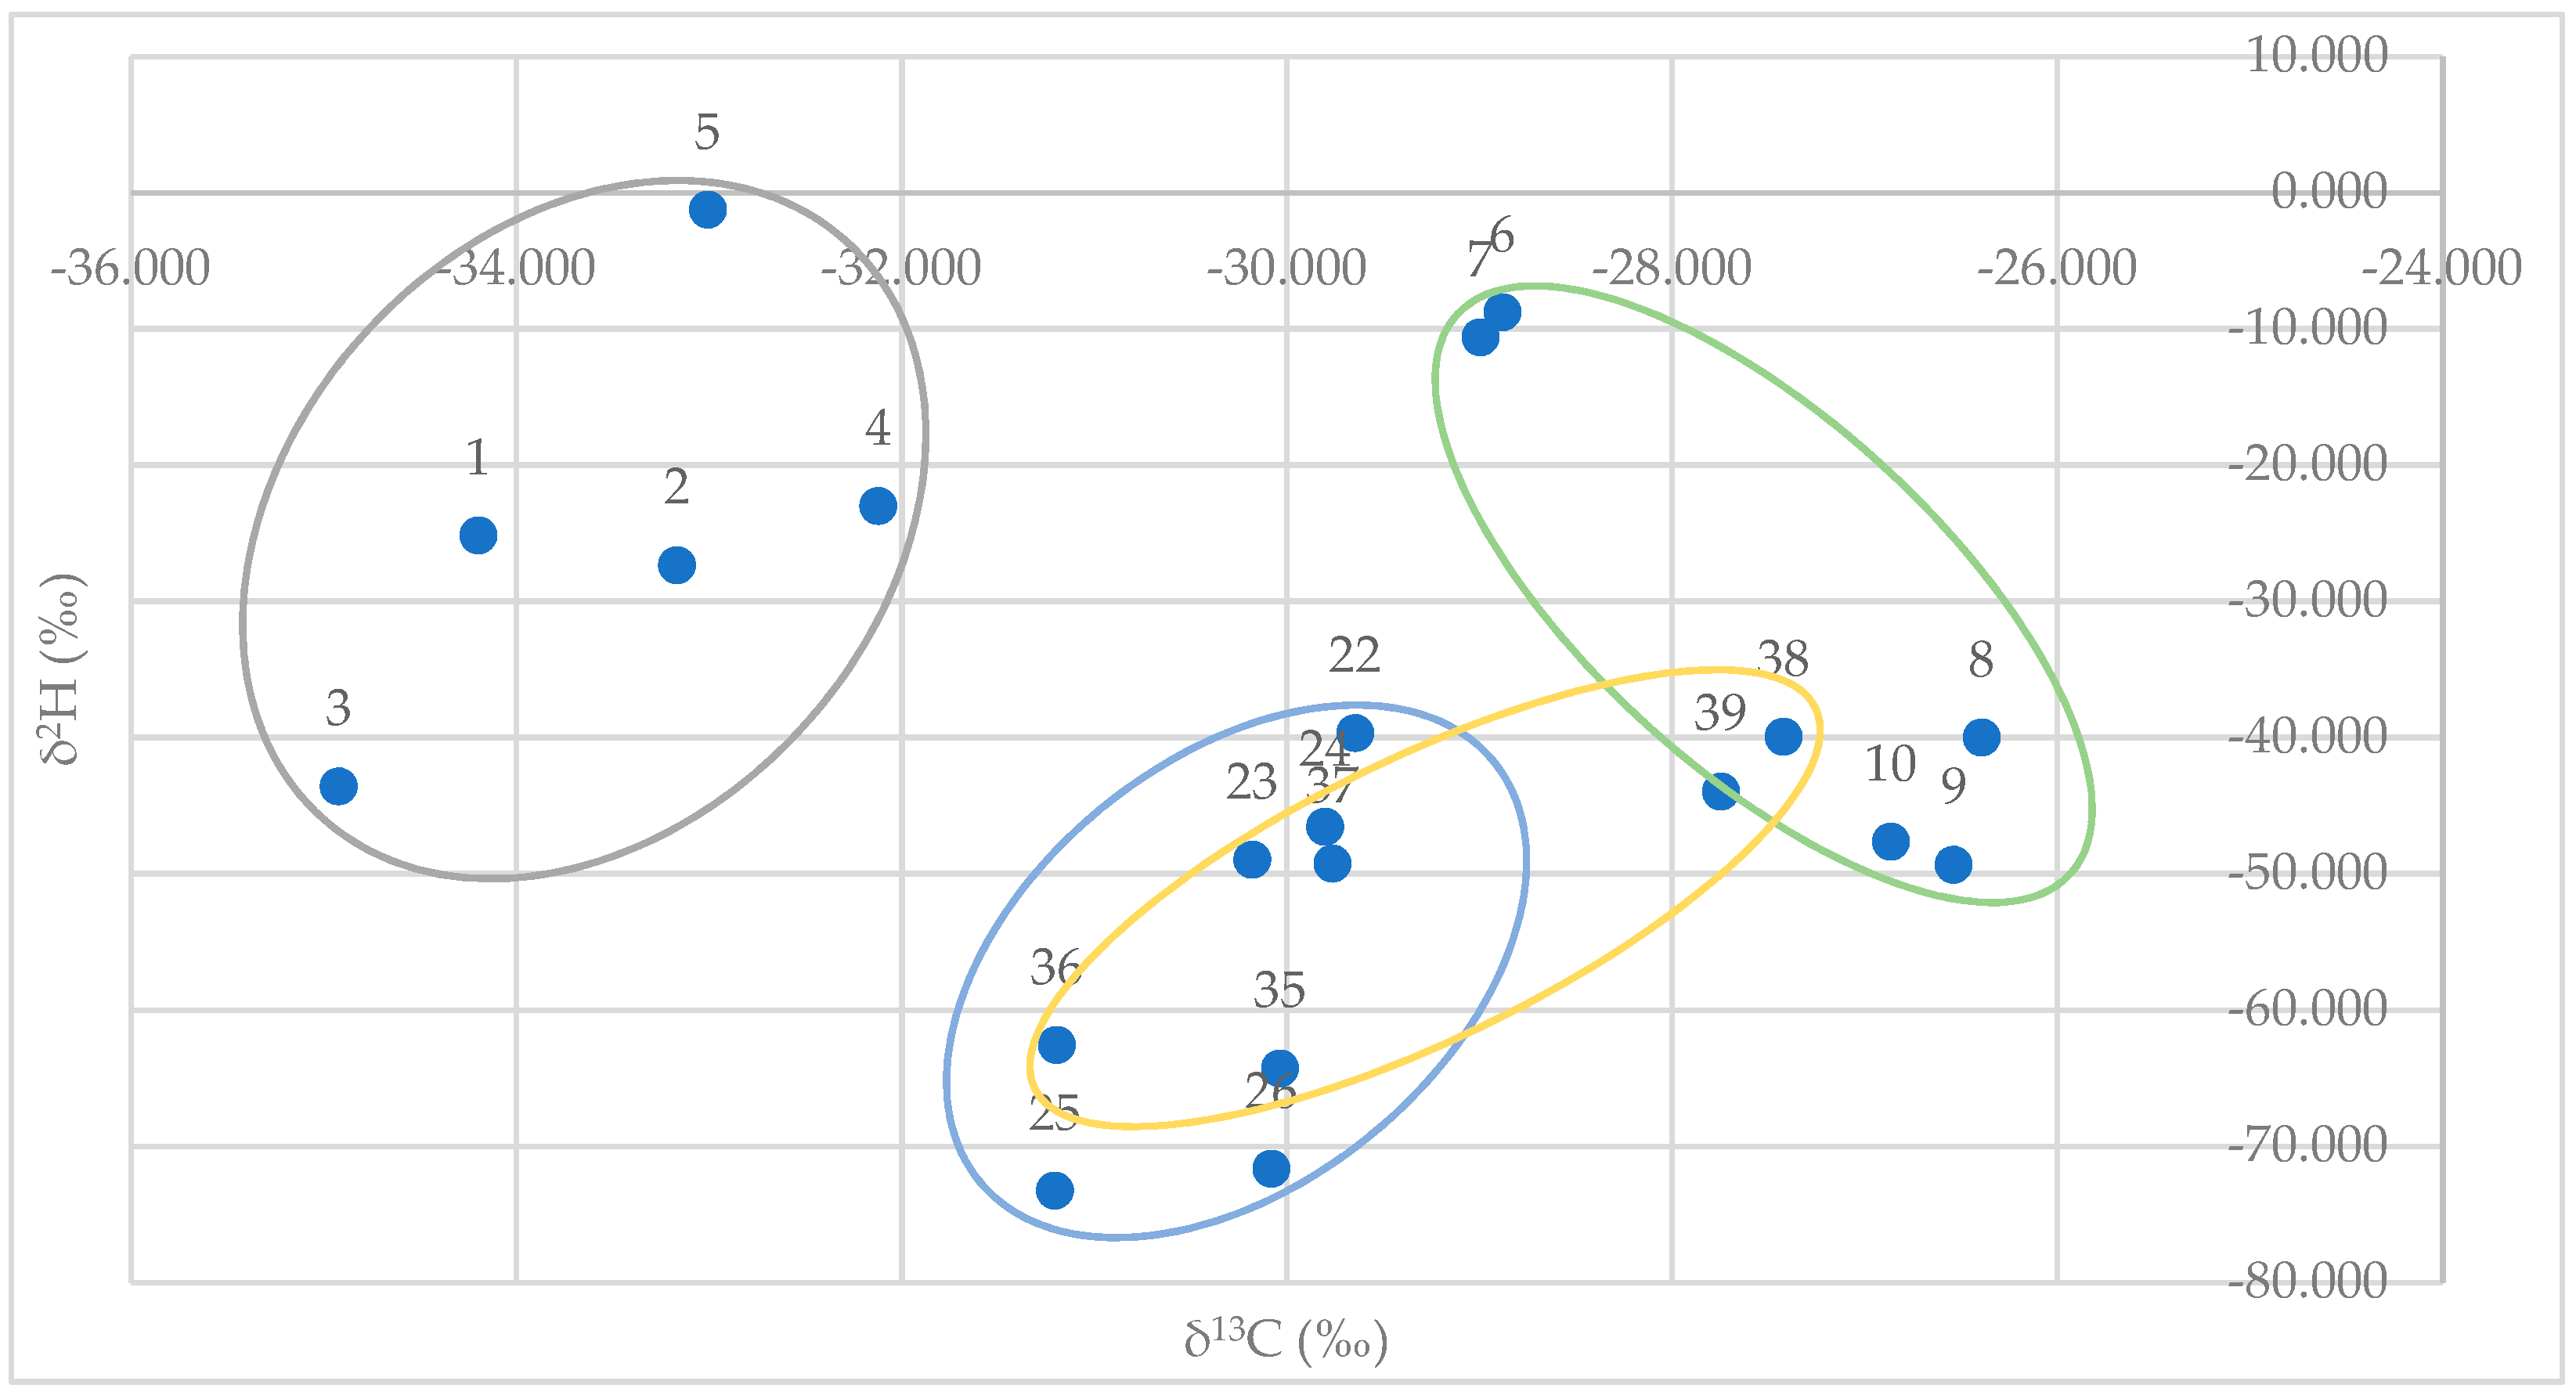
Plotting GC/IRMS data for δ2H (y-axis) versus δ13C (x-axis) for synthetic (E)-anethol standards (n = 5) and authentic standards (n = 15) from fennel, star anise, and anise provided a clear distinction from synthetic and authentic/natural samples. There was also a clear distinction between authentic/natural star anise and anise samples. However, there were overlapping values for authentic/natural fennel samples and authentic/natural star anise and anise samples (Figure 3).
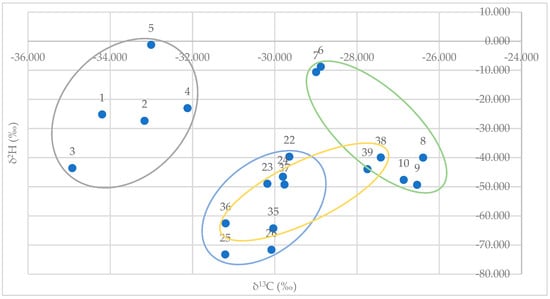
Figure 3.
GC/IRMS data plot for δ2H (y-axis) vs. δC13 (x-axis) for synthetic (E)-anethol standards (gray; n = 5), and authentic essential oils standards of fennel (orange; n = 5), star anise (blue; n = 5), and anise (green; n = 5).
Ranges for synthetic samples and authentic/natural samples are provided in Table 3. Stable isotope values, δ2H and δ13C, for (E)-anethol in commercially available samples are provided in Table 4.
Table 3.
Stable isotope ratios, δ2H and δ13C, for (E)-anethol samples: synthetic (n = 5), authentic fennel (n = 5), authentic star anise (n = 5), and authentic anise (n = 5). Samples were analyzed in triplicate to ensure repeatability (δ2H values are reported with a standard deviation ≤ 2.0‰ and δ13C values are reported with a standard deviation ≤ 0.2‰). δ2H isotope ratios are expressed relative to VSMOW and δ13C isotope ratios to VPDB.
Table 4.
Stable isotope ratios, δ2H and δ13C, for (E)-anethol prominent commercially available samples (n = 30): anise (11–21), star anise (27–34), and fennel (40–50). Samples were analyzed in triplicate to ensure repeatability (δ2H values are reported with a standard deviation ≤ 2.0‰ and δ13C values are reported with a standard deviation ≤ 0.2‰). δ2H isotope ratios are expressed relative to VSMOW and δ13C isotope ratios to VPDB.
3. Discussion
3.1. Volatile Compound Profiles (GC/MS)
GC/MS analysis provided the ability to help decipher the origin of the adulteration, such as the addition of other natural sources of (E)-anethol and/or the addition of carriers/diluents, such as triethyl citrate or capryl palmitate.
Fennel sample #45 contained all expected compounds/markers for authentic fennel; however, 43.2% of the composition was triethyl citrate. Fennel sample #47 lacked the authentic fennel marker (fenchone) and contained markers for star anise (0.9% linalool, 0.1% α-terpineol, 1.7% foeniculine) as well as capryl palmitate (35.4%). Star anise sample #31 contained all expected compounds/markers for authentic star anise; however, 36.5% of the composition was triethyl citrate. Anise sample #12 contained unexpected compounds (2.8% linalool, 2.8% menthol) and lacked markers for authentic anise (γ-himachalene, pseudoisoeugenyl-2-methylbutyrate). Anise sample #18 contained unexpected compounds (0.2% α-terpineol, 72.8% triethyl citrate). Anise sample #19 contained unexpected compounds (1.9% linalool, 1.6% α-terpineol) and lacked markers for authentic anise (γ-himachalene, pseudoisoeugenyl-2-methylbutyrate).
Considering GC/MS data alone, 20% of the commercially obtained essential oil samples analyzed (two fennel, one star anise, three anise) were adulterated. Adulteration of commercially available essential oil samples (6 of 30 samples) likely occurred using two different forms: the addition of carriers/diluents in four samples (anise #18; star anise #31; fennel samples #45 and 47) and the addition of other natural or synthetic sources of (E)-anethol in four samples (anise samples #12, 18, and 19; fennel #47). While GC/MS is a powerful tool in detecting/identifying the addition of carriers/diluents, it is not always ideal as a standalone tool for distinguishing the source of the unexpected/additional volatile compounds in samples. For example, fennel sample #47 appears to be “extended” with star anise and a carrier/diluent (lack of natural fennel markers, all star anise markers present, addition of capryl palmitate), but anise samples #12, 18, and 19 were less conclusive as to how they were likely adulterated.
3.2. Stable Isotope Ratio Analysis (GC/IRMS)
When evaluating the authenticity of commercially available samples, stable isotope data are less conclusive than GC/MS data. If only considering stable isotope data, 83% of commercially available samples fall outside established ranges (Table 3 and Table 4). However, this is largely due to overlapping δ2H values (Table 3) and unexpected values lower than −73.262 (Table 4). Taking this into consideration, δ2H values alone do not appear to be a reliable measurement for (E)-anethol authentication. Given that both fennel and anise are cultivated throughout the world and at various elevations, the inability to directly correlate δ2H values with authenticity is likely due to the inherent association of δ2H values with ocean water and storm patterns and the distance of cultivation from the ocean [32]. These δ2H findings appear to be consistent with those of previous researchers such that values from the current study and data from the other two research groups [25,33] all appear to overlap (values for synthetic vs. natural sources of (E)-anethol) and are somewhat unreliable for authentication (Table 5). However, that conclusion could change, given additional reference standards of known origin and cultivation practices. Stable isotope data for δ13C from the current study are relatively consistent with findings from both research groups and appear to be a reliable tool for authentication.
Table 5.
Stable isotope ratios, δ2H and δ13C, for (E)-anethol samples: synthetic, authentic fennel, and authentic anise from 3 research groups (current study, Greule and associates [25], Bilke and associates [33]). For all research groups, δ2H isotope ratios are expressed relative to VSMOW and δ13C isotope ratios to VPDB. When values were not determined by researchers, “n/a” is denoted.
3.3. Multifaceted Approach
Literature published in the 1950s stated that anise essential oil was valued higher than fennel and star anise in the flavor and fragrance industries [24]. This same literature indicates that anise essential oil was often adulterated with (E)-anethol from other natural sources or from synthetic (E)-anethol. While current prices for these essential oils or synthetic (E)-anethol are much higher than those from the 1950s, price-point trends appear to be the same (private communication; priced highest to lowest: anise, fennel, star anise, synthetic (E)-anethol).
As was mentioned previously, GC/MS data suggested that six samples (#12, 18, 19, 31, 45, and 47) were adulterated. Based on the adulteration technique likely employed in these commercially available samples, stable isotope data (δ2H and δ13C) confirmed and supported the GC/MS data and findings (Table 3 and Table 4). Additionally, δ13C provided evidence that anise samples #12, 18, and 19 were adulterated with synthetic (E)-anethol (Table 3 and Table 4). Considering these data alongside the GC/MS data, which showed only the presence of some but not all markers for other natural and cheaper sources of (E)-anethol, suggests that a synthetic source of (E)-anethol was likely used.
δ13C data also suggest that two additional samples (star anise #29, fennel #46) contained synthetic (E)-anethol (Table 3 and Table 4). Given that both samples contained markers for natural star anise and fennel, respectively, these samples may have an addition of synthetic (E)-anethol to “extend” the samples. Given economic incentives to adulterate and falsely market essential oils, the current study concludes that 8 of the 30 (27%) commercially available fennel, star anise, and anise essential oil samples were adulterated. Adulteration took the form of the addition of carriers/diluents, the use of cheaper natural sources of (E)-anethol (i.e., star anise), and/or the use of synthetic (E)-anethol. While GC/MS and δ13C stable isotope data proved useful in identifying adulteration, δ2H stable isotope data did not. However, δ2H data may prove useful, given the addition of more authentic reference standards.
4. Materials and Methods
Synthetic (E)-anethol commercial reference samples (n = 5) were purchased from various retailers (TCI America, Division of Tokyo Chemical Industry, Portland, OR, USA; MilliporeSigma, Sigma-Aldrich, St. Louis, MS, USA; Acros Organics, Janssen-Pharmaceuticalaan, Geel, Belgium). Pimpinella anisum (anise), Foeniculum vulgare (fennel), and Illicium verum (star anise) seeds were procured directly from farmed sources or online retailers for in-house steam distillation and creation of authentic reference standards (n = 15). Additionally, anise, fennel, and star anise essential oil samples (n = 30) were procured from in-store and online retailers to investigate the authenticity of commercially available samples. For simplicity and consistency, samples were referred to by a number from 1 to 50 (Table 6). All reference samples and commercially available essential oil samples were stored at room temperature, as received in their original sealed amber glass bottle, until analysis.
Table 6.
Reference and essential oil sample (n = 50) details, including sample reference number, sample name, country/region of origin, and sample type. When information was not available, “n/a” is denoted.
Laboratory-scale distillation for authentic in-house standards was as follows: 1.5 L of water was added to a 2 L steam generator that fed into a 2 L distillation chamber. The plant material of each species (seeds) was ruptured to increase surface area (Figure 4), then accurately weighed and added to the distillation chamber. Distillation was performed for 1.5 h from passover by indirect steam, and essential oil was separated by a cooled condenser and Florentine flask. Essential oil samples were each filtered and stored at room temperature in a sealed amber glass bottle until analysis.
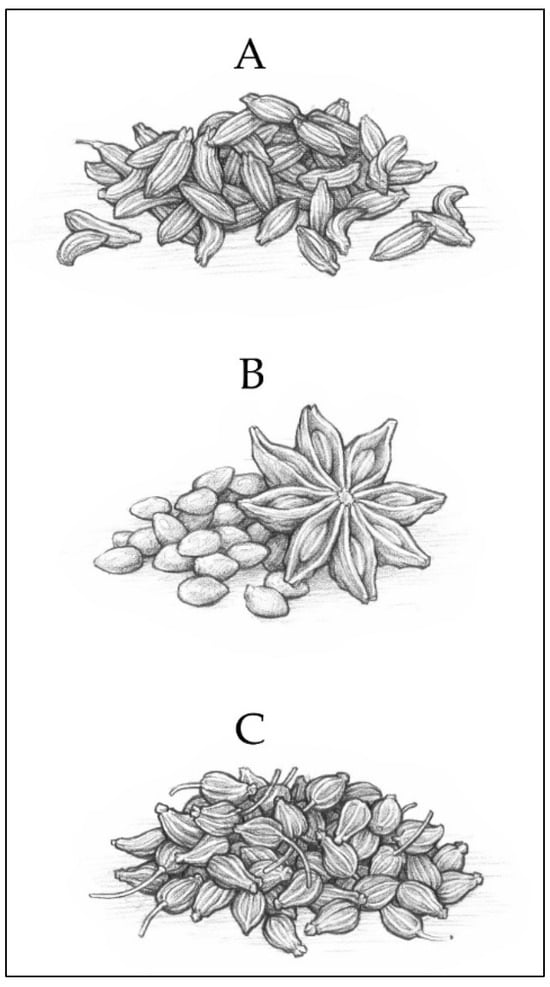
Figure 4.
Botanical illustration of (A) fennel, (B) star anise, and (C) anise seeds. Botanical illustrations by Zach Nielsen.
Essential oil samples were analyzed, and volatile compounds were identified and quantified by GC/MS using an Agilent 7890B GC/5977B MSD (Agilent Technologies, Santa Clara, CA, USA) and Agilent J&W DB-5, 60 m × 0.25 mm, 0.25 μm film thickness, fused silica capillary column. Operating conditions: 0.1 μL of sample (20% soln. for essential oils in ethanol), 100:1 split ratio, initial oven temp. of 40 °C with an initial hold time of 5 min, and oven ramp rate of 4.5 °C per min to 310 °C with a hold time of 5 min. The electron ionization energy was 70 eV, scan range 35–650 amu, scan rate 2.4 scans per s, source temp. 230 °C, and quadrupole temp. 150 °C. Compounds were identified using the Adams volatile oil library [34] using a Chemstation library search in conjunction with retention indices. Note that p-anis aldehyde/(Z)-anethol elutes as a single peak. Their amounts were determined by the ratio of masses 107 and 135 (p-anis aldehyde), 117 and 148 ((Z)-anethol). Additionally, compound retention time was verified using reference compounds (MilliporeSigma, Sigma-Aldrich, St. Louis, MO, USA).
The hydrogen and carbon stable isotope ratios of essential oils were analyzed by GC/IRMS using a Thermo TRACE 1310 GC coupled to a Thermo Delta V Advantage Isotope Ratio Mass Spectrometer (ThermoFisher Scientific, Waltham, MA, USA) with an Agilent J&W DB-5, 0.25 mm × 60 m, 0.25 μm film thickness, fused silica capillary column.
Essential oil samples were prepared for GC/IRMS analysis as follows: 35 mg of sample was weighed into a 2 mL transparent glass vial and brought up to 1 mL with hexane. A 100 μL aliquot was placed into a second vial, which was then brought up to 1 mL with hexane and used for 2H/1H analysis. From the second sample vial, a 90 μL aliquot was removed and placed into a third vial, brought to 1 mL in hexane, and used for 13C/12C analysis.
GC/IRMS operating conditions were as follows: splitless injection of 1 μL of sample with splitless time set at 0.25 min, injection port 270 °C, initial oven temp. 50 °C with an initial hold time of 2.0 min, oven ramp rate of 6.0 °C per min to 250 °C with a hold time of 2.0 min, then an oven ramp rate of 10.0 °C per minute to 310 °C with a hold time of 7.0 min, and helium carrier gas with constant flow 1.55 mL/min. After passing through the capillary column, samples were sent through the HTC reactor for 2H/1H analysis or the combustion reactor for 13C/12C analysis. HTC reactor temp. was set to 1420 °C and was regularly conditioned by injecting 1 μL of hexane in backflush mode. The combustion reactor temp. was set to 1000 °C and was conditioned with oxygen at regular intervals.
To normalize IRMS results, reference materials were purchased from Dr. Arndt Schimmelmann at Indiana University (Bloomington, IN, USA) and from the United States Geological Survey (USGS)—Reston Stable Isotope Laboratory. δ2H isotope ratios are expressed relative to VSMOW and δ13C isotope ratios to VPDB. The following three reference materials, along with their known values, were used to normalize results: hexadecane #C (USGS69), δ2H: 381.4‰, δ13C: −0.57‰; nonadecane #2, δ2H: −56.3‰, δ13C: −31.99‰; and tetradecanoic acid methyl ester #14M, −231.2‰, δ13C: −29.98‰.
Samples were analyzed in triplicate to ensure repeatability. δ2H values are reported with a standard deviation ≤ 2.0‰ and δ13C values are reported with a standard deviation ≤ 0.2‰.
5. Conclusions
Previous studies on the authentication of natural essential oil sources of (E)-anethol (fennel and/or anise) relied heavily on stable isotope data, with data being somewhat inconclusive. In the current study, star anise essential oil samples, in addition to fennel and anise, were investigated. Despite the addition of another common and natural essential oil source of (E)-anethol in the current study, stable isotope data, when considered alone, were still somewhat inconclusive. However, using a multifaceted analytical approach with both gas chromatography/mass spectrometry (GC/MS) and gas chromatography/isotope ratio mass spectrometry (GC/IRMS) proved useful. Upon analyzing commercially available essential oil samples of fennel, star anise, and anise (n = 30) by GC/MS, 6 of the 30 (20%) appeared to be adulterated. Of the six adulterated samples, a definitive understanding of the source of adulteration was clear in three of the samples (the addition of carriers/diluents and the use of star anise essential oil when the label claimed fennel was used). While three of the adulterated commercially available anise essential oil samples contained some unexpected compounds (linalool and/or α-terpineol, both markers of star anise), the exact source of adulteration was not deciphered by GC/MS alone. This may be partially explained by the fact that both linalool and α-terpineol are common compounds in many essential oils, possibly even in other authentic/natural anise samples, and that they only act as markers of star anise when in association with the third compound previously mentioned, foeniculine. GC/IRMS (δ13C) provided clarification here, that these three adulterated anise essential oil samples contained synthetic sources of (E)-anethol. GC/IRMS (δ13C) also suggested the adulteration of two other commercially available essential oil samples (increasing the total adulterated samples from 20% to 27%) by the use of synthetic (E)-anethol; these were samples that otherwise did not contain any detectable unexpected markers (GC/MS). Using GC/MS and GC/IRMS together proved to be a powerful tool in both detecting adulteration of natural essential oil sources of (E)-anethol and determining the method of adulteration.
One of the adulterated anise samples (#18) in this study contained the expected natural markers for anise (γ-himachalene, pseudoisoeugenyl-2-methylbutyrate) as well as one of the markers for star anise (α-terpineol), suggesting that this anise sample was “extended” with a cheaper source of (E)-anethol (possibly star anise). The approach in the current study resulted in both the detection of adulteration in samples and in determining the method of adulteration, but not the extent of adulteration. Future studies could create “self-adulterated” samples at various ratios to calculate what percent of the sample is original/authentic and what percent adulterated in these samples where “extension” occurs. This approach would also provide data for determining to which extent/level adulteration can be detected by analytical techniques.
Future studies should also contain a larger group of both synthetic (E)-anethol standards and authentic reference standards of fennel, star anise, and anise essential oils. A larger group of samples will strengthen conclusions as well as add clarity to stable isotope values and ranges, particularly with δ2H data.
Author Contributions
Conceptualization, B.J.M. and C.R.B.; sample procurement and production, E.A.Z.; methodology, B.J.M.; software, B.J.M. and T.M.W.; validation, R.E.C.; formal analysis, B.J.M. and T.M.W.; data curation, B.J.M. and T.M.W.; writing—original draft preparation, T.M.W.; writing—review and editing, B.J.M., E.A.Z., C.R.B. and R.E.C.; funding acquisition, R.E.C. All authors have read and agreed to the published version of the manuscript.
Funding
This research was funded by Young Living Essential Oils.
Data Availability Statement
The data presented in this study are available upon request from the corresponding author.
Acknowledgments
The authors wish to thank the following individuals and organizations: Danijel Perkovic for procuring raw material, Zach Nielsen for the botanical illustrations, and the D. Gary Young Research Institute for providing support for this project.
Conflicts of Interest
The authors declare no conflicts of interest. The funding entity had no role in the design of the study, in the collection, analysis, or interpretation of data, in the writing of the manuscript, or in the decision to publish the results.
References
- Guenther, E. Chapter V: Phenols and Phenol Ethers. In The Essential Oils, Vol. II; Robert E Kreiger Publishing Co., Inc.: Huntington, NY, USA, 1952; p. 511. [Google Scholar]
- Aggarwal, B.B.; Yost, D. Healing Spices: How to Use 50 Everyday and Exotic Spices to Boost Health and Beat Disease; Sterling Publishing Co., Inc.: Toronto, ON, Canada, 2011; pp. 30–32, 114, 115, 221, 222. [Google Scholar]
- Sarkic, A.; Stappen, I. Essential oils and their single compounds in cosmetics—A critical review. Cosmetics 2018, 5, 11. [Google Scholar] [CrossRef]
- Guenther, E. Chapter I: Essential Oils of the Plant Family Rutaceae. In The Essential Oils, Vol. III; Robert E Kreiger Publishing Co., Inc.: Huntington, NY, USA, 1952; pp. 372–373. [Google Scholar]
- The World Flora Online. Available online: https://www.worldfloraonline.org/taxon/wfo-0000390925 (accessed on 13 October 2023).
- The World Flora Online. Available online: https://www.worldfloraonline.org/taxon/wfo-0000691487 (accessed on 13 October 2023).
- The World Flora Online. Available online: https://www.worldfloraonline.org/taxon/wfo-0000730107 (accessed on 13 October 2023).
- National Institutes of Health (NIH). PubChem Sketcher v2.4. Available online: https://pubchem.ncbi.nlm.nih.gov//edit3/index.html (accessed on 31 December 2023).
- ISO 17412:2007(E); Oil of Bitter Fennel (Foeniculum vulgare Mill. ssp. vulgare var. vulgare). ISO: Geneva, Switzerland, 2007. Available online: https://www.iso.org/standard/38351.html (accessed on 13 October 2023).
- NF T 75-257; Huile Essentielle de Fonouil Doux (Foeniculum vulgare Miller spp. vulgare var. dulce (Miller) Thellung). AFNOR Group: Saint-Denis, France, 2004. Available online: https://m.boutique.afnor.org/fr-fr/norme/nf-t75257/huiles-essentielles-huile-essentielle-de-fenouil-doux-foeniculum-vulgare-mi/fa122872/24208 (accessed on 14 February 2007).
- ISO 11016:1999(E); Oil of Star Anise, Chinese Type (Illicium verum Hook. f.). ISO: Geneva, Switzerland, 1999. Available online: https://www.iso.org/standard/19000.html (accessed on 13 October 2023).
- ISO 3475:2020(E); Essential Oil of Aniseed (Pimpinella anisum L.). ISO: Geneva, Switzerland, 2020. Available online: https://www.iso.org/standard/32039.html (accessed on 13 October 2023).
- Abdellaoui, M.; Derouich, M.; El-Rhaffari, L. Essential oil and chemical composition of wild and cultivated fennel (Foeniculum vulgare Mill.): A comparative study. S. Afr. J. Bot. 2020, 135, 93–100. [Google Scholar] [CrossRef]
- Atanasova-Pančevska, N.; Kungulovski, D.; Najdoska-Bogdanov, M.; Bogdanov, J.; Stefova, M. Comparative study of essential oils from fennel fruits and anise fruits: Chemical composition and in vitro antimicrobial activity. Maced. J. Chem. Chem. Eng. 2021, 40, 241–252. [Google Scholar] [CrossRef]
- Figueredo, G.; Özcan, M.M.; Al Juhaimi, F.Y.; Chalchat, J.C.; Özcan, M.M.; Chalard, P. The effect of Heights on Chemical Composition of Essential Oil of Bitter Fennel (Foeniculum vulgare subsp. piperitum) fruits. J. Essent. Oil-Bear. Plants 2016, 19, 1273–1276. [Google Scholar] [CrossRef]
- Boumahdi, Y.; Moghrani, H.; Nasrallah, N.; Ouarek, S.; Maachi, R. Microwave-assisted hydrodistillation of the essential oil from Algerian Pimpinella anisum seeds. Flavour Fragr. J. 2020, 36, 34–46. [Google Scholar] [CrossRef]
- THS, A.E.N.; Ottai, M.E.S. Enhancement of essential oil yield of Egyptian anise, Pimpinella anisum L., by individual plant selection. Aust. J. Basic Appl. Sci. 2012, 6, 510–517. [Google Scholar]
- Kosalec, I.; Pepeljnjak, S.; Kuštrak. Antifungal activity of fluid extract and essential oil from anise fruits (Pimpinella anisum L., Apiaceae). Acta Pharm. 2005, 55, 377–385. [Google Scholar] [PubMed]
- Liu, S.; Zhao, C.; Cao, Y.; Li, Y.; Zhang, Z.; Nie, D.; Tang, W.; Li, Y. Comparison of chemical compositions and antioxidant activity of essential oils from Litsea Cubeba, Cinnamon, Anise, and Eucalyptus. Molecules 2023, 28, 5051. [Google Scholar] [CrossRef] [PubMed]
- Luís, Â.; Sousa, S.; Wackerlig, J.; Dobusch, D.; Duarte, A.P.; Pereira, L.; Domingues, F. Star anise (Illicium verum Hook. f.) essential oil: Antioxidant properties and antibacterial activity against Acinetobacter baumannii. Flavour Fragr. J. 2019, 34, 260–270. [Google Scholar] [CrossRef]
- Stojanović, T.; Bursić, V.; Vuković, G.; Šućur, J.; Popović, A.; Zmijanac, M.; Kuzmanović, B.; Petrović, A. The chromatographic analysis of the star anise essential oil as the potential biopesticide. J. Agron. Technol. Eng. Manag. 2018, 1, 65–70. [Google Scholar]
- Wong, Y.C.; Lee, P.P.; Nurdiyana, W.W. Extraction and antioxidative activity of essential oil from star anise (Illicium verum). Orient. J. Chem. 2014, 30, 1159–1171. [Google Scholar] [CrossRef]
- Zheljazkov, V.D.; Astatkie, T.; O’Brocki, B.; Jeliazkova, E. Essential oil composition and yield of anise from different distillation times. HortScience 2013, 48, 1393–1396. [Google Scholar] [CrossRef]
- Guenther, E. Chapter V: Essential Oils of the Plant Family Umbelliferae. In The Essential Oils, Vol. IV; Robert E Kreiger Publishing Co., Inc.: Huntington, NY, USA, 1952; pp. 568–569. [Google Scholar]
- Greule, M.; Hänsel, C.; Bauermann, U.; Mosandl, A. Feed additives: Authenticity assessment using multicomponent-/multielement-isotope ratio mass spectrometry. Eur. Food Res. Technol. 2008, 227, 767–776. [Google Scholar] [CrossRef]
- Martin, G.; Remaud, G.; Martin, G.J. Isotopic methods for control of natural flavours authenticity. Flavour Fragr. J. 1993, 8, 97–107. [Google Scholar] [CrossRef]
- Do, T.K.T.; Hadji-Minaglou, F.; Antoniotti, S.; Fernandez, X. Authenticity of essential oils. TrAC Trends Anal. Chem. 2015, 66, 146–157. [Google Scholar] [CrossRef]
- Murphy, B.J.; Carlson, R.E.; Howa, J.D.; Wilson, T.M.; Buch, R.M. Determining the authenticity of methyl salicylate in Gaultheria procumbens L. and Betula lenta L. essential oils using isotope ratio mass spectrometry. J. Essent. Oil Res. 2021, 33, 442–451. [Google Scholar] [CrossRef]
- Schipilliti, L.; Dugo, G.; Santi, L.; Dugo, P.; Mondello, L. Authentication of bergamot essential oil by gas chromatography-combustion-isotope ratio mass spectrometer (GC-C-IRMS). J. Essent. Oil Res. 2011, 23, 60–71. [Google Scholar] [CrossRef]
- Wilson, T.M.; Murphy, B.J.; Abad, A.; Packer, C.; Poulson, A.; Carlson, R.E. Essential Oil Composition and Stable Isotope Profile of Cultivated Ocimum campechianum Mill. (Lamiaceae) from Peru. Molecules 2022, 27, 2777. [Google Scholar] [CrossRef] [PubMed]
- Wilson, T.M.; Murphy, B.J.; Ziebarth, E.A.; Poulson, A.; Packer, C.; Carlson, R.E. Essential Oil Composition and Stable Isotope Profile of Osmorhiza occidentalis Torr. (Apiaceae) from Utah. Plants 2022, 11, 2685. [Google Scholar] [CrossRef] [PubMed]
- Wüst, M. Authenticity Control of Natural Products by Stable Isotope Ratio Analysis; Springer International Publishing: Cham, Switzerland, 2018. [Google Scholar] [CrossRef]
- Bilke, S.; Mosandl, A. 2H/1H and 13C/12C isotope ratios of trans-anethole using gas chromatography−isotope ratio mass spectrometry. J. Agric. Food Chem. 2002, 50, 3935–3937. [Google Scholar] [CrossRef] [PubMed]
- Adams, R.P. Identification of Essential Oil Components by Gas Chromatography/Mass Spectrometry, 4th ed.; Allured Publ.: Carol Stream, IL, USA, 2007. [Google Scholar]


Disclaimer/Publisher’s Note: The statements, opinions and data contained in all publications are solely those of the individual author(s) and contributor(s) and not of MDPI and/or the editor(s). MDPI and/or the editor(s) disclaim responsibility for any injury to people or property resulting from any ideas, methods, instructions or products referred to in the content. |
© 2024 by the authors. Licensee MDPI, Basel, Switzerland. This article is an open access article distributed under the terms and conditions of the Creative Commons Attribution (CC BY) license (https://creativecommons.org/licenses/by/4.0/).