Article

Leveraging Geospatial Techniques and Publicly Available Datasets to Develop a Cost-Effective, Digitized National Sampling Frame: A Case Study of Armenia

by
Saida Ismailakhunova
1,
Avralt-Od Purevjav
2,
Tsenguunjav Byambasuren
3 and
Sarchil H. Qader
4,5,*
1
World Bank, 0179 Tbilisi, Georgia
2
World Bank, 1818 H St NW, Washington, DC 20433, USA
3
Department of Economics, Trinity College Dublin, D02 PN40 Dublin, Ireland
4
WorldPop, School of Geography and Environmental Science, University of Southampton, Southampton SO17 1BJ, UK
5
Natural Resources Department, University of Sulaymaniyah, Sulaymaniyah P.O. Box 334, Kurdistan Region, Iraq
*
Author to whom correspondence should be addressed.
ISPRS Int. J. Geo-Inf. 2026, 15(4), 145; https://doi.org/10.3390/ijgi15040145
Submission received: 1 January 2026 / Revised: 13 March 2026 / Accepted: 20 March 2026 / Published: 26 March 2026

Abstract

The lack of a reliable national sampling frame poses a major challenge for conducting representative population and household surveys, particularly in developing countries affected by displacement and rapid territorial change. This study addresses this gap by developing Armenia’s first digitized national sampling frame, where accessible survey frames are severely limited. We introduce an innovative pre-EA tool to semi-automatically construct the digital sampling frame using publicly available datasets. Compared with traditional approaches, this method outperforms in several ways: it enables rapid, semi-automated frame construction, minimizes resource requirements, eliminates geometric errors associated with manual digitization, and produces pre-census EAs (pre-EAs) that both nest within administrative boundaries and align with visible ground features. The approach also integrates gridded population data to reflect recent urbanization and migration, generating pre-census EAs and urban–rural classifications suitable for national surveys. The sampling frame was successfully applied in the World Bank’s “Listening to Armenia” survey. Overall, the study demonstrates that automated, data-driven approaches can efficiently produce accurate, scalable, and adaptable national sampling frames, offering potential utility in other countries facing similar constraints.

1. Introduction

In survey research, a national sampling frame is a frame that covers the entire target population of a country and is used as the basis for drawing a representative sample (e.g., census-based or registry-based frames, such as those reviewed by Harrison et al. [1]). In many countries, census enumeration areas (EAs)—the basic geographic units used for the collection and dissemination of census data—commonly function as the national sampling frame for a wide range of surveys [2]. The addition of the qualifier digital (or digitised) to national sampling frame does not imply a different methodological construct; rather, it denotes the technological format in which the frame is maintained. A digital national sampling frame is therefore one that exists in electronic, database-driven form, enabling computerized storage, systematic updating, and automated sample selection procedures. A well-defined national sampling frame is therefore fundamental to producing reliable and representative survey results. However, national sampling frames face several critical challenges globally, especially in developing countries and conflict-affected regions where conducting representative surveys is crucial for high-quality research and policy analysis with minimal bias. Many countries, including the Republic of Armenia, rely on national sampling frames based on census EAs from previous population censuses. These frames, however, are often outdated, non-digital, incomplete, not reflecting recent population changes and difficult to access, limiting their use to local government organizations while excluding researchers, academics, and international organizations. This issue is particularly acute in Armenia, where the recent large-scale refugee crisis and significant shifts in population distribution due to the Nagorno-Karabakh conflict have further compounded these challenges [3]. Consequently, the lack of accessible, up-to-date sampling frames undermines efforts to conduct surveys for statistical, policy, and research purposes.
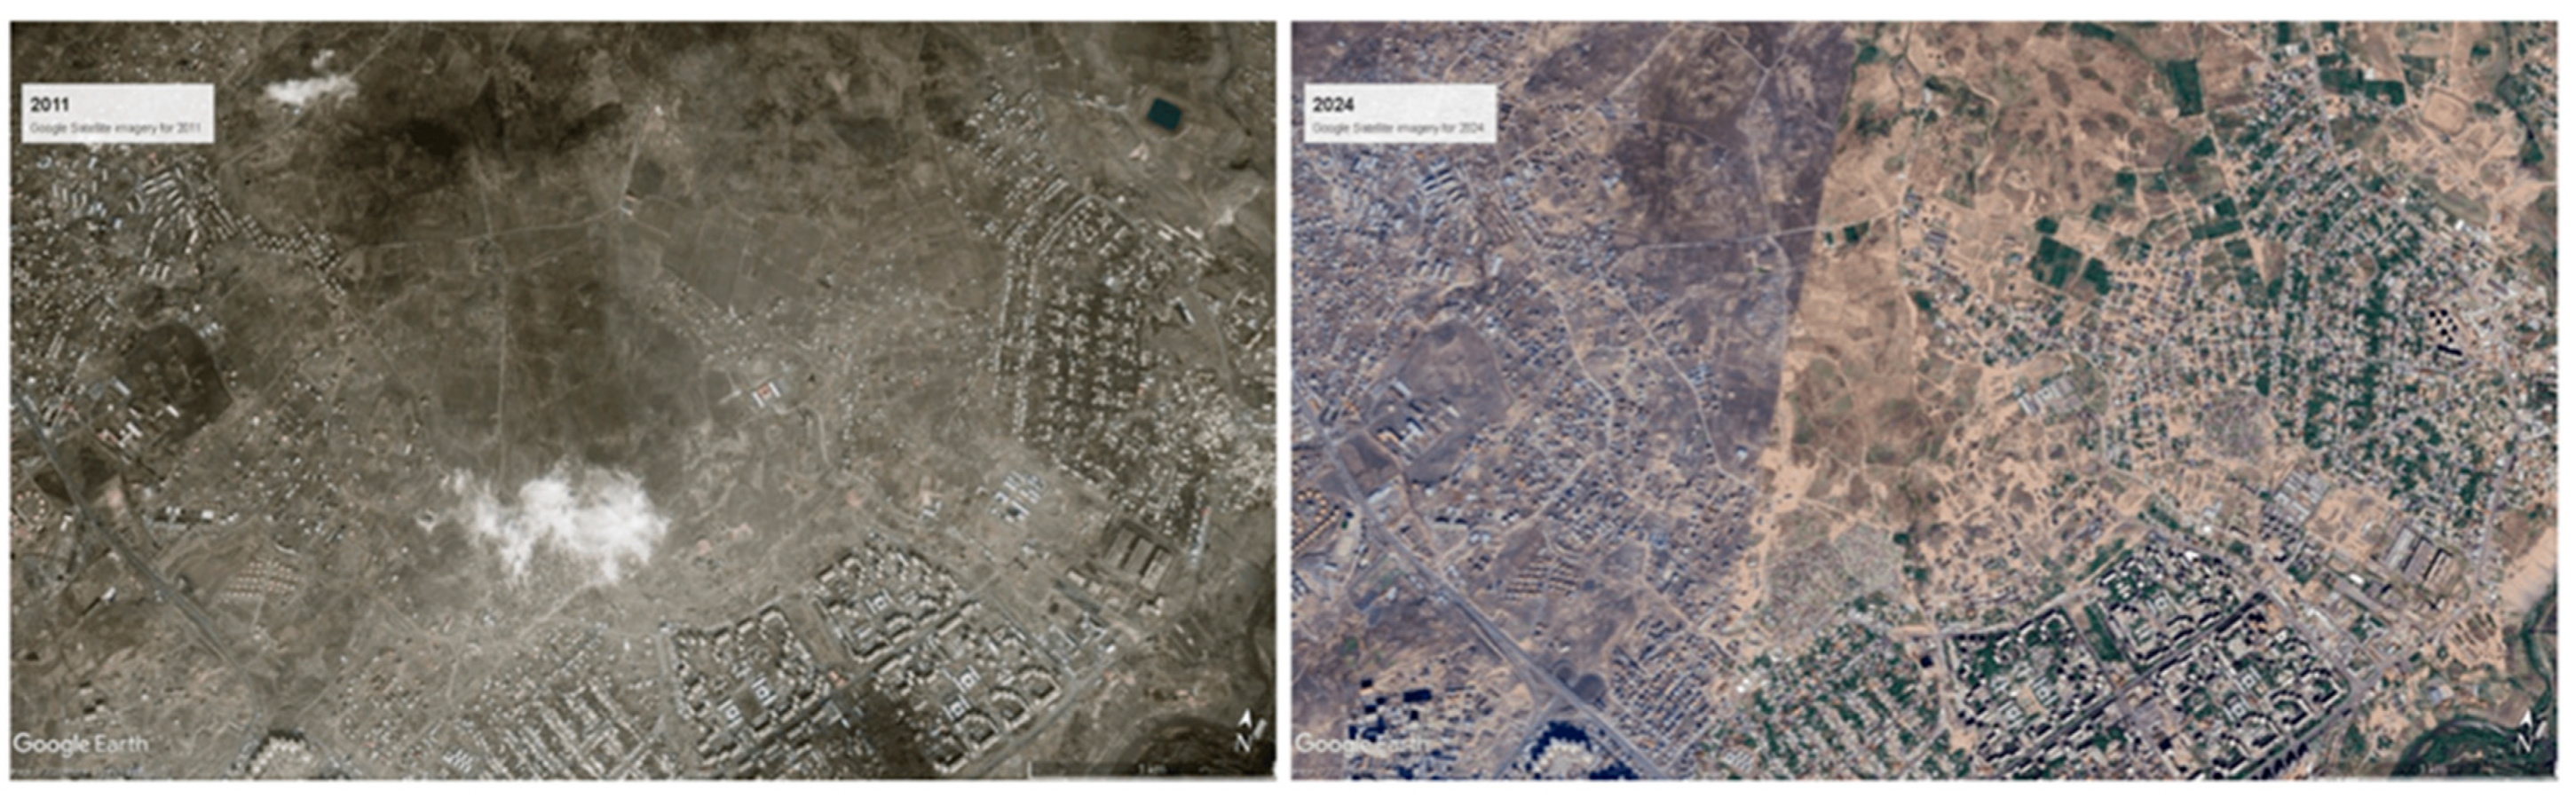
Multiple sources are often used as the foundation for digital national sampling frames, including census EAs, subnational administrative boundaries, and gridded population sampling frames. A census is conducted every 5 to 10 years, depending on financial and administrative costs, and the nature of the census questions. For instance, Armenia’s sampling frame relies on the 2011 Census, which is now severely outdated due to demographic changes resulting from population displacements and mobility across regions (Appendix A, Figure A1) caused by territorial conflicts. In 2022, the Committee of the Republic of Armenia (ArmStat) conducted a Population Census using a combined approach of administrative data and a sampled census, offering a potential up-to-date national sampling frame [4]. However, due to the COVID-19 pandemic, the census was conducted in a hybrid format, as was the case in many countries. This frame, based on a sample of 25% of the addresses in the State Population Register (SPR), is restrictive and largely inaccessible [4]. Several attempts have been made to access the SPR but failed to obtain the sampling frame based on SPR addresses. Since this dataset is not readily available, it is essential to find an alternative methodology to update the data from the previous census.
Grid sampling, in which cells with population estimates serve as sampling units, is one approach that has been used to construct digital national sampling frames. The sampling frame relies on millions of grid cells, which are publicly available from various data sources, such as WorldPop [5], Geo-Referenced Infrastructure and Demographic Data for Development (GRID3) [6], Global Human Settlement Layer (GHS-POP) [7], Gridded Population of the World version 4 (GPWv4) [8], High Resolution Settlement Layer (HRSL) [9], LandScan HD [10], accessible through platforms like Google Earth Engine. The size of the grid and the quality of the resulting population data can vary between countries, depending on the data source and provider. However, grid sampling comes with several challenges. First, grid boundaries are often unnatural, cutting through buildings and disregarding visible geographic features [2]. Second, although the spatial size of grids is uniform, the population size within each grid can vary significantly. As a result, sparsely populated grids may need to collapse, while densely populated grids require segmentation [2,11]. Over recent decades, several methodological approaches and tools have been developed to create gridded population sampling frameworks [11,12,13].
Other researchers and surveyors have utilized other geospatial techniques and datasets to develop various digital national sampling frames tailored to their specific needs and objectives. Kassié et al. [14] outline a sampling protocol for a health survey in Bobo-Dioulasso, Burkina Faso, using urban typology based on infrastructure and satellite imagery. The method surveyed 1045 households, providing an alternative approach for areas with limited data. In the context of a hard-to-reach and mobile population, a random geographic cluster sample (RGCS) was explored to address undercoverage in household surveys in Ethiopia, by selecting random points and interviewing all eligible respondents within designated circles [15]. A community-based survey was conducted using area-based stratified random sampling and geospatial technology to examine social determinants of health and their association with obesity prevalence among Hispanics and non-Hispanic whites in a rural Southeastern U.S. community [16]. The lack of translation of these methods into user-friendly tools, along with challenges in their reproducibility in certain contexts, presents difficulties in replicating these methods in other countries, especially in regions where geospatial skills are limited. Therefore, enhancing geospatial capacity and developing user-friendly tools is crucial to fully leverage geospatial techniques, ensuring the creation of more accurate and representative sampling frames.
This paper presents Armenia’s first digital national sampling frame, successfully developed using a range of innovative geospatial techniques and datasets. The term pre-census EAs (pre-EAs) is introduced to distinguish this novel sampling frame from the official census EAs. The developed pre-EA based national sampling frame offers several advantages over traditional sampling frames [2]. The development of the semi-automated pre-census EAs (pre-EAs) relies on multiple publicly available datasets, including high-resolution gridded population data, the spatial distribution of settled areas, and available natural and administrative boundaries from sources such as OpenStreetMap (OSM) and WorldPop. Additional datasets incorporated for cross-validation and comparison with existing frames include: (i) the 2011 Census, providing spatial information on regions (marzes) and settlement types (urban or rural); (ii) census settlements based on the 2011 Census; (iii) 2023 electoral precincts; and (iv) aggregate population data from ArmStat, disaggregated by marz and settlement type. Although these sampling frames exist in Armenia, they have limitations that restrict their suitability for representative household surveys: many are outdated, non-digital, inaccessible to external researchers, or too coarse to accurately capture population distributions at finer geographic scales. To address these limitations, the paper systematically reviews existing frames, focusing on census settlements—villages in rural areas, towns in urban regions, and districts in the capital, Yerevan—as well as electoral precincts, which correspond to official election zones. For each dataset, we assess the strengths and weaknesses, highlighting challenges such as large or irregular sampling units, lack of clearly defined boundaries, and outdated population information. These evaluations provide the rationale for developing a new, accessible and semi-automated national sampling frame based on pre-EAs. This approach leverages recent population estimates and geospatial techniques to generate manageable, population-balanced, and geographically consistent units, offering a practical solution for conducting representative household surveys in Armenia.
This paper makes several contributions to literature and the field of survey sampling. First, it presents a national sampling frame for Armenia based on pre-EAs, demonstrating the applicability of a semi-automated spatial technique that could benefit other countries. The method has been implemented and tested in countries such as Somalia, which lacks a digital national sampling frame [2], Cameroon, which requires a customized national sampling frame for refugees [17], the Democratic Republic of Congo [18], and Burkina Faso [19]. However, this is the first application of the tool in Central Asia. Second, the national sampling frame developed in this paper contributes to survey data collection in Armenia. The use of multiple sampling frames in the country often makes it difficult for researchers, policymakers, and others to compare results across surveys. By providing a unified, standardized sampling frame based on publicly available datasets, this paper helps ensure consistency across surveys and avoids discrepancies in population estimates, offering a methodological contribution to the field. Third, the rigorous evaluation of various sampling frames, contributes to the survey sampling literature and practice in Armenia. To the best of our knowledge, no study has yet systematically compared various sampling frames in Armenia. This new sampling frame does not replace existing frames but can complement them, particularly the national census frame, offering an alternative approach. Finally, this work highlights the value of public datasets such as OpenStreetMap. The availability of high-quality, public geospatial data can generate substantial societal value, potentially amounting to tens or even hundreds of millions of dollars, even before considering indirect benefits [20].

2. Suitability and Limitations of Existing Sampling Frames in Armenia

This section reviews existing and potentially accessible sampling frames in Armenia to evaluate their suitability for representative household surveys. The discussion highlights key limitations—such as lack of accessibility, outdated population data, large or irregular sampling units, and absence of digital boundaries—that motivate the development of the pre-EA framework proposed in this paper.
In Armenia, there is no functional or accessible map or cartographic information that can be used for a national sampling frame, posing a significant barrier to conducting nationally representative socioeconomic surveys. In addition, the country does not currently have an up-to-date and digitized national sampling frame. Armenia’s last traditional full-field population census was conducted in 2011 [21], and there are no up-to-date digital EAs available for use as national sampling frames for representative socioeconomic surveys. The spatial resolution of the census data in use today is limited to the provincial or district level (2nd and 3rd administrative units), making it difficult to determine how people are distributed at finer scales—such as the facility, sub-district, or neighbourhood levels—where most policy interventions typically occur, including generating a national sampling frame.
In developing countries, creating a sampling frame for surveys that include representative community samples usually involves manually delineating small geographic areas (or EAs) on high-resolution satellite imagery. While this method is commonly employed by National Statistical Offices (NSOs), it is logistically complex and requires substantial resources, including Geographic Information System (GIS) experts and extensive training [2,11]. Additionally, this process is both time-consuming and expensive, often resulting in delays to the survey. For instance, it can take two to three years to complete a survey [22]. These challenges highlight the need for a faster and more cost-effective approach to sampling frame and population enumeration methodologies.
Before discussing the new sampling frame, an overview of the existing sampling frames in the country is provided. Three datasets have been identified as potential sources for developing a national sampling frame for household surveys: the 2022 Census with addresses from the SPR, the 2011 Census with settlement data (villages in rural areas, towns in non-Yerevan urban regions, and districts in Yerevan), and 2023 election data with electoral precincts.
ArmStat conducted a population census in November 2022, employing a combined approach based on administrative data from the SPR and a 25% sample of SPR addresses [21]. In this dataset, sampling units correspond to the workload of SPR addresses assigned to each enumerator during the census. While these units lack the identifiable boundaries of traditional census EAs, they can still serve as a sampling frame since they cover approximately 93% of all addresses in the country. The household listings in this dataset were last updated in October 2022, although the addresses are distant due to the large size of the units. Despite its strengths, this frame is inaccessible, as the data is only available on a restricted computer at ArmStat [23]. Given these challenges, this paper focuses on the latter two datasets: the 2011 settlement-based frame and the 2023 electoral precinct-based frame. Their respective advantages and limitations are discussed in detail.

2.1. Census Settlements

The most granular spatial information available in this dataset is at the “settlement” level. There are 1037 settlements (980 villages, 45 towns, and 12 districts in Yerevan). One of the key advantages of this sampling frame is that it identifies over 1000 distinct geographical areas, which is more granular than simply using regions or marzes.
A key challenge with this dataset is its heterogeneous spatial coverage units. Suppose that 400 settlements were selected in the first stage of the two-stage stratified cluster sampling design as primary sampling units (PSUs). Given the large populations in the 12 districts of Yerevan, it is likely that all districts will be selected using a probability proportional to size (PPS) approach. If 10 households were randomly selected from each district in the second stage, the sample size from Yerevan would total 120 households, which represents only 3% of the total sample of 4000 households. However, according to the 2011 Armenia Census, Yerevan accounts for approximately 35% of the population and 38% of the total households. One can select a disproportionate number of households from each PSU in the second stage to account for the variations in the size of the PSUs in the first stage. For example, selecting 100 households from each district in Yerevan would yield 1200 households from Yerevan, which is 30% of the sample. However, a notable drawback of this frame is the presence of large settlements, particularly in Yerevan. While identification information is unavailable, the Census frame from the Committee of the Republic of Armenia (ArmStat) includes approximately 12,000 EAs, which means settlements in this frame are, on average, 12 times larger than the Census EAs. Using large PSUs in this manner could undermine the integrity of the two-stage sampling design, effectively reducing it to a one-stage design. Large settlements must be subdivided into smaller and more manageable PSUs to resolve this. In the past, large PSUs have been manually segmented into smaller units, as demonstrated in Nepal [24]; however, this traditional approach is both costly and time-consuming. This paper proposes an innovative technique for dividing these large areas into smaller, more practical units.
Another issue with this potential sampling frame is that the population data based on the 2011 Census is outdated and misallocated. While outdated data typically is not a major concern for national sampling frames (since any survey conducted before the 2022 Armenia Census could use the 2011 Census frame), it presents a more significant problem in Armenia, where household displacement and domestic migration due to territorial conflicts have been substantial in recent years [3]. As a result, the current population distribution may differ significantly from that recorded in the 2011 Census. To address this, population data can be updated using population growth rates at more aggregate levels. If updates are made at a finer level than administrative units, the population distribution across areas can be adjusted to better reflect the current reality. However, any adjustments at the administrative unit level or more aggregate levels, such as regions, would not alter the probability of a PSU being selected in the first stage of the PPS process. Since PPS selection is based on administrative units, any monotonic transformation of PSU size within these units would not affect the selection probability. Therefore, adjustments to population and household data should be made at a level more granular than administrative units to ensure the integrity of the sampling process. While this frame provides granular information for over 1000 settlements, it is outdated and contains large, irregular PSUs. These limitations prevent its direct use for representative surveys, motivating our need to subdivide settlements into pre-EAs.

2.2. Electoral Precincts

The confidential microdata on electoral precincts is originally sourced from the Central Election Committee of Armenia which in not available to public [25]. There are two main advantages to using this dataset as a sampling frame for household surveys. First, the data is regularly updated and reflects current information. Second, with 1992 electoral precincts, the dataset exceeds the 1037 settlements in the 2011 Census settlement data. As a result, the spatial information is more granular than that provided by the 2011 Census, and issues related to a few large-sized sampling units are less pronounced compared to a sampling frame based on census settlements. However, similar to the “settlements” in the 2011 Census data, using electoral precincts as sampling units also presents challenges related to large-sized sampling units. It is important to note that there are also smaller electoral precincts, which are less problematic. As noted in Pettersson [23], the size of voting point areas in Armenia ranges from 7 addresses to 1200 addresses. Smaller voting points (VP) areas can be merged with neighbouring areas, while larger VP areas can be divided into smaller segments. The process of merging smaller VP areas should be relatively straightforward, but segmenting large areas may incur additional costs, as it requires spatial analysis and likely some cartographic work.
Additionally, the boundaries of sampling units are crucial to ensure that enumerators do not exceed the targeted area. This feature is lacking in both sampling frames discussed in this section, as no boundaries (neither digital nor physical) are available for the Census settlements or electoral precincts. However, this is a more significant issue for the precinct-based sampling frame, as precincts are relatively smaller in size compared to settlements. As a result, the likelihood of enumerators inadvertently entering neighbouring, non-selected sampling units is higher for precincts. In the case of very small electoral precincts, enumerators may stray outside the designated area if they are not provided with proper maps during fieldwork.
The advantages and disadvantages of a sampling frame based on the 2023 electoral precincts indicate that it is relatively more favourable than the frame based on the 2011 Census settlements. Consequently, the 2023 electoral precincts have been further evaluated as a sampling frame for representative individual- and household-level surveys, with an exploration of the data on electoral precincts. The size of each electoral precinct is measured by the number of voters or the adult population, excluding children or individuals under 18 years old. Table 1 illustrates the distribution of strata size using both the total and adult populations. The stratum is defined as a combination of marz and settlement type—urban or rural status, as seen in other official surveys like Armenia’s Demographic and Health Survey (DHS) [26]. The 2022 population data at the strata level is sourced from the Committee of the Republic of Armenia [21]. The total population in 2022, as shown in Column 1, is 2.977 million. Column 2 displays the 2023 number of voters (adult population aged 18 or older) based on the electoral precinct-based sampling frame [25]. Column 3 shows the difference between the total population and the adult population over subsequent years. Although the two population figures correspond to different years, some irregularities are observed, such as the adult population exceeding the total population by approximately 11,000 people in rural areas of Lori.
As shown in Column 2 of Table 1, the total number of voters or the adult population is 2.405 million, which is quite close to the total population. This suggests that approximately 19% of the population is composed of children under 18 years old. However, other datasets indicate that children under 18 make up around 23–24% of Armenia’s population. To further investigate this, the total adult population across various official data sources was examined for comparison. Table 2 presents the findings. According to the 2011 Armenia Census, the adult population share (aged 18 and older) is 77%, while the adult population share derived from a combination of the 2022 World Bank data (for the 0–14 age group) and the 2011 Armenia Census (for the 15–17 age group) is 76%. This suggests that the election data overestimated the adult population by approximately 4–5%. Despite these discrepancies, the sampling units size based on the number of adults or voters does not pose a significant issue, as the total and adult populations across strata or administrative units are strongly and positively correlated, with a correlation coefficient of ρ = 0.996 (p-value = 0.000).
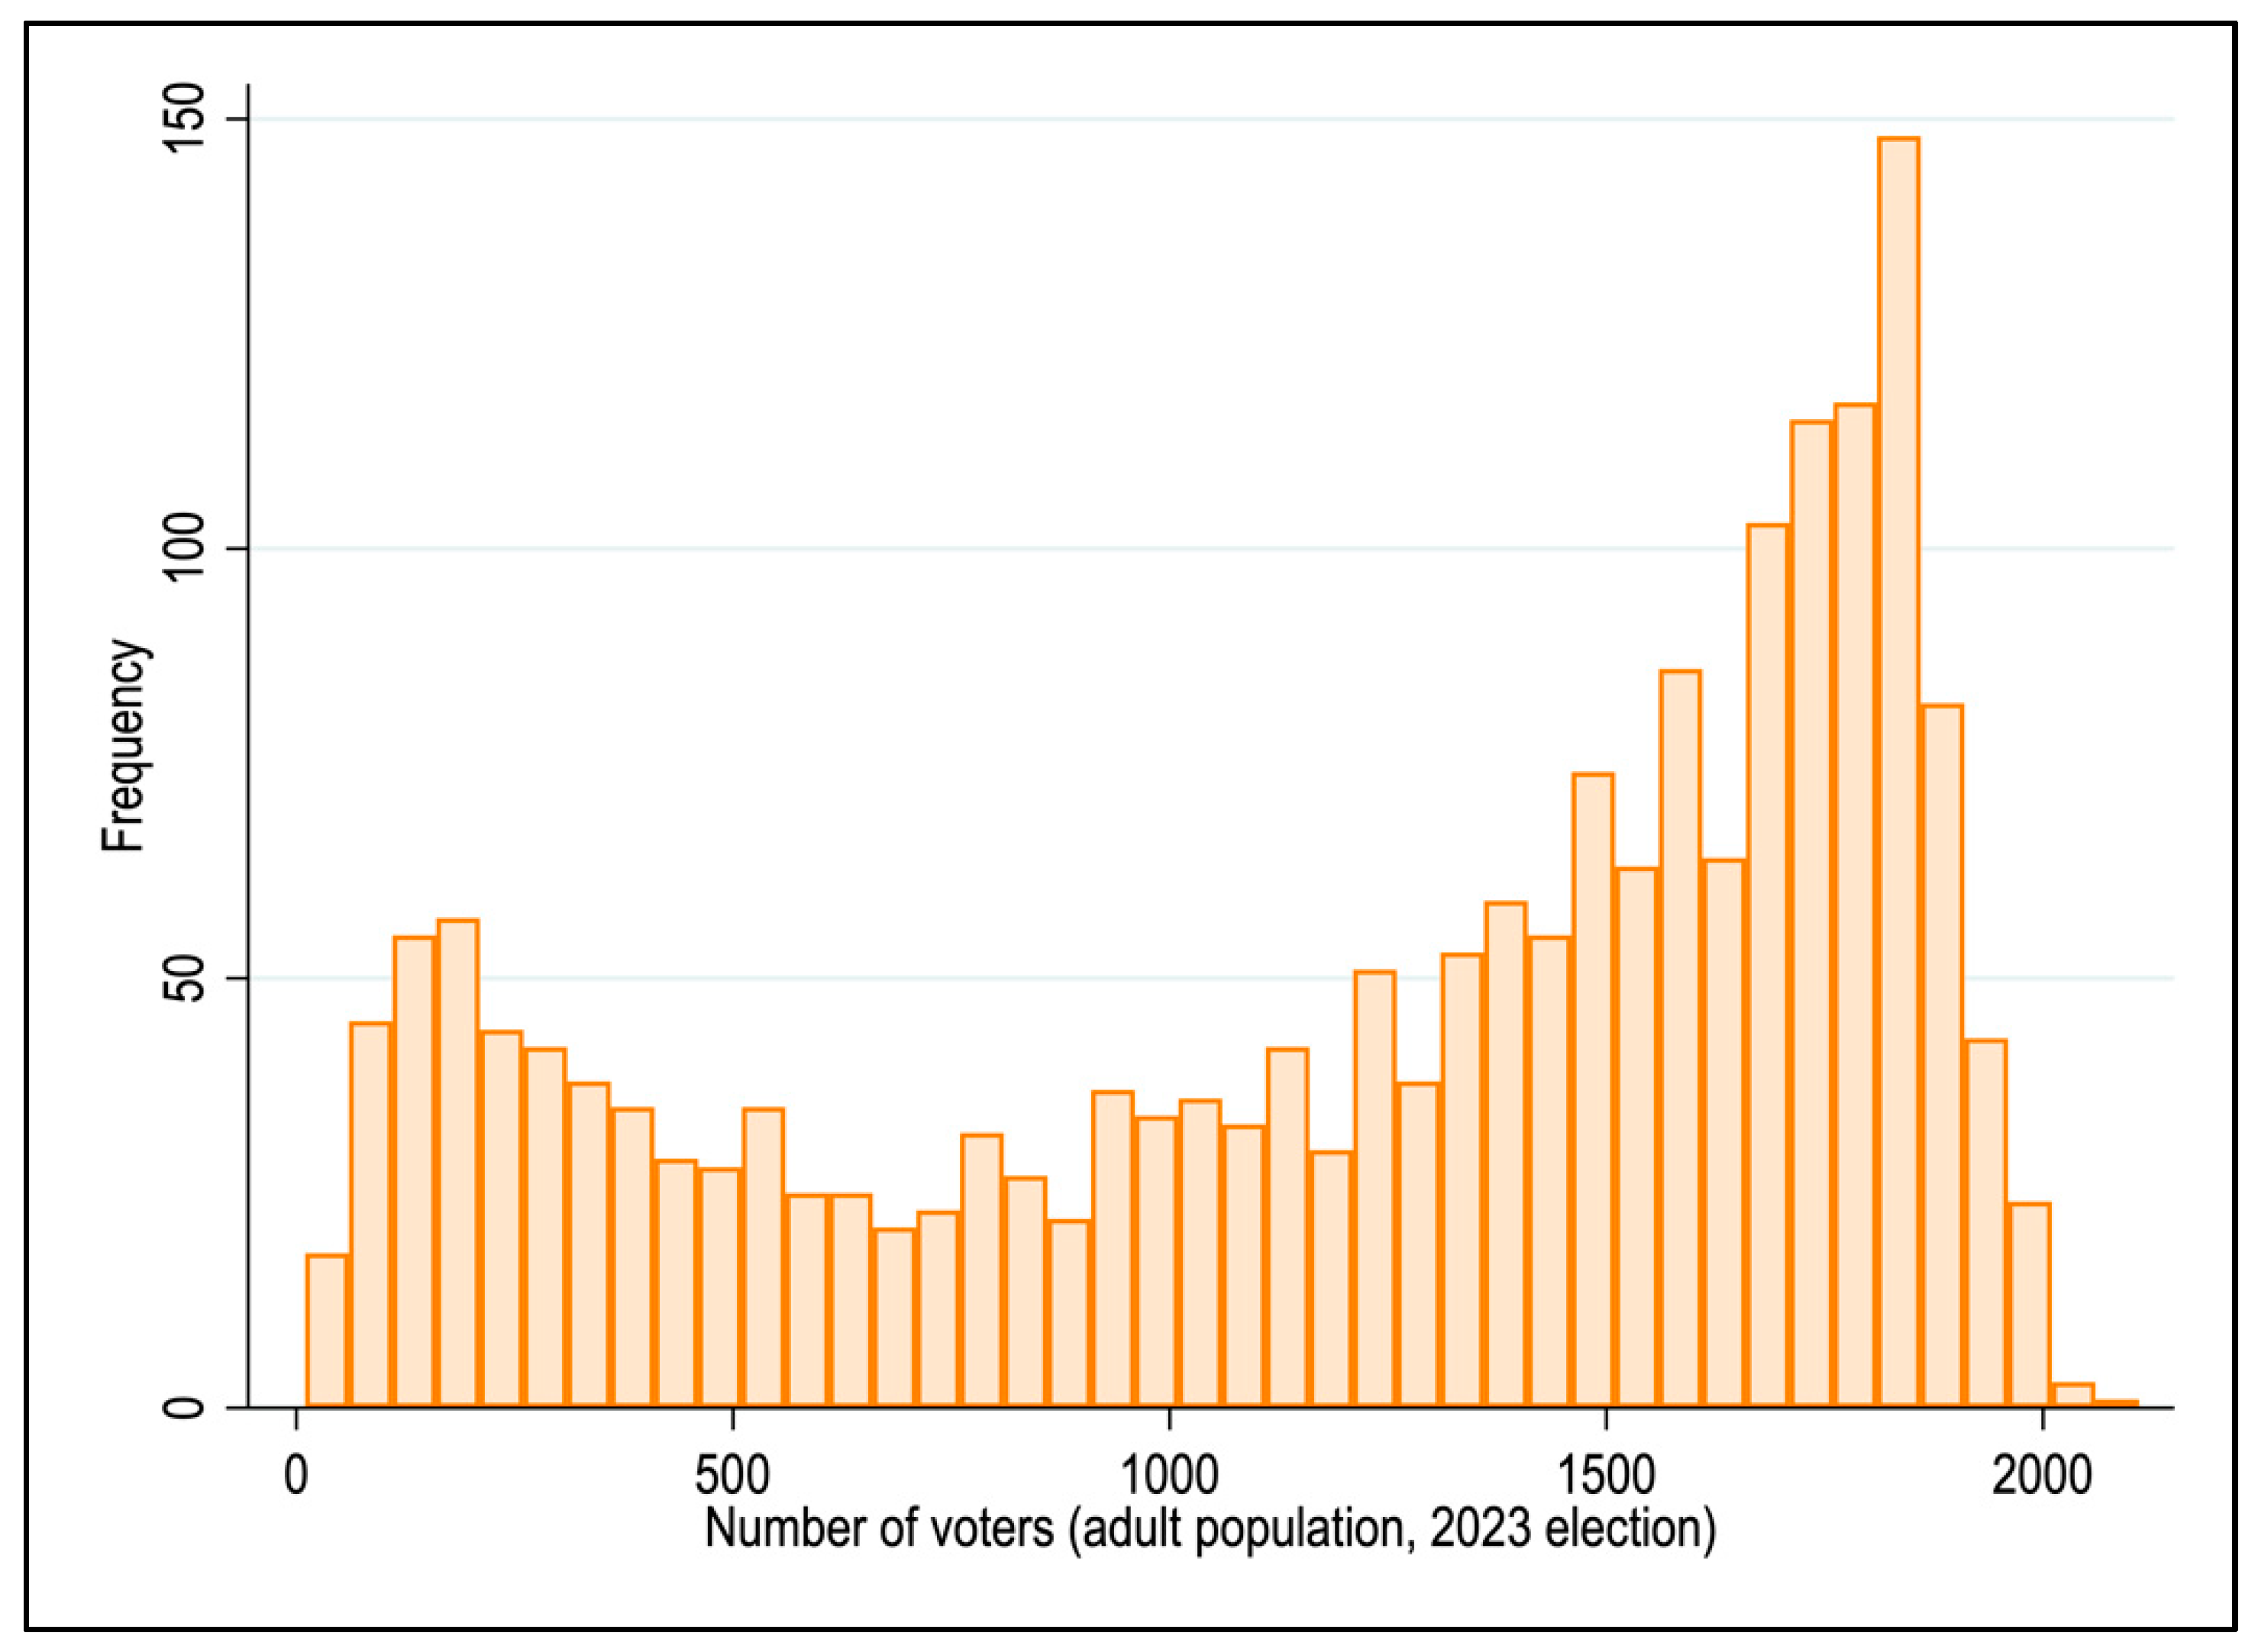
In addition to the absolute value of sampling unit size, the distribution of the size measure across sampling units is also crucial. Figure 1 illustrates the distribution of the 2023 adult population across electoral precincts. Ideally, sampling units should be equal size, or the sampling unit sizes should be evenly distributed across the sample frame. Population data from census frames typically follows a normal distribution, with few very small or large sampling units. However, the distribution of voters across electoral precincts in this case is U-shaped. The precinct size ranges from 10 to 2061 voters, with a mean size of 1208 and a median size of 1399. This distribution highlights the need for merging and segmentation to make the electoral precinct-based frame more workable, aligning with the distribution of households observed in Pettersson et al. [23]. Although more granular and current, electoral precincts lack digital boundaries and have irregular sampling unit sizes, requiring segmentation and merging. This demonstrates the need for a standardized, digital sampling frame.
Finally, major and official surveys, such as the Demographic and Health Survey (DHS) for Armenia, rely on sample frames based on EAs, rather than electoral precincts. Table 3 provides a summary of the sampling frames used in major surveys across Armenia. The evaluation of existing frames demonstrates that, while some data are available, none are fully suitable for constructing a comprehensive, digital national sampling frame. The evaluation of existing frames demonstrates that, while some data are available, none are fully suitable for constructing a comprehensive, digital national sampling frame. These limitations—accessibility, outdated population data, irregular sampling unit sizes, and lack of digital boundaries—directly motivate the development of the pre-EA framework presented in this paper. By addressing these gaps, pre-EAs provide a standardized, accessible, and scalable approach to representative household survey sampling in Armenia.

3. Materials and Methods

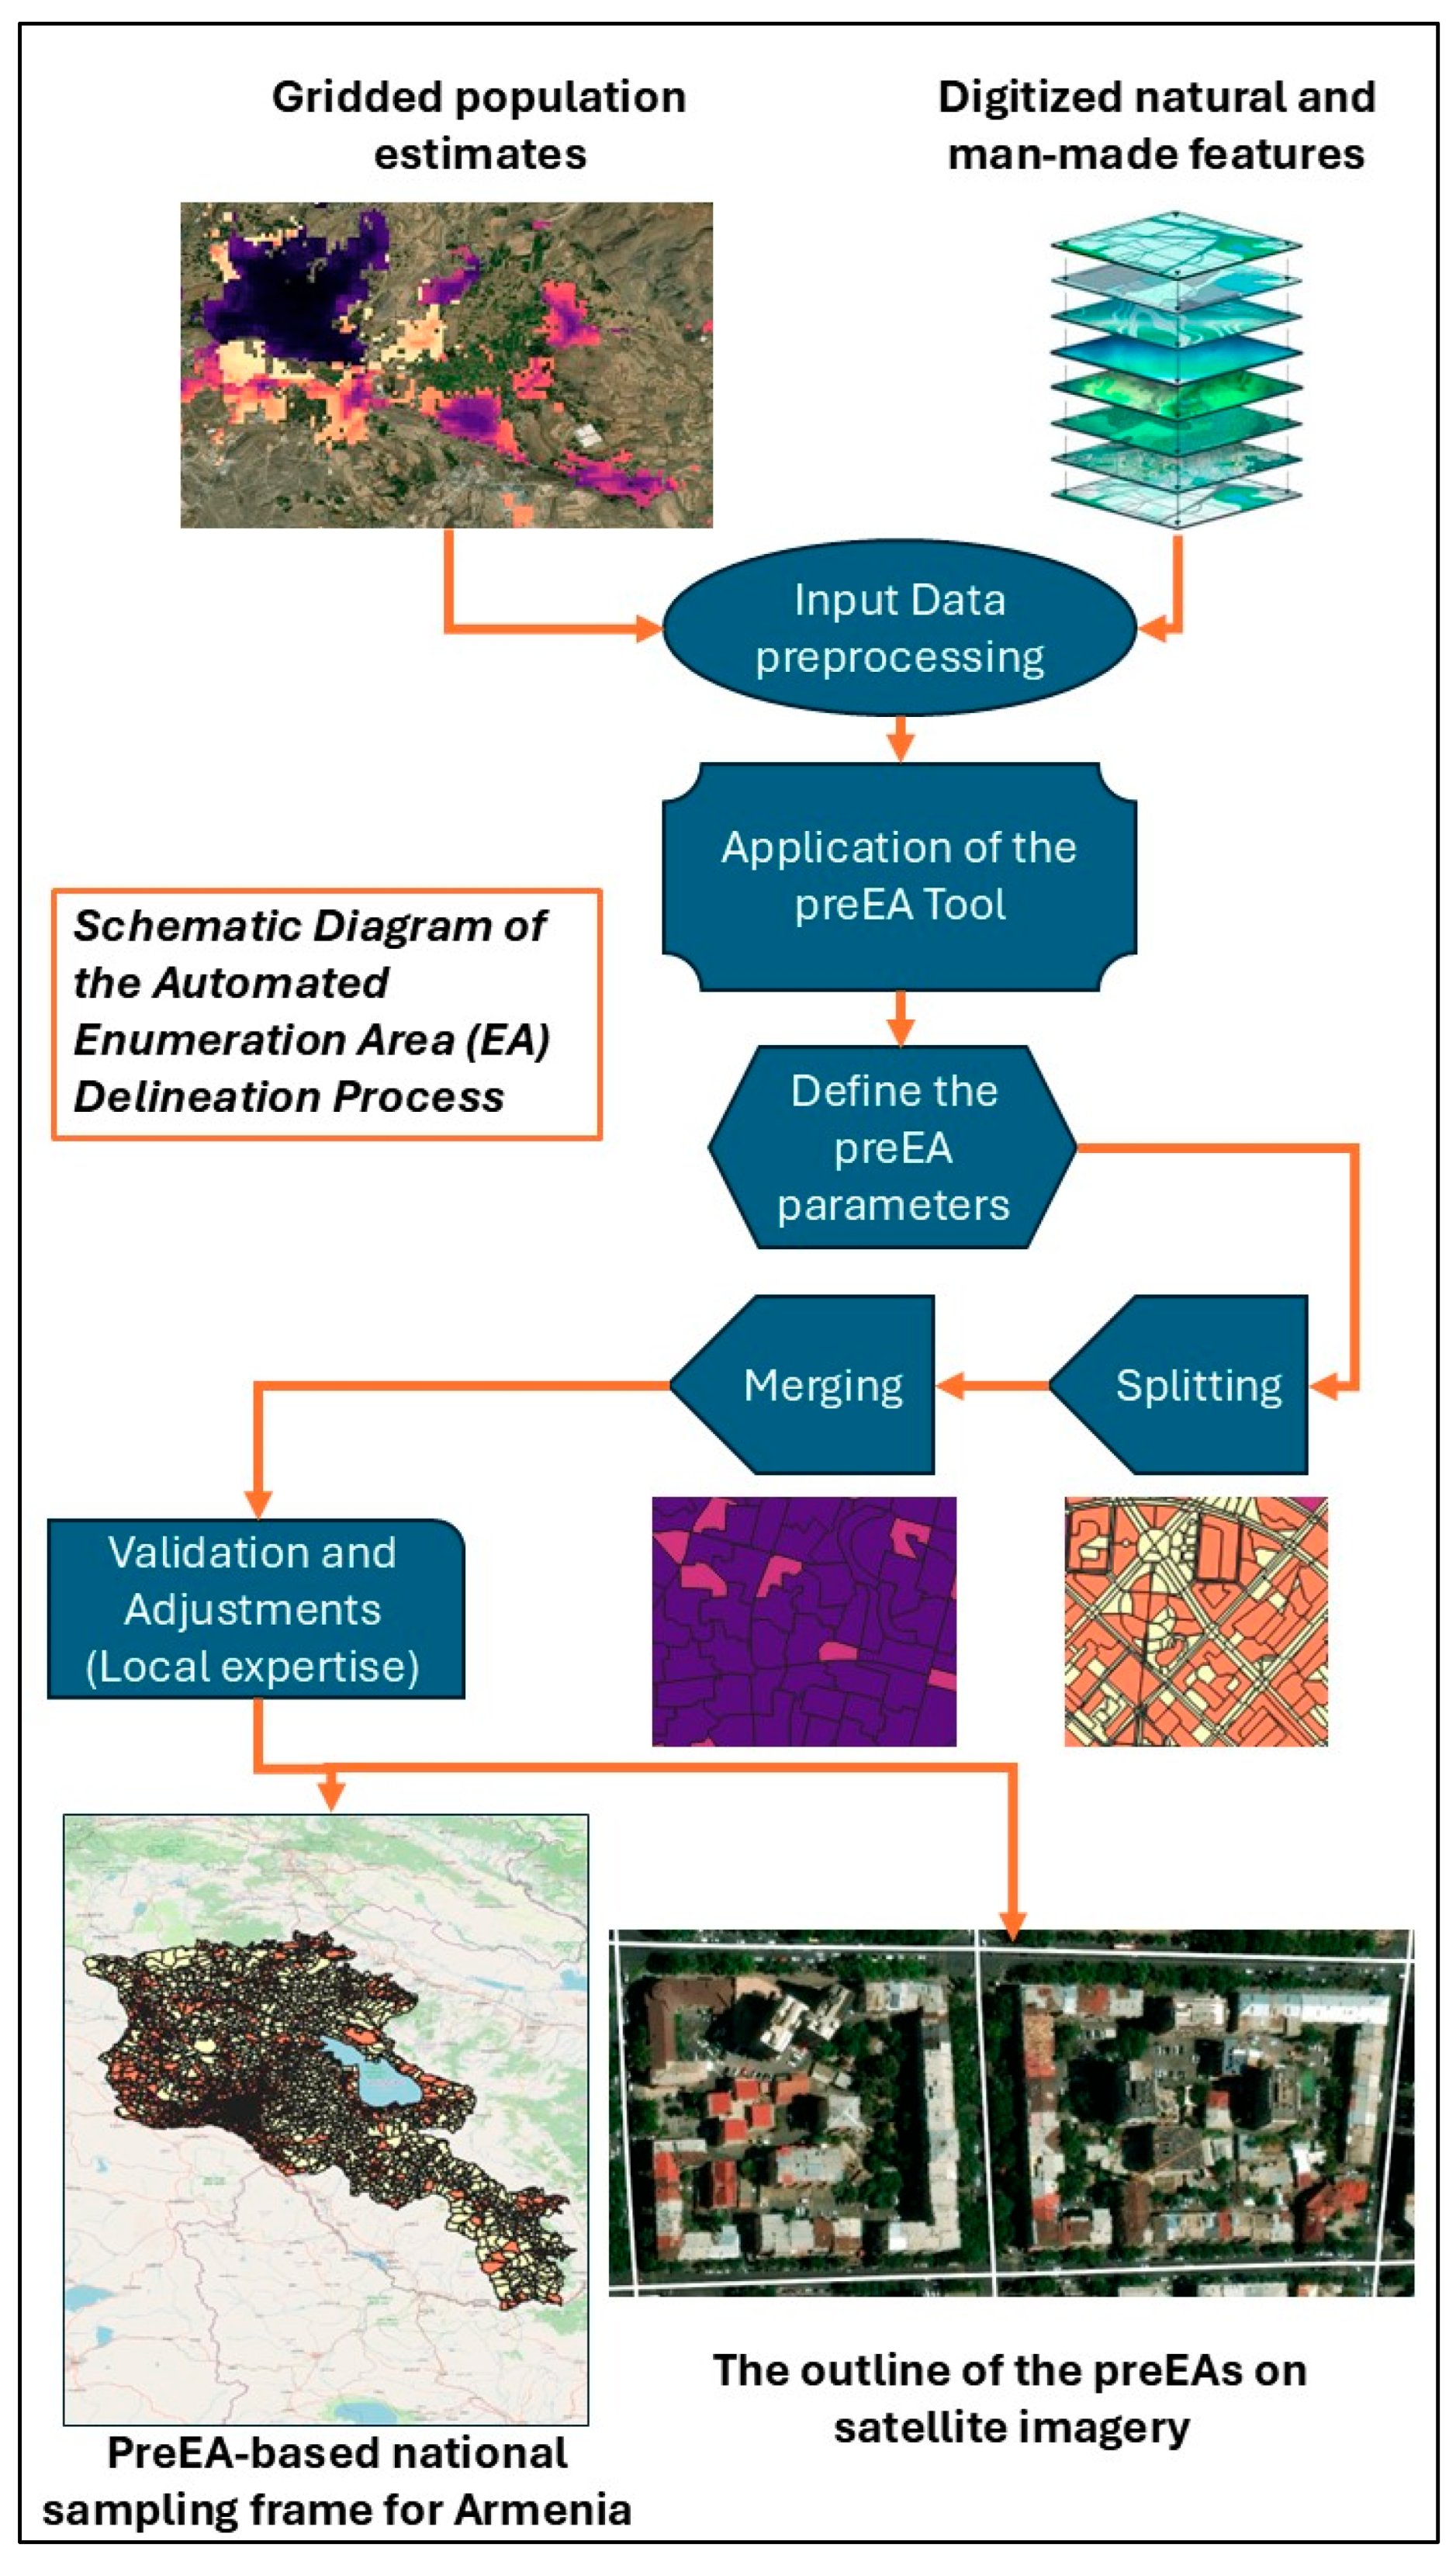
The pre-EA production process involves several stages. First, various geospatial datasets were obtained and pre-processed. Next, urban and rural areas across the country were classified. The pre-EA tool v1.0 was then applied to generate the pre-EA boundaries. Finally, both automatic and manual processes were used to post-process the pre-EA boundaries and validate them. Figure 2 illustrates the overall process involved in producing the national sampling frame in Armenia for this study.

3.1. Input Datasets

This section outlines the datasets sourced from various organizations to establish the national sampling frame and facilitate field data collection in Armenia.

3.1.1. Gridded Population

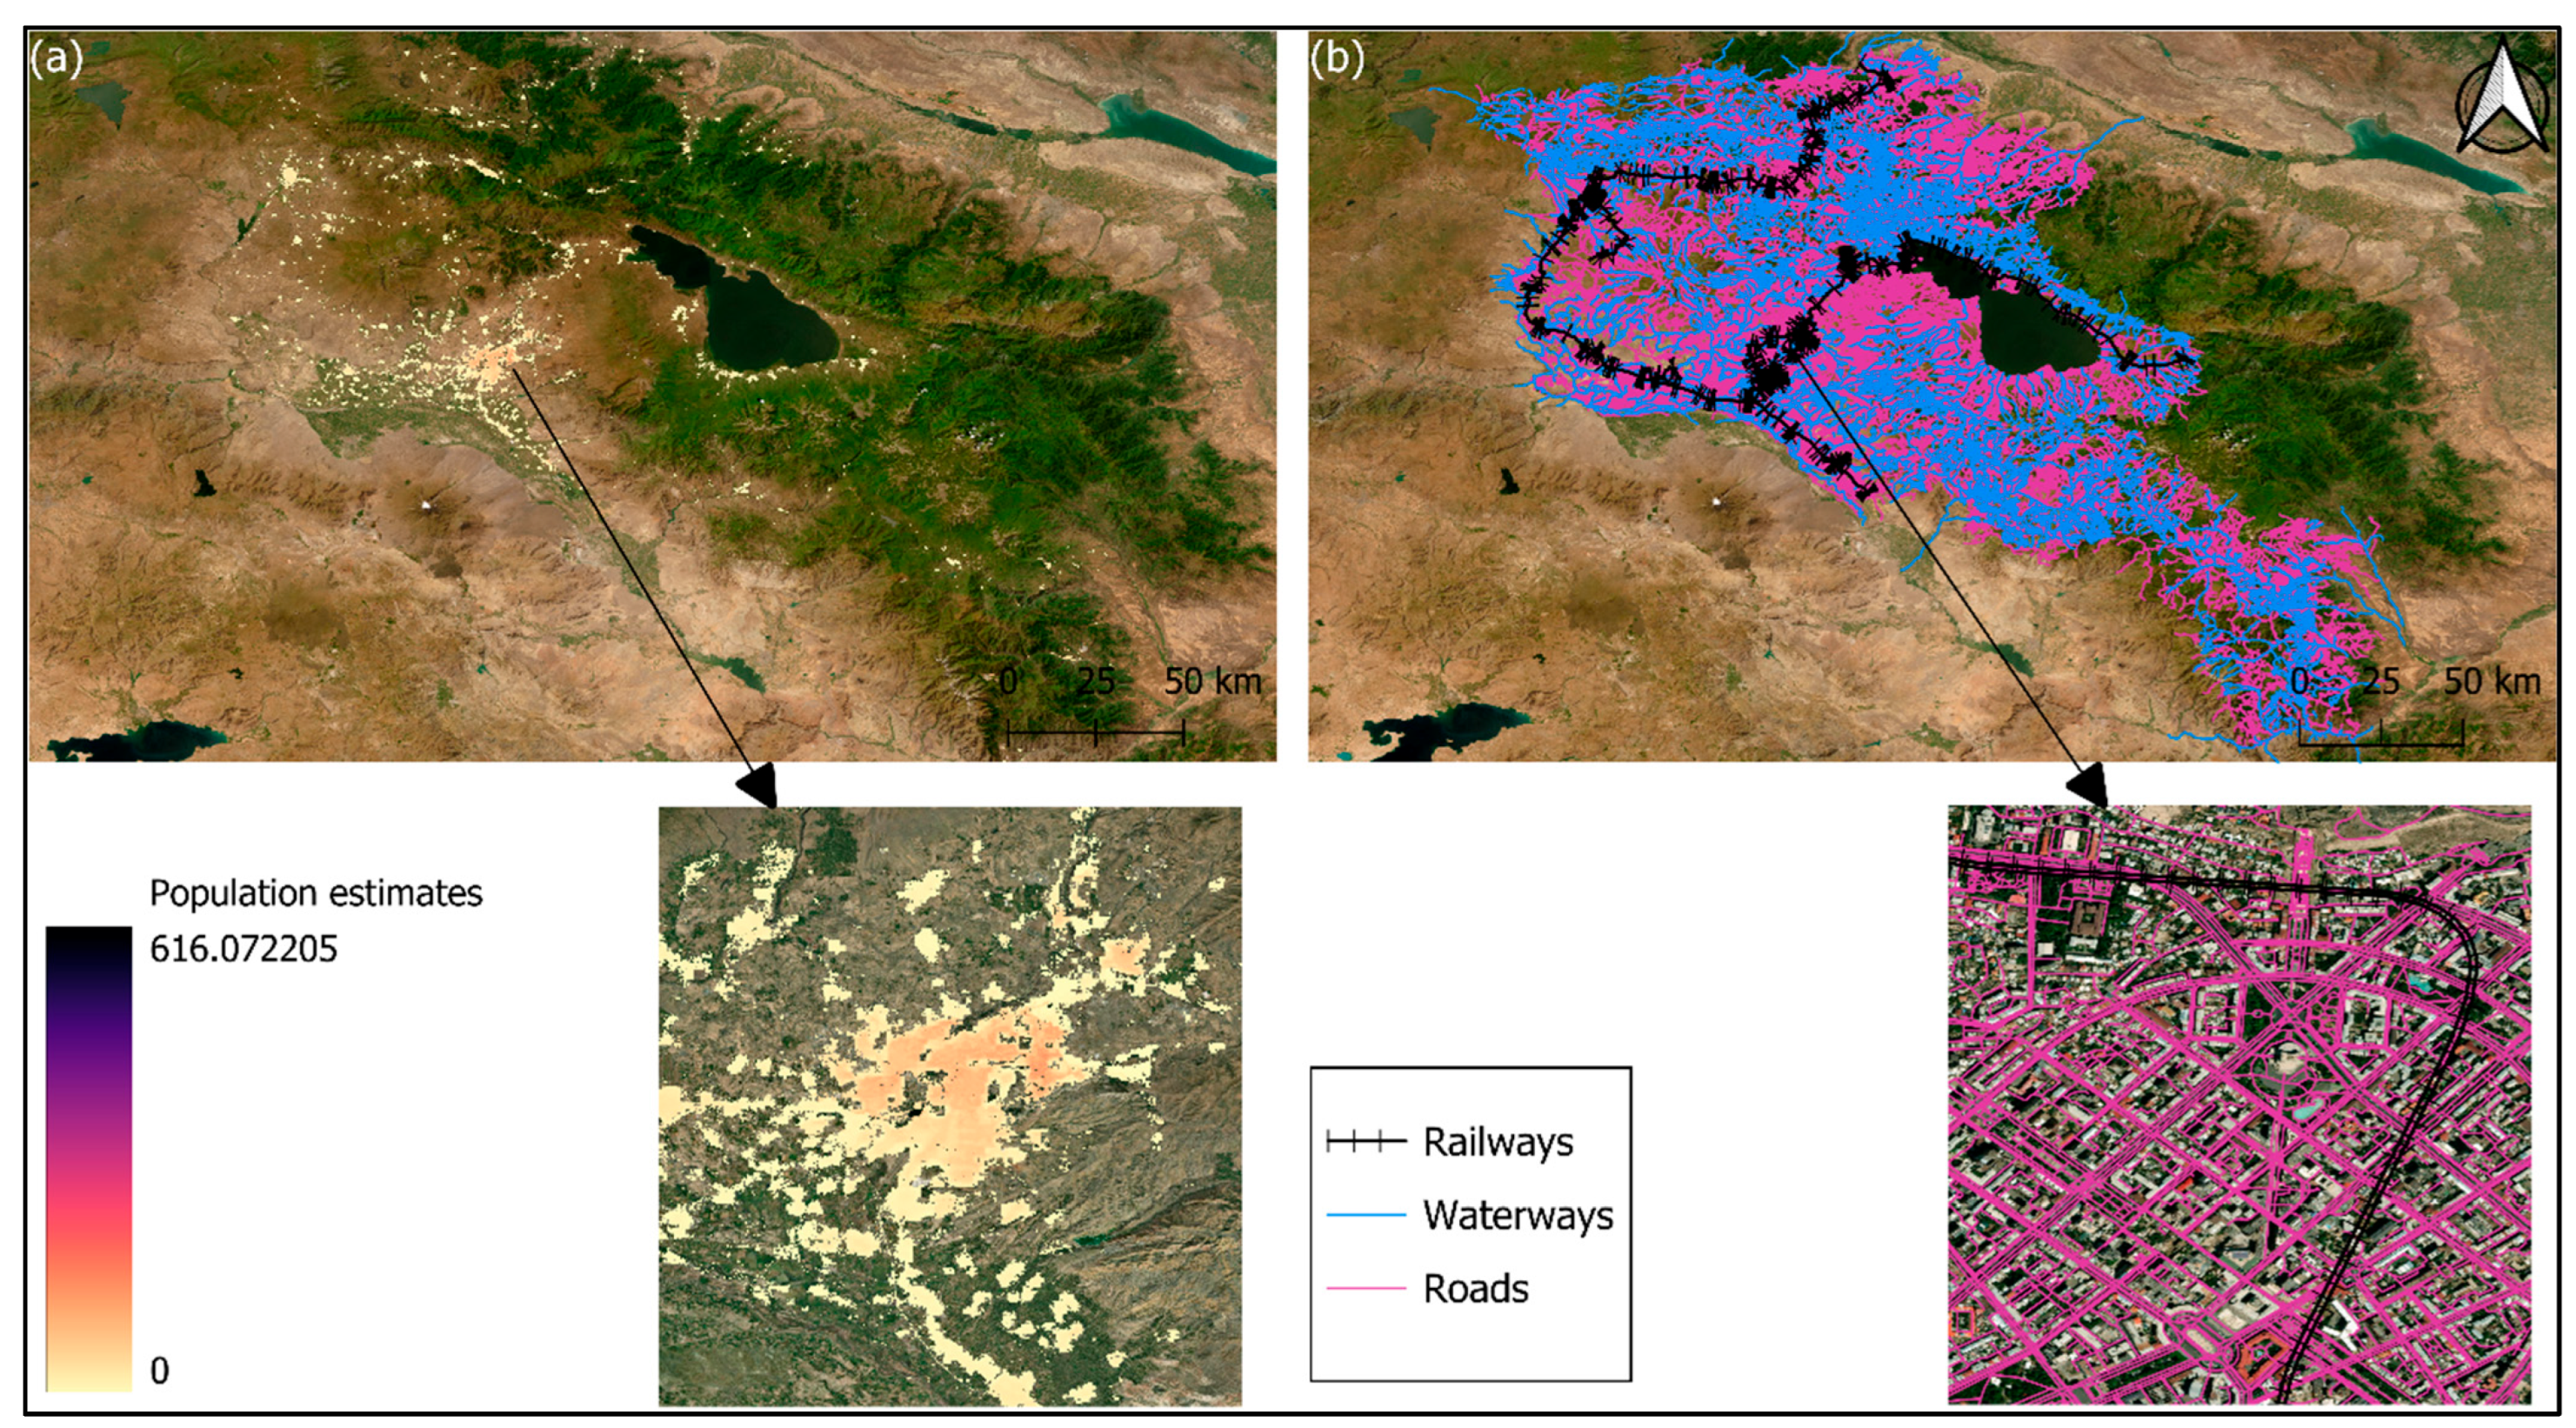
The gridded population data for Armenia was obtained from WorldPop [27] and is based on the 2020 population census or projection-based estimates for that year. This dataset provides an estimated total population per grid cell (shown in Figure 3a). The data is available at a resolution of 3 arcseconds (approximately 100 m at the equator) and can be downloaded in GeoTIFF format with the Geographic Coordinate System, WGS84 projection. The population estimate is represented in the units of one pixel. Regions marked with “NoData” indicate areas classified as unpopulated according to the Built-Settlement Growth Model (BSGM) developed by Nieves et al. [28]. The WorldPop gridded population dataset was generated by disaggregating projected subnational population totals into grid cells using machine learning techniques, incorporating various geospatial layers derived from satellite imagery [29].

3.1.2. Digitized Features Visible from the Ground

The boundaries of EAs should align with prominent visible ground features to facilitate effective ground-based data collection. To ensure that the pre-EA boundaries meet these criteria during the automatic creation of the national sample frame in Armenia, extensive digitized ground features are required. These features, both natural and human-made, are primarily sourced from OpenStreetMap (OSM) [30]. Figure 3b displays information from the OSM dataset, including road networks, waterways, and railways. This data offers modifiable and updatable inputs, allowing for multiple iterations of EA generation. The figure illustrates the input datasets, where the two datasets have not yet been combined. Subsequent figures demonstrate how these input datasets are used to divide the country, along with the estimated total population for each area.

3.1.3. Settlement Boundary and Classes

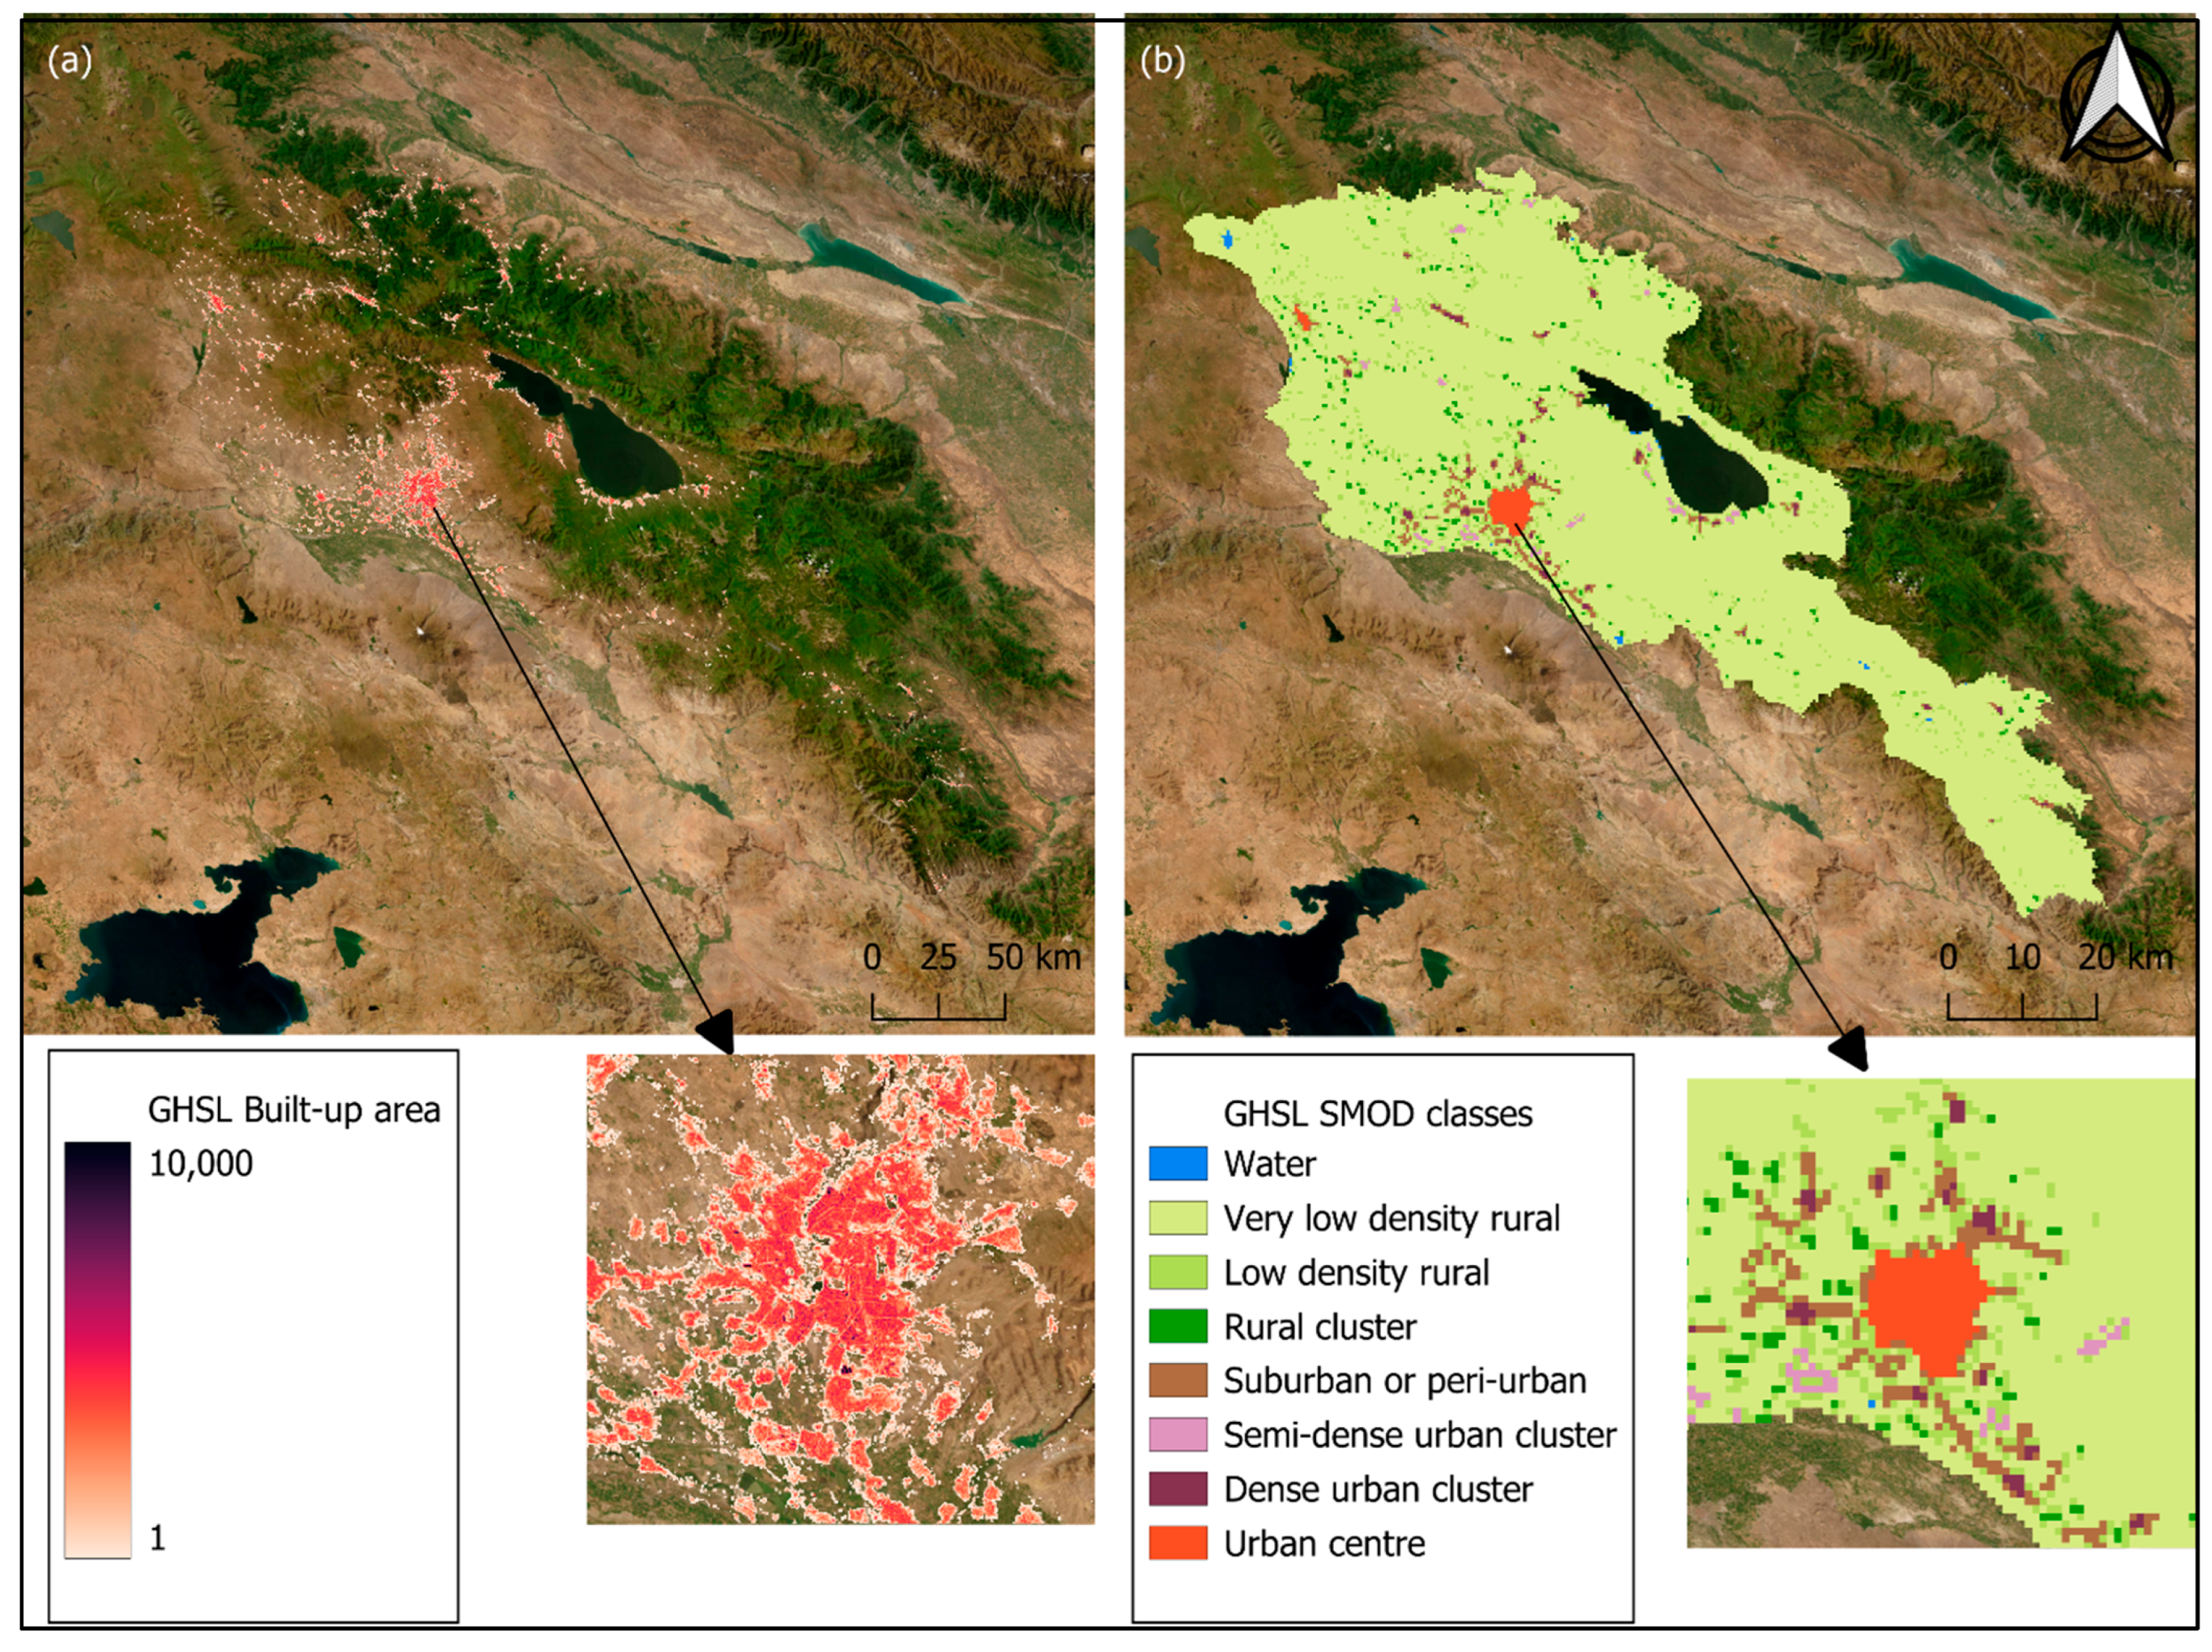
Determining the precise location and boundaries of each settlement is crucial for creating pre-EAs and guiding field operations. Accurate settlement boundaries help define settled areas and prevent the mixing of pre-EAs among large, populated areas. To achieve this, settlement boundaries were created, and settlements were classified into urban and rural categories. First, using the Global Human Settlement Layers (GHSL) product, settlements across the country were identified and converted into a vector layer to define the settlement boundaries. Subsequently, the settlements were classified into urban and rural categories with the assistance of GHSL classification. The GHSL provides a variety of settlement-related data in different spatial and temporal resolutions, along with multiple informative classes. The following two datasets from GHSL were used for settlement delineation and urban and rural classification.
GHS-BUILT-S R2023A: The spatial raster dataset, GHS-BUILT-S, illustrates the distribution of built-up (BU) surface estimates in five-year intervals from 1975 to 2030, along with two functional use components: the total BU surface and the non-residential (NRES) BU surface [31]. Figure 4a displays this data, which is generated by spatially and temporally interpolating five observed sets of multi-sensor and multi-platform satellite images, including those from Landsat and Sentinel 2.
GHS-SMOD R2023A: Settlements have been globally delineated and classified using the GHS Settlement Model layers (GHS-SMOD), which apply logic based on cell cluster population size, population density, and built-up area densities, as recommended by the United Nations Statistical Commission and defined in Stage I of the Degree of Urbanization [32]. The built-up surface, land layer, and a 1 km2 population spatial raster dataset serve as inputs for the GHSL SMOD. As shown in Figure 4b, the GHS SMOD classifies the 1 km2 grid cells into three spatial entities at the first hierarchical level: “urban centre,” “urban cluster,” and “rural grid cells” [31].

3.1.4. Administrative Boundary

It is essential to nest the produced EA boundaries within administrative borders. The generated EA boundaries should be contained within these administrative boundaries. The necessary administrative border data for Armenia, based on the 2011 census, was sourced from the HDX website [33].

3.2. Semi-Automatic Creation of pre-EAs

This section outlines the semi-automated process used to generate the first digital national sampling frame in Armenia. While the national sampling frame is primarily created through automation, some manual adjustments may be necessary to enhance the outputs due to issues with inadequate or poor-quality input datasets. The process is divided into three main parts, which are detailed in the following sections.

3.2.1. Urban and Rural Classification

People living in and around cities are referred to as the urban population, typically characterized by a high population density. In contrast, the rural population is spread over large areas of land, predominantly found in developing regions. The overall population and geographic area are key factors in determining the size of EAs. Achieving a balance between population and area constraints is essential to create EAs of manageable size. Due to the significant differences in population density and distribution between urban and rural administrative units, distinct criteria should be applied when forming EAs. Therefore, it is crucial to define urban and rural boundaries before creating pre-EAs, especially if the data is not readily available.
Armenia does not have well-defined boundaries to separate urban and rural areas. The following approaches have been used to establish the border between Armenia’s urban and rural classes as a first step in developing the national sampling frame:
  • Take the GHS-SMOD dataset and extract all urban classes; combine them into a single class.
  • Convert the raster dataset from the combined classes to polygon vector format. These polygons represent the urban area.
  • Extract the built-up area with values greater than 0 from the GHS-BUILT-S data.
  • Create polygons from the raster built-up area. The country’s settlement boundaries and extent are represented in this output.
  • Apply a 50 m buffer to output 4 to account for recent urban growth and prevent cutting structures at the edge of the settlements.
  • Intersect output 5 with the administrative boundary in Armenia.
  • Make the necessary manual and automatic adjustments when necessary. For example, an administrative boundary should be regarded as urban if more than 90% of areas are urban (e.g., Yerevan).
  • Any polygon in output 7 that crosses the output 2 boundary is an urban area. The rural class encompasses the remaining portion of the administrative boundaries.

3.2.2. Application of the pre-EA Tool

The “pre-EA” is a powerful and flexible tool developed by WorldPop in close collaboration with GeoData, with input from various governments, UN agencies, and global experts [2,11,17,18,19]. As its development is ongoing, the tool is not yet publicly available. It is designed as a user-friendly QGIS plugin, built using the Python 3.12.11 programming language. The implementation of the pre-EA tool is fully automated; however, certain preparatory processing steps are required before using the tool. These steps will be explained in the following sections.
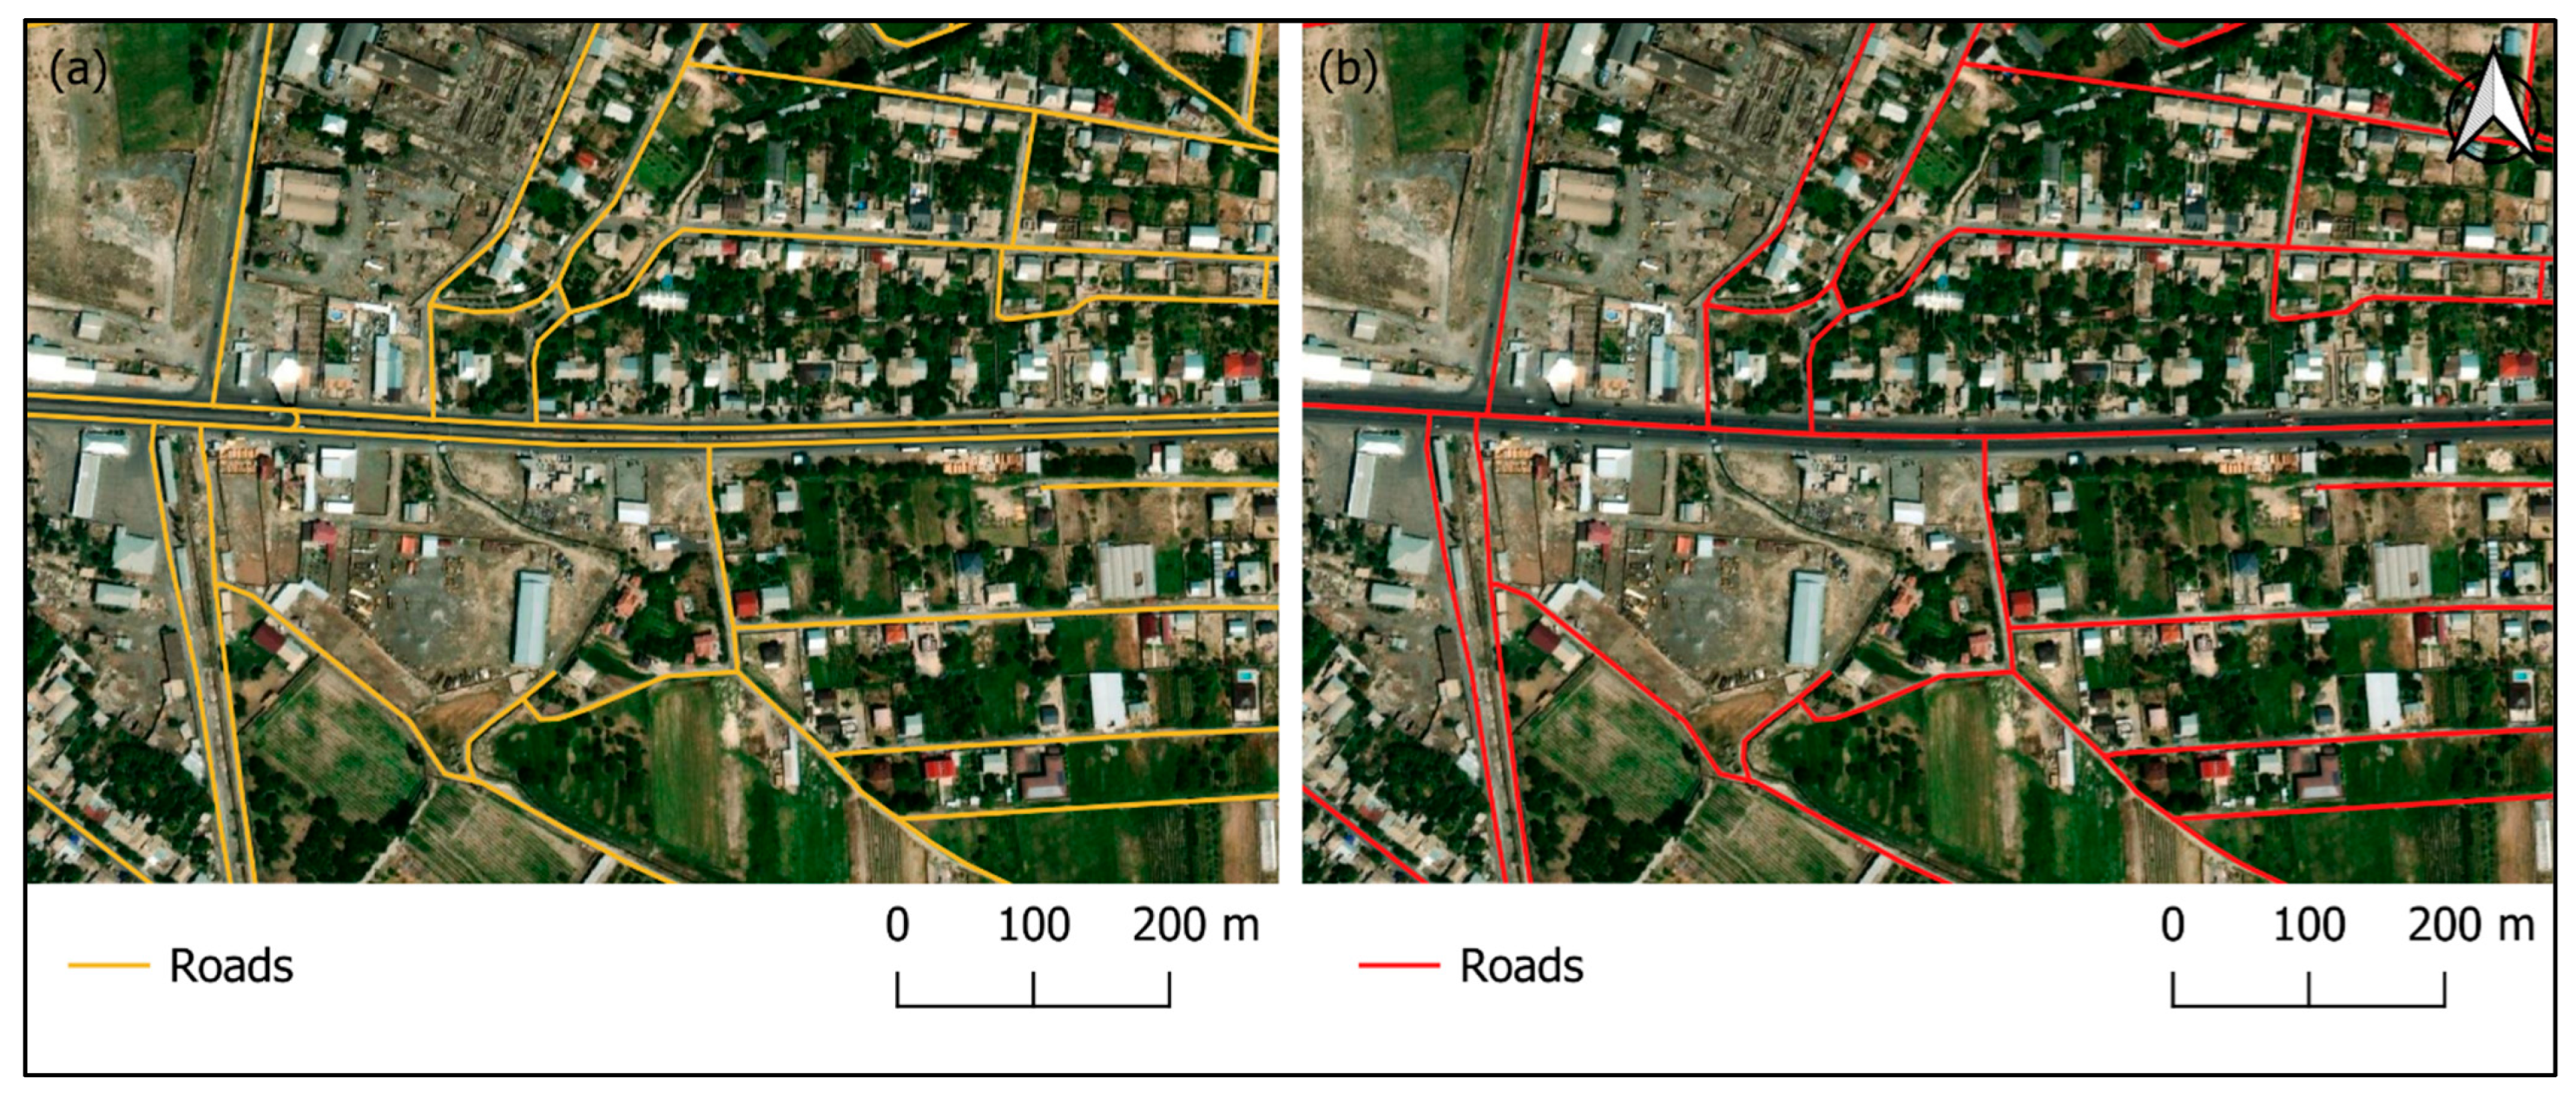
Input Data Preparation: The data preparation consists of three steps. First, the input boundary datasets are reprojected into the projected UTM WGS 1984 coordinate system. The pre-EA tool is compatible with such projection to ensure that the output units are in familiar area units such as meters or feet. Second, the digitized boundary (roads, waterways, and railways) is masked by the extent of the administrative boundary. Third, to prevent the creation of sliver polygons in the outputs, double lines (such as motorways) are merged in the road datasets. It was accomplished by utilizing a 25 m distance on Merge Divided Road in ArcGIS Pro. A single line will be created from any roads that fall within 25 m of each other and have the same road code or class (Figure 5). The entire process was automated using ArcGIS Pro 3.1.3 ModelBuilder.
Create Uncrossable Features: Enumerators should avoid crossing major obstacles during data collection to enhance efficiency and reduce costs. To achieve this, certain features were designated as uncrossable:
(1) Uncrossable lines: In the OSM line features, the class of the digitized features is recorded in the “fclass” column. After a thorough visual assessment, road classes such as primary, secondary, trunk, and tertiary, as well as waterway classes like rivers, were extracted, combined, and designated as uncrossable lines.
(2) Uncrossable settlement boundary: It is preferable to keep EAs from different cities, towns, or villages separate to prevent the mixing of household and administrative hierarchies. To achieve this, three procedures were employed to establish uncrossable settlement boundaries. First, the Zonal Statistical technique was used to summarize the total population within each settlement polygon created in Section 3.2.1. Second, a visual inspection approach was applied to identify the minimum population threshold for defining the uncrossable settlement boundaries. As a result, all settlement boundaries with a population exceeding 200 were designated as uncrossable. Third, the polygons containing more than 200 people were converted into lines and merged with additional uncrossable lines to generate the final set of uncrossable features.
Implementing the pre-EA Tool: In the first part of the process, the pre-EA tool divides the region into small geographic units by polygonising all the input feature datasets. The user must define hard constraints, including the maximum and minimum population size and geographic area. In addition to these hard constraints, it is essential to input administrative boundaries and uncrossable features that the pre-EA boundaries must adhere to. The user should also define soft constraints, such as the minimum length of shared boundaries and various weighting coefficients, to ensure that the generated pre-EAs meet both user expectations and global standards (Table 4).
Regarding the selection of population size and geographic areas, there is not universally accepted regional or global standard across countries. Moreover, official guidance on specific thresholds is limited. Some studies and official reports have referenced the total number of households within census enumeration areas (EAs) or sampling units, typically ranging from approximately 100 to 300 households [34,35]. However, no consensus exists on a standard threshold for geographic areas. The existing guidelines generally emphasize factors such as compactness, alignment with visible ground features, and balanced population distribution between urban and rural areas, recognizing that rural populations are often sparsely distributed.
In this study, the thresholds were determined through consultations with World Bank sampling experts and consideration of local geographic and terrain challenges in certain regions of Armenia. The quality of available population datasets and potential non-response rates were also considered. These thresholds were additionally selected to ensure that the sampling frame could remain applicable for future censuses, should ArmStat choose to adopt it. Accordingly, the geographic area and population size for this survey were defined, and optimal parameters for other criteria were informed by prior applications of the tool in other countries [18,19].
Once all the parameters are established, the small geographic units are merged until one of the hard constraints is satisfied. The output is in vector format, and each generated pre-EA includes necessary attribute information, such as the administrative boundary, total estimated population, area, and unique IDs (random IDs and ID numbers generated using the serpentine technique). Table 4 presents the parameter calibration used in the pre-EA tool. The user can adjust priority parameters during the merging process. For example, when the population weight is increased, the total population of the created pre-EAs will be more homogeneous and closer to the maximum population threshold. Conversely, increasing the shape factor coefficient will result in more compact shapes.
Post-Processing: The quality of the input datasets primarily determines the quality of the outputs generated by the pre-EA tool. Due to limitations in the input datasets and the imposition of various constraints within the tool, some of the generated pre-EA outputs require assessment and modification. This is the main reason the outputs are referred to as “pre-EAs” rather than final EAs. For example, pre-EAs with negligible populations or geographic areas were automatically merged with neighbouring units using the “Eliminate Small Area” tool in the pre-EA package. Manual modifications were applied to pre-EAs covering large geographic areas with high populations.

3.3. Further Manual Adjustments

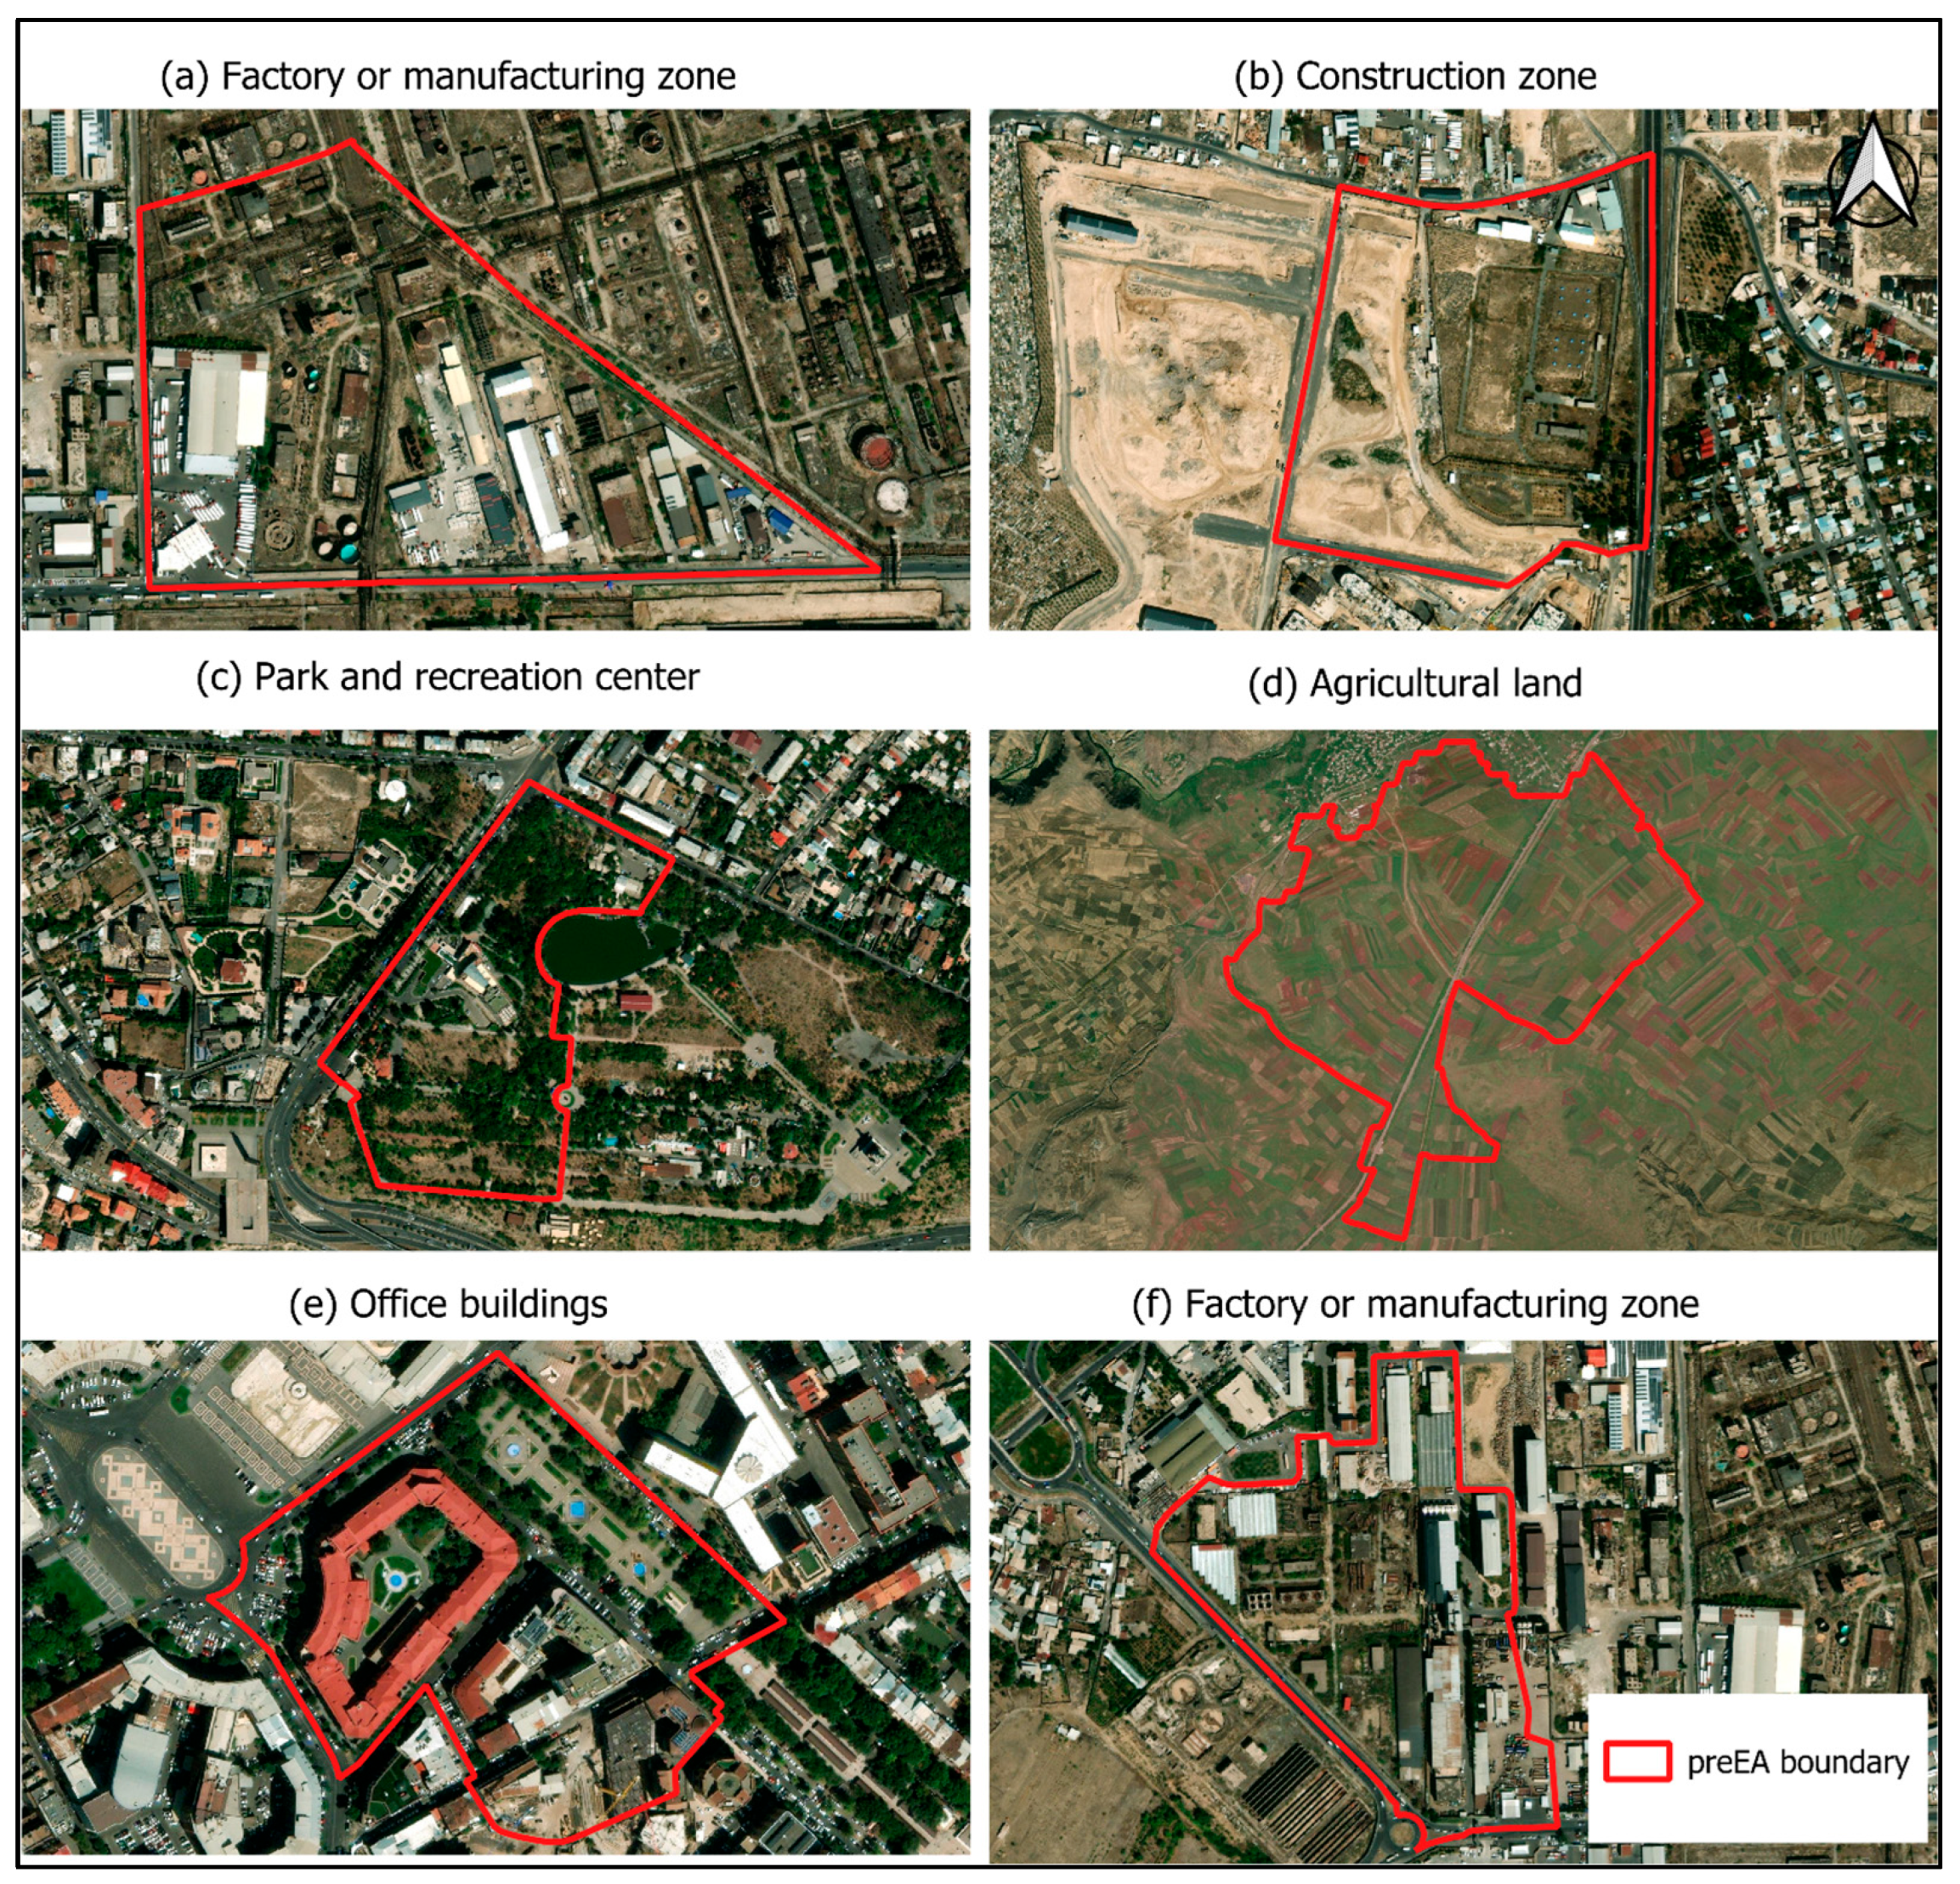
The national sampling frame created using the automatic approach requires additional modifications for several reasons. First, adjustments are necessary in areas where the existing datasets were insufficient to create smaller EAs. Second, the output contains some polygons with nonzero population estimates but no actual settlements (i.e., the pre-EA population is assigned based on gridded data, but visual inspection shows no inhabited areas). These cases reflect limitations of the underlying gridded population and settlement data, not the pre-EA tool itself. Pre-EAs with nonzero population estimates that fall within non-residential areas—such as offices, buildings under construction, recreational centers, factories, manufacturing zones, and agricultural lands—are manually adjusted to zero.

3.4. Field Support and Guidance

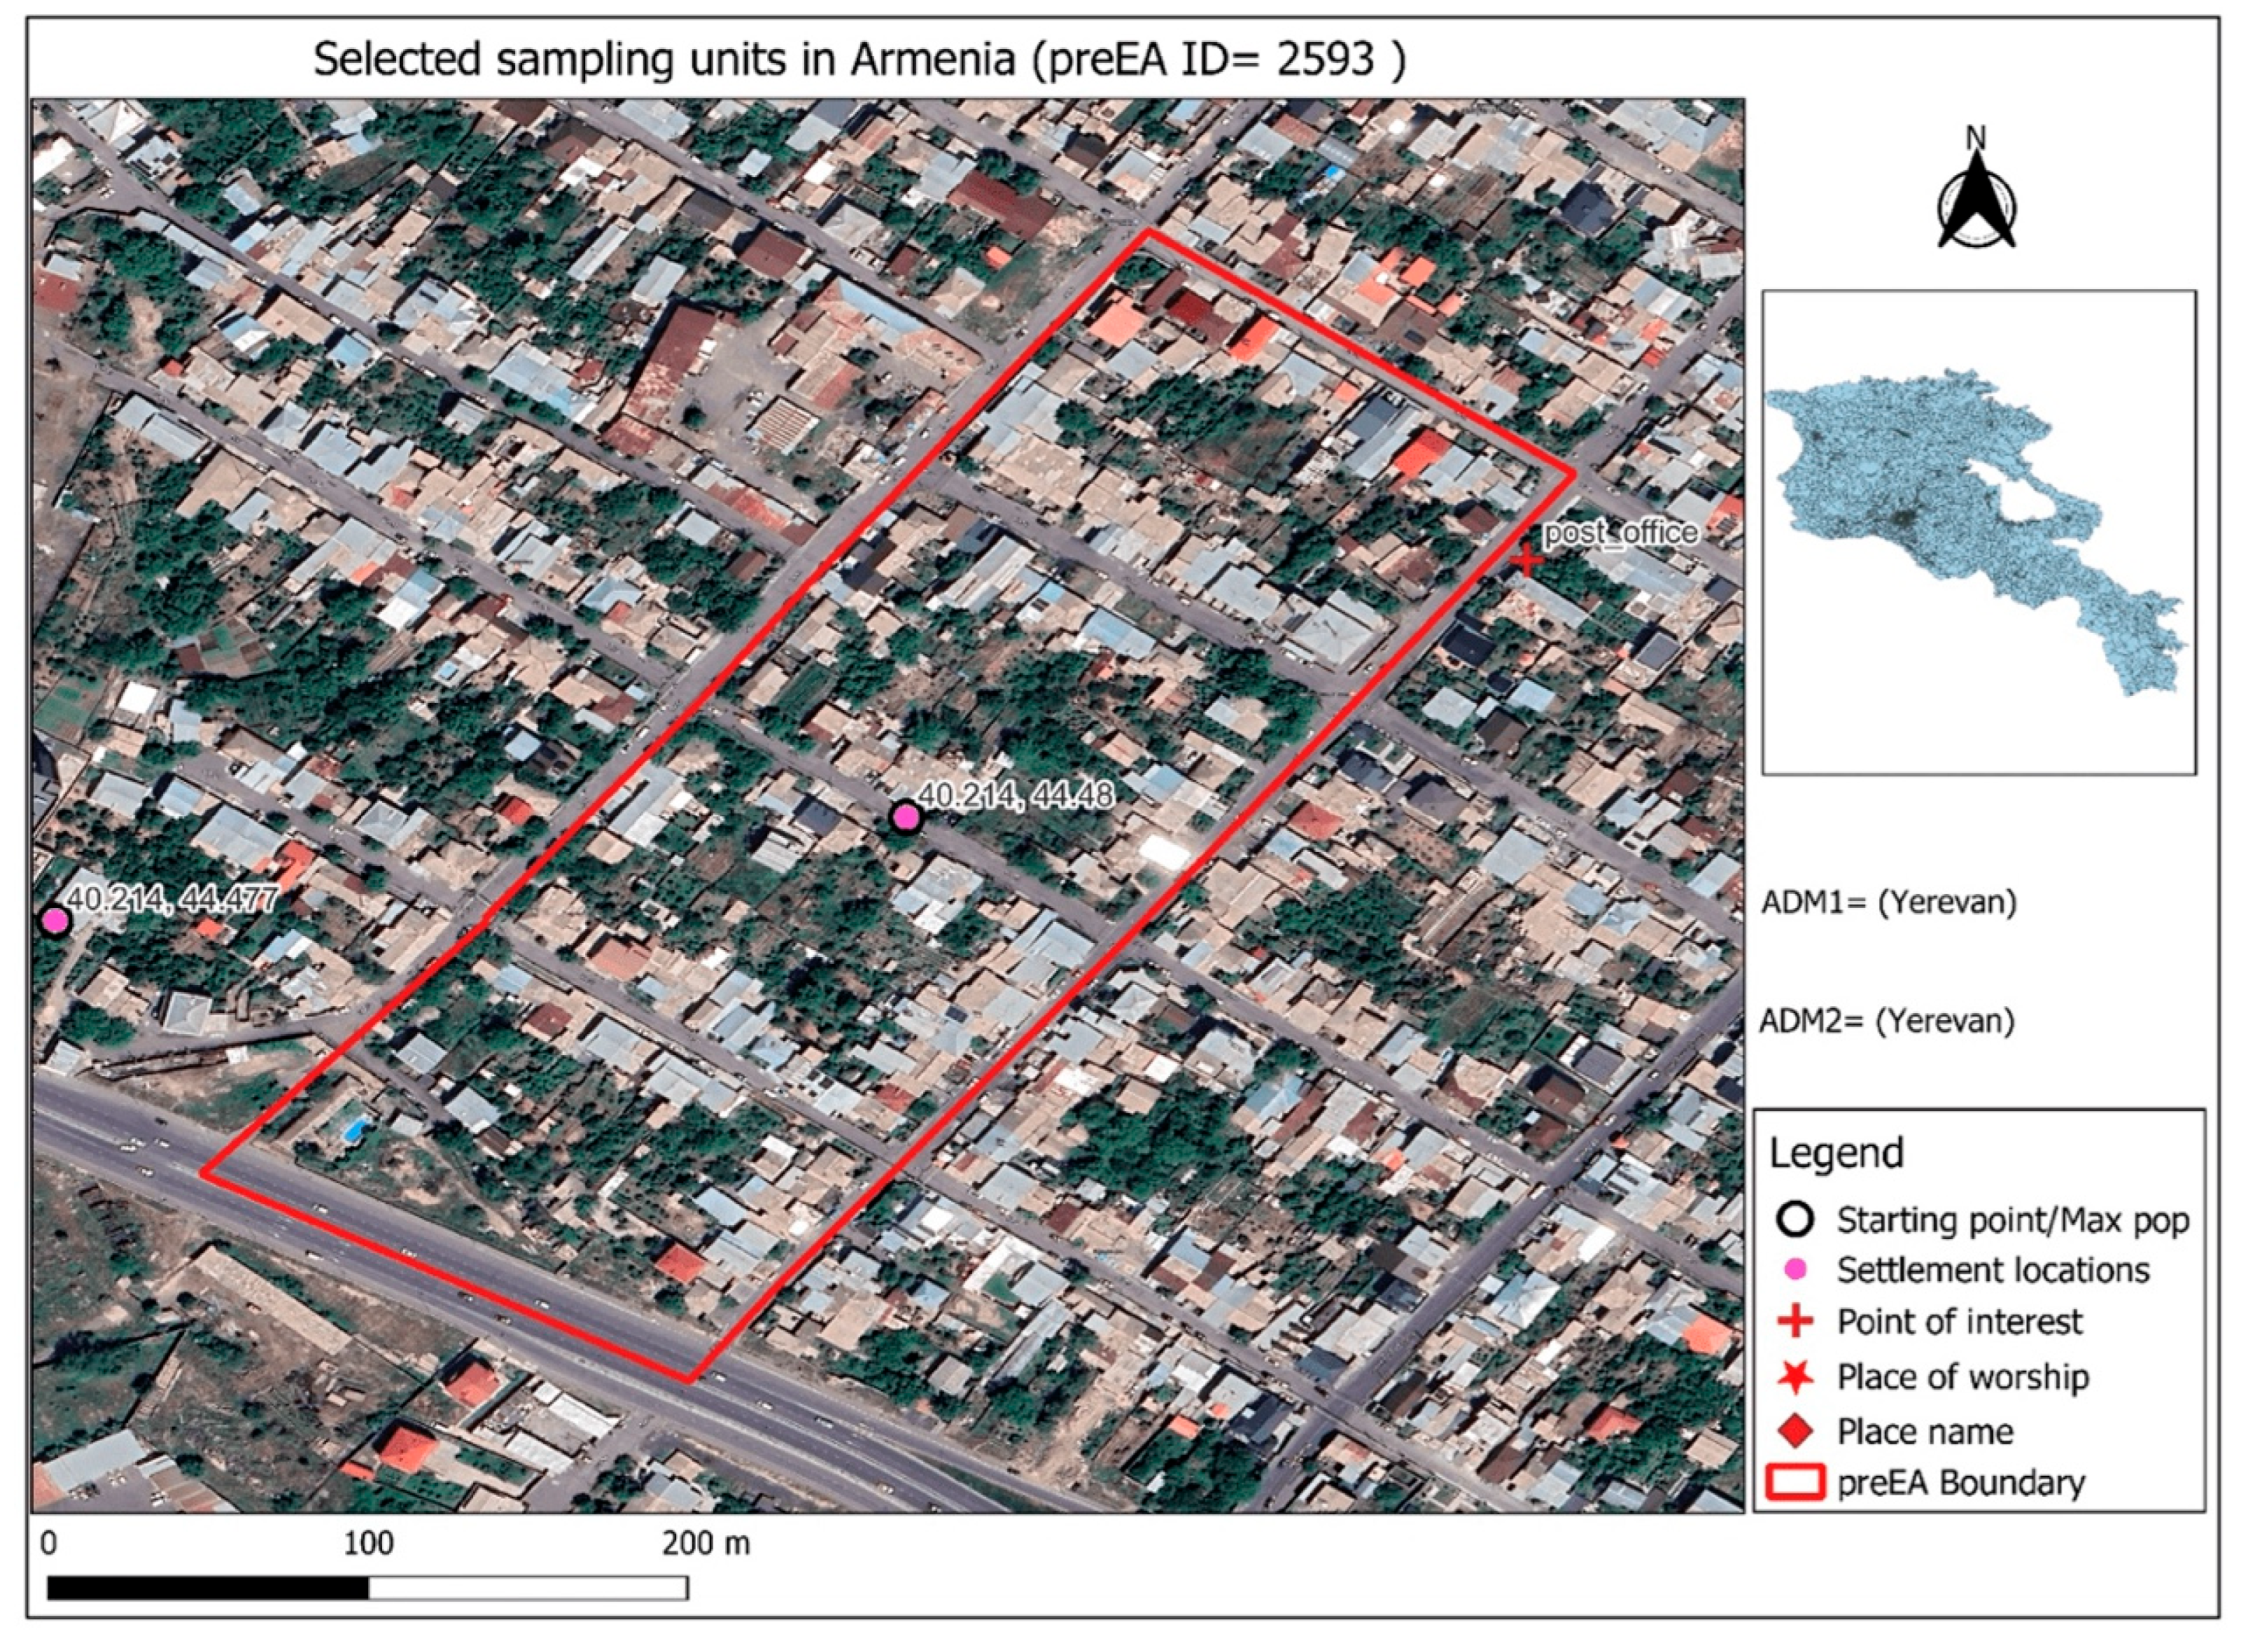
This work also developed detailed automatic field maps and offline maps to support ground data collection and provide guidance. Several informative geospatial layers and techniques were employed in the process. For further details, please refer to Appendix B.

4. Results

4.1. Empirical Foundation of the Urban–Rural Stratification

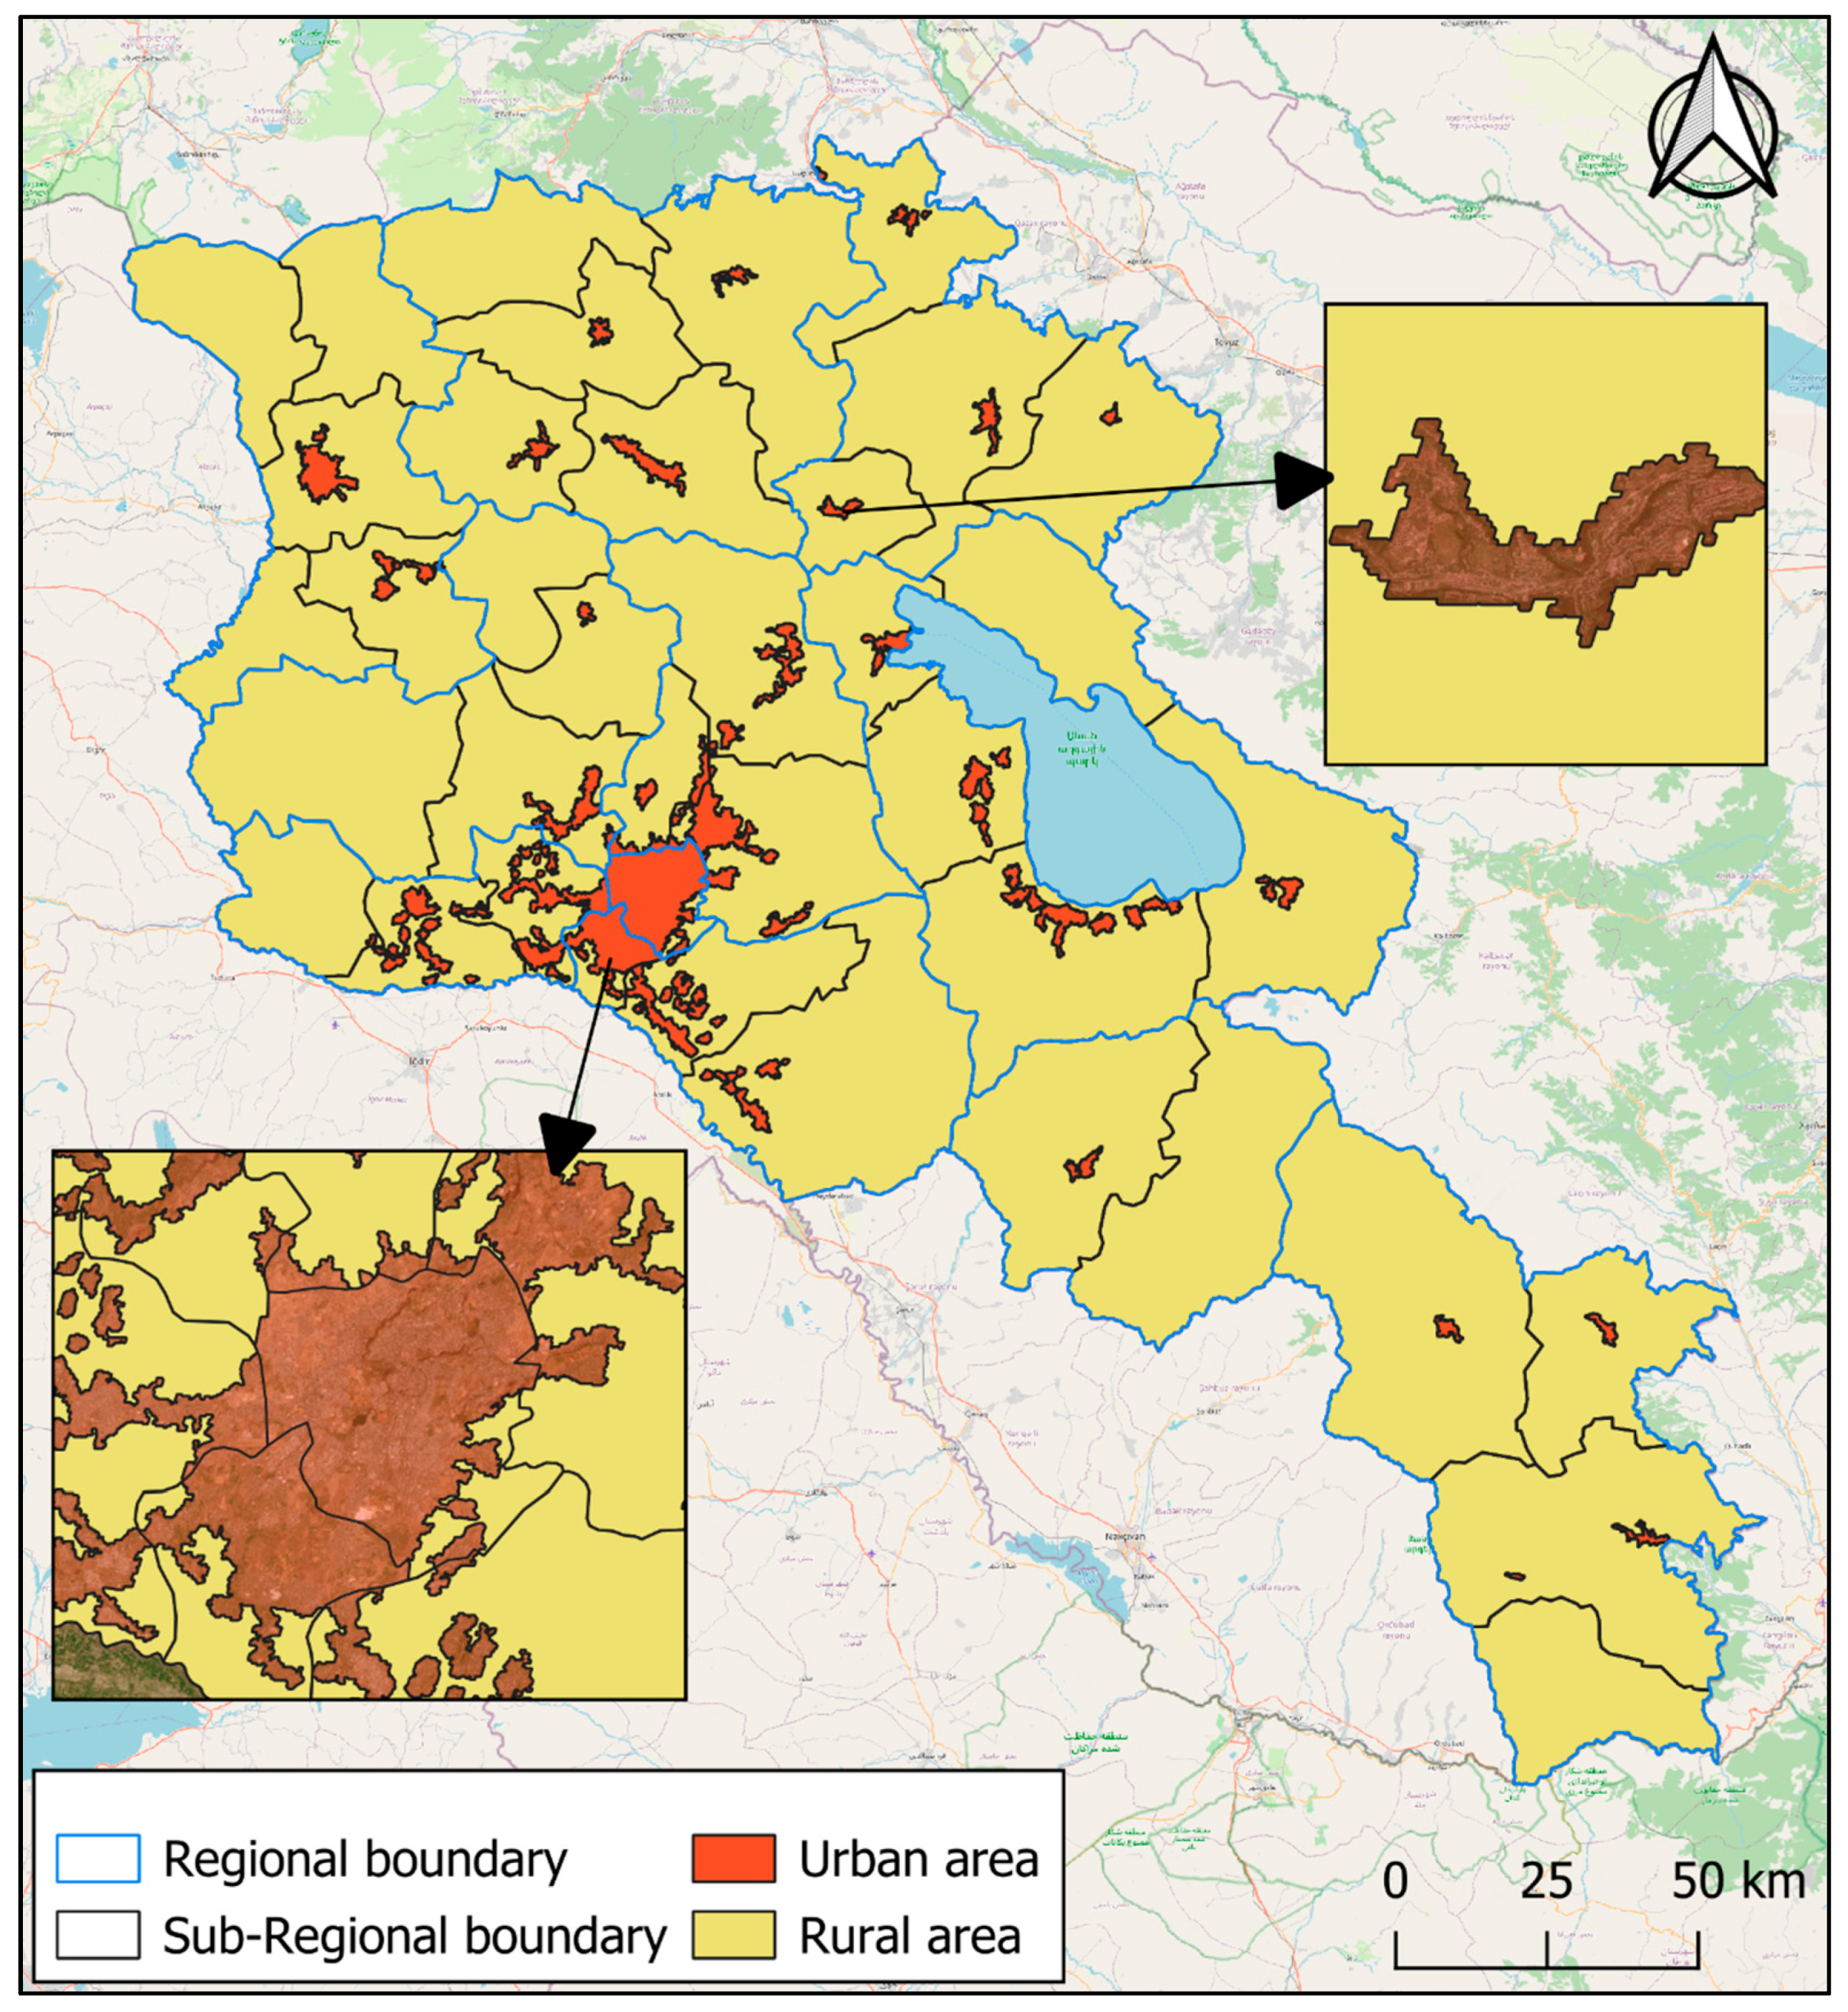
This study introduces Armenia’s first accessible and operational digitized urban and rural boundaries (Figure 6), establishing the empirical basis for urban–rural stratification. By overlaying these boundaries with the 2020 WorldPop gridded population dataset, we estimate that urban areas account for approximately 20% of the national land area, while rural areas comprise the remaining 80%. Despite their smaller territorial extent, urban areas accommodate more than 60% of Armenia’s population, with less than 40% residing in rural areas. This spatial imbalance highlights the concentration of population within a limited share of land and provides the foundational descriptive evidence for subsequent analyses.
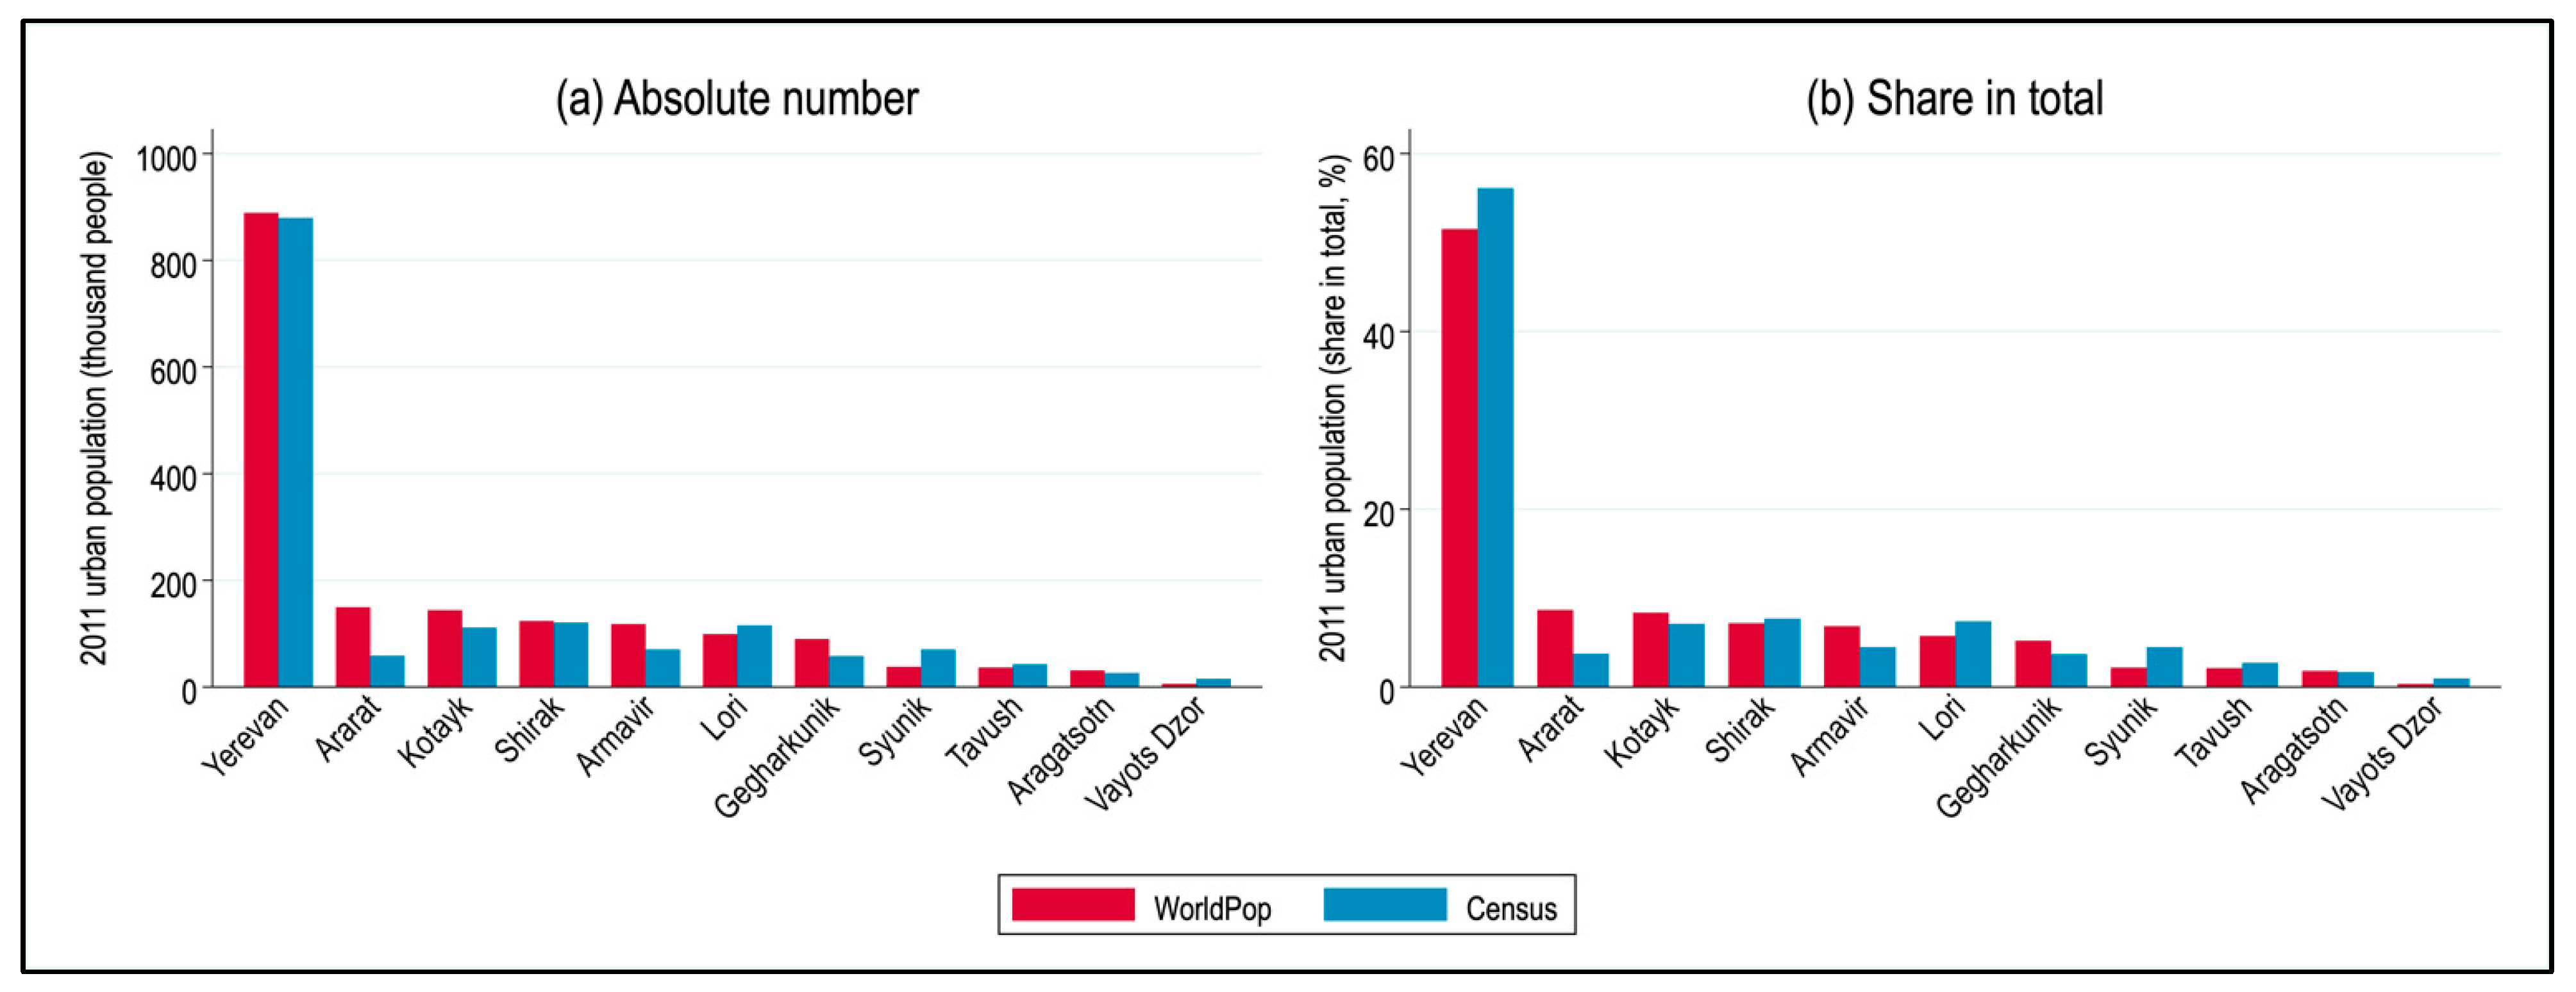
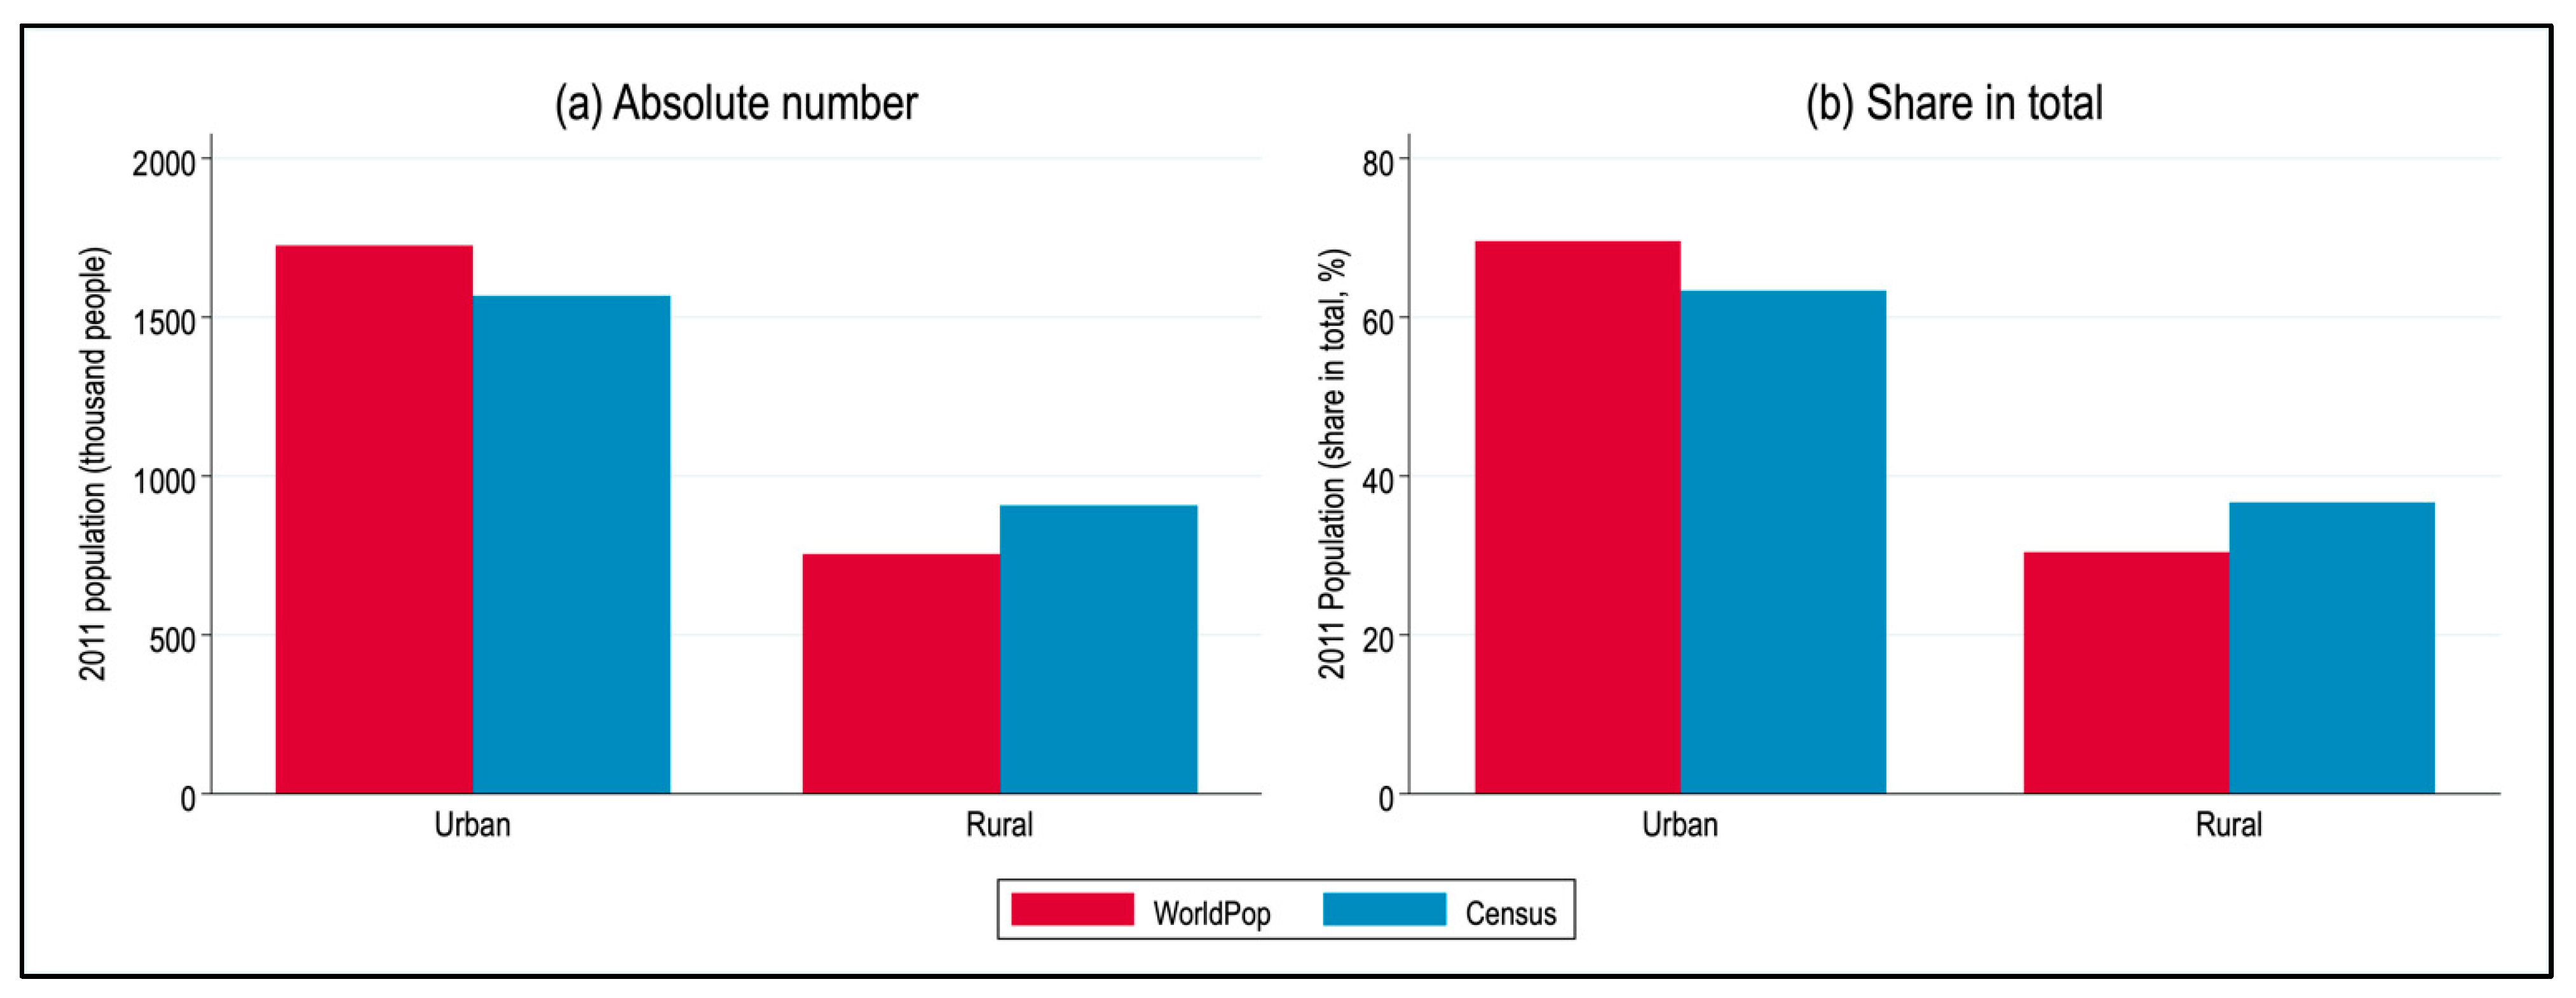
To evaluate the empirical reliability of both the aggregated population estimates and the derived urban–rural classification, we validate our results against official census data. Grid-level population estimates from WorldPop can be aggregated to any spatial unit, including the urban and rural boundaries constructed in this study, thereby enabling direct comparison with the 2011 Census published by the Statistical Committee of the Republic of Armenia (ArmStat). While the 2011 Census reports population counts primarily at the marz and settlement-type levels and does not provide digitized urban and rural boundary files, this limitation does not preclude meaningful comparison. Aggregate-level assessments reveal a very high degree of consistency between the two data sources. The correlation coefficient between WorldPop-based and census population counts is 0.99 (SE = 0.05, p < 0.001) at the marz level and 1.00 at the urban–rural level. Figure 7 compares urban population at the marz level, and Figure 8 presents total population comparisons across urban and rural categories. These comparisons are intended to assess the internal consistency of the population inputs used to construct the sampling frame, rather than to validate the underlying population models. These findings indicate that the derived urban–rural classification closely approximates official population counts at aggregated levels. The strong correspondence further supports the validity of the automatically generated boundaries, reinforcing the robustness of the classification framework as an empirical foundation for urban–rural stratification analysis.

4.2. Construction and Properties of the Generated Digitized National Sampling Frame

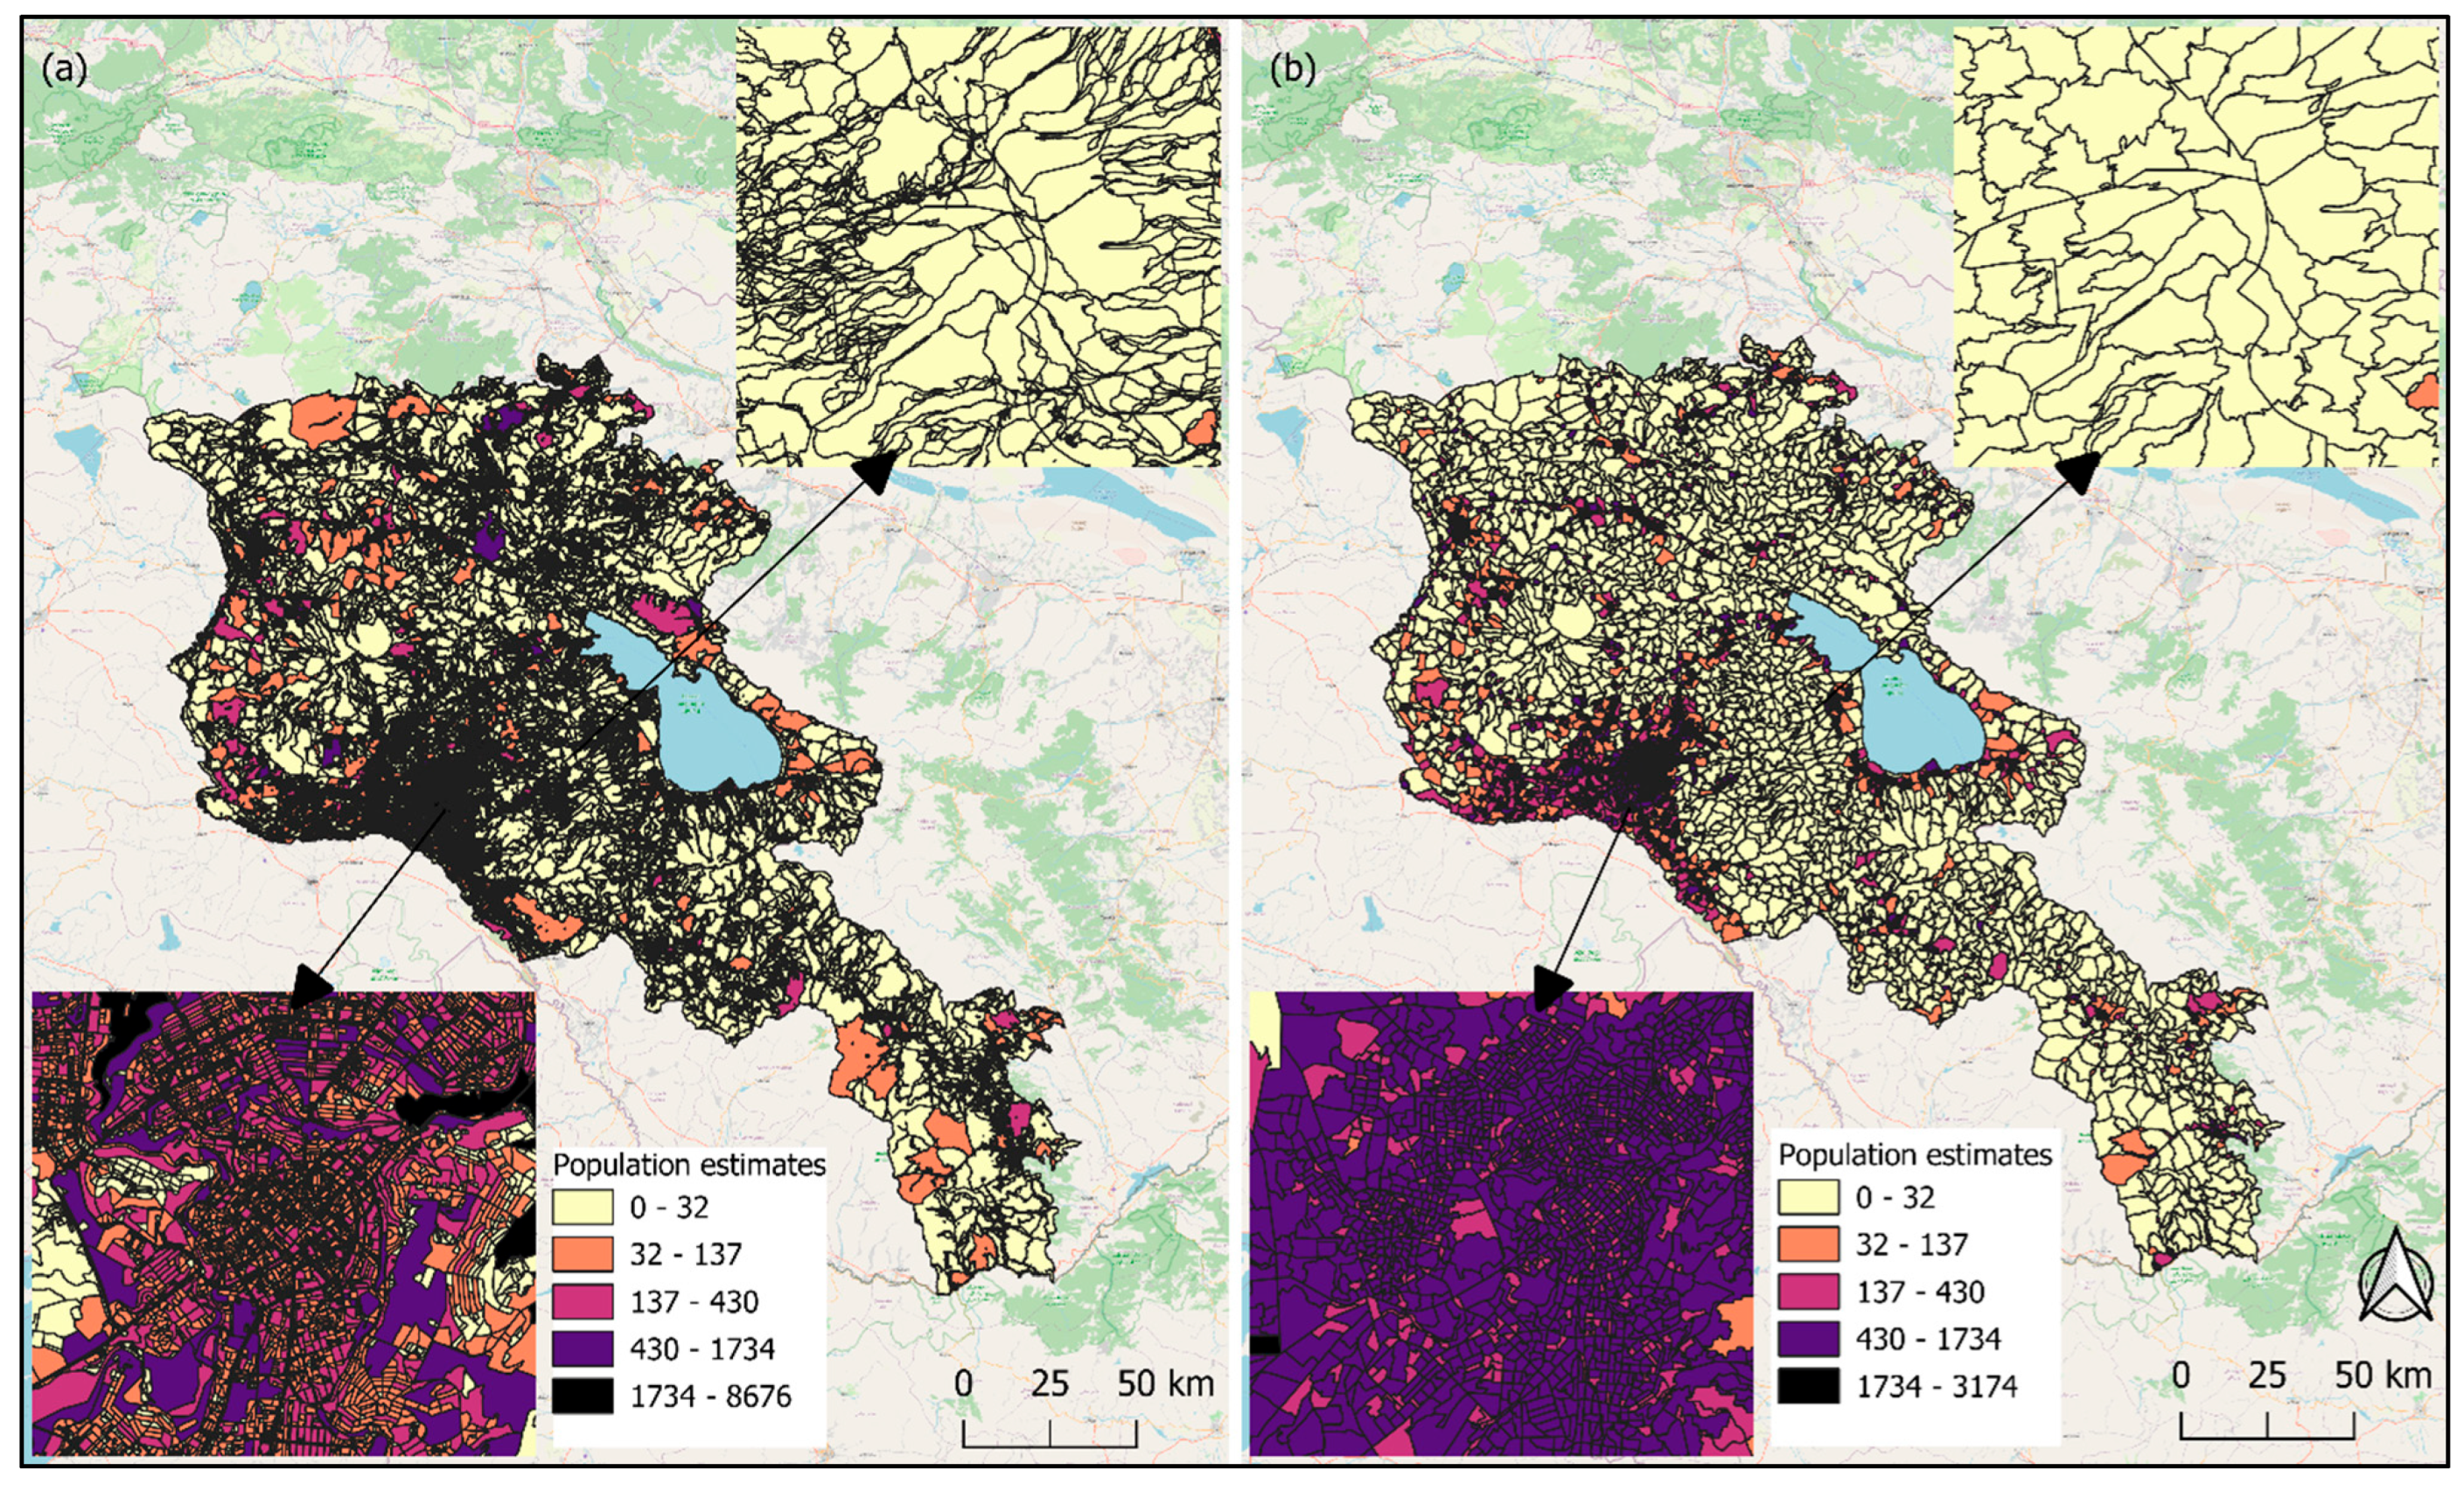
Figure 9 illustrates the pre-EAs (pre-EAs) generated in this study using the method outlined in Section 3. The map demonstrates that the pre-EAs cover the entire territory of Armenia, with boundaries drawn accurately, free from geometric errors. In the initial stage of automatic pre-EA production, the pre-EA tool generated 130,378 building blocks (Figure 9a). Following the merging process, 7413 pre-EAs were delineated across Armenia, with 3813 in urban areas and 3600 in rural areas (Figure 9b). After manual adjustments, approximately 60% of the pre-EAs (4354) have a population greater than zero, most of which fall within the estimated range of 100 to 1000 people. The remaining 3059 pre-EAs are classified as unsettled, meaning their population is zero, as explained in Section 3.
While the map encompasses the entire country, about 41% of the area depicted would not be considered in the sampling designs, as the probability of selection for empty pre-EAs is zero. Nonetheless, all individuals are accounted for in the population estimates.
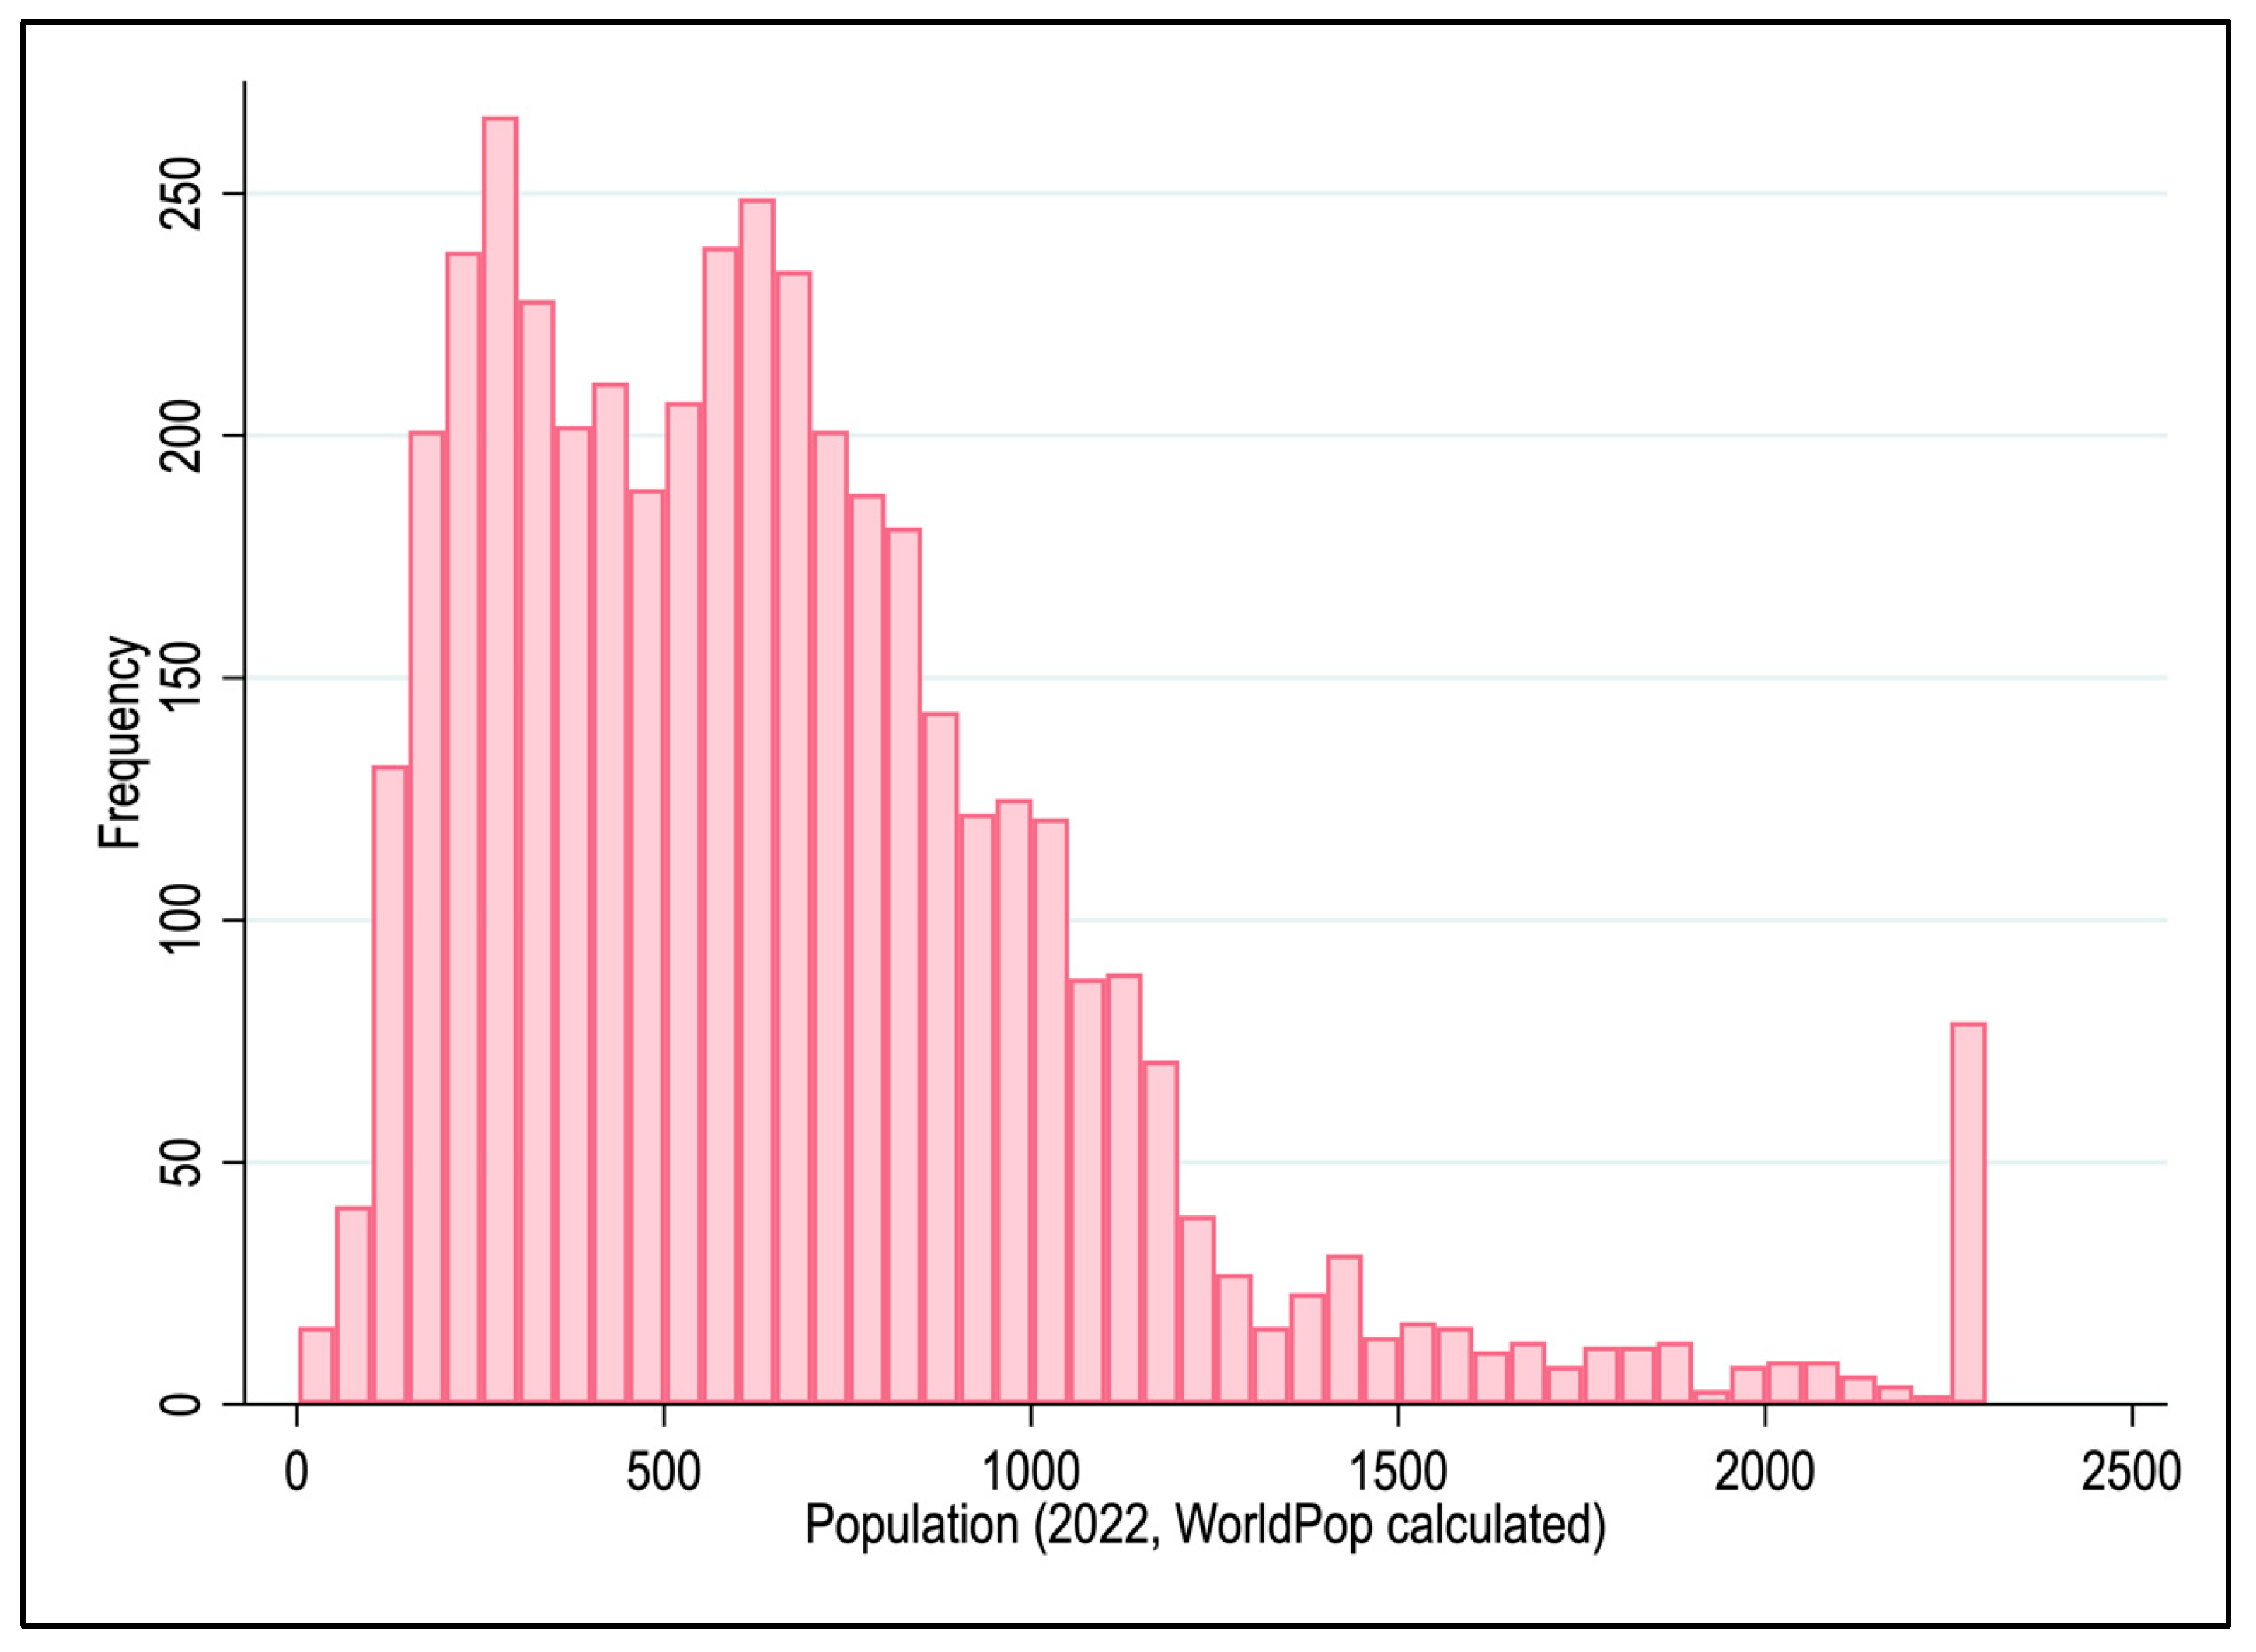
Next, the sampling unit size is characterized by assessing the sampling frame and analyzing the population distribution across pre-EAs, with particular emphasis on those pre-EAs with a nonzero population estimate. Figure 10 displays the distribution of the 2022 population estimate across the pre-EAs in Armenia, which has been estimated based on two datasets. The 2020 population data is first sourced from WorldPop, which was projected based on the 2011 Census [27]. This population at the pre-EA level has then been re-scaled to match the 2020 population data from the ArmStat at the strata level that we described in Section 2. Then the pre-EA-level rescaled 2020 population data has been further projected to 2022 using strata-level population growth calculated from the ArmStat’s population data over time.
The population distribution across pre-EAs is fairly normal: 90% of the pre-EAs have a population below 1156, while the remaining 10% have populations ranging from 1156 to 2274. These values were winsorized in the 1st and 99th percentiles to minimize the impact of potential outliers. The population of the pre-EA is not winsorized in the sample frame, and it is our suggestion to adjust those extreme values as the population might have been overestimated in those areas. Users of this sampling frame can make their own judgments regarding these values. Despite the presence of some outliers at the upper end of the distribution, the population across pre-EAs is generally more evenly distributed than the adult population across electoral precincts, which display U-shaped patterns, as shown in Figure 1.
Figure 11 presents examples of pre-EAs with non-zero population estimates located within non-residential areas. As these pre-EAs do not contain residents (based on visual comparison on high resolution base map), their population estimates are adjusted by setting them to zero. Prior to this adjustment, 1601 pre-EAs already had a population of zero, and the population of 1458 additional pre-EAs with non-zero populations before the adjustment was revised to zero. The majority of these non-zero pre-EAs have very small population counts, which result from partial overlaps between the edges of the population raster cells and the boundaries of the pre-EA polygons. To identify these cases, we screened the satellite imagery of all 5812 pre-EAs with non-zero population before the adjustment. The average time spent checking a single pre-EA was about a minute, and thus it took about 97 h or about twelve working days for a specialist to complete the process. As mentioned in Section 3.3, uninhabited terrains such as farmlands, non-residential structures with roofs such as factories and offices, and other areas such as recreational centers, basketball courts, and soccer fields are misclassified as residential settlements with population estimates. The main objective of this population adjustment is to improve the accuracy of the sampling frame, not to achieve absolute perfection. Therefore, the decision to label these pre-EAs as empty or non-residential is primarily based on straightforward judgments, minimizing the role of subjective judgments. Furthermore, we conducted secondary screening to ensure the reliability of the initial screening. The adjustment process thus results in a total of 3059 pre-EAs being classified as unsettled areas. Following the adjustment, the population estimates for the remaining pre-EAs with nonzero population estimates were further refined by applying a strata-level factor to align them with the strata-level population counts.
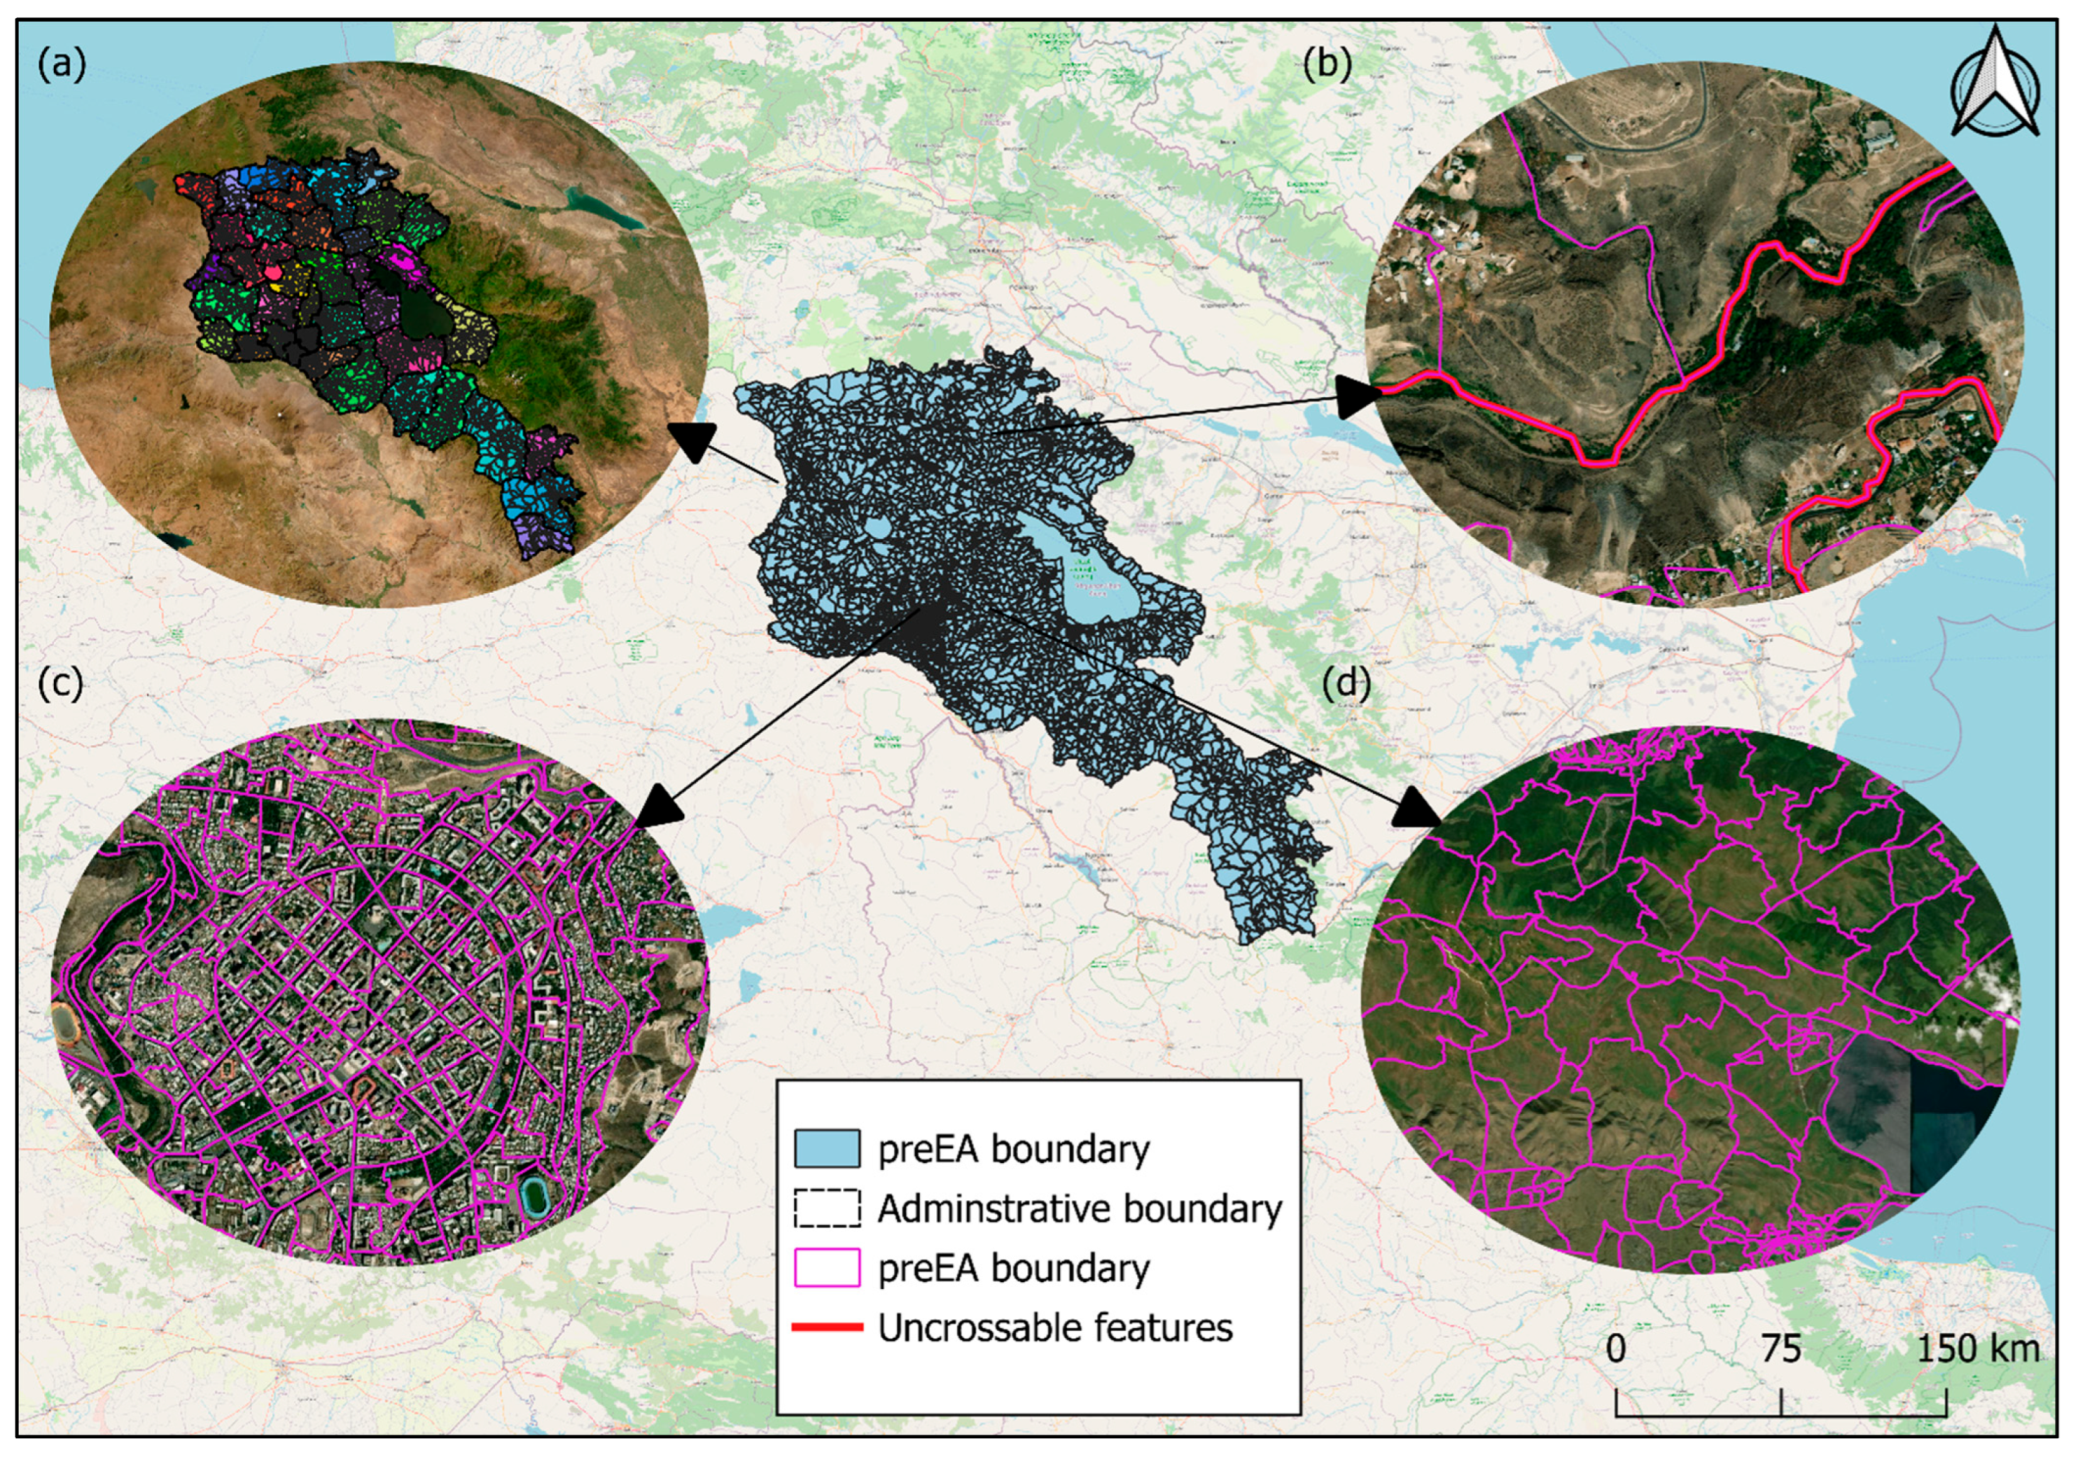
Further to investigate the properties of the generated sampling frame, the output was compared against standard international criteria. Accordingly, several international guidelines must be followed when developing pre-EA boundaries, as illustrated in Figure 12. Pre-EA boundaries must be nested within the designated administrative boundaries (Figure 12a). Natural and physical barriers, such as rivers and major roads that are considered uncrossable, must also be respected when delineating pre-EA outlines (Figure 12b). In addition, pre-EA boundaries should align with visible ground features, including roads and infrastructure. Figure 12c presents examples of pre-EA boundaries in urban areas, while Figure 12d illustrates pre-EA boundaries in rural areas. These figures demonstrate the extent to which the pre-EA outlines generated correspond to discernible ground features, highlighting their ability to accurately reflect the physical landscape.
Building on these design principles, the generated digital national sampling frame outperformed the existing sampling frames in Armenia in several important respects. First, the proposed frame is fully digital and provides complete coverage of the entire country, whereas previously available frames were either inaccessible, incomplete, or not available in digital form. Second, the new frame accounts for the entire population, while earlier frames may have excluded certain age groups or relied on severely outdated population data. Furthermore, the sampling units generated in this study are aligned with international standards, are manageable in size, and are hierarchically nested within administrative boundaries, which enhances their suitability for systematic sampling and survey implementation. In addition, both the geographic size of the units and their population counts are appropriate for ground-based data collection. In contrast, the existing sampling frames lacked many of these key properties, as highlighted in the Introduction.

4.2.1. The First Application: Listening to Armenia

After generating the digital national sampling frame for Armenia, the frame was adopted for the World Bank Group’s “Listening to Armenia” survey (L2Arm). Its application in the L2Arm survey proved highly effective, enabling the selection of a nationally representative sample that captured urban–rural distinctions across all regions of Armenia. The innovative use of pre-EAs optimized resource allocation and ensured that the survey could be implemented efficiently within both time and budget constraints.
Overview of the Survey
Listening to South Caucasus (L2SC) is an ongoing project and an expansion of a collaborative effort that has been conducted in multiple countries in the Europe and Central Asian region. This initiative aims to comprehensively monitor the views and well-being of a representative group of people as the government introduces social and economic reforms that affect every business and citizen. By reflecting on the experience of this group over the years, the study provides an up-to-date understanding of how policies reflect on people’s daily lives. The study comprises a nationally representative baseline survey and a high-frequency panel survey of a subset of the baseline participant households. The information collected through the L2SC initiative informs reform efforts directly by raising the profile of citizens’ views and enabling in-depth economic analysis. While the L2SC survey covers Armenia and Georgia, this paper focuses on the baseline survey in Armenia—Listening to Armenia (L2Arm)—where the new national sampling frame based on pre-EAs has been proposed.
Sampling Design
The sampling design optimizes the spatial allocation of the household sample to provide valid representativeness at the national level for both urban and rural areas. A two-stage stratified cluster sampling design is employed to select participating households, ensuring a balanced sample distribution across regions and accounting for differences between urban and rural areas, survey budgets, and discrepancies in population estimates. The L2Arm survey’s implementation highlighted the robustness of the sampling frame, as it successfully captured the population distribution across diverse geographic and demographic strata. The use of probability proportional to size (PPS) sampling ensured that the selection process was equitable and aligned with population estimates, further validating the practicality of the proposed approach (Appendix C).
In the first stage, a certain number of PSUs will be selected in each urban and rural stratum (urban and rural areas within each administrative region). In the second stage, the ultimate sampling units or the secondary sampling units (SSUs)—households in the case of L2SC—are randomly selected within each PSU. The survey is then implemented among the selected households. Given that our focus in this paper is on the first stage of the two-stage procedure, the sampling frame used for the survey in the first stage is highlighted.
Sampling Frame: As mentioned, the sampling frame is based on pre-census EAs (pre-EAs) providing the most accurate information on the geographic distribution of the population across Armenia. This allows for the most precise formulation of a sample design.
Sample Size: The objective of any sample design is to achieve the highest precision in indicators of interest given survey parameters. The sampling design aims to efficiently allocate the given PSUs across strata and the households across PSUs. For L2Arm, 400 PSUs are allocated across strata proportional to the population (i.e., implicit allocation) with some adjustments. Ten households are targeted within each PSU. Table 5 presents the proposed baseline sample allocation.
In the first stage of the two-stage stratified cluster sampling design, PSUs in each stratum are randomly selected using systematic random sampling with probability proportional to size (PPS), size being the estimated population of the pre-EA. This method assigns each PSU’s likelihood of selection based on the PSU’s size within the stratum. Population size, rather than the number of households, is used due to a lack of data on the number of households at the PSU level in the sampling frame. Thus, each PSU’s likelihood of selection corresponds to the percentage of the stratum population residing in the PSU. In the second stage, a set number of households are randomly selected from each chosen PSU.

5. Discussion

This study developed Armenia’s first digitized national sampling frame using pre-EAs, demonstrating that semi-automated geospatial methods can produce population-balanced, geographically coherent units suitable for national surveys. The pre-EA framework accurately reflects population distribution while respecting administrative and natural boundaries, addressing the limitations of outdated, incomplete, or inaccessible traditional frames. Beyond accuracy, the approach is cost-effective, requiring fewer resources, less time, and reduced manual labor compared with conventional frame construction. By enabling rapid, scalable, and reproducible sampling frame development, it supports efficient urban–rural stratification and representative survey design, directly fulfilling the study’s objective of producing a functional, modern sampling infrastructure. Compared with conventional grids or manually digitized frames, pre-EAs align better with population patterns and visible geographic features, offering operational advantages consistent with findings from other geospatial sampling applications in data-constrained countries.
The national sampling frame based on pre-EAs offers several advantages that are not provided by existing and accessible potential sampling frames. However, it may also present practical challenges and methodological limitations. This section discusses the additional benefits and potential concerns associated with this approach and proposes solutions. These solutions have been successfully tested in other developing countries where pre-EAs have been implemented, such as Somalia [2] and the Democratic Republic of Congo [18].
Population Estimates as a Measure of EA Size: The primary challenge of using the proposed national sampling frame for household surveys is that the size of the pre-EA is based on population estimates derived from gridded population data. These estimates may differ from the actual population, potentially introducing bias in the probability of pre-EAs being selected during the first stage of the two-stage design. Although this study does not address the validation of the gridded population estimates, it is important to clarify the limitations of the data. The automatic creation of a national sampling frame requires granular population information to ensure that the resulting sampling units are manageable. However, this level of granularity is not available in the existing census data in Armenia. As a result, gridded population data is utilized. In developing countries, several gridded population datasets with varying spatial resolutions are accessible, including Gridded Population of the World (GPWv4) [36], WorldPop [5], High-Resolution Settlement Layer (HRSL) [37], Demobase Population datasets [38], Global Human Settlement Population Grid (GHS-POP) [39], Global Rural–Urban Mapping Project (GRUMP) [40], and LandScan [41]. The accuracy and quality of gridded population data are primarily influenced by the quality of the input data model, which includes census data, satellite-derived covariates, and the statistical model used. At the time of implementing this work, the WorldPop-constrained gridded population data for Armenia from 2020 was used to create the national sampling frame, as it was the most recent dataset available with reasonable spatial resolution. This implies that there may be notable differences between the population size and distribution in 2020 and the present day. In addition, this version of the gridded population data had several limitations; the WorldPop group has since updated the dataset to 2030 [5], incorporating improved geospatial inputs and more recent census data. The limitations of the 2020 data primarily necessitated additional review of non-zero population units, a task that would require less effort if more accurate population inputs were available. However, since users can update the national sampling frame’s population using their preferred data sources, such as a population registry, this discrepancy should not pose a major concern for future applications.
Our findings indicate that the total populations of pre-EAs vary, ranging from zero to a specific population size. In the pre-EA tool, users can define various constraints, with the maximum population size and geographic area being the two primary hard constraints. These maximum thresholds may vary depending on the objectives of the work or the specific country context. The main purpose of establishing maximum thresholds for both population and area is to balance these limits and prevent the creation of unmanageable pre-EAs in areas with sparse populations. Once one of these constraints is met, aggregation ceases during the merging process. In uninhabited areas (as indicated by gridded population data), the size of pre-EAs is determined solely by the maximum geographic area; if this threshold is reached, aggregation stops. Consequently, several pre-EAs with zero or low population values may be created. This issue can be addressed in the tool by removing the geographic area constraint, but doing so may result in the creation of excessively large pre-EAs that could be difficult to enumerate, particularly in rural areas. The primary benefit of considering geographic constraints is that it helps avoid including uninhabited areas in sampling surveys, leading to significant time and cost savings. However, as the method primarily relies on gridded population data, there is a risk that some inhabited areas may be overlooked if the data is inaccurate or unreliable. The severity of bias due to using population estimates as sampling unit size depends on the size of the discrepancy between the actual population and population estimates and whether the difference is systematic.
This paper presents the first accessible and usable urban and rural classification for Armenia, contributing to the development of a national sampling frame. Currently, there is no available digital urban and rural boundary that can be compared with the boundaries generated in this study. However, we compared urban and rural population estimates between the boundaries we generated and those from the 2011 census. While there is a strong correlation between the aggregated population estimates from the census and the gridded population estimates for urban and rural areas, as discussed in Section 5, the output may not fully reflect reality. This is primarily due to the GHSL SMOD’s approach, which classifies the world into urban and rural categories using gridded population data and built-up areas derived from various data sources. The algorithms employed to generate the input data for both datasets, along with the satellite imagery used to extract the covariates, can introduce certain biases, affecting the accuracy of the classification. Furthermore, NSOs often use non-standardized approaches to classify urban and rural areas within their countries.
Another challenge associated with the inaccuracy of gridded population data is the occasional allocation of people in non-residential areas. This issue arises when the data fails to properly distinguish between residential and non-residential spaces, leading to an incorrect assignment of the population in pre-EAs that do not contain residents [42,43]. Model estimates of gridded population data can be improved with a reliable approach, along with sufficient resources and data, to accurately identify non-residential buildings. However, this remains a significant challenge due to the complexity of the issues involved, such as the similarity of structures and the coexistence of residential and commercial tenants within the same building [44,45,46]. As a result, non-residential areas are not always excluded in the population predictions of various gridded population datasets. Consequently, some pre-EAs located within non-residential areas may still show non-zero population estimates values.
It is important to note that when the pre-EAs were verified against high-resolution satellite imagery base maps from ESRI and Google, many of these validations were based on visual observation. Since the dates of the satellite imagery were not considered, these evaluations may not have been entirely objective. Therefore, without comprehensive validation on the ground, these assumptions cannot be fully verified.
Digitized Elements and Boundaries: Digitalized elements, both natural and man-made, are crucial for the automatic generation of the national sampling frame. In this study, the method leveraged the extensive digital line data from OpenStreetMap (OSM), which includes roads, railways, and waterways. However, the pre-EAs generated often exceeded the specified thresholds, such as population and geographic area, due to the poor quality and incomplete spatial coverage of the existing digitized boundaries. The main causes of this issue are (i) incomplete and (ii) disconnected lines. If certain natural and artificial features remain undigitized, further work, either manually or automatically, needs to be carried out. Lines should never be left open and should always be connected to other features whenever possible. This is because disconnected lines will not be polygonised during the polygonization process, which leads to the creation of larger, unmanageable pre-EAs. In addition to spatial coverage, the quality of OSM attribute data is essential for the automatic creation of the national sampling frame. Several line features, including major roads, rivers, and other barriers, were classified as uncrossable to improve the collection of ground data and enhance efficiency. The only source that can accurately determine the types of features on the ground is the attribute information. If the feature classification in the attribute table is incorrect, it may result in misclassification of uncrossable features, thereby impacting the accuracy of the national sampling frame. The quality, spatial coverage, and attribute information of OSM data may vary from one country to another [47,48,49,50].
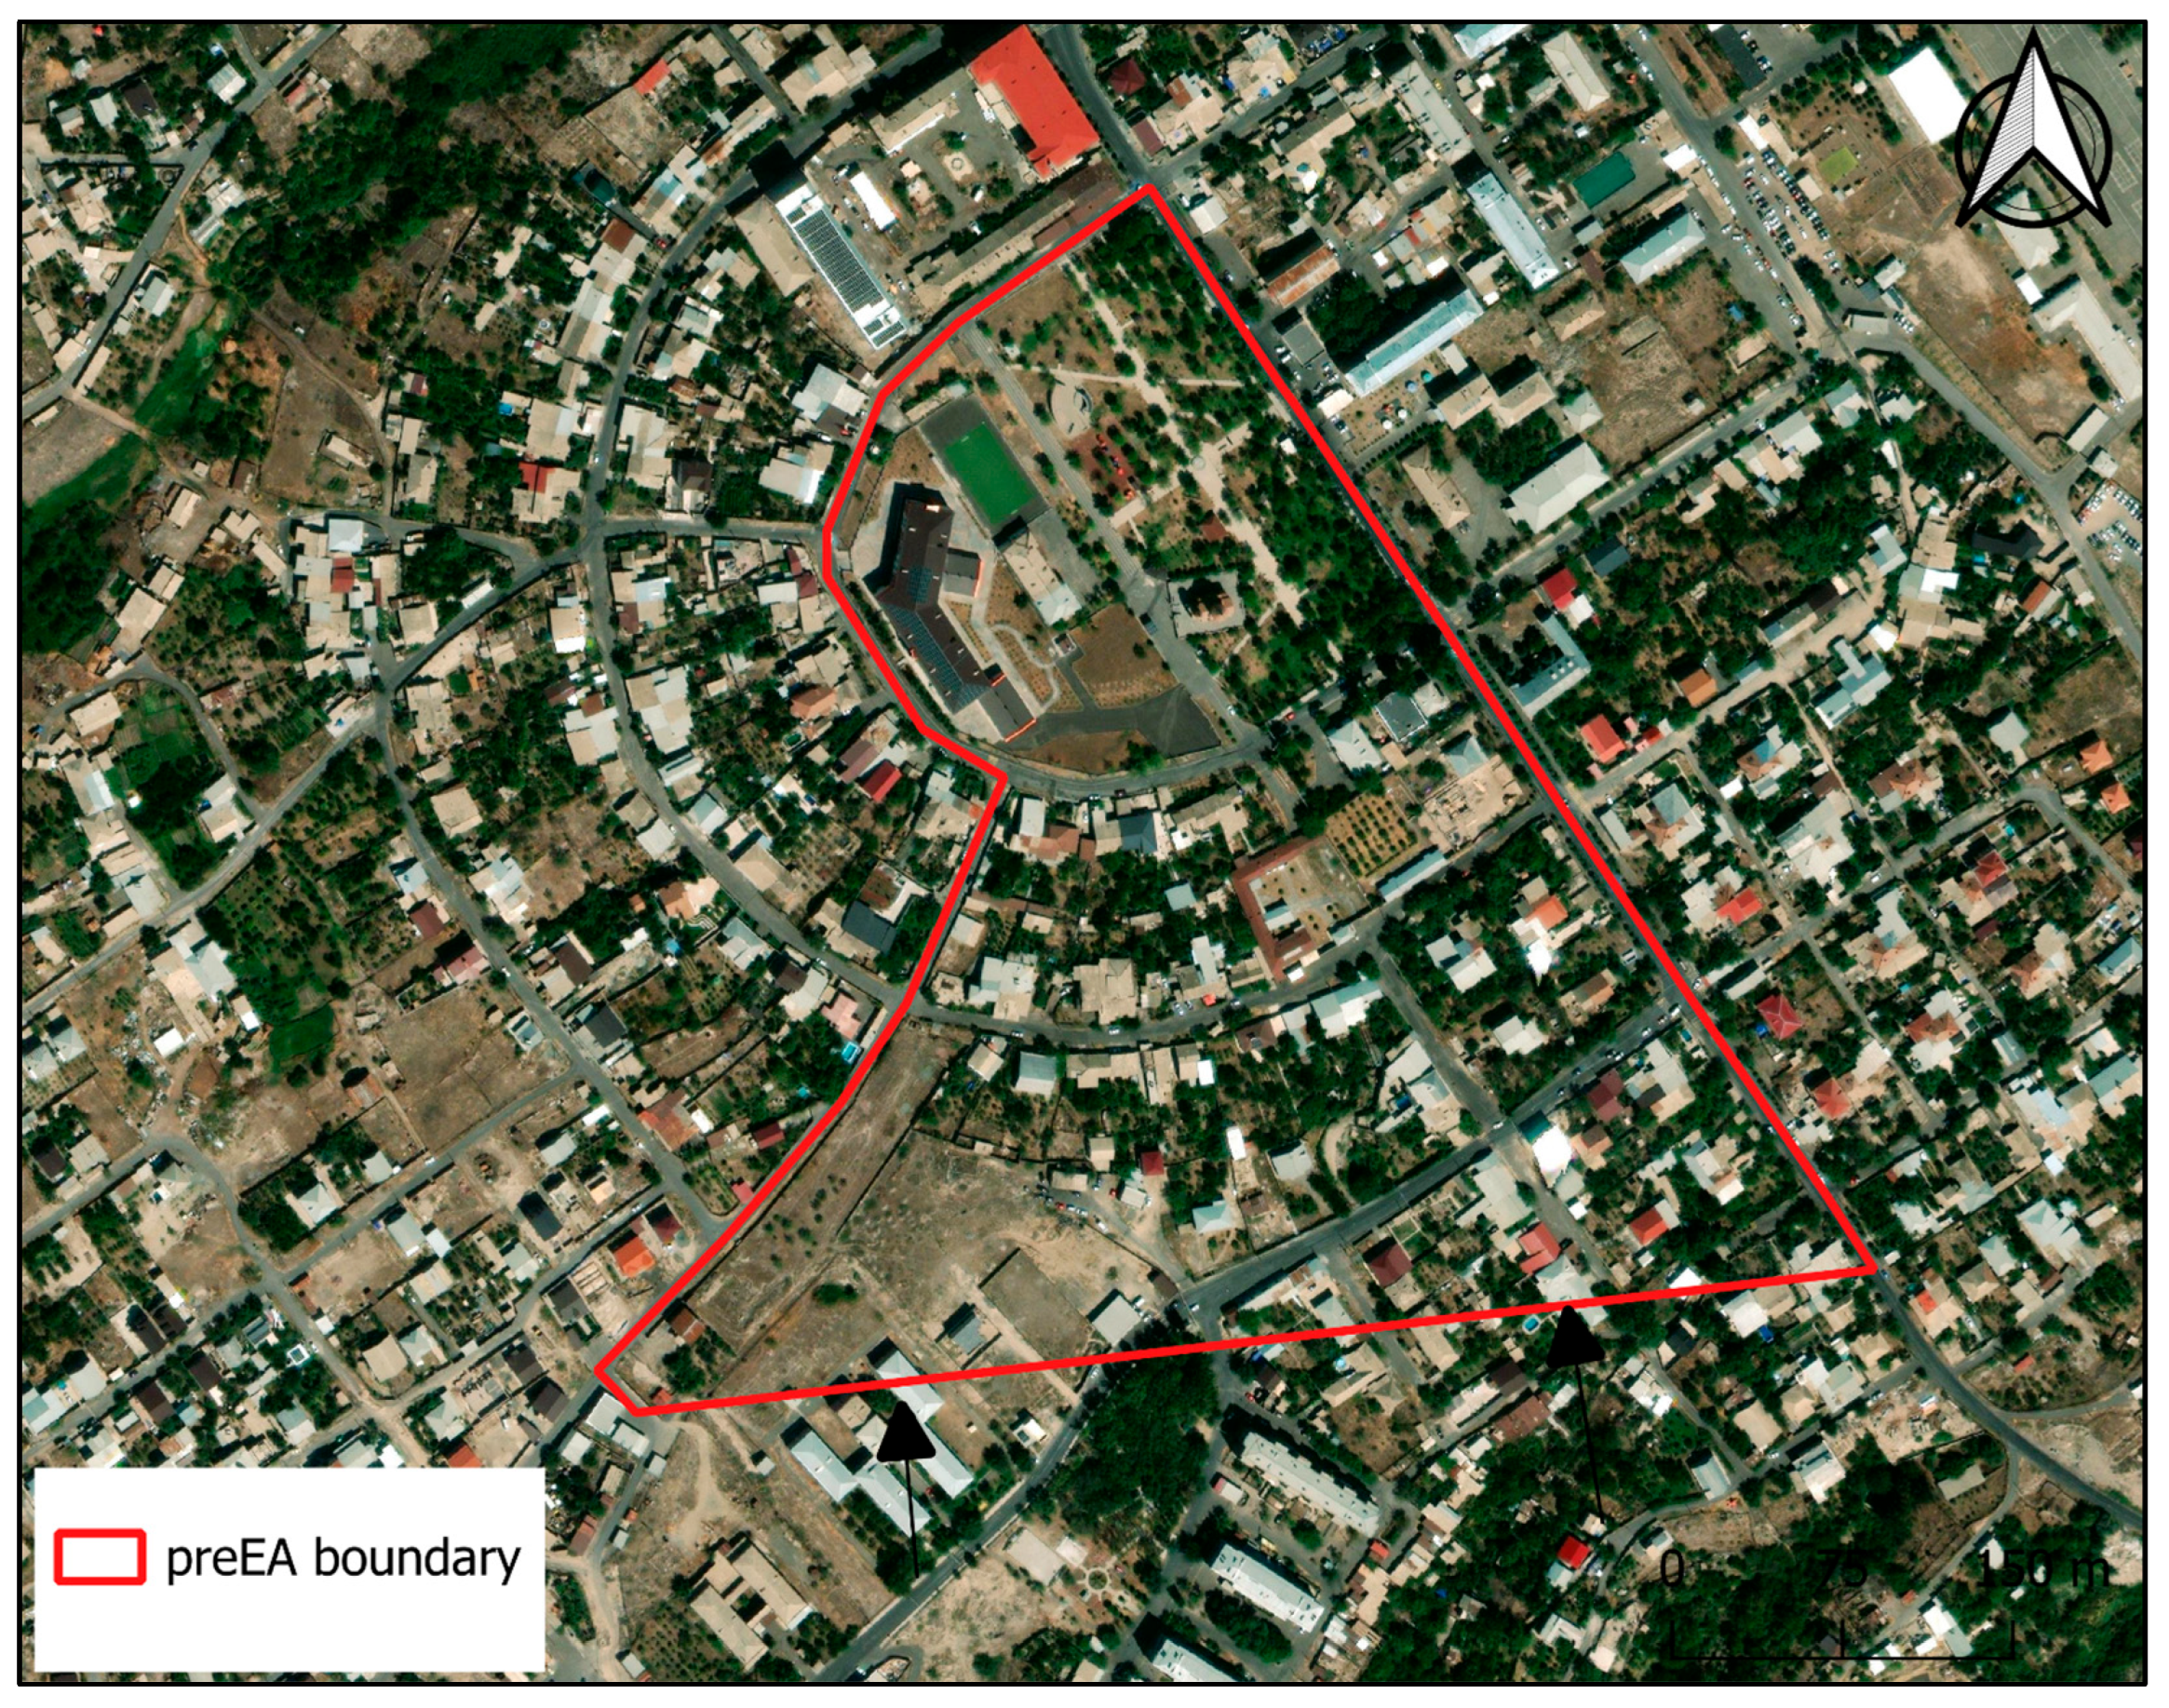
The semi-automatic approach creates pre-EAs based on digitized visible ground features, which are generally unlikely to intersect with buildings or other structures. However, there are instances where such intersections may occur. These intersections may be caused by administrative boundaries or poorly entered visible digital lines. Since administrative boundaries cannot be altered without consulting the relevant government agencies, users should be cautious when determining the reasons for the cutting of buildings and other structures. For example, Figure 13 illustrates a pre-EA output where the boundary cuts through buildings. This is due to the administrative boundary of the municipality, and as such, it cannot be modified.
This method has solely utilized publicly accessible natural and man-made features, and settlement boundaries, such as OSM and GHSL, for reproducibility and worldwide application. Nonetheless, several government agencies can provide input datasets such as roads and waterways with higher quality and greater geographic coverage. In addition, future studies could also investigate leveraging the more modern and comprehensive commercial road network [51]. If inadequate spatial coverage is a major concern, an alternative approach would be to use “mapathons”—a coordinated mapping event—to enhance the current open-source data on roads and rivers before implementing this method.
One of the primary challenges in collecting high-quality surveys in Armenia was the limitations of the existing national sampling frames. To our knowledge, it remains uncertain whether the Statistical Committee of the Republic of Armenia (ArmStat) possesses a digital map of census EAs. As a result, this paper presents the first accessible digitized national sampling frame for the country. The inclusion of pre-EA boundaries and other administrative units in our sampling frame provides several advantages. Notably, it helps prevent errors such as the inclusion of households outside the designated survey areas. If such errors occur non-randomly, they could significantly compromise the integrity of subsequent analyses based on the collected data. Furthermore, this type of error may be systematic, particularly for pre-EAs with larger areas and longer boundaries, where such mistakes are more likely to occur. Therefore, this feature plays a crucial role in ensuring robust quality control throughout the data collection process.
It is difficult to directly compare the resources and budget of our automated method with manual approaches, as many countries do not offer a detailed breakdown of the costs associated with various stages of census operations, especially the resources needed for manually digitizing national census EAs. For example, the 2010 census mapping effort in Zambia was projected to cost approximately US $7 million and take nearly two years to complete [52]. If the pre-census sampling frame in Armenia had been manually digitized, significant financial resources would have been required to extensively train a team of cartographers on how to digitize all the units using high-resolution satellite imagery. Additionally, the entire pre-EAs would need to be manually digitized in accordance with strict requirements, necessitating considerable effort to ensure quality control and correct geometric errors, given the hand-drawn nature of the process. This approach would have been both time- and resource-intensive. In contrast, the automated creation of Armenia’s pre-census sampling frame was completed in under three months, including the manual corrections needed due to the lack of spatial input data and feedback was received by the local experts, all carried out by a single specialist. The significant savings in labour, time, and costs from using an automated method can be reinvested into other aspects of national surveys and census preparation, enhancing overall efficiency.
Despite its limitations, the method was successfully implemented, resulting in the creation of a national sampling frame for Armenia. From financial, time, and technological perspectives, this approach outperformed conventional manual techniques. Historically, manually delineating a nationwide sampling frame required years of work and substantial financial resources. Moreover, the manual method is susceptible to various geometric issues, such as gaps, overlaps, pockets, and disjunctions, due to the inherent limitations of human error. These geometric inconsistencies could introduce bias into the sampling frame and, consequently, the data collected. In contrast, the automatic method eliminates these geometric problems, ensuring greater accuracy. Furthermore, the automatic approach offers several advantages over the gridded population sampling frame, which has been directly used as a sampling frame in various studies [11,12,53]. The key difference between our approach and the gridded population frame lies in the design of the sampling units. In gridded population methods, buildings and other structures are often truncated because the grid’s boundaries do not align with visible features on the ground. In contrast, the pre-EA tool generates pre-EA boundaries that follow observable, natural features such as rivers and roads, providing a more accurate and relevant sampling frame.
Potential Applications of the Method in Different Countries: The limitations of the existing sampling frames present significant challenges during the implementation stage of many household surveys. In some countries, an up-to-date and digitized national sampling frame may not be available. While such a frame may exist in other countries, NSOs may be unwilling to grant access to international agencies such as the World Bank. In some cases, the sampling frame relies on census EAs, which, due to their large spatial units, can lead to substantial costs when conducting the second and third stages of sampling to achieve the required household size. Additionally, if the sample selection is based on census EAs, the household listing for the selected sampling units requires considerable time and resources due to their extensive spatial coverage and large population totals. Our proposed method and strategy offer a potential solution for creating a new national sampling frame in the event of these challenges arising in future surveys in other countries.

6. Conclusions

This paper introduces a new national sampling frame for the Republic of Armenia, serving as a model for developing nations with limited access to functional sampling frames for representative household surveys and potentially future censuses. Specifically, it presents an innovative method for the automatic delineation of pre-census EAs (pre-EAs), which offers several advantages over traditional sources of sampling frames such as those based on outdated census EAs, census settlements, electoral precincts, and traditional gridded sampling techniques.
The national sampling frame developed in this paper divides Armenia into approximately 7500 pre-EAs, the majority of which have population estimates greater than zero. These estimates, which are recent and relatively homogeneous, range mostly between 100 and 1000 people. The digitized pre-EAs with clearly defined boundaries facilitate the household selection process by ensuring that households outside of the selected pre-EAs are not included.
This paper makes several methodological and practical contributions to the survey sampling literature and to organizations that collect and utilize representative surveys, such as researchers and policymakers. First, it expands the application of the semi-automatic approach for creating national sampling frames by generating Armenia’s first digitized frame based on pre-EAs, offering an alternative to traditional methods of delineating national sampling frames. Our analysis highlights the applicability of pre-EAs for other countries facing similar challenges in developing sampling frames. Second, the national sampling frame contributes to survey implementers and users of household surveys in Armenia by providing a standardized and decentralized framework. Third, the paper systematically evaluates the existing sampling frames in Armenia, comparing their strengths and limitations to the proposed frame. This comparison suggests that our frame complements existing sampling frames and can serve as a viable alternative.
In conclusion, the paper acknowledges some limitations and outlines directions for future research. While the proposed national sampling frame addresses a common challenge in the first stage of two-stage sampling designs, solutions for challenges encountered in the second stage, such as household listing strategies, are beyond the scope of this paper. Future research could explore innovative approaches to household listing, particularly when utilizing the sampling frame introduced here.


Author Contributions

Conceptualization, Sarchil H. Qader, Saida Ismailakhunova, Tsenguunjav Byambasuren and Avralt-Od Purevjav, methodology, Sarchil H. Qader, Saida Ismailakhunova, Tsenguunjav Byambasuren and Avralt-Od Purevjav, validation and formal analysis, Sarchil H. Qader, Saida Ismailakhunova, Tsenguunjav Byambasuren and Avralt-Od Purevjav, writing—original draft preparation, Sarchil H. Qader and Tsenguunjav Byambasuren, writing—review and editing, Saida Ismailakhunova and Avralt-Od Purevjav, visualization, Sarchil H. Qader and Tsenguunjav Byambasuren, Funding Acquisition, Saida Ismailakhunova. All authors have read and agreed to the published version of the manuscript.

Funding

This article is part of the World Bank Listening to South Caucasus project.

Data Availability Statement

Data can be provided upon request.

Acknowledgments

For the purpose of open access, the author has applied a Creative Commons attribution license (CC BY) to any Author Accepted Manuscript version arising from this submission.

Conflicts of Interest

The authors declare no conflicts of interest.

Appendix A

Figure A1. Change in population distribution in an area between 2011 and 2024.
Ijgi 15 00145 g0a1

Appendix B

To take advantage of the boundaries and other spatial information, the survey conductor can create field maps of selected pre-EAs for enumerators to feed their navigation when they collect the survey. Even in the presence of the field maps, it could be still challenging for enumerators to navigate themselves in the selected pre-EA especially, when the enumerators are not familiar with the area and cannot visually estimate the boundaries from the information provided in the physical maps, like street address and some information about church and schools. A potential solution to this problem could be offline maps, which inform the enumerators of their location live and signal if they overstep outside the selected pre-EAs. In many developing countries like Armenia, access to the internet is a substantial challenge, especially in rural and remote areas, so enumerators can benefit from the offline maps that operate well with the minimum requirement of only access to satellite. So, enumerators should be able to navigate smoothly and avoid the risk of going beyond the boundaries of selected pre-EAs unless they are, for example, under the tunnel or in between narrow alleys in the mountain. In total, 400 field paper maps and 400 georeferenced offline maps were created using QGIS 3.40.9-Bratislava software.
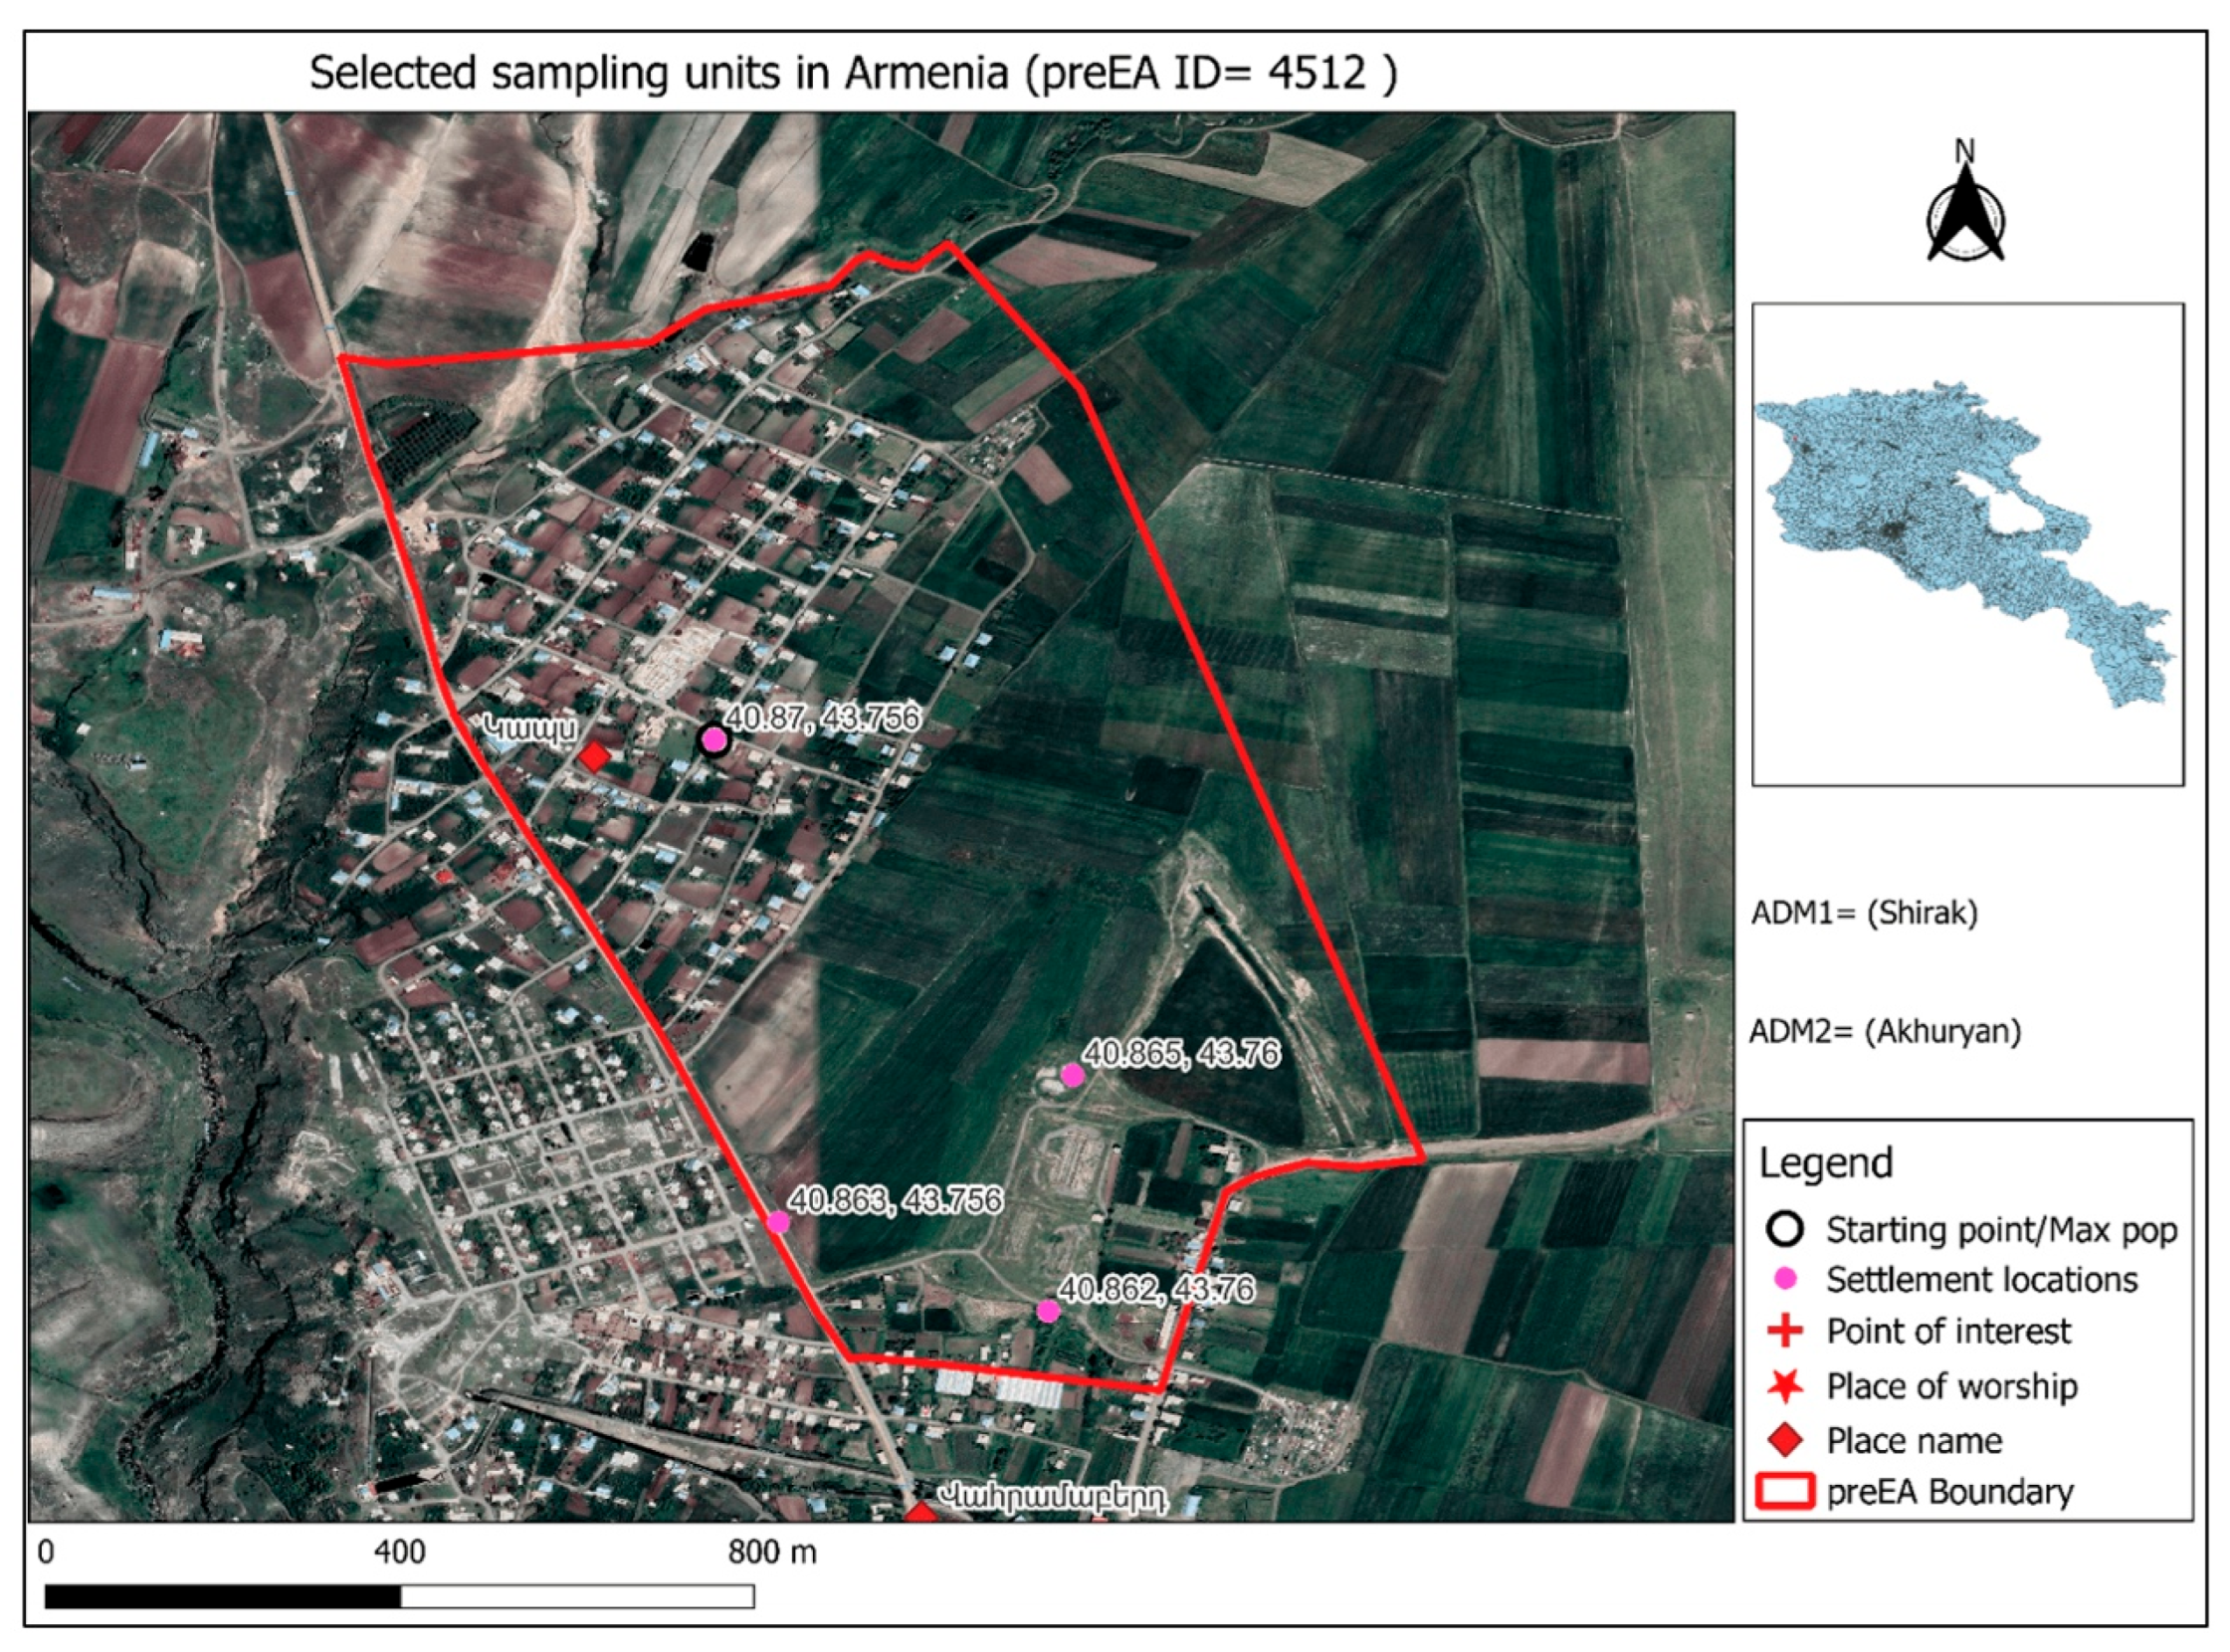
Multiple settled areas are probably present in various pre-EAs. Map definitions of these settled areas may be helpful for ground navigation. Several actions have been taken to display the settled region on field maps. Administrative boundaries with incorporated urban and rural areas were intersected with settlement boundaries. Zonal Statistic Polygons in QGIS were then used to determine the population sum for the resultant intersected polygons based on the gridded population data. A point layer was created from the output. Additionally, the settlement locations’ maximum population values inside each pre-EA were extracted. The settlement with the highest population numbers is shown by the black circle surrounding settlement sites on the field map. This can help the enumerator to find the most densely populated area as a starting point. The X and Y coordinates were calculated for all the settlement points and were shown on the field map (Figure A2 and Figure A3).
Figure A2. An example of a detailed field paper map in rural areas.
Ijgi 15 00145 g0a2
Figure A3. An example of a detailed field paper map in urban areas.
Ijgi 15 00145 g0a3
Sampling weights account for the fact that different members of the population have different probabilities of being selected for interviews, represent various numbers of people in the overall population, and are necessary when computing the representative statistics at the level of the domain. If required, sampling weights are also adjusted to account for non-responsive rates given by the survey design.

Appendix C

Sampling weights account for the fact that different members of the population have different probabilities of being selected for interviews, represent various numbers of people in the overall population, and are necessary when computing the representative statistics at the level of the domain. If required, sampling weights are also adjusted to account for non-responsive rates given the survey design.
The dataset will have two sets of weights, including household and individual weights. The household weights are the inverse probability of selection of households and are calculated from the following two components in our two-stage sampling design. The first component is the sampling weight (inverse probability of selection) of PSU within the stratum, and the second component is the sampling weight of selection of households within the PSU. For calculating individual weights, the third component, sampling weights of individuals within the household, is added to compute the household weights. Each of the components is calculated as follows:
Component 1: The inverse probability of selection of PSU within the stratum by using PPS (Probability Proportional to Size) is calculated as:
W p s u = 1 P p s u = N s t r a t u m n p s u × N p s u
where W p s u is the sampling weight of PSU within the stratum, P p s u is the probability of selection of PSU within the stratum, n p s u is the number of selected PSUs within the stratum, N p s u is the size of selected PSU, and N s t r a t u m is the population of the stratum. The size measure can be the population, the number of households, the number of electors, or the school attendance, while the number of households would be the preferred option in most household surveys.
Component 2: The inverse probability of selection of household within PSU is calculated as:
W h h p s u = 1 P h h p s u = N h h p s u n h h p s u ,
where W h h p s u is the sampling weight of household within PSU, P h h p s u is the probability of selection of household within PSU, n h h p s u is the number of sampled (interviewed) households within PSU, and N h h p s u is the total number of households within PSU.
Component 3: The inverse probability of selection of individual within the household is calculated by:
W i n d h h = 1 P i n d h h = N i n d h h n i n d h h = N i n d h h 1 ,
where W i n d h h is the sampling weight of individual within the household, P i n d h h is the probability of selection of individual within the household, n i n d h h is the number of sampled (interviewed) individuals within the household, equal to 1, as only one individual was allowed to be interviewed from each household, and N i n d h h is the size of the household surveyed (asked and recorded during the interview).
Based on these components, household and individual weights are calculated as:
W h h = W p s u × W h h p s u ,
W i n d = W h h × W i n d h h .

References

  1. Harrison, J.M.; Germack, H.D.; Poghosyan, L.; Martsolf, G.R. Surveying Primary Care Nurse Practitioners: An Overview of National Sampling Frames. Policy Politics Nurs. Pract. 2021, 22, 6–16. [Google Scholar] [CrossRef] [PubMed]
  2. Qader, S.; Lefebvre, V.; Tatem, A.; Pape, U.; Himelein, K.; Ninneman, A.; Bengtsson, L.; Bird, T. Semi-Automatic Mapping of Pre-Census EAs and Population Sampling Frames. Humanit. Soc. Sci. Commun. 2021, 8, 3. [Google Scholar] [CrossRef]
  3. Gale, R.P.; Muradyan, A.; Danelyan, S.; Manukyan, N.; Babak, M.V.; Arakelyan, S.; Tamamyan, G.; Arakelyan, J. The Humanitarian Crisis in Nagorno-Karabakh. Lancet 2023, 402, 1324–1325. [Google Scholar] [CrossRef] [PubMed]
  4. ArmStat. The Necessity of Population Census Conduction and Ensuring Its Legal Basis. 2022. Available online: https://www.armstat.am/file/article/introduction.pdf (accessed on 8 April 2025).
  5. WorldPop. WorldPop Data. 2025. Available online: https://www.worldpop.org/datacatalog/ (accessed on 8 April 2025).
  6. GRID3. High Resolution Population Estimates. 2025. Available online: https://grid3.org/solution/high-resolution-population-estimates (accessed on 8 April 2025).
  7. Global Human Settlement Layer. 2025. Available online: https://human-settlement.emergency.copernicus.eu/ghs_pop.php (accessed on 8 April 2025).
  8. International Union for the Scientific Study of Population Toggle Menu. The Gridded Population of the World (Version 4). 2025. Available online: https://iussp.org/en/gridded-population-world-version-4-released (accessed on 8 April 2025).
  9. Meta and CIESIN—Columbia University. High Resolution Settlement Layer (HRSL). 2025. Available online: https://ciesin.columbia.edu/programs (accessed on 8 April 2025).
  10. Weber, E.; Weaver, J.; McKee, J.; Lunga, D.; Laverdiere, M.; Swan, B.; Yang, H.; Urban, M.; Cheriyadat, A.; Patlolla, D. LandScan HD Afghanistan v1.0 Version v1.0 [Raster Digital Data]; Oak Ridge National Laboratory: Oak Ridge, TN, USA, 2017. [Google Scholar] [CrossRef]
  11. Qader, S.H.; Lefebvre, V.; Tatem, A.J.; Pape, U.; Jochem, W.; Himelein, K.; Ninneman, A.; Wolburg, P.; Nunez-Chaim, G.; Bengtsson, L.; et al. Using Gridded Population and Quadtree Sampling Units to Support Survey Sample Design in Low-Income Settings. Int. J. Health Geogr. 2020, 19, 10. [Google Scholar] [CrossRef]
  12. Cajka, J.; Amer, S.; Ridenhour, J.; Allpress, J. Geo-Sampling in Developing Nations. Int. J. Soc. Res. Methodol. 2018, 21, 729–746. [Google Scholar] [CrossRef]
  13. Thomson, D.R.; Rhoda, D.A.; Tatem, A.J.; Castro, M.C. Gridded Population Survey Sampling: A Systematic Scoping Review of the Field and Strategic Research Agenda. Int. J. Health Geogr. 2020, 19, 34. [Google Scholar] [CrossRef]
  14. Kassié, D.; Roudot, A.; Dessay, N.; Piermay, J.-L.; Salem, G.; Fournet, F. Development of a Spatial Sampling Protocol using GIS to Measure Health Disparities in Bobo-Dioulasso, Burkina Faso, A Medium-Sized African City. Int. J. Health Geogr. 2017, 16, 14. [Google Scholar] [CrossRef]
  15. Himelein, K.; Eckman, S.; Murray, S. Sampling Nomads: A New Technique for Remote, Hard-to-Reach, and Mobile Populations. J. Off. Stat. 2014, 30, 191–213. [Google Scholar] [CrossRef]
  16. Howell, C.R.; Su, W.; Nassel, A.F.; Agne, A.A.; Cherrington, A.L. Area Based Stratified Random Sampling using Geospatial Technology in a Community-Based Survey. BMC Public Health 2020, 20, 1678. [Google Scholar] [CrossRef]
  17. Darin, E.; Dicko, A.H.; Galal, H.; Jimenez, R.M.; Park, H.; Tatem, A.J.; Qader, S. Mapping Refugee Populations at High Resolution by Unlocking Humanitarian Administrative Data. J. Int. Humanit. Action 2024, 9, 14. [Google Scholar] [CrossRef]
  18. Qader, S.; Chamberlain, H.; Kuepie, M.; Hunt, F.K.; Lazar, A.; Tatem, A. Field Testing of Pre-EAs Created Using Semi-Automated Delineation Approach, Democratic Republic of Congo; WorldPop; University of Southampton: Southampton, UK, 2023. [Google Scholar] [CrossRef]
  19. Qader, S.; Harfoot, A.; Kuepie, M.; Darin, E.; Juran, S.; Lazar, A.; Tatem, A. National Automatic pre-EAs (pre-EAs) in Burkina Faso (2019), Version 1.0; WorldPop; University of Southampton: Southampton, UK, 2022; Available online: https://data.worldpop.org/repo/wopr/BFA/preEAs/v1.0/ (accessed on 8 April 2025).
  20. Hansen, H.S.; Schrøder, L. The Societal Benefits of Open Government Data with Particular Emphasis on Geospatial Information. In Electronic Government and the Information Systems Perspective: 8th International Conference, EGOVIS 2019, Linz, Austria, 26–29 August 2019, Proceedings 8; Kő, A., Francesconi, E., Anderst-Kotsis, G., Tjoa, A., Khalil, I., Eds.; Springer International Publishing: Cham, Switzerland, 2019; pp. 31–44. [Google Scholar] [CrossRef]
  21. ArmStat. The Results of 2011 Population Census of the Republic of Armenia (Indicators of the Republic of Armenia). 2025. Available online: https://armstat.am/en/?nid=532 (accessed on 8 April 2025).
  22. Grosh, M.E.; Glewwe, P. A Guide to Living Standards Measurement Study Surveys and their Data Sets. LSMS Working Paper No. 120. 1995. Available online: http://books.google.ca/books?hl=en&lr;=&id=I0hNdZRigOsC&oi=fnd&pg=PR7&dq=Nepal+Living+Standards+Survey+LSS+LSMS&ots=d9znWCxyB0&sig=DZWKh95__u7zgIGodk6yA7ydtq0#v=onepage&q&f;=false (accessed on 8 April 2025).
  23. Pettersson, H. Sample Design and Sample Size for the Armenia MICS 2024; UNICEF Consultancy Report; UNICEF: Stockholm, Sweden, 2023; manuscript in preparation. [Google Scholar]
  24. Central Bureau of Statistics of Nepal. Nepal Living Standard Survey—1995: Basic Information Document. 1996. Available online: https://microdata.worldbank.org/index.php/catalog/2301/download/34437 (accessed on 8 April 2025).
  25. Central Election Commission. 2025. Available online: https://www.idea.int/node/6929 (accessed on 8 April 2025).
  26. National Statistical Service [Armenia]; Ministry of Health [Armenia]; ICF. Armenia Demographic and Health Survey 2015–2016; National Statistical Service: Yerevan, Armenia; Ministry of Health: Yerevan, Armenia; ICF: Rockville, MD, USA, 2017; Available online: https://dhsprogram.com/pubs/pdf/FR325/FR325.pdf (accessed on 8 April 2025).
  27. Bondarenko, M.; Kerr, D.; Sorichetta, A.; Tatem, A.J. Census/Projection-Disaggregated Gridded Population Datasets for 189 Countries in 2020 Using Built-Settlement Growth Model (BSGM) Outputs; University of Southampton: Southampton, UK, 2020. [Google Scholar] [CrossRef]
  28. Nieves, J.J.; Bondarenko, M.; Sorichetta, A.; Steele, J.E.; Kerr, D.; Carioli, A.; Stevens, F.R.; Gaughan, A.E.; Tatem, A.J. Predicting Near-Future Built-Settlement Expansion using Relative Changes in Small Area Populations. Remote Sens. 2020, 12, 1545. [Google Scholar] [CrossRef]
  29. Stevens, F.R.; Gaughan, A.E.; Linard, C.; Tatem, A.J. Disaggregating Census Data for Population Mapping using Random Forests with Remotely-Sensed and Ancillary Data. PLoS ONE 2015, 10, e0107042. [Google Scholar] [CrossRef] [PubMed]
  30. Geofabrik. Latest OSM for Armenia. 2025. Available online: https://download.geofabrik.de/asia/armenia.html (accessed on 8 April 2025).
  31. Schiavina, M.; Melchiorri, M.; Pesaresi, M.; Politis, P.; Carneiro Freire, S.M.; Maffenini, L.; Florio, P.; Ehrlich, D.; Goch, K.; Carioli, A.; et al. GHSL Data Package 2023; Publications Office of the European Union: Luxembourg, 2023. [Google Scholar] [CrossRef]
  32. EUROSTAT. Applying the Degree of Urbanisation: A Methodological Manual to Define Cities, Towns and Rural Areas for International Comparisons; Publications Office of the European Union: Luxembourg, 2021. [Google Scholar] [CrossRef]
  33. HDX. Armenia—Subnational Administrative Boundaries. 2025. Available online: https://data.humdata.org/dataset/cod-ab-arm (accessed on 8 April 2025).
  34. Farley, S.M.; Delgado, S.; McCracken, S.; Thomson, D.R.; Chen, Q.; Reid, G.; Baptista, S.; Biraro, S.; Kabala, A.; Mulindwa, H.; et al. Assessment of a gridded population sample frame for a household survey of refugee populations in Uganda, 2021. Int. J. Health Geogr. 2025, 24, 47. [Google Scholar] [CrossRef] [PubMed]
  35. 35. Statistics South Africa. Department Statistics South Africa. Definitions Statistics South Africa, 1998. 2026. Available online: https://apps.statssa.gov.za/census01/census96/html/metadata/Docs/Dfntns.html?utm_source=chatgpt.com (accessed on 6 March 2026).
  36. Center for International Earth Science Information Network—CIESIN—Columbia University. Gridded Population of the World, Version 4 (GPWv4): Administrative Unit Center Points with Population Estimates; NASA Socioeconomic Data and Applications Center (SEDAC): Palisades, NY, USA, 2016. [Google Scholar] [CrossRef]
  37. Facebook Connectivity Lab and Center for International Earth Science Information Network—CIESIN—Columbia University. High Resolution Settlement Layer (HRSL). Source Imagery for HRSL © 2016 DigitalGlobe. 2016. Available online: https://ciesin.columbia.edu/content/data (accessed on 8 April 2025).
  38. Azar, D.; Engstrom, R.; Graesser, J.; Comenetz, J. Generation of Fine-Scale Population Layers using Multi-Resolution Satellite Imagery and Geospatial Data. Remote Sens. Environ. 2013, 130, 219–232. [Google Scholar] [CrossRef]
  39. Joint Research Centre (JRC). GHS-POP R2015A—GHS Population Grid, Derived from GPW4, Multitemporal (1975, 1990, 2000, 2015)—OBSOLETE RELEASE; European Commission, Joint Research Centre (JRC): Brussels, Belgium, 2015; Available online: https://data.europa.eu/89h/jrc-ghsl-ghs_pop_gpw4_globe_r2015a (accessed on 8 April 2025).
  40. Center for International Earth Science Information Network—CIESIN—Columbia University; International Food Policy Research Institute—IFPRI; The World Bank; Centro Internacional de Agricultura Tropical—CIAT. Global Rural-Urban Mapping Project, Version 1 (GRUMPv1): Population Count Grid; NASA Socioeconomic Data and Applications Center (SEDAC): Palisades, NY, USA, 2011. [Google Scholar] [CrossRef]
  41. Dobson, J.E.; Bright, E.A.; Coleman, P.R.; Durfee, R.C.; Worley, B.A. LandScan: A Global Population Database for Estimating Populations at Risk. Photogramm. Eng. Remote Sens. 2000, 66, 849–857. [Google Scholar]
  42. Archila Bustos, M.F.; Hall, O.; Niedomysl, T.; Ernstson, U. A pixel level evaluation of five multitemporal global gridded population datasets: A case study in Sweden, 1990–2015. Popul. Environ. 2020, 42, 255–277. [Google Scholar] [CrossRef]
  43. Kuffer, M.; Owusu, M.; Oliveira, L.; Sliuzas, R.; van Rijn, F. The Missing Millions in Maps: Exploring Causes of Uncertainties in Global Gridded Population Datasets. ISPRS Int. J. Geo-Inf. 2022, 11, 403. [Google Scholar] [CrossRef]
  44. Hu, F.; Xia, G.-S.; Hu, J.; Zhang, L. Transferring Deep Convolutional Neural Networks for the Scene Classification of High-Resolution Remote Sensing Imagery. Remote Sens. 2015, 7, 14680–14707. [Google Scholar] [CrossRef]
  45. Han, X.; Zhong, Y.; Cao, L.; Zhang, L. Pre-Trained AlexNet Architecture with Pyramid Pooling and Supervision for High Spatial Resolution Remote Sensing Image Scene Classification. Remote Sens. 2017, 9, 848. [Google Scholar] [CrossRef]
  46. Chew, R.F.; Amer, S.; Jones, K.; Unangst, J.; Cajka, J.; Allpress, J.; Bruhn, M. Residential Scene Classification for Gridded Population Sampling in Developing Countries using Deep Convolutional Neural Networks on Satellite Imagery. Int. J. Health Geogr. 2018, 17, 12. [Google Scholar] [CrossRef]
  47. Haklay, M. How Good is Volunteered Geographical Information? A Comparative Study of OpenStreetMap and Ordnance Survey Datasets. Environ. Plan. B Plan. Des. 2010, 37, 682–703. [Google Scholar] [CrossRef]
  48. Barrington-Leigh, C.; Millard-Ball, A. The World’s User-Generated Road Map is More than 80% Complete. PLoS ONE 2017, 12, e0180698. [Google Scholar] [CrossRef]
  49. Minaei, M. Evolution, Density and Completeness of OpenStreetMap Road Networks in Developing Countries: The Case of Iran. Appl. Geogr. 2020, 119, 102246. [Google Scholar] [CrossRef]
  50. Gatea, Z.K.; Maythm, A.B. Measuring the Attribute Accuracy and Completeness for the OpenStreetMap Roads Networks for Two Regions in Iraq. J. Eng. 2023, 29, 156–168. [Google Scholar] [CrossRef]
  51. Strano, E.; Giometto, A.; Shai, S.; Bertuzzo, E.; Mucha, P.J.; Rinaldo, A. The Scaling Structure of the Global Road Network. R. Soc. Open Sci. 2017, 4, 170590. [Google Scholar] [CrossRef]
  52. United Nations Secretariat. Report of the Sub-Regional Workshop on Census Cartography and Management. ESA/STAT/AC.144/L.3. 2007. Available online: https://unstats.un.org/unsd/demographic/meetings/egm/CensusMappingEGM07/docs/Final_Report.pdf (accessed on 8 April 2025).
  53. Thomson, D.R.; Stevens, F.R.; Ruktanonchai, N.W.; Tatem, A.J.; Castro, M.C. GridSample: An R Package to Generate Household Survey Primary Sampling Units (PSUs) from Gridded Population Data. Int. J. Health Geogr. 2017, 16, 25. [Google Scholar] [CrossRef]
Figure 1. The distribution of voters or adult population across electoral precincts in Armenia in 2023.
Ijgi 15 00145 g001
Figure 2. Schematic diagram of the semi-automated pre-enumeration area (pre-EA) delineation process in Armenia.
Ijgi 15 00145 g002
Figure 3. Population estimates and digitized visible ground features. Notes: Panel (a) shows the gridded population estimates at ~100 × 100 m, while panel (b) depicts the digitized visible ground features from OSM. Basemap: ESRI Satellite Imagery.
Ijgi 15 00145 g003
Figure 4. Global human settlement layer. Notes: Panel (a) presents the built-up area, and panel (b) shows the SMOD classes.
Ijgi 15 00145 g004
Figure 5. Preparation of road dataset. Notes: Panel (a) shows the original road data, while panel (b) presents the road data after applying the Merge divided road technique. Basemap: ESRI Satellite Imagery.
Ijgi 15 00145 g005
Figure 6. Generated urban and rural areas in Armenia. Basemap: OSM Standard.
Ijgi 15 00145 g006
Figure 7. Urban population in marzes, 2011.
Ijgi 15 00145 g007
Figure 8. Urban and rural population, 2011.
Ijgi 15 00145 g008
Figure 9. Pre-EA tool outputs. Notes: Panel (a) depicts building blocks before merging, while panel (b) shows pre-EA outputs after merging. Basemap: OSM Standard.
Ijgi 15 00145 g009
Figure 10. Distribution of population across pre-EAs in Armenia. Notes: The figure presents the distribution of population across pre-EAs in 2022. The extreme values of the population have been winsorized at the 1st and 99th percentiles to account for the potential outliers, i.e., we set the low (high) values at the 1st percentile (99th percentile).
Ijgi 15 00145 g010
Figure 11. Examples of pre-EAs located in non-residential areas, yet which have a population greater than zero.
Ijgi 15 00145 g011
Figure 12. The outline of pre-EA boundaries. Basemap: OSM Standard and ESRI Satellite Imagery. (a) pre-EAs are nested within administrative boundary, (b) pre-EAs are respecting uncrossable features, (c) pre-EAs are aligned with visible ground infrastructure and (d) presents pre-EA outputs in rural areas.
Ijgi 15 00145 g012
Figure 13. An example of pre-EA boundary-cutting buildings.
Ijgi 15 00145 g013
Table 1. Population (2022 ArmStat), number of eligible voters (2023 election data), and the resulting population–voter differences across Armenia’s marzes, disaggregated by settlement type and strata.
Marz NameSettlement TypeStrata IDPopulation (2022 ArmStat)Number of Voters (18+, 2023)Difference
AragatsotnUrban126,73827,847−1109
AragatsotnRural298,94982,62216,327
AraratUrban372,29456,73015,564
AraratRural4186,983150,80536,178
ArmavirUrban582,95376,2056748
ArmavirRural6183,703137,82345,880
GegharkunikUrban765,90261,8234079
GegharkunikRural8162,809109,80353,006
KotaykUrban9137,493126,68010,813
KotaykRural10116,36494,87621,488
LoriUrban11124,050134,962−10,912
LoriRural1287,532761.5711,375
ShirakUrban1313.3620128,6914929
ShirakRural1496,85677,83219,024
SyunikUrban1590,20565,04425,161
SyunikRural1644,35033,04211,308
TavushUrban1749,85939,21410,645
TavushRural1869,94358,90711,036
Vayots DzorUrban1916,16016,811−651
Vayots DzorRural2031,50125,6785823
YerevanUrban211,098,866824,317274,549
Armenia--2,977,1302,405,869571,261
Notes: Column (2) presents the precinct data aggregated at the strata level. The 2023 election data on the number of voters or adult population and other spatial information are sourced from the Central Electoral Commission of Republic of Armenia [25].
Table 2. Share of the adult population (18+) in Armenia across three independent datasets.
Adult Population
(18 or Older, 2011 Armenia Census)
Adult Population
(18 or older, 2022 World Bank Data and 2011 Armenia Census)
Number of Voters
(18 or Older, 2023 Election Data)
Share in total population77%76%81%
Notes: The 2011 Census data used in Column 1 reports age-specific population, and the share of the population with 18 or older is shown.
Table 3. Overview of major household surveys in Armenia and their corresponding sampling frames.
SurveysSampling Units in the Sampling Frames
Demographic and Health Survey (DHS)EAs from the Armenia Population and Housing Census
Integrated Living Conditions Survey (ILCS)Census Enumeration Areas (EAs)
UNICEF Multiple Indicator Cluster Survey (MICS, first ever in Armenia)The frame developed in this work was used for the upcoming MICS
Table 4. Parameter calibration in the pre-EA tool.
ClassMaximum PopulationMaximum AreaMinimum Length Shared BoundariesArea (Coefficient)Population (Coefficient)Share Factor (Coefficient)
Urban100010 km220%012
Rural80010 km220%012
Table 5. Baseline sample design based on proportional sample allocation.
Stratum Baseline
2022 Population EstimateAllocated
Number of PSUs
Target Number of HHs
(PSU Size)
Number of HHs
Yerevan1,098,866147101470
Aragatsotn—Urban26,73841040
Aragatsotn—Rural98,9491310130
Ararat—Urban72,2941010100
Ararat—Rural186,9832510250
Armavir—Urban82,9531110110
Armavir—Rural183,7032510250
Gegharkunik—Urban65,90291090
Gegharkunik—Rural162,8092210220
Kotayk—Urban137,4931810180
Kotayk—Rural116,3641610160
Lori—Urban124,0501710170
Lori—Rural87,5321210120
Shirak—Urban133,6201810180
Shirak—Rural96,8561310130
Syunik—Urban90,2051210120
Syunik—Rural44,35061060
Tavush—Urban49,85971070
Tavush—Rural69,94391090
Vayots Dzor—Urban16,16021020
Vayots Dzor—Rural31,50141040
Armenia2,977,130400 4000
Notes: The population estimates aggregated at the stratum level are by the end of 2022 and match the population statistics from the Statistical Committee of the Republic of Armenia.
Disclaimer/Publisher’s Note: The statements, opinions and data contained in all publications are solely those of the individual author(s) and contributor(s) and not of MDPI and/or the editor(s). MDPI and/or the editor(s) disclaim responsibility for any injury to people or property resulting from any ideas, methods, instructions or products referred to in the content.