Article

Altitudinal Gradient and Influencing Factors of Carbon Storage in the Gonghe Basin of the Qinghai–Tibet Plateau

1
Key Laboratory of Tibetan Plateau Land Surface Processes and Ecological Conservation (Ministry of Education) & Qinghai Provincial Key Laboratory of Physical Geography and Environmental Process, School of Geographical Sciences & School of National Safety and Emergency Management, Qinghai Normal University, Xining 810016, China
2
Academy of Plateau Science and Sustainability, Qinghai Normal University & Beijing Normal University, Xining 810016, China
3
School of Tourism and Hospitality Management, University of Sanya, Sanya 572000, China
4
State Key Laboratory of Remote Sensing and Digital Earth, Beijing Normal University, Beijing 100875, China
*
Author to whom correspondence should be addressed.
ISPRS Int. J. Geo-Inf. 2026, 15(1), 48; https://doi.org/10.3390/ijgi15010048
Submission received: 7 December 2025 / Revised: 16 January 2026 / Accepted: 19 January 2026 / Published: 21 January 2026

Abstract

Investigating the spatial distribution and dynamics of terrestrial carbon storage is vital for climate change mitigation. However, horizontal spatial analyses often overlook heterogeneity in complex terrains. Here, we focused on the Gonghe Basin on the northeastern margin of the Qinghai–Tibet Plateau, where resource exploitation and ecological conservation interact. By using land use and DEM data and integrating the InVEST model, Geoda, and a geographical detector, we showed the altitudinal gradient effect and spatiotemporal evolution of carbon storage in the Gonghe Basin from 2000 to 2020 and identified the key factors influencing these patterns. Results show the following: (1) From 2000 to 2020, carbon storage in the Gonghe Basin exhibited a distinct pattern of “high at mid-elevations, low at both summit and valley” along the elevation gradient. High-value areas were concentrated in the forest–grassland zone between 2800–4400 m, while low-value areas were distributed in the human activity-intensive zone of 2100–2800 m and the alpine desert zone of 4400–5000 m. (2) The synergistic drivers of carbon storage differed markedly across elevation gradients. The low-elevation zone (2100–2800 m) was characterized by strengthened interactions between vegetation cover and precipitation as well as human activity variables, indicating a coupled natural–anthropogenic driving regime. In the mid-elevation zone (2800–4400 m), interactive effects shifted from vegetation–natural factor coupling to enhanced synergy with social factors such as population density. In the high-elevation zone (4400–5000 m), stable long-term interactions between vegetation and temperature predominated, while sensitivity to interactions involving human activity factors increased. (3) Although natural factors remained dominant, the explanatory power of human activity factors—including GDP density, land-use intensity, and grazing intensity—increased over time across all elevation gradients, suggesting progressively stronger human intervention in carbon cycling. (4) Based on these findings, this study proposes a “three belts–three strategies” synergistic governance framework—“regulation and restoration” for the low-elevation belt, “conservation and efficiency enhancement” for the mid-elevation belt, and “monitoring and early warning” for the high-elevation belt—aiming to enhance regional carbon sink capacity and ecological resilience through zone-specific, targeted interventions. These findings offer a scientific basis for reinforcing regional ecological security and improving carbon sink management.

1. Introduction

Global climate change is exacerbating the spatiotemporal heterogeneity of terrestrial carbon storage [1,2], amplifying the vulnerability of the carbon cycle [3]. Therefore, examining the spatial heterogeneity of carbon storage and clarifying its spatial patterns and dynamic evolution [4,5] are of considerable importance in addressing global climate change, supporting the IPCC’s temperature control targets, and advancing the national dual carbon strategy [6].
Current research on the spatial heterogeneity of carbon storage operates primarily in two dimensions: horizontal and vertical. Studies on horizontal heterogeneity, largely based on land use data [7,8], have shown the distribution of carbon pools at the landscape scale in response to climate gradients, vegetation succession, and land cover transformations [9,10]. In the terrestrial regions of China, such research has predominantly focused on areas such as the Loess Plateau [11] and the Yangtze River Basin [12]. For instance, Lu et al. [13] used GIS technology, statistical models, and the Geodetector, combined with long-term remote sensing and carbon density data, to reveal a temporal pattern of sustained growth with significant phased differences and a spatial pattern of clearly defined hot and cold spots, with spatial heterogeneity closely linked to ecological governance and human activity intensity for carbon storage on the Loess Plateau. Similarly, Zhou et al. [2] used remote sensing inversion and model correction methods alongside contribution rate analysis and the Geodetector. They found that carbon storage in the Dongting Lake Basin followed a temporal trend of first declining, then rising, with an overall increase, and a spatial distribution characterized by a horseshoe-shaped gradient, with significant differences between core areas and loss areas. Beyond the aforementioned cases, studies across different ecological regions have consistently found that carbon storage exhibits “stage-wise fluctuations superimposed on long-term trends” temporally and shows significant clustering and zoning patterns spatially, with high values often corresponding to forest/shrubland areas with high vegetation coverage and low values frequently associated with urban expansion, concentrated cropland, or degraded grassland [14]. In terms of driving mechanisms, natural factors constitute the foundational baseline of the process, vegetation status serves as the pivotal intermediary, and human activities—through disturbances and management intensity—alter vegetation recovery pathways and carbon input processes, thereby exerting a modulating effect on carbon storage and exhibiting the dual characteristics of synergistic enhancement or trade-off suppression between natural and anthropogenic factors [15]. These studies provide typical paradigms and methodological support for understanding the spatiotemporal evolution of carbon storage across different ecological types. However, horizontal-dimensional studies are increasingly recognized as insufficient for analyzing the coupling mechanisms of factors such as topography, climate, and human activities along the vertical dimension. This makes it difficult to explore the heterogeneity and influencing processes of carbon storage in topographically complex regions such as mountains and plateaus. Considering that the spatial distribution of materials and energy exhibits both horizontal and vertical patterns, it is necessary to integrate the altitudinal gradient as a key dimension into the research framework of ecosystem carbon storage. Building on horizontal studies, some studies have begun to focus on the spatiotemporal evolution of carbon storage across different altitudinal gradients. Guo et al. [16], using the InVEST model and terrain gradient analysis, found that carbon storage was higher in areas with steeper terrain gradients. Gai et al. [17] used hotspot analysis and a geodetector to reveal that from 1990 to 2020, carbon storage in the black soil region of the Sanjiang Plain showed no significant change in high terrain gradient areas, concluding that carbon storage was primarily concentrated in low-altitude gentle slopes. These regional-scale studies confirm that terrain gradients can explain the spatial variation in carbon storage by shaping the three-dimensional patterns of terrestrial ecosystems, providing case support for the in-depth analysis of carbon storage distribution in complex terrains and for promoting refined carbon management.
In terms of research methods, the InVEST model can assess carbon storage based on land use and carbon density parameters [8]. In contrast, the PLUS model is suitable for simulating land use pattern evolution at the patch scale and supports multi-scenario predictions [11]. Regarding the identification of driving mechanisms, the Geodetector (GD) and spatial autocorrelation methods (such as Moran’s I) are used to quantify spatial stratified heterogeneity and spatial clustering patterns, respectively. They can further reveal interactive enhancement effects among factors [13]. Meanwhile, geographically weighted regression (GWR) and structural equation modeling (SEM) are employed to uncover the spatial non-stationarity of driving relationships and the pathway relationships among variables, respectively [18], and the vector autoregression (VAR) model is used to characterize dynamic interactions and lagged effects among variables [19]. Despite the continuous enrichment of the methodological system, most existing studies treat elevation merely as a general driving factor in global diagnostics, which can easily obscure differences in dominant factors and their interactive mechanisms across different elevations. Therefore, it is necessary to stratify the study area according to elevation gradients, identify the clustering zones, dominant drivers, and interactive enhancement types of carbon storage within each elevation zone, and reveal the differences and evolutionary patterns of these mechanisms along the elevation gradient.
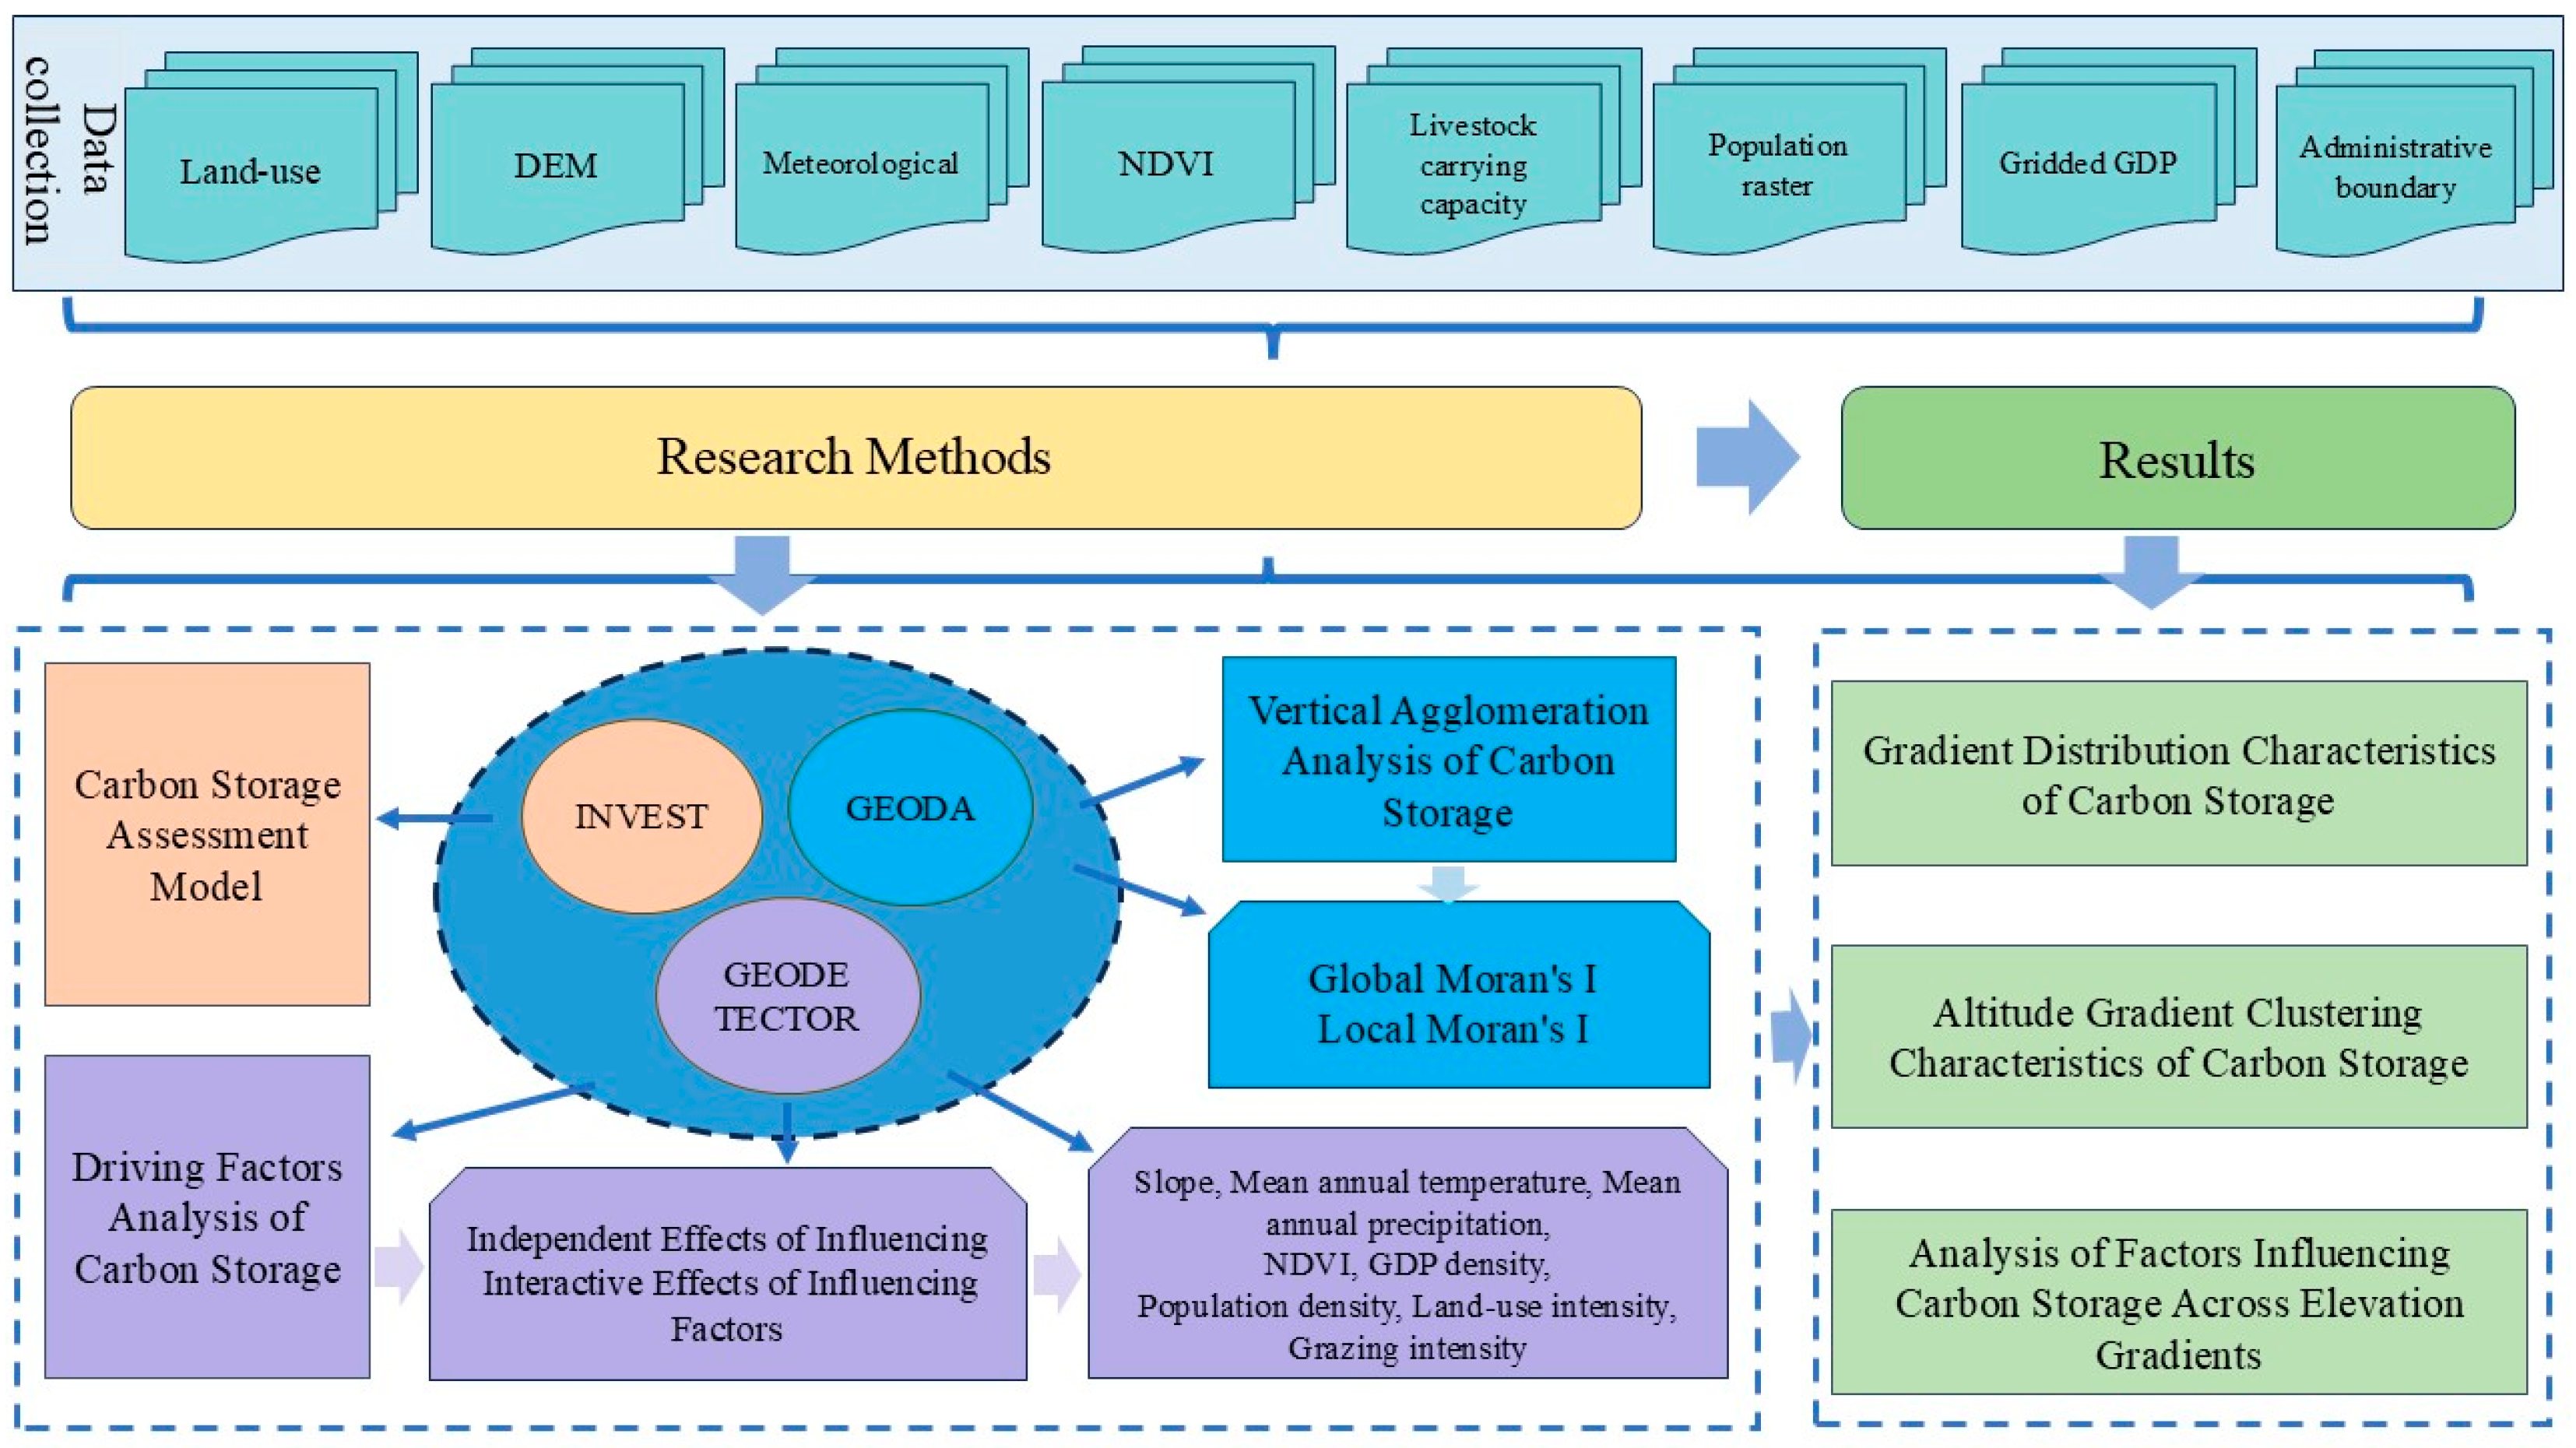
Renowned as the Roof of the World and the Asia Water Tower, the Qinghai–Tibet Plateau undergoes spatiotemporal changes in carbon storage that can exert extensive ecological and climatic influences. An in-depth analysis of its altitudinal gradient effects and influencing factors is of strategic importance for assessing regional carbon sink potential and formulating climate-adaptive ecological conservation and carbon management strategies [20,21]. In this context, some studies have explored the spatiotemporal heterogeneity of carbon storage on plateaus from the perspective of land use transition and the coupling of natural and anthropogenic factors [22,23]. However, these investigations have predominantly focused on horizontal dimensions [13]. The immense altitudinal gradient of the Qinghai–Tibet Plateau drives the formation of vertical ecological zones by shaping hydrothermal patterns [24,25]. Superimposed on human activities, primarily grazing, the spatial distribution of carbon storage across different altitudinal gradients and the interactions among their influencing factors are likely more complex [26,27]. However, the existing research still lacks an integrated analysis of the “pattern-evolution-mechanism” under the framework of altitude gradient, that is, the distribution and agglomeration characteristics of carbon storage with altitude, the differences in the changes of different altitude zones from 2000 to 2020, and the altitude differentiation of the leading role and interaction effect of climate, topography, and human activities. Therefore, it is necessary to incorporate the elevation gradient into the carbon storage research framework to support fine carbon management in complex terrain areas. The Gonghe Basin, located on the northeastern margin of the Qinghai–Tibet Plateau, is a critical ecological barrier and frontline zone for ecological conservation in the upper Yellow River region [28]. As a typical high-altitude, ecologically fragile area, its pronounced altitudinal gradients and diverse ecosystem types make it an ideal region for investigating the response of carbon storage to altitudinal gradients. Therefore, the Gonghe Basin was selected as the study area. From the perspective of altitudinal gradients and based on land use data from 2000 to 2020, combined with methods such as the InVEST model, Geoda, and Geodetector, we aimed to investigate the variation in carbon storage across different altitudinal gradients and their influencing factors (Figure 1). The objective was to supplement the case study knowledge of stereoscopic carbon sinks in localized areas of the Qinghai–Tibet Plateau and provide a scientific basis for carbon management policy formulation, ecological protection, and restoration in high-altitude ecologically fragile regions.

2. Materials and Methods

2.1. Study Area

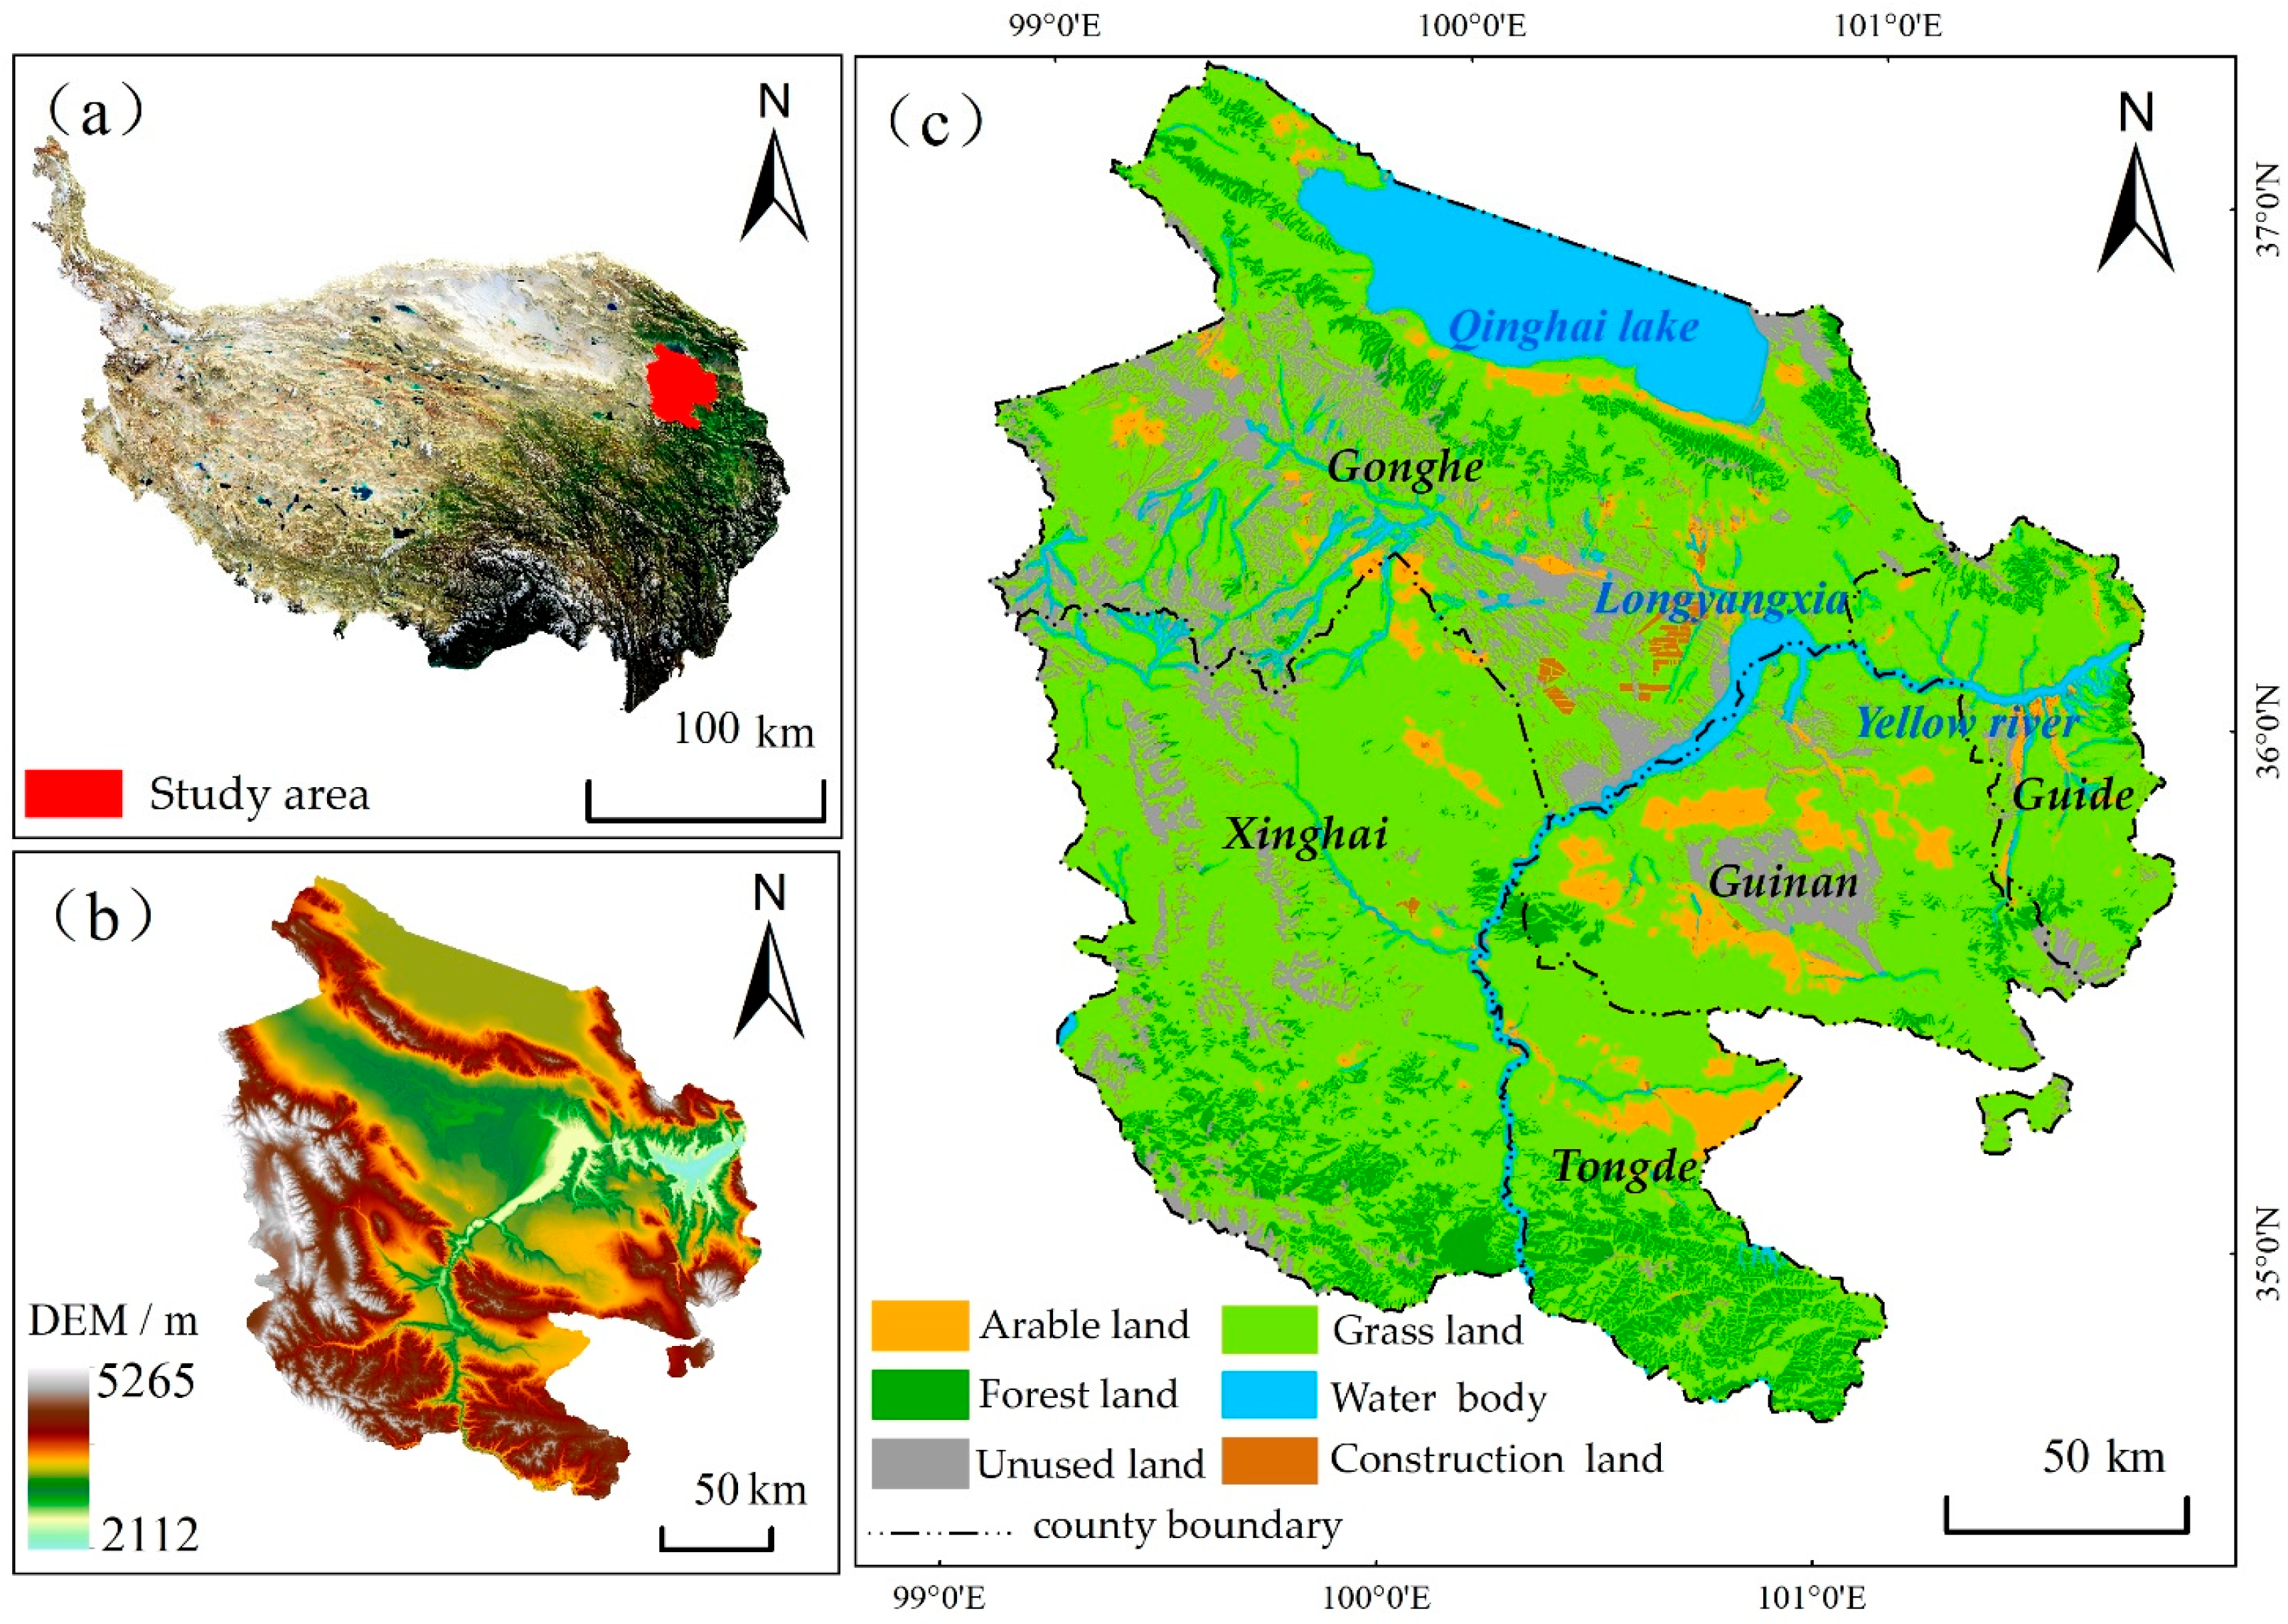
The Gonghe Basin is situated within a tectonic transition zone on the northeastern margin of the Qinghai–Tibet Plateau, representing a boundary area between the Kunlun and Qilian blocks. It is a typical fault basin that developed during the Mesozoic era, spanning approximately 260 km in width from east to west and 270 km in length from north to south, covering a total area of 43,400 km2. Administratively, it falls under the Hainan Tibetan Autonomous Prefecture in Qinghai Province, China, and encompasses the counties of Gonghe, Guide, Xinghai, Guinan, and Tongde (Figure 1). The basin’s overall topography tilts from northwest to southeast at a dip angle of 3° to 10°, with elevations ranging from 2112 m to 5265 m and vertical relief exceeding 3150 m. This elevation creates a complex gradient environment that traverses multiple vertical climatic and ecological zones. Under an arid to semi-arid plateau climate, this pronounced verticality leads to altitudinal variations in hydrothermal conditions, which, in turn, support a diverse array of landscapes, including mountains, waters, forests, farmlands, lakes, grasslands, and sandy areas. These characteristics establish the Gonghe Basin as a quintessential region on the Qinghai–Tibet Plateau, which is known for its well-defined yet complex vertical zonation of ecosystem types. Therefore, it is an ideal transect for elucidating the spatial heterogeneity of carbon storage across altitudinal gradients. Due to the rich and diverse ecological environment shaped by its geological structure and substantial altitudinal gradient, the Gonghe Basin has also become a focal area for the concentrated development of industries such as agriculture and animal husbandry, mineral and energy resources, and tourism services on the Qinghai–Tibet Plateau. Consequently, human activities exhibit distinct vertical zones that are primarily concentrated in relatively low-altitude river valleys, lake basins, and piedmont zones. This concentration has created a distinct disturbance pattern in carbon storage across different elevational bands. Therefore, investigating the variation of carbon storage along these altitudinal gradients in the Gonghe Basin can provide theoretical support for the construction of ecological barriers under the dual carbon strategy and offer crucial guidance for formulating differentiated ecological protection and restoration policies.

2.2. Data Sources and Preprocessing

In this study, we primarily used land use, Digital Elevation Model, meteorological, Normalized Difference Vegetation Index (NDVI), and socioeconomic data for 2000, 2010, and 2020 (Table 1). Land use data were obtained from the Resource and Environmental Science Data Centre of the Chinese Academy of Sciences. The data were processed, including raster projection and attribute reclassification, for carbon storage estimation and influencing factor analysis. DEM data sourced from the National Tibetan Plateau Data Center were processed using mosaicking, clipping, and filling sinks. These data formed the basis for analyzing carbon storage changes and defining altitudinal gradients. Meteorological data, including precipitation and temperature for 2000, 2010, and 2020, were obtained from the National Earth System Science Data Center. These datasets were subjected to format conversion, projection, and clipping to analyze the factors influencing carbon storage. NDVI data were derived from Landsat series satellite NDVI products. Annual maximum value composites (MVC) were generated to minimize noise, and outliers were removed. The processed NDVI data were used to analyze the factors influencing carbon storage changes.
Socioeconomic data comprised livestock-carrying capacity, population, and spatially distributed GDP raster data. Livestock carrying capacity data were obtained from the National Tibetan Plateau Data Centre. Population and GDP spatial distribution raster datasets were sourced from the Resource and Environment Science and Data Center of the Chinese Academy of Sciences. All datasets—livestock carrying capacity, population, and GDP—were subjected to spatial extraction and unit standardization to ensure consistency before being used in the analysis of factors influencing carbon storage changes.
To avoid the influence of administrative division adjustments, the administrative division data from the 2024 edition of the China National Basic Geographic Information Database (Review Map Number: GS (2024) 0650) were used to ensure that all data space ranges were consistent and to avoid data deviation caused by boundary changes. Albers’ equal-area conic projection was used to avoid the area distortion associated with projection transformations, ensuring computational accuracy.
Considering the regional focus of this study and the need for scale compatibility in multi-source data fusion, all raster layers were resampled to a uniform 3 km × 3 km grid. This resolution is sufficient to capture broad altitudinal gradients and reduce local extreme values, thereby highlighting dominant spatial patterns at the regional scale. This grid size is appropriate for depicting regional altitudinal gradients while potentially smoothing fine-scale heterogeneity [20,26].
This study selects 2000, 2010, and 2020 as typical time points, mainly based on the dual considerations of climate stage transition and policy implementation. In terms of climate, around 2000 was a critical period for the transformation of the Qinghai-Tibet Plateau from “warm and dry” to “warm and humid”. In 2010, the trend was further consolidated and accelerated. By 2020, the cumulative effect of climate change and the impact of extreme events will be more significant. The three can characterize the changes in carbon stocks under different climate backgrounds [6]. In terms of policy, the year 2000 can be used as a background reference before and after the launch of ecological projects such as China’s “Western Development” and the initial implementation of regional land use planning. In 2010, it was at the end of the first ten-year planning period that is suitable for evaluating the phased policy effect. The background of the “double carbon” goal and the end of the “13th Five-Year Plan” in 2020 can reflect the latest impact of changes in human activity patterns on carbon stocks in recent years [29]. These three time points together constitute the key years of the superposition of climate fluctuations and human activities.

2.3. Research Methods

In this study, a carbon storage assessment model was used. Based on the distribution and spatial clustering of carbon storage along the altitudinal gradient, it delineates and elucidates the heterogeneous patterns of carbon storage across this gradient in the Gonghe Basin. We aimed to reveal the evolutionary characteristics of carbon storage at different elevations and analyze the influencing factors of natural drivers and human activities within this vertical dimension. The objective of this study is to provide spatial guidance for ecological restoration and sustainable development strategies in this region (Figure 2).

2.3.1. Carbon Storage Assessment Model

InVEST is a suite of models designed to assess ecosystem service functions. It aims to simulate changes in the physical quantity of ecosystem services under different land cover scenarios, providing spatially explicit simulation outcomes [30,31]. Within the InVEST model, the carbon module served as a proxy for quantitative assessment. A higher carbon storage value indicates a greater capacity of the ecosystem to absorb and store atmospheric carbon dioxide [32,33]. This calculation is expressed as follows:
C = C a b o v e + C b e l o w + C s o i l + C d e a d
where C represents the total ecosystem carbon storage (t); C a b o v e denotes the aboveground biomass carbon storage (t), primarily encompassing carbon in all living vegetation above the soil surface; C b e l o w signifies the belowground biomass carbon storage (t), referring to carbon stored within plant root systems; C s o i l indicates the soil organic carbon storage (t), mainly consisting of organic carbon in the soil, which originates from the decomposition products of plant residues, animal remains, and microorganisms; C d e a d represents the dead organic matter carbon storage (t), chiefly comprising organic carbon contained in dead vegetation and litter. The carbon module of the InVEST model requires two primary datasets: land use/cover data and a biophysical table of carbon density. Previous studies have shown that the InVEST model can be effectively applied to the carbon storage assessment and spatial pattern analysis of the Qinghai–Tibet Plateau and similar ecologically fragile areas by regional localization correction of key parameters of the model [22,34]. This study systematically collected and integrated the published literature and related statistical data in the study area and surrounding areas [11,28], and localized the various carbon density parameters required for the model (see Table 2), thus ensuring the applicability of the model in the study area and the reliability of the estimation results.

2.3.2. Vertical Agglomeration Analysis of Carbon Storage

Global spatial autocorrelation analysis quantifies the spatial dependence of data, revealing their distribution patterns. Consequently, we used global spatial autocorrelation to analyze the vertical agglomeration of carbon storage in the Gonghe Basin. Building upon this, local spatial autocorrelation was used to explore the spatial associations and dependence features between specific local areas and their neighboring regions regarding carbon storage [35]. The formulas are as follows:
G l o b a l   M o r a n ’ s   I = n × ∑ i = 1 n ∑ j = 1 n W i j ( x i − x ¯ ) ( x j − x ¯ ) ( ∑ i = 1 n ∑ j = 1 n W i j ) ∑ i − 1 n ( x i − x ¯ ) 2
L o c a l   M o r a n ’ s   I = n ( x i − x ¯ ) ∑ j = 1 n ( x j − x ¯ ) ∑ i = 1 n ( x i − x ¯ ) 2
where n denotes the number of spatial grid units; x i and x j are the attribute values of spatial units i and j , respectively; W i j represents the spatial weight matrix between units; and the value of Global Moran’s I ranges from [−1, 1], where a larger absolute value indicates stronger spatial autocorrelation. The local Moran’s I includes four types: high-high (H-H), low-low (L-L), high-low (H-L), and low-high (L-H). These represent clusters of units with high carbon storage, clusters of units with low carbon storage, a high-carbon storage unit surrounded by low-carbon storage units, and a low-carbon storage unit surrounded by high-carbon storage units [26].

2.3.3. Comparative Insights from Violin and Box Plots

The violin plot displays the central tendency of carbon storage and shows the density distribution of the data through the shape of its body. The width at different positions represents the density of data points near the corresponding value range. A greater width at a specific location indicates a higher concentration of data points near that value range, meaning that the data distribution is denser. Conversely, a narrower width suggests fewer data points in that value range, indicating a sparser distribution. This allows for intuitive observation of whether the data distribution is concentrated or dispersed across various elevation gradients. The box plot primarily displays the five-number summary of the data: the minimum, first quartile (Q1), median (Q2), third quartile (Q3), and maximum values, as well as any potential outliers. The length of the box (interquartile range, IQR = Q3 − Q1) reflects the dispersion of the middle 50% of the data. A larger IQR indicates greater dispersion in the central portion of the dataset. The line inside the box represents the median, reflecting the central tendency of carbon storage. The whiskers of the box plot typically represent the data range, usually extending from the minimum to the maximum values. The box plot primarily focuses on presenting the fundamental statistical characteristics of the data, such as its position and dispersion [36].

2.3.4. Driving Factor Analysis of Carbon Storage

The Geodetector method overcomes the limitations of traditional statistical methods regarding linear assumptions, enabling the quantification of the impact of each factor on the spatial heterogeneity of carbon storage. This allowed for a systematic analysis of the coupled effects of natural and anthropogenic factors on carbon storage. Therefore, we used the factor and interaction detector modules of the Geodetector to investigate the driving factors of carbon storage in the Gonghe Basin and the interactions between different factors [37,38]. The factor detector is calculated as follows:
q = 1 − 1 N σ 2 ∑ h = 1 L N h   σ h 2
where q represents the explanatory power of a given indicator on the spatial heterogeneity of carbon storage; h = 1, 2, …, L denotes the number of stratifications; N and N h represent the total number of units in the entire study area and in stratum h , respectively; σ 2 and σ h 2 denote the variance of the entire area and stratum h , respectively. The value of q ranges from 0 to 1, where a higher value indicates a greater influence of the factor on the spatial heterogeneity of carbon storage. Interaction detection assesses the synergistic effects of two factors on the spatial heterogeneity of carbon storage by comparing the q values of the individual factors and their interactions. The interactions between these factors can be categorized into five types: nonlinear weakening, univariate weakening, bivariate enhancement, independence, and nonlinear enhancement [37].
Carbon storage is significantly influenced by climate change and human activity. When these influences exceed the self-regulating capacity of an ecosystem, they can easily lead to an imbalance in the structure and function of the system, triggering ecological degradation [38,39]. Similarly, in the geographical unit of the Gonghe Basin, climate, topography, and human activities regulate the spatial distribution of carbon storage. Therefore, we selected slope (SLOPE), mean annual temperature (MAT), mean annual precipitation (MAP), NDVI, GDP density (GDPD), population density (PD), and land-use intensity (LUI) as independent variables influencing the spatial pattern of carbon storage. Considering that grazing is the primary human activity in the study area and that overgrazing is an issue [40,41], grazing intensity (GI) was also included as an independent variable to characterize the degree of disturbance caused by grazing activities on carbon storage. Land use intensity is an intuitive reflection of the intensity of human activity. This study refers to the conversion coefficients for construction land equivalents of different land-use types [37] and the actual situation in the Gonghe Basin [28], determining the coefficients as follows: cropland 0.54, woodland 0.11, grassland 0.25, water bodies 0.12, construction land 1, and unused land 0.08 [26]. The input variables for the geographical detector require categorical data, which necessitate the discretization of continuous variables [42]. Therefore, this study refers to the data discretization method proposed by Wang et al. [37] and selects the natural break method for discretizing continuous variables. This approach aligns with the requirement of the Geographical Detector to maximize inter-stratum differences, allowing it to reveal the most authentic and significant spatial stratification structure based on the data itself, thereby ensuring the reliability and validity of subsequent factor detection and interaction detection analyses. Through repeated verification, a total of 4930 sampling points were extracted as operational data for the geographical detector to quantitatively analyze the independent influences of various factors on the spatial differentiation of carbon storage and their interactive effects to reveal the distribution patterns of carbon storage in the Gonghe Basin.

3. Results

3.1. Gradient Distribution of Carbon Storage

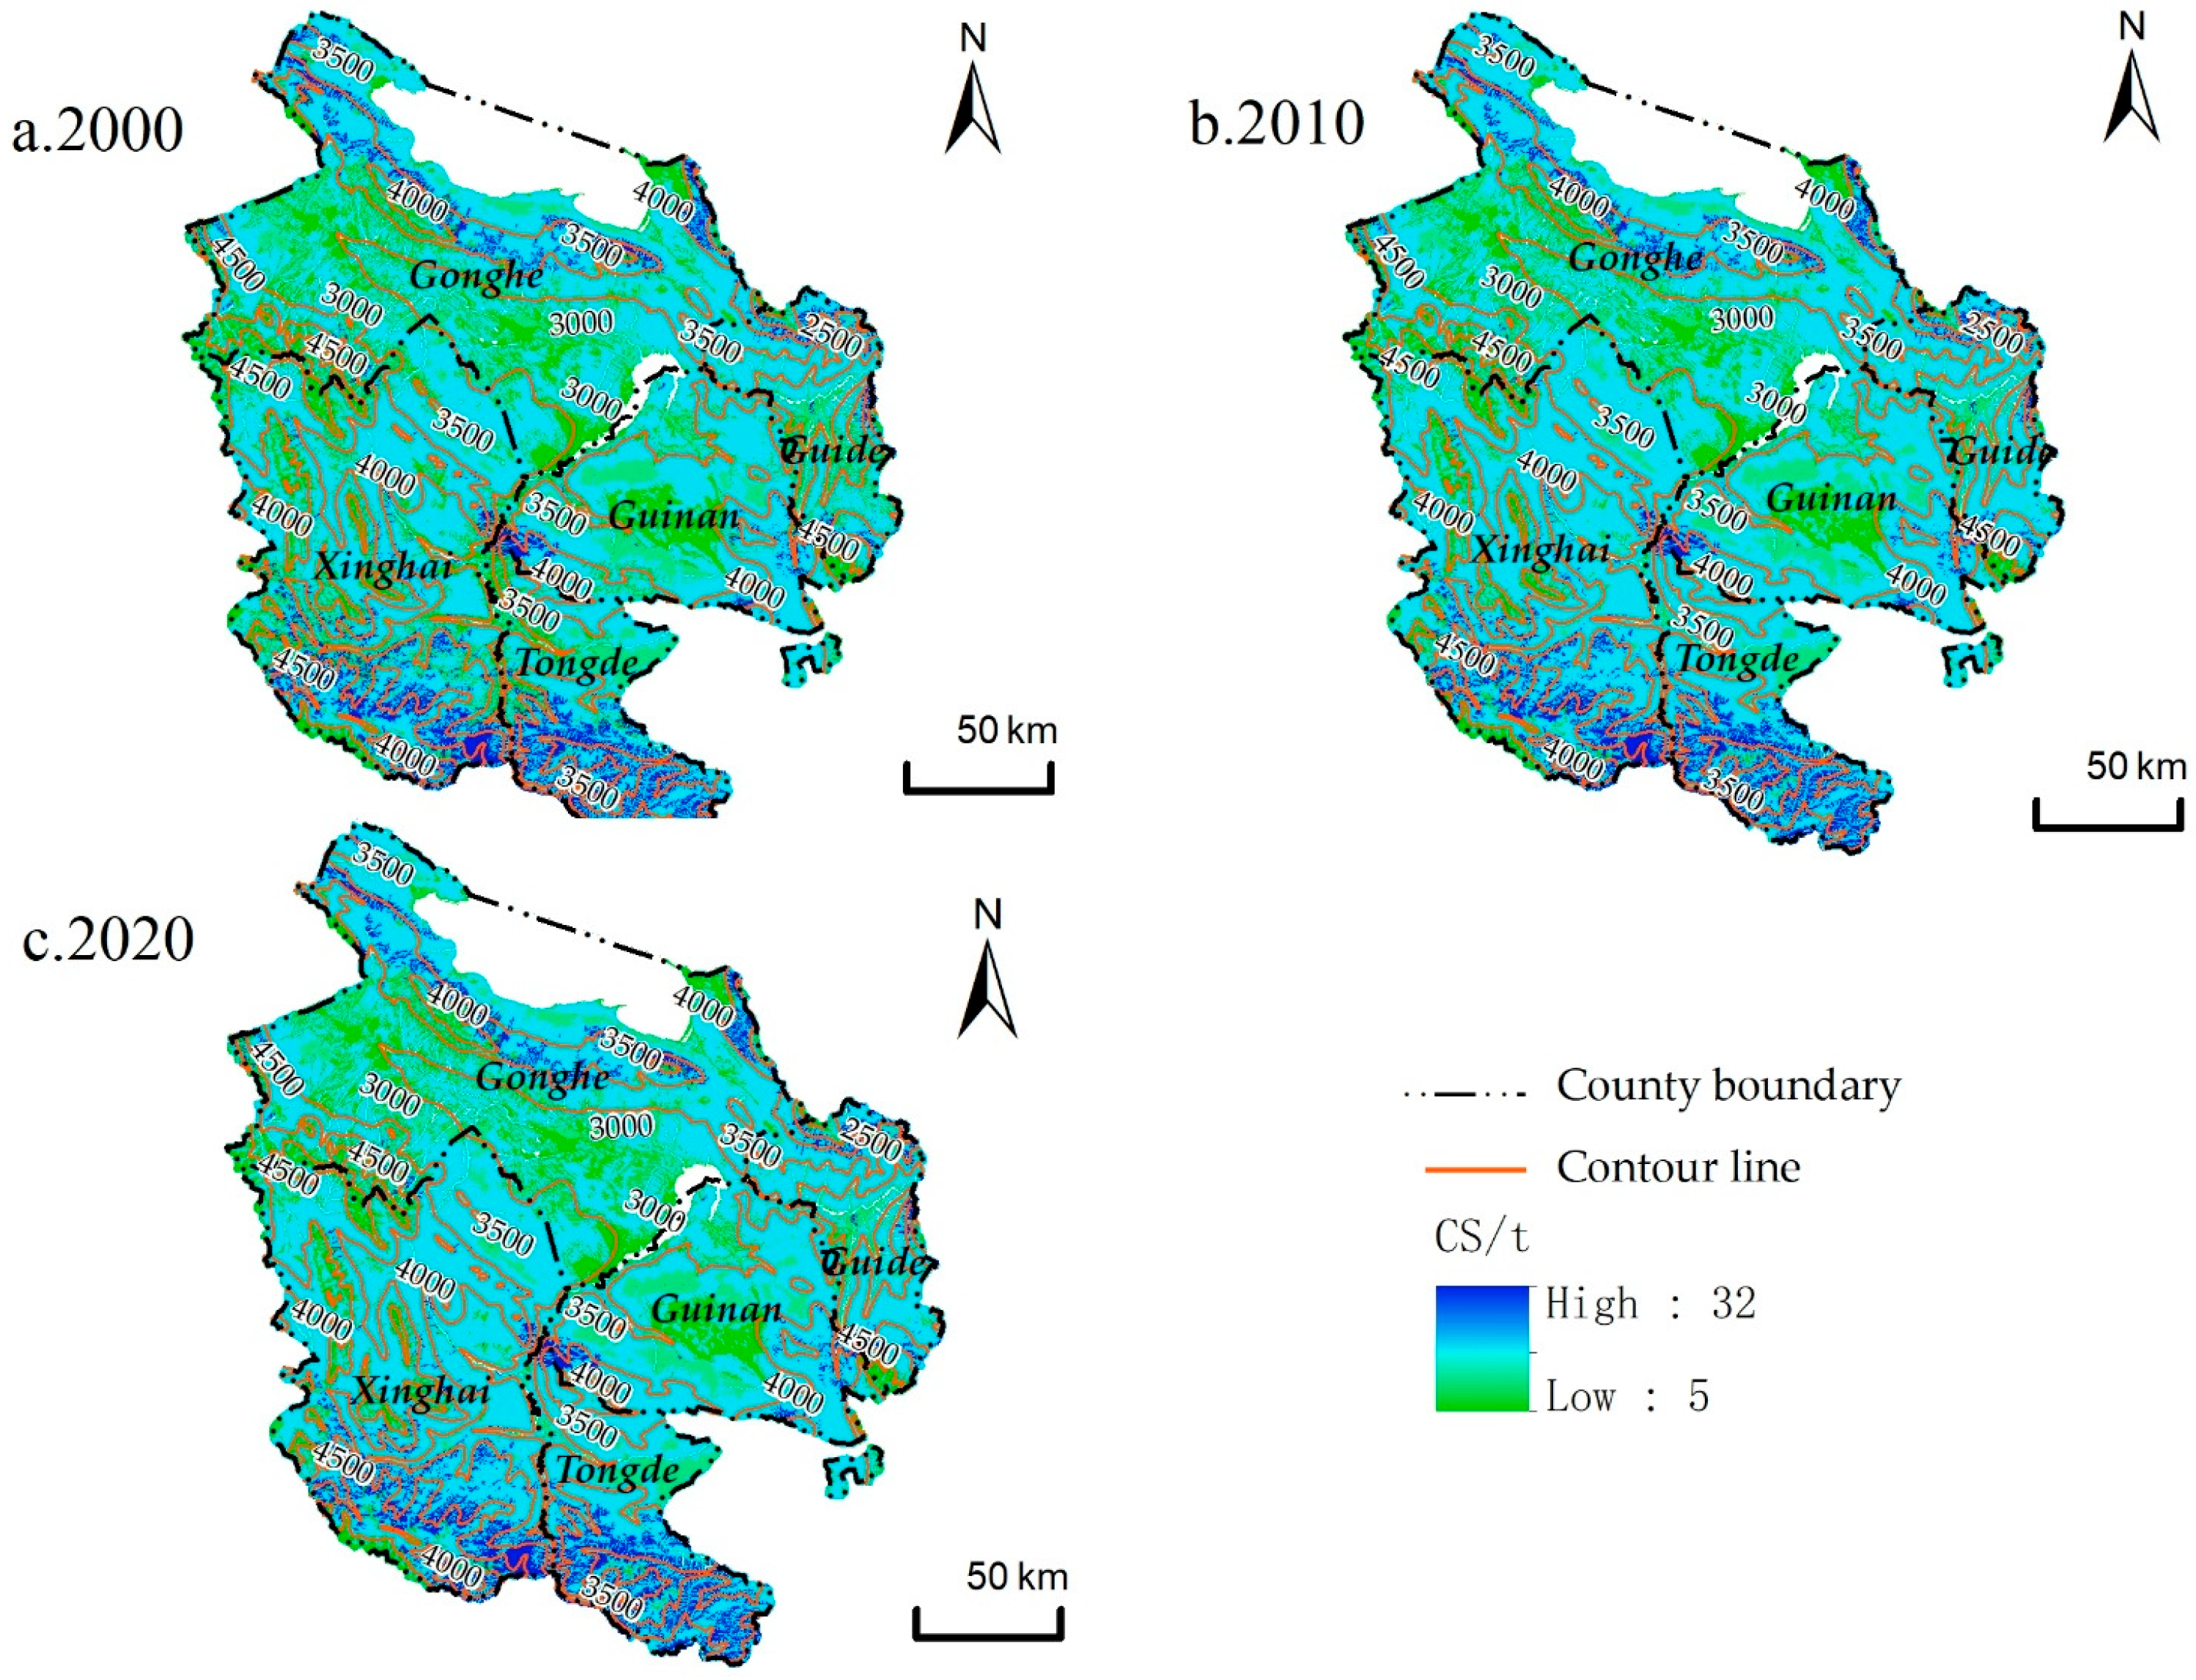
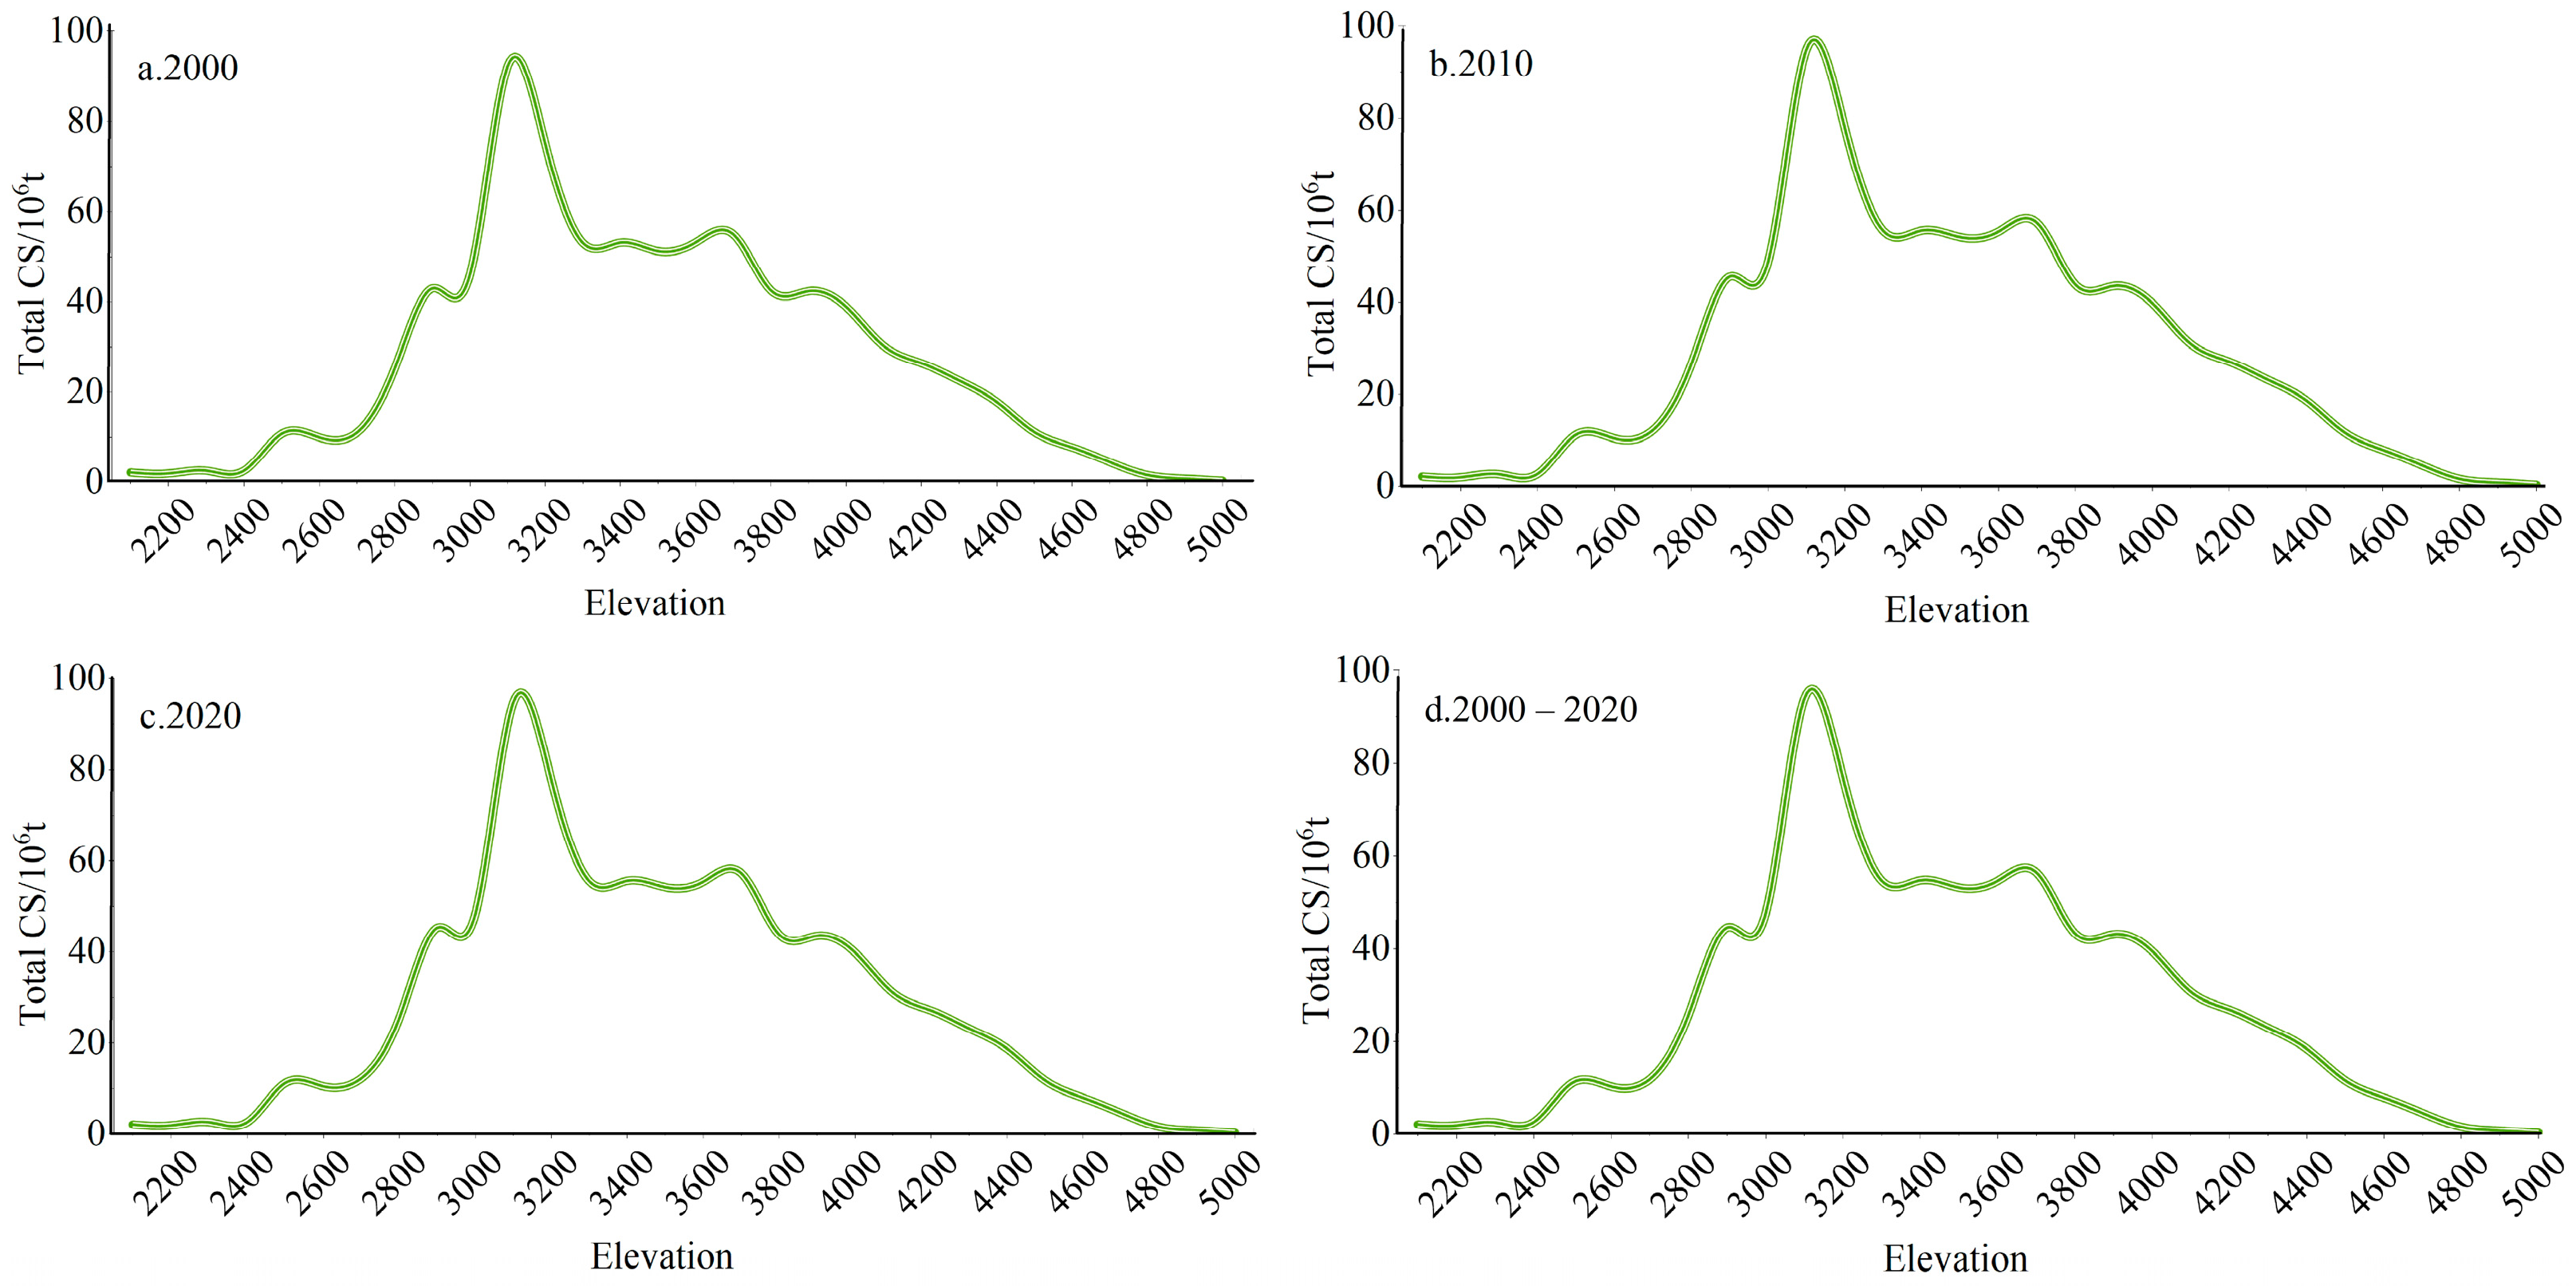
Figure 3 illustrates the spatial distribution of carbon storage at three time points, 2000–2020, in the Gonghe Basin. Combined with the contour lines in the figure, the carbon storage in the area below 3000 m above sea level is low and is mainly distributed in the southwest of Gonghe County, the middle of Guinan County and Guide County, north of Tongde County, and other areas dominated by cultivated and construction land. Carbon storage at altitudes of 3000–4000 m remains high and is concentrated in forest and grassland areas such as Nanshan, Qinghai Lake, Gonghe County, Xinghai County, and the southern part of Tongde County. Areas above 4000 m above sea level are restricted by low temperatures and frozen soil, and their carbon storage capacity is weakened. It is scattered along the border between southern Guide County and southwestern Xinghai County. Based on the carbon storage variation curves across different elevational gradients from 2000 to 2020 (Figure 4), it was further verified that carbon storage in the Gonghe Basin did not exhibit a simple increasing or decreasing trend with elevation. Instead, the curves accurately reflect distinct variation patterns at different altitudes. Between 2100 and 2800 m, carbon storage showed a slow increasing trend with increasing elevation, which is likely related to improved moisture conditions and enhanced vegetation cover that increase carbon inputs. In the range of 2800–3300 m, it first increased sharply and then declined rapidly, peaking at approximately 3100 m, where hydrothermal conditions are most favorable for forest development, representing an optimal zone for water–heat matching and vegetation growth with the strongest carbon accumulation capacity. From 3300 to 3700 m, total carbon storage remains stable at approximately 60 × 106 t, indicating a zone of relative stability, where the vegetation is primarily alpine meadow, and relatively small variations in hydrothermal conditions and vegetation structure, combined with minimal human disturbance, help maintain overall stability in the carbon sequestration process. At an altitude of 3700–5000 m, carbon storage continued to decline, but the downward trend was relatively flat. With a further increase in elevation, the carbon storage gradually tended to 0, mainly limited by lower temperatures, shorter growing seasons, and vegetation sparsity, which significantly reduced the biomass available for carbon fixation. Between 2100 and 5000 m, carbon storage exhibited a fluctuating pattern with elevation, which corresponded well with the vertical vegetation zonation shaped by typical hydrothermal conditions in the plateau, mountain, and valley regions, as shown in Figure 1c.

3.2. Altitude Gradient Clustering of Carbon Storage

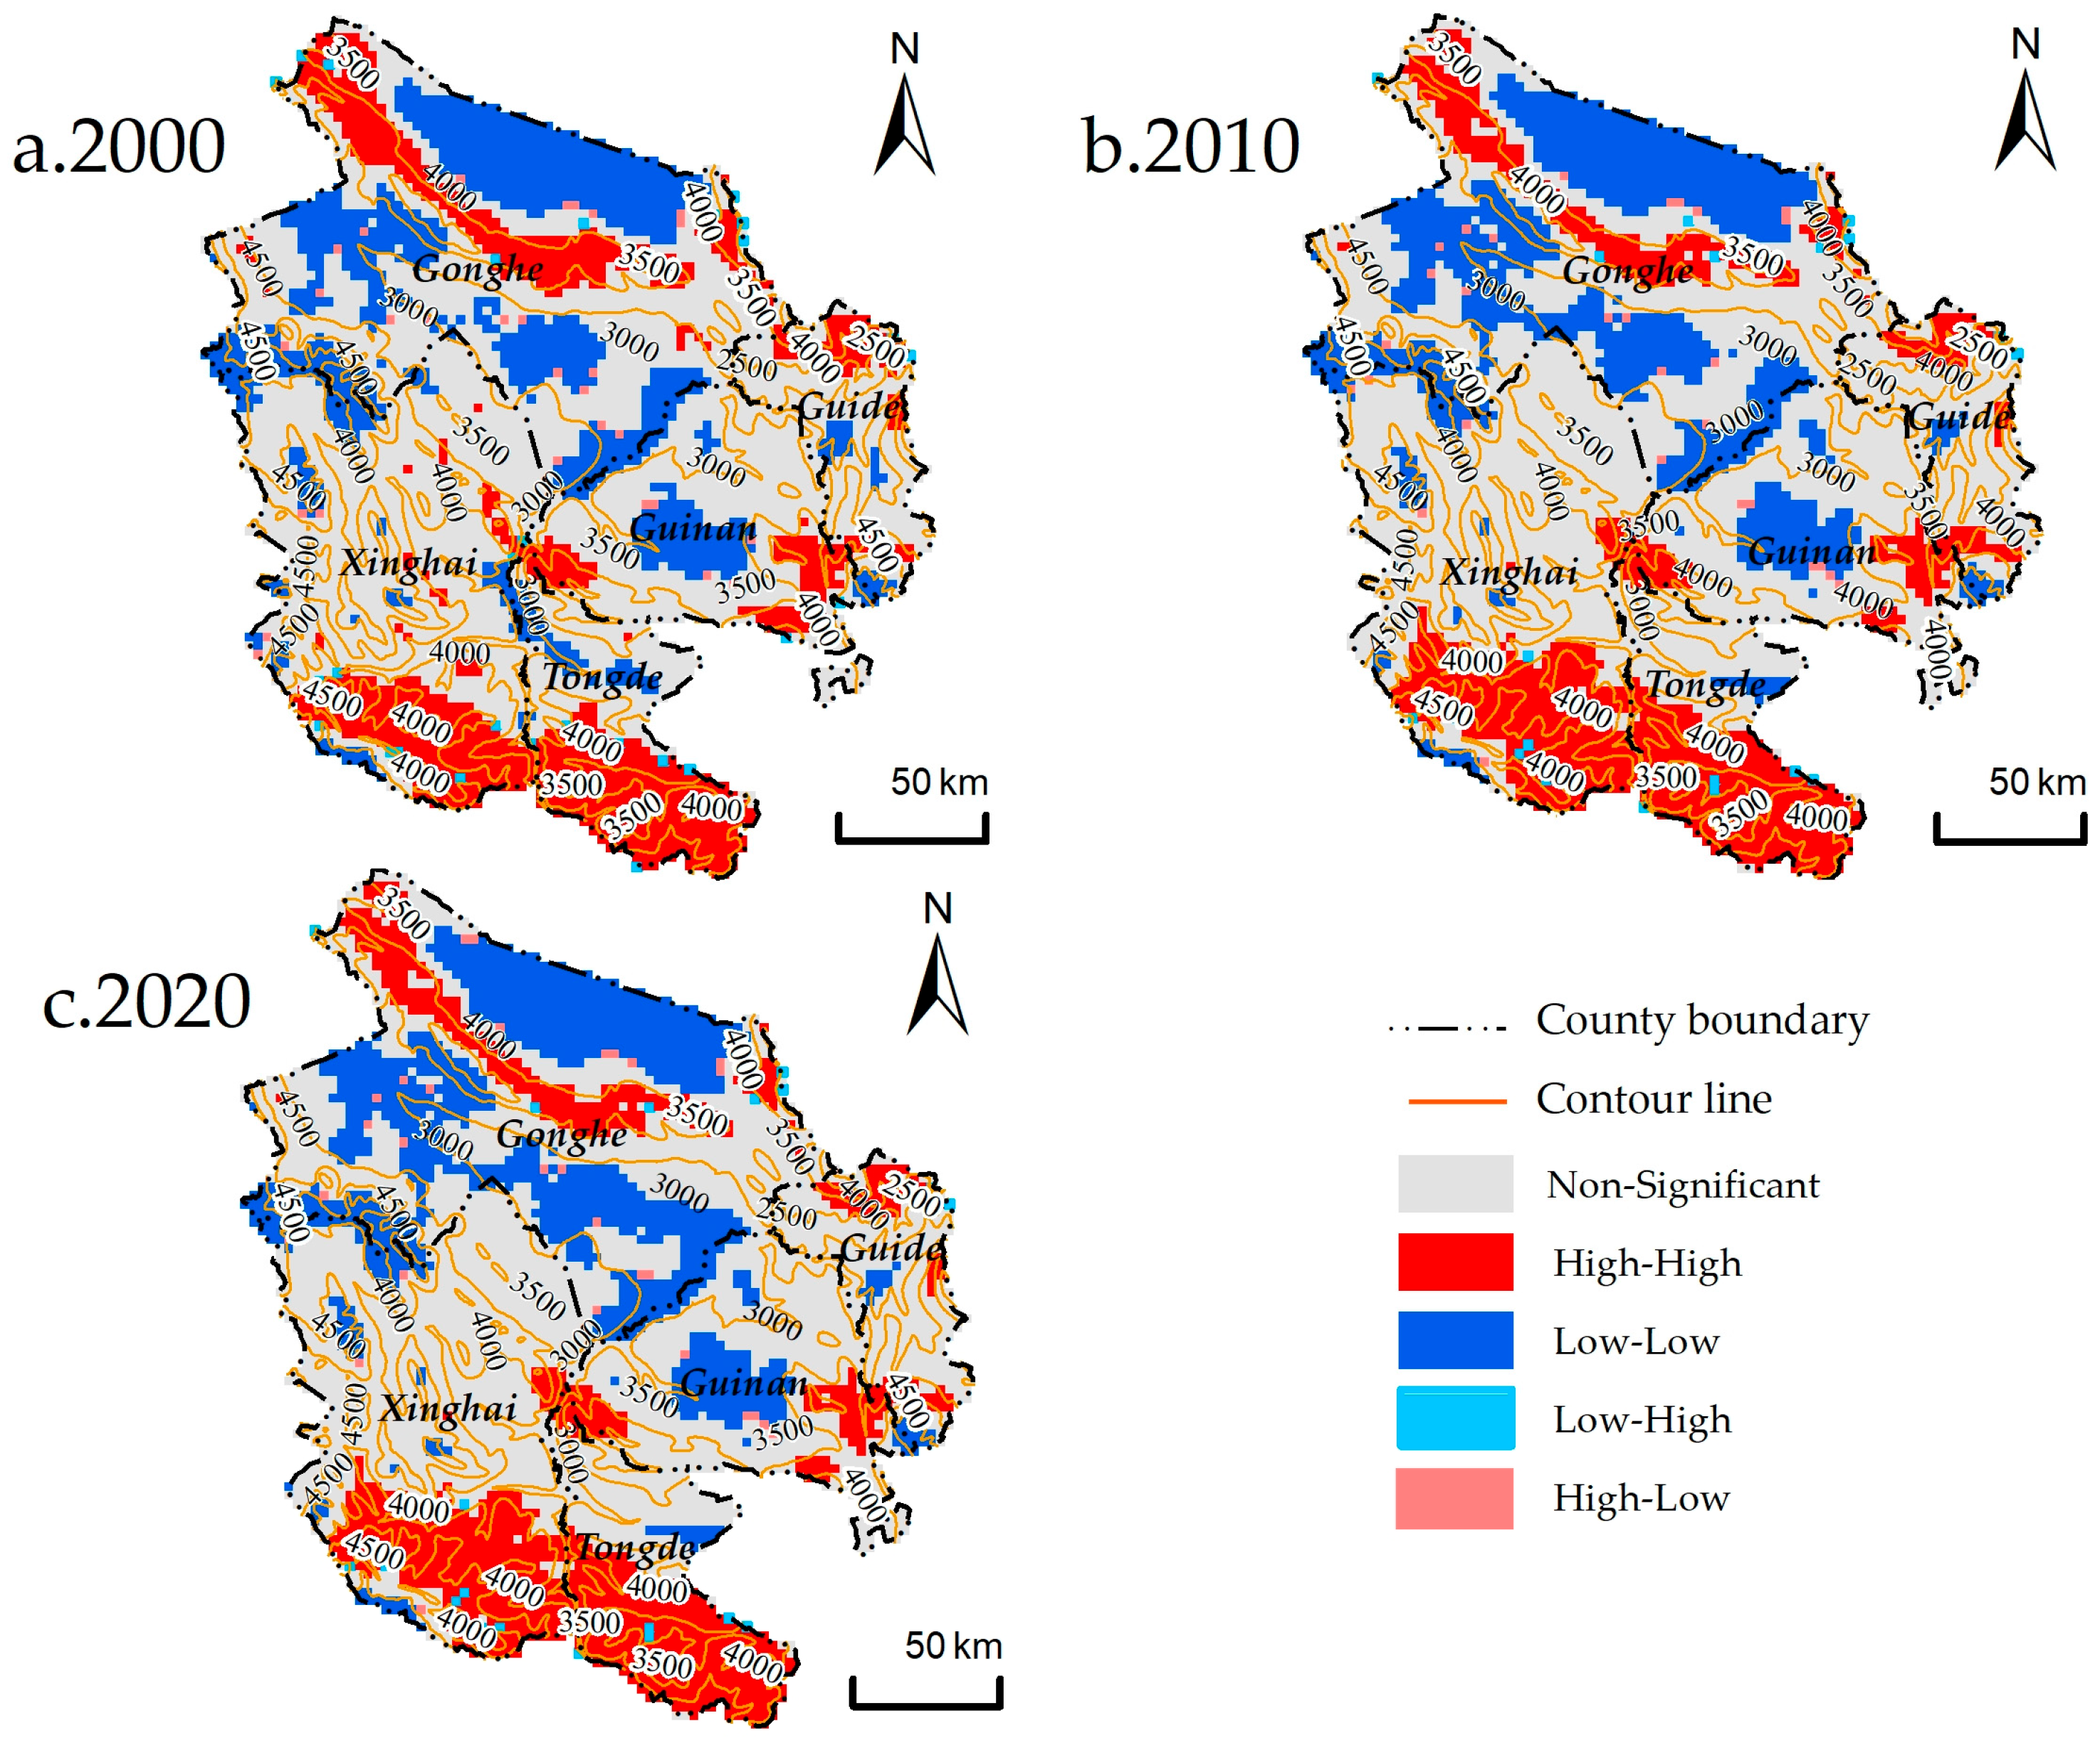
Figure 5 presents the spatial autocorrelation clustering of carbon storage in the Gonghe Basin on the Qinghai–Tibet Plateau for 2000, 2010, and 2020, along with their temporal changes. The global Moran’s I values for carbon storage in the Gonghe Basin from 2000 to 2020 were 0.754, 0.771, and 0.772, respectively, all of which passed the significance test at the 95% confidence level. This shows that the carbon reserves in the Gonghe Basin have significant positive spatial autocorrelation characteristics; that is, the carbon reserves show a certain degree of agglomeration along the altitude gradient in space. The high-high clustering areas were mainly concentrated between 2800 and 4400 m above sea level and were primarily distributed in Xinghai County, the southern part of Tongde County, and the area around Qinghai Lake in Gonghe County. The vegetation types in this region are predominantly woodlands and grasslands, which have high carbon storage capacities. Low-low clustering areas were mainly found between 2100–3500 m and 4200–5000 m. The low-low clusters in the 2100–3500 m range were mainly located in the southwestern basin of Gonghe County, around Qinghai Lake and the Longyangxia Reservoir, and in the central part of Guinan County. Land use in this area is characterized by water bodies and deserts with relatively low elevations and is significantly influenced by lakes, rivers, and topography. Low-low clusters in the 4200–5000 m range were sporadically distributed in the southernmost part of Guide County and the northwestern/western border areas of Xinghai County. Low-high and high-low clusters were sporadically distributed between 2600 and 4700 m but constituted a relatively small proportion.
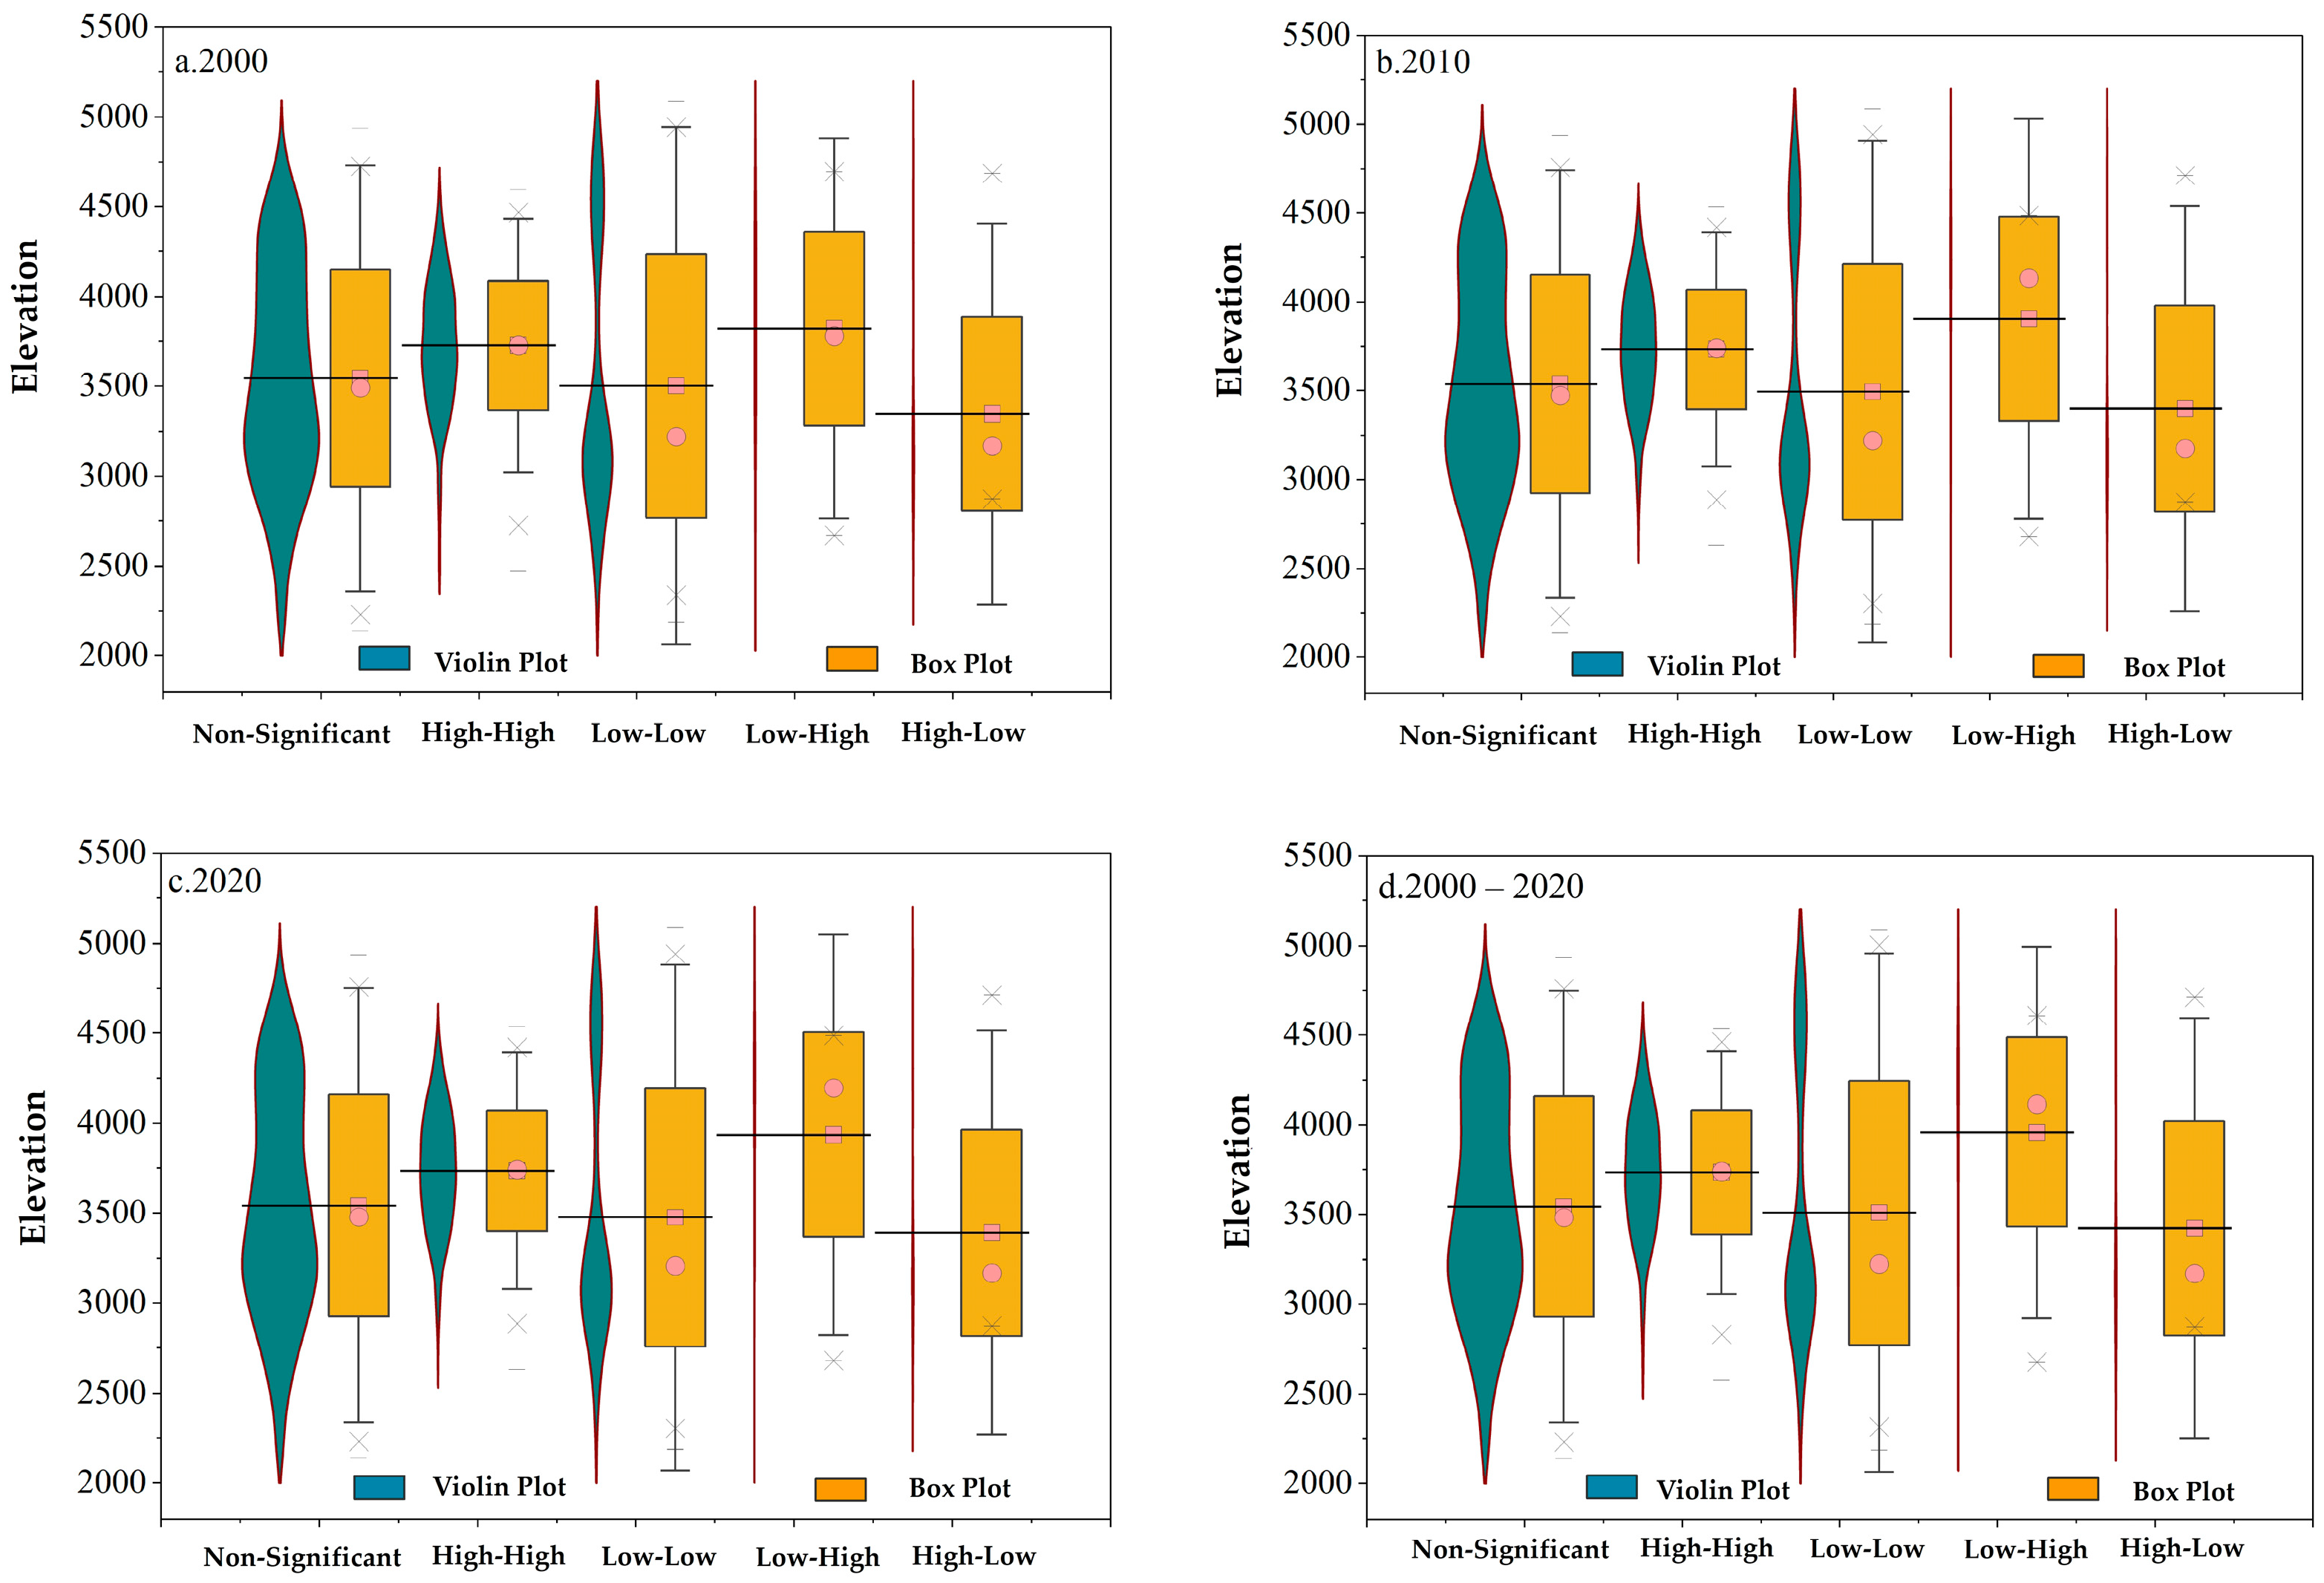
The violin-box plot in Figure 6 further illustrates the clustering relationships of carbon stocks at different elevation gradients in the years 2000, 2010, and 2020. The violin diagram showed that there are differences in the distribution density and quantity of carbon storage in high-high, low-low, low-high, and high-low aggregations at different altitudes (Figure 6). High-high clusters were primarily concentrated between 2800 4400 m, maintaining a relatively stable density and data volume throughout 2000–2020. The low-low clusters were mainly distributed in two elevation ranges, 2100–3500 m and 4200–5000 m, with observable changes in violin plot widths during 2000–2020 showing decreased distribution density and quantity in the 2100–3500 m range, but slight increases in the 4200–5000 m range. The low-high and high-low clusters demonstrated relatively scattered distributions with minor variations in violin plot widths from 2000 to 2020, showing increased distribution density and quantity for low-high clusters within 3500–4600 m. Meanwhile, high-low clusters exhibited increased density and quantity within 2800–3300 m, but relative decreases within 3300–4700 m. The stable morphological patterns of violin plots for non-significant clusters across years indicate minimal changes in the concentration of carbon storage data distribution within the corresponding 2100–5000 m elevation range.
Based on box plot analysis, it was found that from 2000 to 2020, the high-high, low-low, low-high, and high-low clusters of carbon storage were relatively concentrated within the elevation range of 3800–4000 m. Meanwhile, across the entire elevation gradient, the degree of dispersion and spatial distribution of the carbon storage clusters showed noticeable variations (Figure 6). In terms of the interquartile range (IQR), the high-high clusters displayed shorter boxes with smaller IQRs, indicating a concentrated carbon storage distribution between 3300 and 4100 m. Conversely, the non-significant, low-low, low-high, and high-low clusters exhibited longer boxes with larger IQRs, reflecting relatively dispersed carbon storage distributions. Regarding the median values, the elevation corresponding to the carbon storage median for low-high clusters increased from 3779 m in 2000 to 4195 m in 2020, indicating an upward elevational shift. Similarly, the median elevation for high-high clusters increased from 3727 m to 3740 m during the same period. High-low clusters maintained relatively lower carbon storage medians, with an average elevation of 3171 m, while low-high clusters showed higher medians, averaging 4113 m. The dispersed distributions observed in the low-low, low-high, and high-low clusters contrast with the relative concentration of high-high clusters. This is potentially attributable to local environmental conditions, climatic factors, and vegetation influences that shape the spatial patterns of carbon storage distribution across different locations.
Although the clustering distribution of carbon storage in the Gonghe Basin differs across years and altitude gradients in terms of density, quantity, and dispersion degree, it still shows a significant altitude-gradient effect, and the overall spatial and temporal distribution is complex, dynamic, stable, and locally evolving. High carbon storage values were concentrated in the 2800–4400 m altitude interval, an area dominated by forest and grassland (Figure 1c) with high vegetation cover, forming the core area of high carbon storage. Low-carbon storage areas are primarily distributed in two altitudinal zones: first, the valley and basin areas between 2100 and 2800 m, characterized by frequent human activity, lower vegetation cover, and dominance by cropland, construction land, and some unused land, resulting in significantly lower carbon storage (Figure 1c); second, the high-altitude alpine region between 4400 and 5000 m, where natural constraints such as low temperatures and permafrost limit land use to types such as alpine desert and bare rock, resulting in very weak carbon storage capacity (Figure 1c). Therefore, to determine the factors influencing carbon storage across different altitudinal gradients, we focused on analyzing these factors within the three gradients of 2100–2800 m, 2800–4400 m, and 4400–5000 m. This study aimed to identify the dominant factors and their interactive effects within each gradient, providing a scientific basis for tailoring strategies to enhance regional carbon storage capacity.

3.3. Analysis of Factors Influencing Carbon Storage Across Elevation Gradients

3.3.1. Independent Effects of Influencing Factors

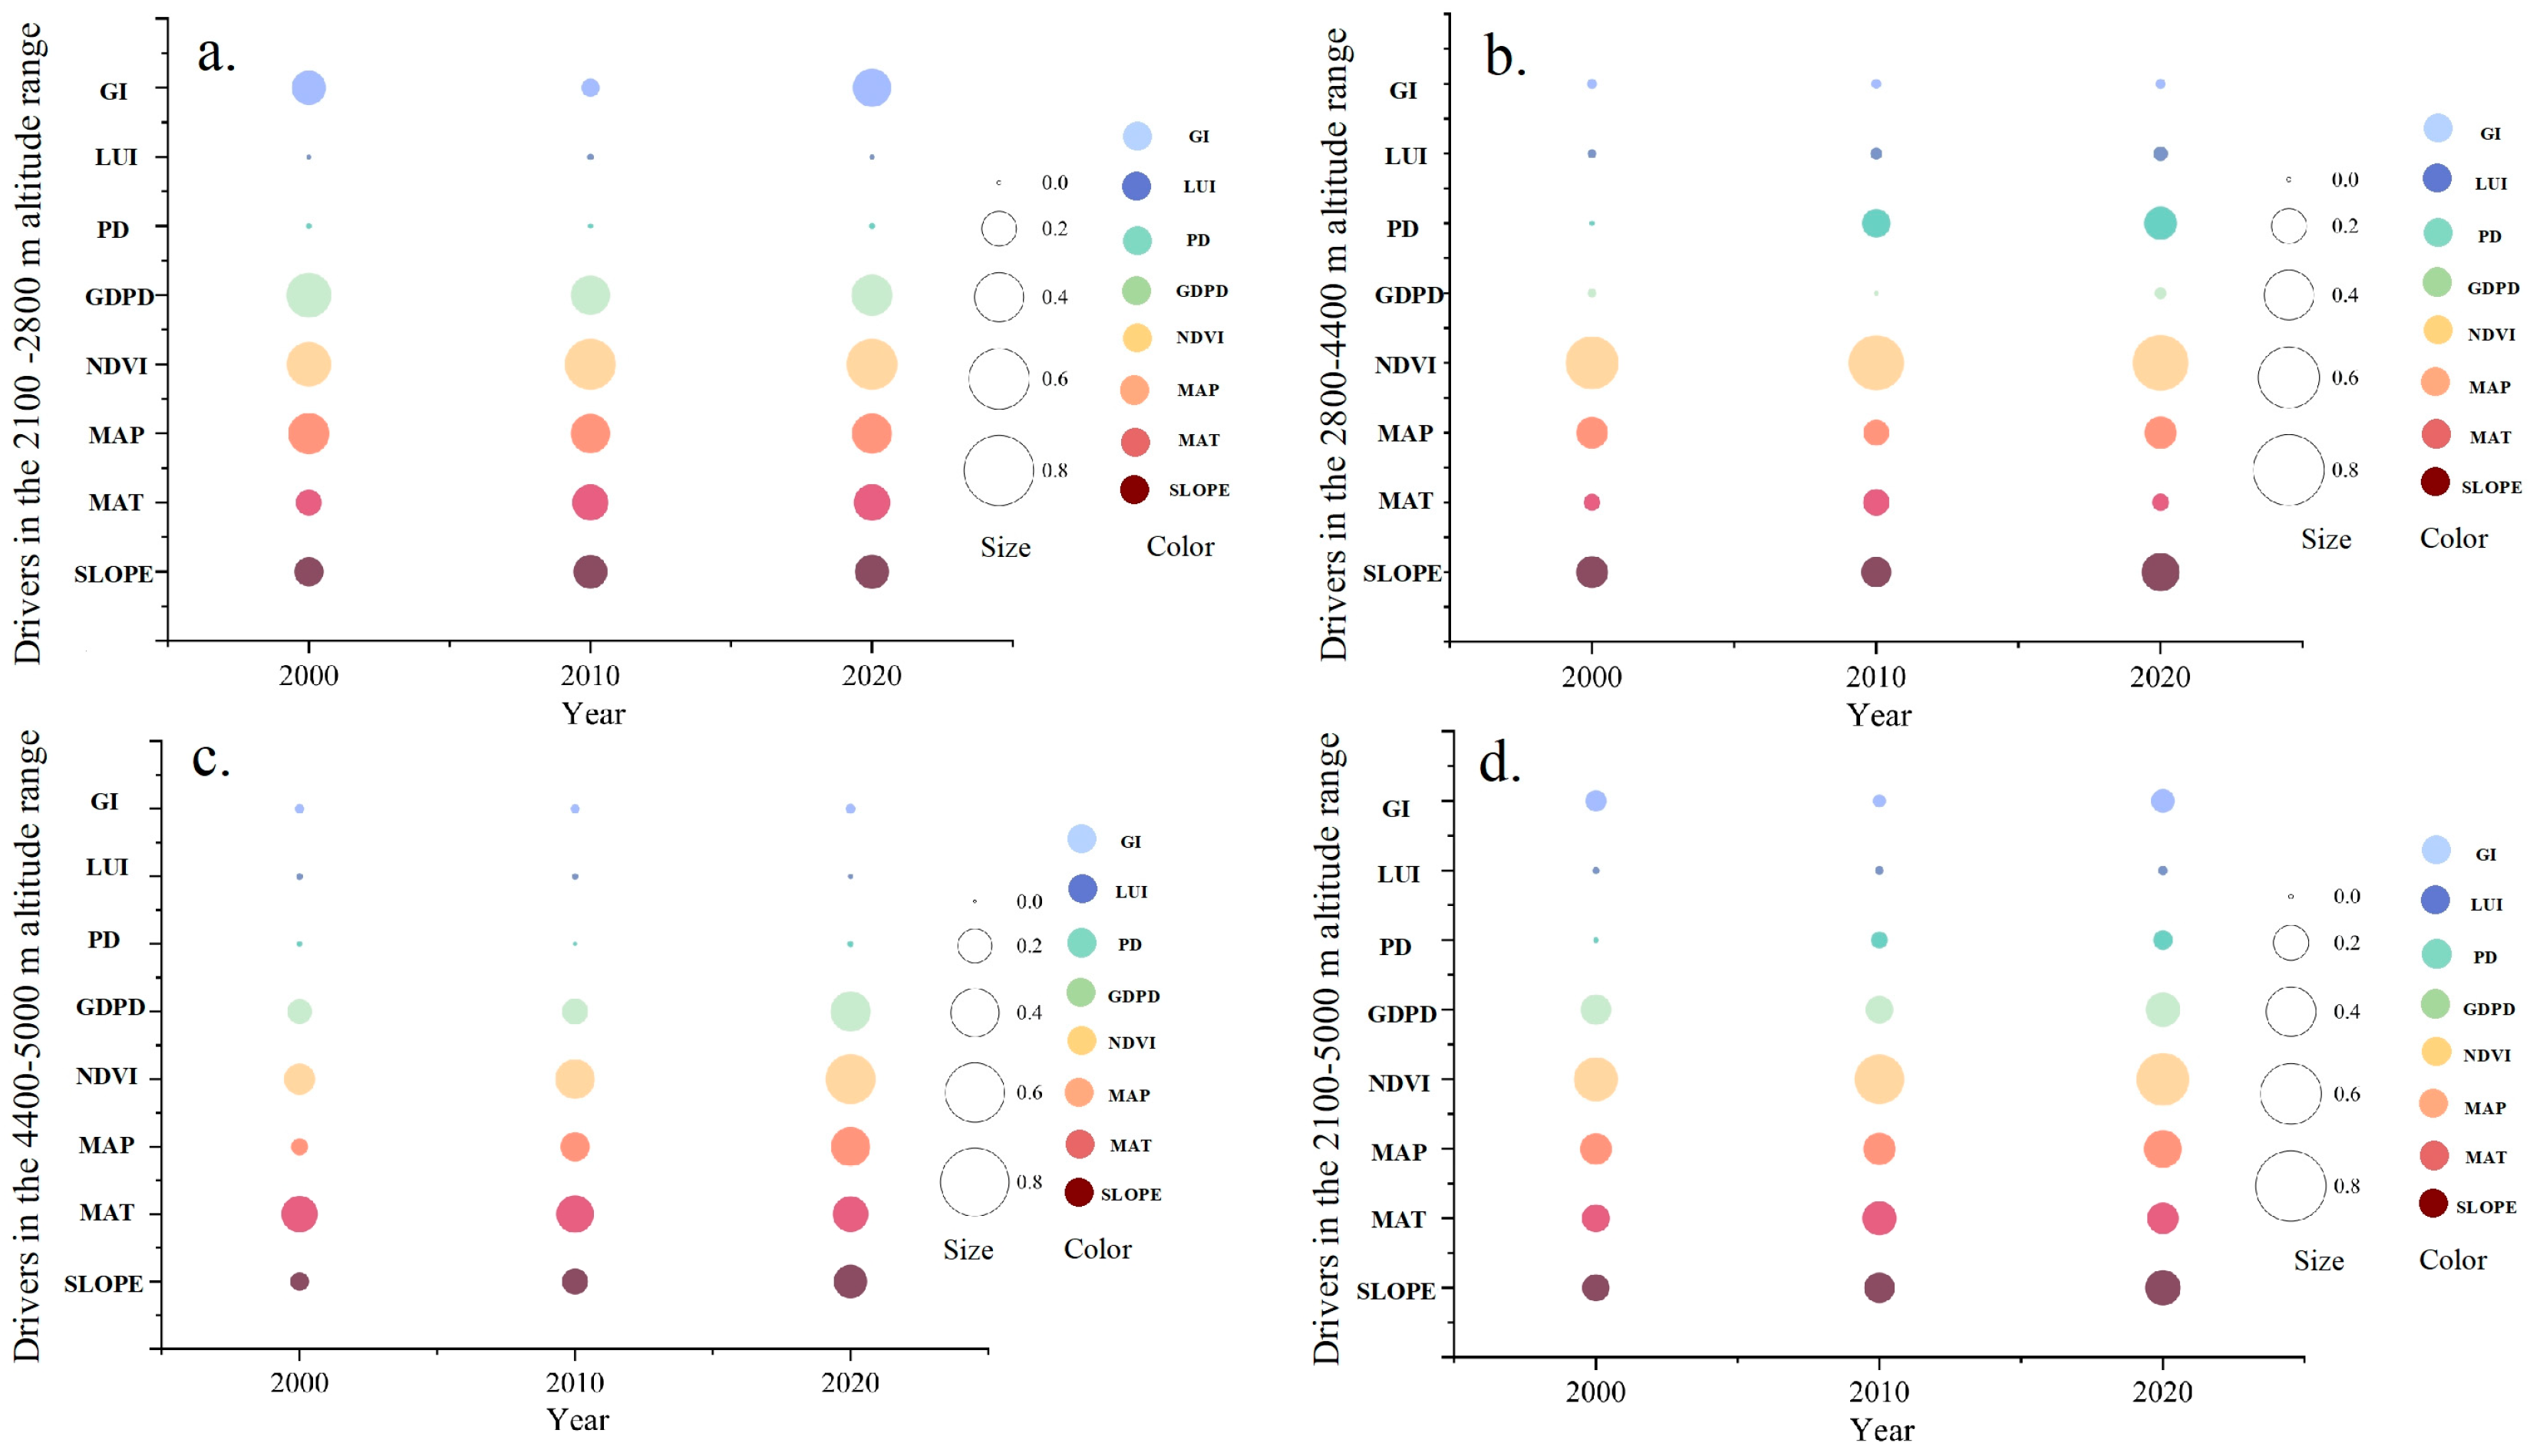
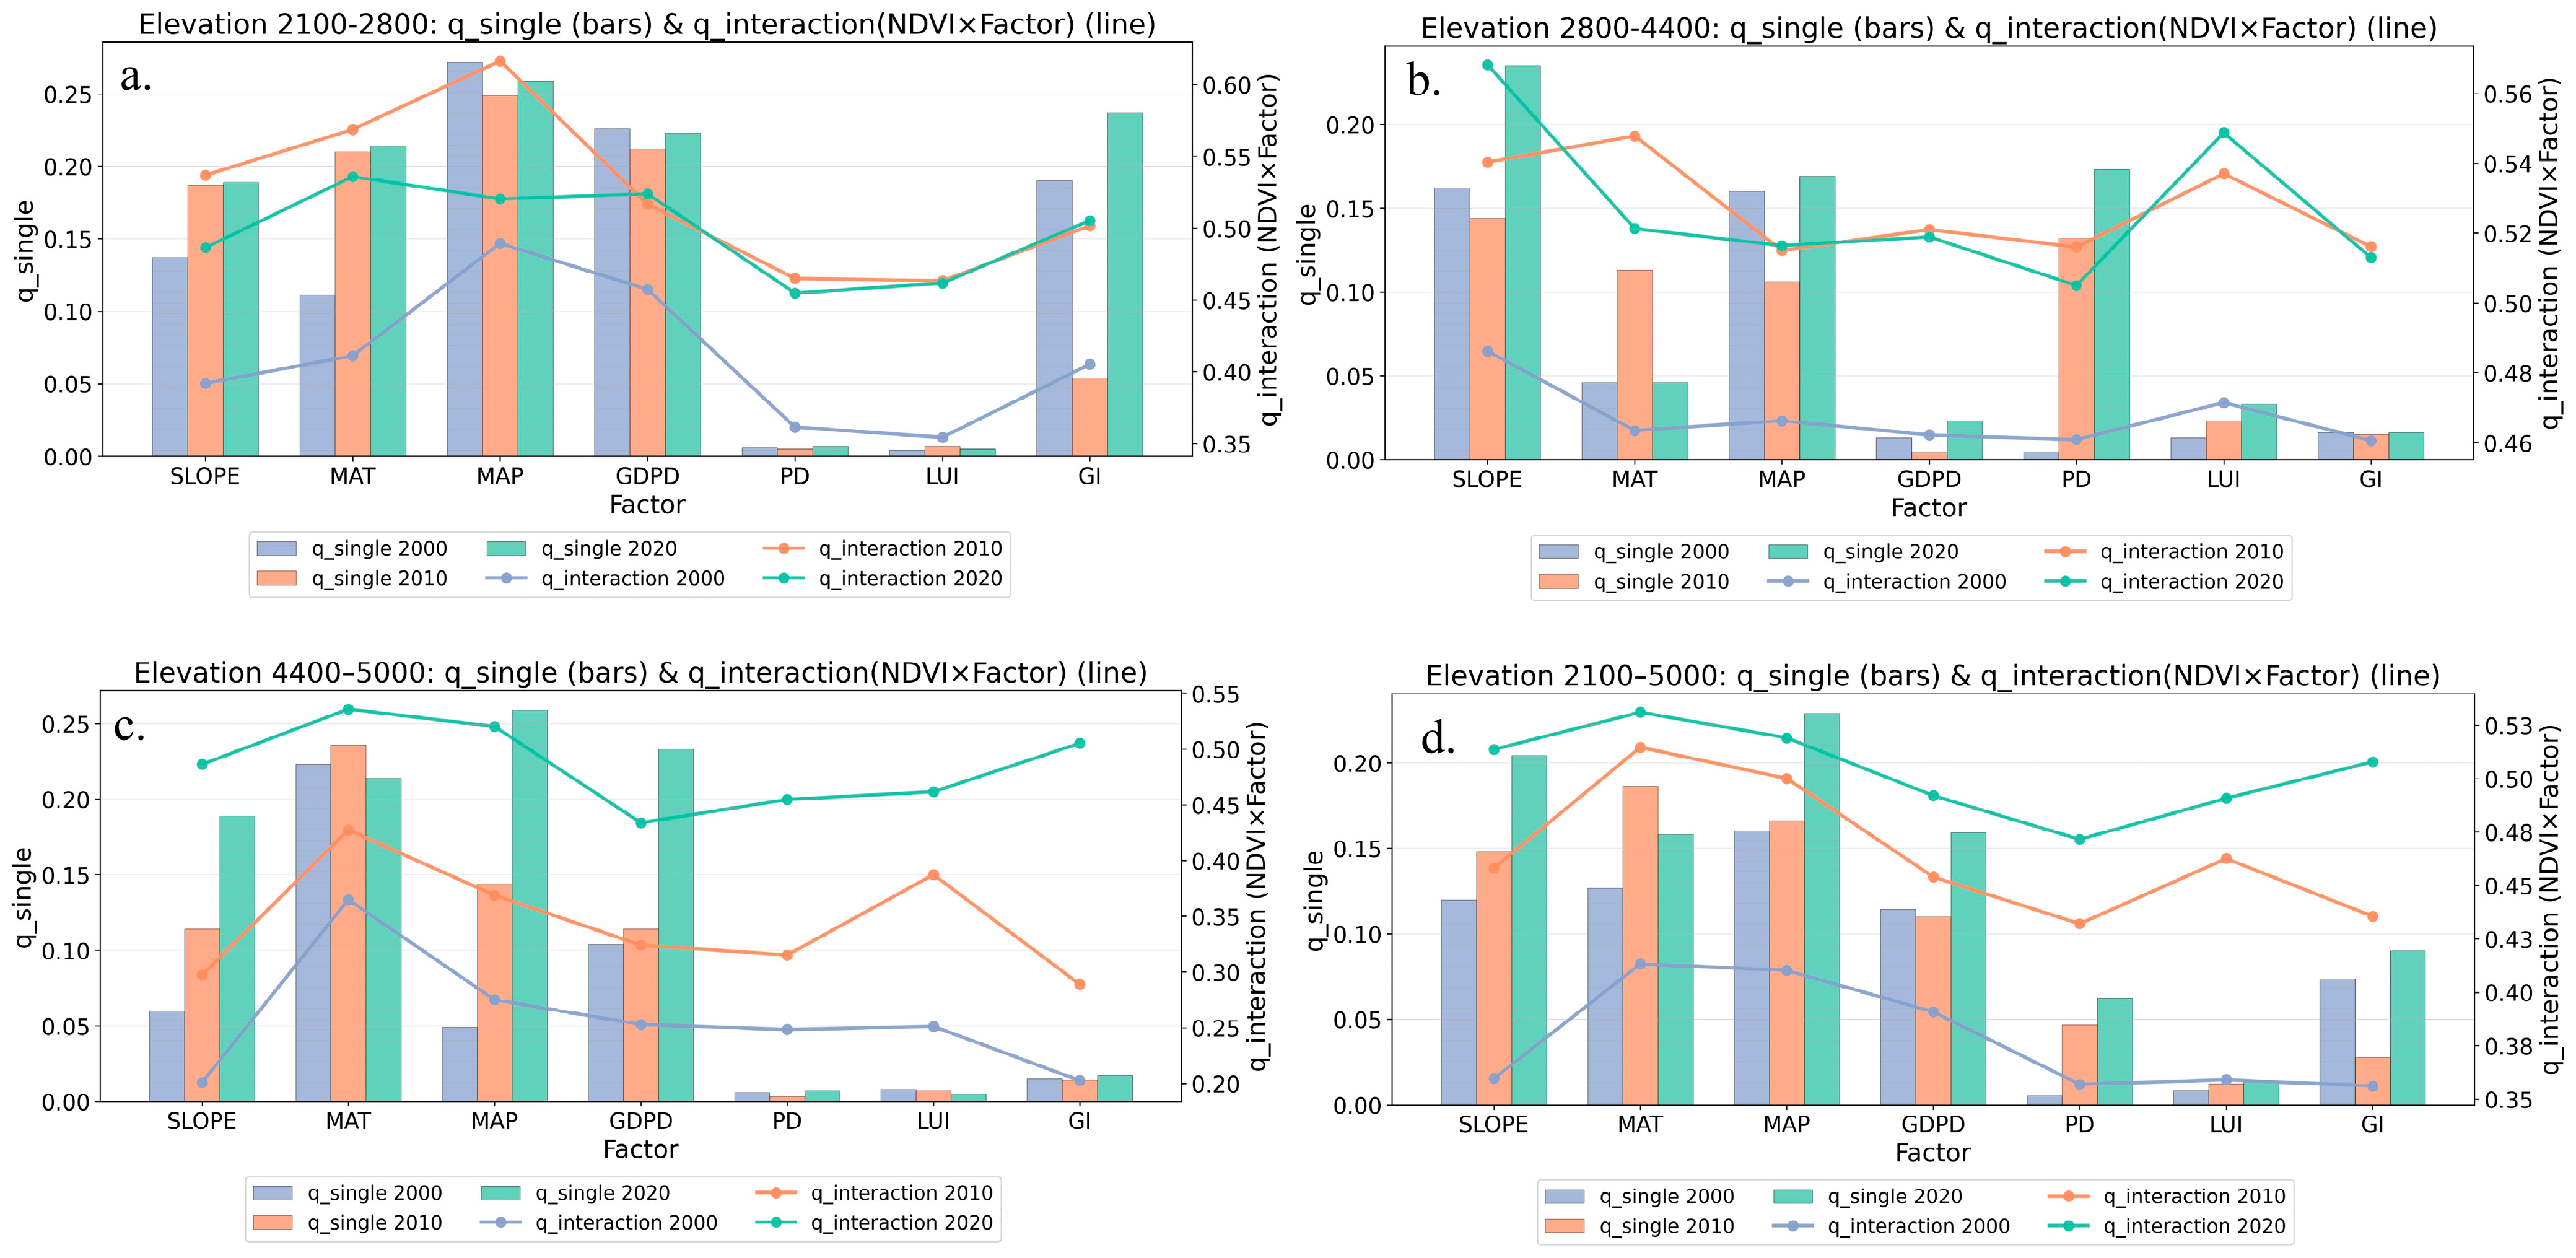
Based on a geographical detector analysis of the independent effects of various influencing factors on carbon storage in the Gonghe Basin, the results (Figure 7) showed significant differences in the independent effects of these factors across different elevation intervals. All the selected natural condition factors and human activity factors passed the significance test at p < 0.01, with their average explanatory power (q-value) being 0.21 and 0.09, respectively. This indicates that both natural conditions and human activities significantly influence carbon storage. However, natural factors have stronger explanatory power. In the 2100–2800 m elevation zone (Figure 7a), carbon storage is primarily driven by mean annual precipitation, NDVI, and GDP density, all with explanatory power greater than 0.3 and stable performance during 2000–2020. The explanatory power of grazing intensity showed an initial decrease followed by an increase from 2000 to 2020, potentially related to the implementation and adjustment of local grassland ecological protection and grazing prohibition policies [29]. In the 2800–4400 m elevation zone (Figure 7b), natural condition factors were the main influencers. Here, the explanatory power of NDVI remained above 0.4 throughout 2000–2020. This was followed by slope and mean annual precipitation, indicating significant impacts of vegetation cover, slope, and precipitation on carbon storage stability in this elevation range. This is related to the implementation of ecological projects, such as the construction of the Three-North Shelter Forest and the restoration of degraded grasslands [43]. The explanatory power of population density has gradually increased since 2010. This is related to the implementation of regional development strategies, such as clean energy base construction [44], tourism development [28], etc., which have changed the pattern of energy, transportation, and residential land use, thus indirectly affecting the change of carbon stocks, reflecting an increasing trend of human activity influence within this elevation gradient. The mean annual temperature showed a pattern of initial increase followed by a decrease in explanatory power during 2000–2020. In the 4400–5000 m elevation zone (Figure 7c), the main influencing factors were mean annual temperature and NDVI, followed by slope, mean annual precipitation, and GDP density. This demonstrates that temperature, vegetation cover, slope, and precipitation are key drivers of carbon storage at high altitudes. The increased explanatory power of GDP density in 2020 reflects the strengthened effect of coordinated economic development and ecological environmental protection [43]. While the explanatory power of natural conditions and human activity factors for carbon storage varies across elevation gradients, that of natural factors consistently exceeds that of human activities across the 2100–5000 m gradient (Figure 7d). This is primarily driven by NDVI, which has an average explanatory power greater than 0.4, indicating that vegetation cover is a key determinant. Nevertheless, the explanatory power of human activity factors increased over time in both low- and high-elevation areas, reflecting their growing role in influencing carbon storage dynamics.

3.3.2. Interactive Effects of Influencing Factors

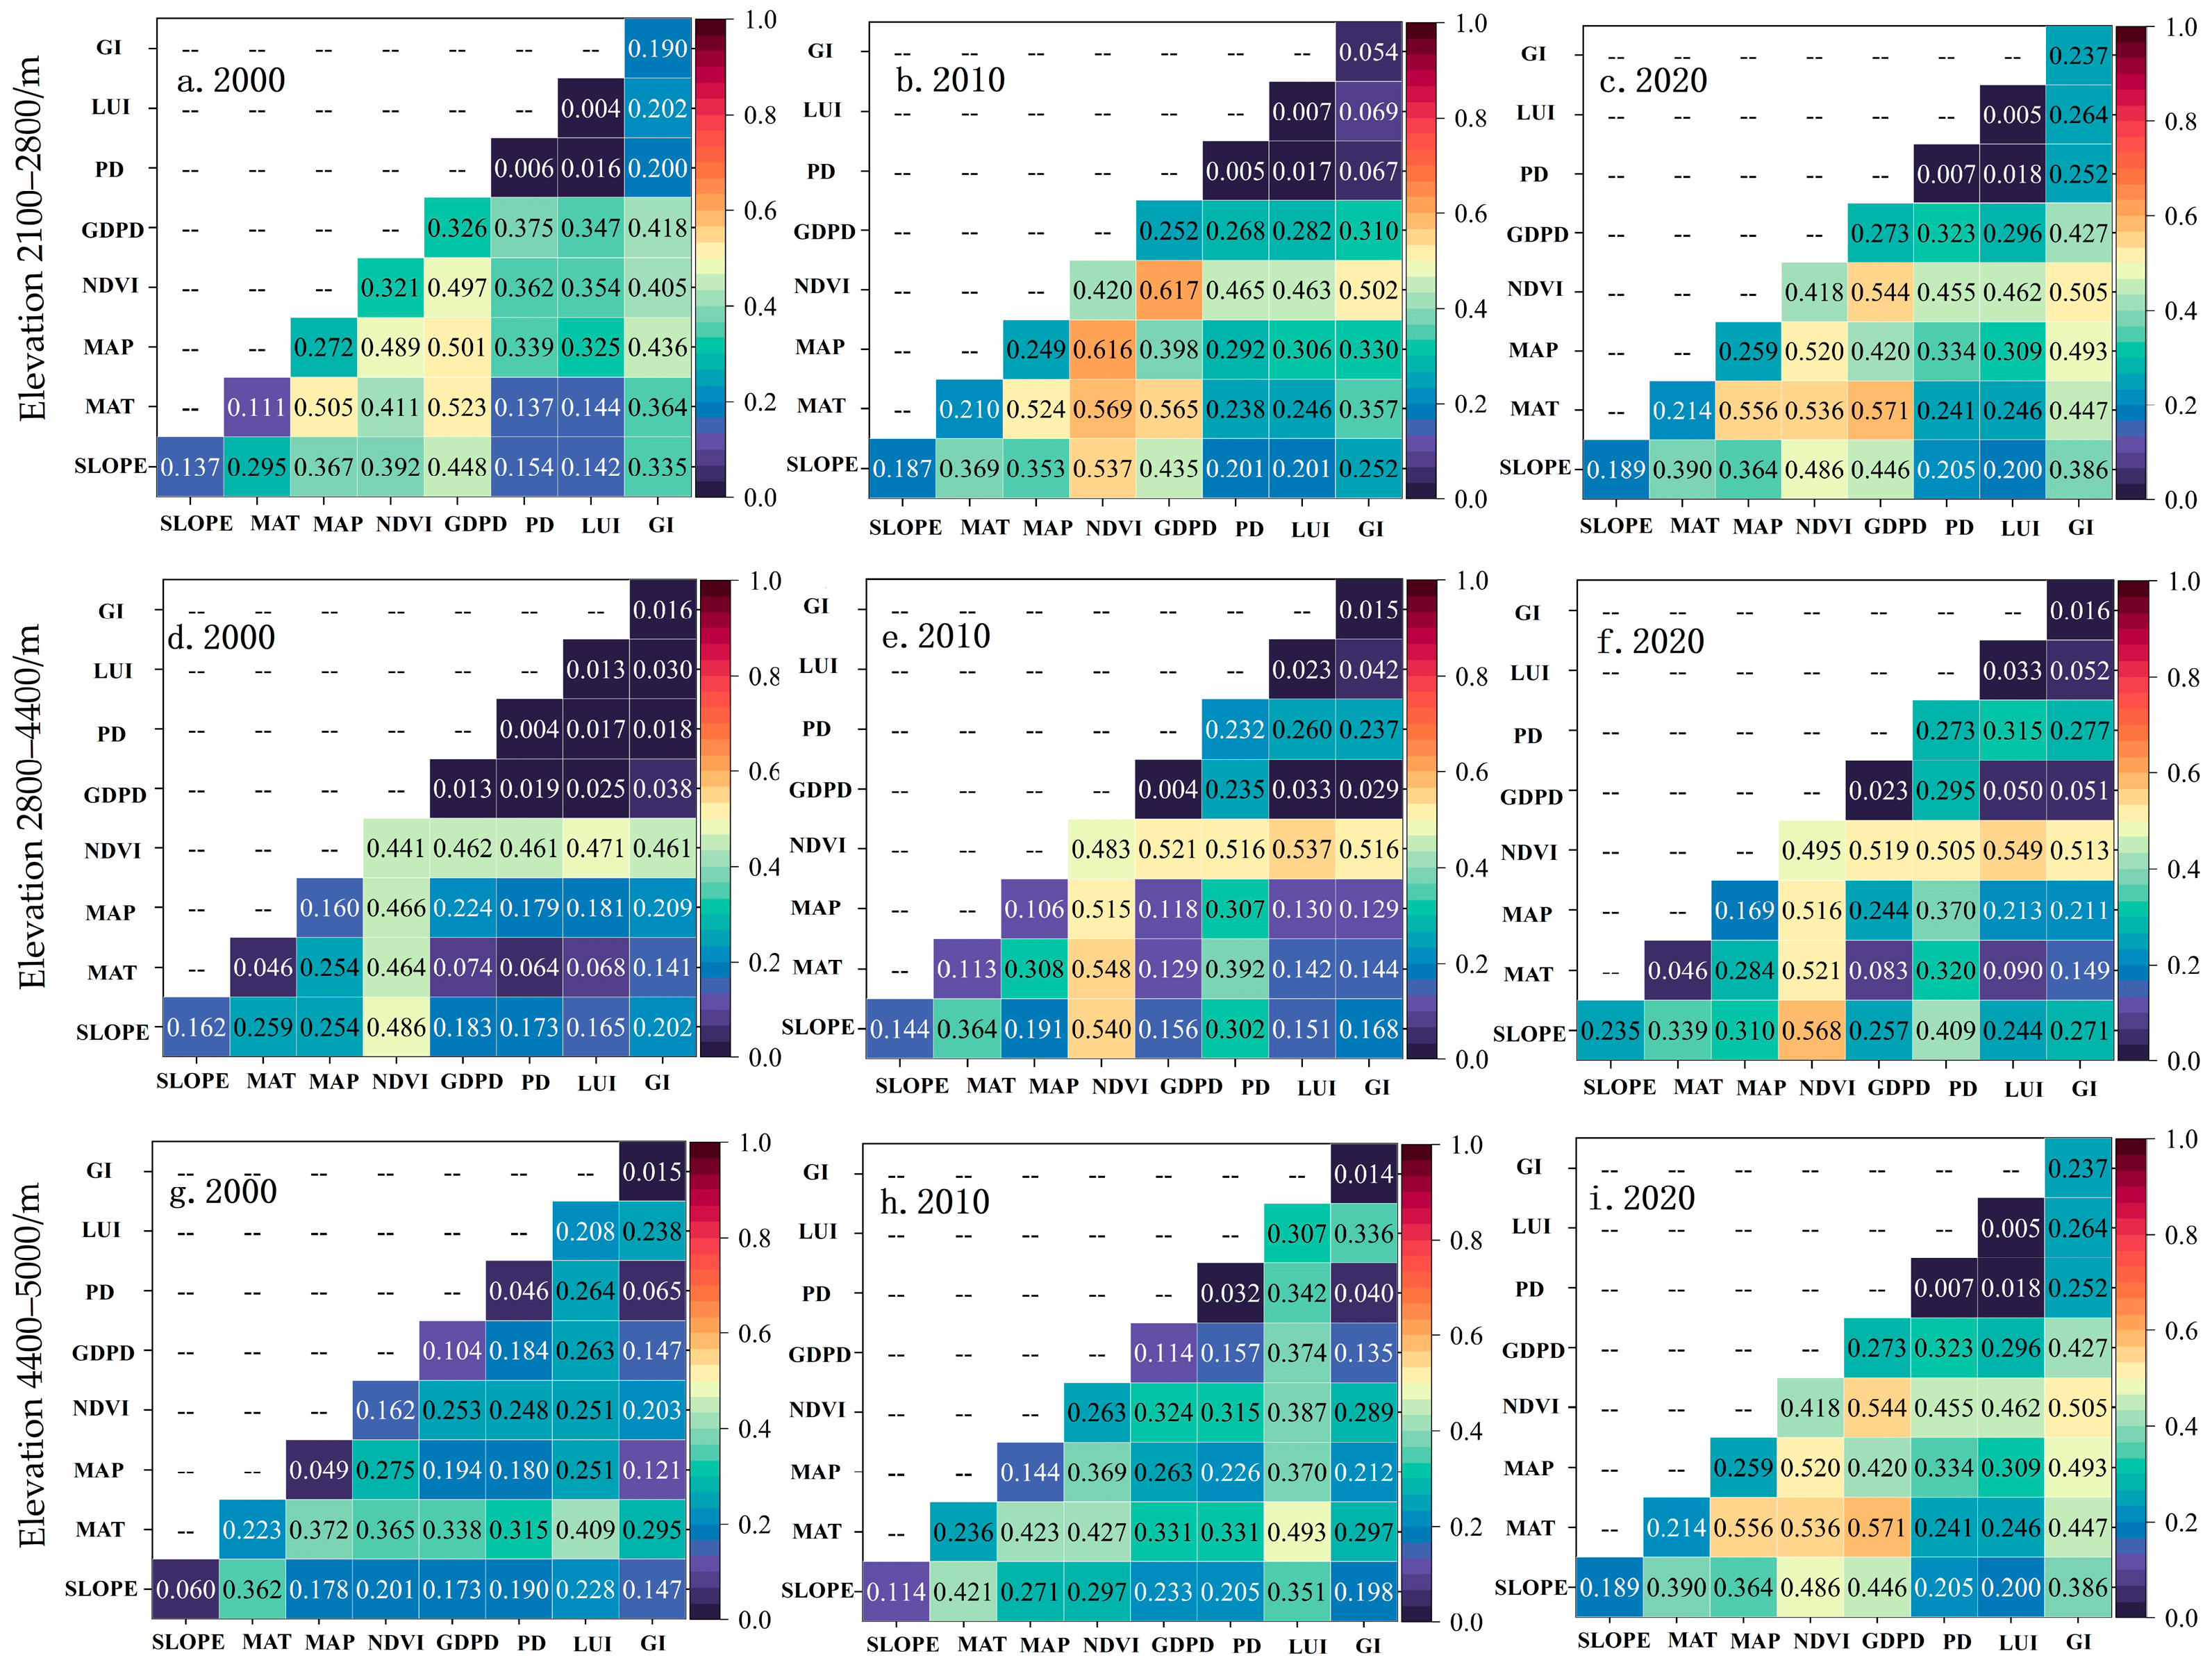
Figure 8 shows heat maps illustrating the explanatory power (q-values) of various influencing factors on carbon storage across different elevational gradients in 2000, 2010, and 2020. Here, the color intensity and numerical values reflect the strength of the explanatory power. The results from the interaction detector showed that across all elevation gradients in the Gonghe Basin, the influence of two-factor interactions consistently exceeded that of any single factor. The interaction types manifested as either bilinear enhancement or nonlinear enhancement. This indicates that the spatial heterogeneity of carbon storage resulted from the synergistic effects of multiple influencing factors. In the 2100–2800 m elevation zone, factor interactions were relatively weak in 2000. However, from 2010 to 2020, the interactions between NDVI and slope, mean annual temperature, mean annual precipitation, and GDP density were significantly strengthened. In the 2800–4400 m elevation zone, the interaction between NDVI and other factors was highly significant, establishing it as the most critical interaction type. Between 2000 and 2010, the interactive effects of NDVI and other factors strengthened. By 2020, these strong interactions had remained largely stable. Concurrently, the role of population density increased in 2010, reflecting its growing synergistic influence and increasing contribution to high carbon storage values as a non-negligible driver. In the 4400–5000 m zone, strong interactions were primarily observed between mean annual temperature and mean annual precipitation and between NDVI and land use intensity. By 2020, the interactive effects between NDVI and mean annual temperature, mean annual precipitation, and GDP density showed a strengthening trend. Meanwhile, the NDVI exhibited a heightened sensitivity to grazing intensity. The explanatory power of influencing factors on carbon storage exhibited heterogeneity across elevational gradients, with the core determinants within each altitudinal band largely maintaining or enhancing their influence over time, reflecting spatial and temporal persistence in the drivers of carbon storage [44]. The interactive effects among human activity factors, such as GDP density, land use intensity, and grazing intensity, showed a discernible increasing trend over the same period [45].

3.3.3. Spatiotemporal Variations in the Independent and Interactive Effects of Influencing Factors Under the Dominant Role of NDVI

The interactive detection of geodetectors showed that NDVI showed the highest and most stable explanatory power (q > 0.4) in all elevation zones, and the interaction with other factors was core to explaining the spatial differentiation of carbon storage in the Gonghe Basin. Therefore, the analysis was carried out with NDVI as the core. Figure 9 shows that the interactive explanatory power of NDVI with natural factors and human activity factors is generally higher than that of a single factor, indicating that the spatial differentiation of carbon storage is controlled by “nature-human activity”. In the 2100–2800 m zone, the independent explanatory power of Slope and Mean annual temperature showed an increasing trend from 2000 to 2020, while that of Mean annual precipitation, GDP density, and Grazing intensity displayed a pattern of initial decrease followed by an increase. The interactions between NDVI and Slope, mean annual precipitation, and GDP density were significant, especially after 2010, when NDVI’s interactions with various other factors markedly strengthened. This reflects the fact that the combined influence of natural conditions and human activities on vegetation has intensified the regulation of carbon storage. In the 2800–4400 m zone, the independent explanatory power of population density and land use intensity showed a significant increasing trend. The interactive effects between NDVI and all factors surged significantly during 2010–2020 and remained at a high level. This indicates that ecological restoration projects enhanced vegetation cover while simultaneously increasing vegetation sensitivity to the underlying environmental baseline. The emergence of interactions between NDVI and Slope and population density after 2010 demonstrates that slope conditions and human activities associated with land-use changes began to influence carbon storage differences through their effects on vegetation. In the high-altitude 4400–5000 m zone, the independent explanatory power of mean annual temperature was consistently high overall, with relatively small inter-annual fluctuations. The independent explanatory power of slope, mean annual precipitation, and GDP density showed a significant upward trend from 2000 to 2020. The interaction between NDVI and mean annual temperature was the most prominent, clearly revealing the pathway through which temperature changes regulate carbon storage by influencing vegetation growth. Furthermore, in 2020, the interactive explanatory power between NDVI and other factors showed a significant increasing trend. In summary, the dynamics of NDVI-centered interactions highlight its pivotal role in shaping carbon storage patterns: natural factors are the foundational forces molding vegetation, while the impact of human activities on carbon storage is increasingly manifested indirectly through alterations in vegetation cover (NDVI). This suggests that future ecological management should prioritize vegetation protection and restoration as a core strategy for regulating regional carbon sink function.

4. Discussion

4.1. Analysis of Carbon Storage Differences Along Elevation Gradients and Horizontal Space

In 2000, carbon storage in the Gonghe Basin was 834.03 × 10⁶/t. It increased to 868.89 × 10⁶/t in 2010 and decreased to 866.81 × 10⁶/t by 2020, showing an initial increasing trend followed by a decrease over the three time periods. The spatial pattern from north to south exhibited a mosaic of high and low values. This was generally consistent with the spatial patterns of topography (Figure 1a) and land use (Figure 1b). In terms of horizontal spatial distribution, areas dominated by forestland and grassland correspond to high-carbon storage zones. These are mainly concentrated in the southern mountains of the Qinghai Lake area within Gonghe County and in the southern parts of Xinghai and Tongde Counties (Figure 1c). These regions have relatively high carbon storage capacities owing to their high vegetation cover. Conversely, areas dominated by cropland, construction land and unused land represented low-carbon storage zones. These are primarily distributed in the basin area of southwestern Gonghe County, central Guinan and Guide Counties, and northern Tongde County. Carbon storage in these areas was significantly lower than in mountainous forests and grassland regions, which is attributable to intense human disturbance and low vegetation coverage. In the southern part of Guide County and the southwestern county border area of Xinghai County, the primary land use type is alpine desert owing to influences such as low temperatures and permafrost, resulting in a low carbon storage capacity. This is different from the distribution of the vertical gradient, which shows a nonlinear distribution pattern of carbon storage along the elevation gradients in the Gonghe Basin, which differs significantly from the horizontal spatial analysis. This primarily stems from the redistribution of hydrothermal conditions along the vertical zone, gradient variations in human activity intensity, and the refined regulatory effects of topography on material transport and energy distribution [42]. Regarding the variation in carbon storage across elevation gradients, total carbon storage exhibits a low-high-low trend with increasing elevation (Figure 4). The 2800–4400 m elevation zone had the strongest carbon storage capacity, accounting for over 60% of the total. In addition to the relatively optimal hydrothermal combination and higher vegetation cover of alpine meadows in this zone, the relatively complete soil development processes and lower human disturbance intensity in mid-elevation areas provide favorable topographic and ecological conditions for carbon accumulation. In the 2100–2800 m elevation zone, in addition to strong influences from agricultural and pastoral activities [45], most areas in this belt are located in valley and basin terrains. Here, surface materials are prone to erosion, and intensified aridity leads to desertification expansion, resulting in substantial fluctuations in carbon storage capacity [46]. The 4400–5000 m elevation zone is affected by low temperatures and scree cover, leading to a gradual decline in carbon sink capacity with increasing elevation. Intense topographic fragmentation and soil formation processes in high-altitude areas restrict the fixation and accumulation of organic matter. In contrast, horizontal spatial analysis, while capable of identifying the macro-scale distribution of high and low carbon storage values, fails to capture the key pattern of optimal carbon storage at mid-elevations within the vertical zonation and cannot reflect the profound impacts of topography-induced local hydrothermal configurations and human activity variations on carbon spatial heterogeneity. Therefore, introducing the perspective of topographic gradient and integrating the analysis of the horizontal dimension is helpful in revealing the spatial and temporal heterogeneity of carbon storage in the Gonghe Basin more systematically and with more mechanisms that can guide carbon management practices in alpine basins.

4.2. Multi-Dimensional Coupling of Carbon Storage Spatial Heterogeneity

Combined with the carbon storage change trends across different elevation zones shown in Figure 3, the distribution of carbon storage in the Gonghe Basin is jointly regulated by the spatial heterogeneity of topography and land use types, as well as their dynamic changes during 2000–2020. The high carbon storage zones in horizontal space significantly overlap with the dominant mid-to-high elevation zones in vertical space, forming a synergistic carbon sink region characterized by mountainous terrain–forest/grassland–mid-to-high elevation. The low carbon storage zones in horizontal space correspond to low and high elevation zones in vertical space, respectively forming two types of synergistic low-value carbon storage areas: valley–agriculture/pasture–low elevation and mountainous terrain–ice/frozen soil–high elevation. This differentiation pattern, high in the middle and low at both ends, is shown in Figure 3. Here, mountainous forest–grassland areas with dense contour lines show substantial spatial overlap with high carbon storage zones. Meanwhile, basin and valley areas with sparse contour lines exhibit significant spatial coupling with low carbon storage zones. Therefore, carbon storage does not exhibit a simple monotonic trend with increasing or decreasing elevation, but rather demonstrates distinct zonal characteristics. Therefore, the spatial heterogeneity of carbon storage in the Gonghe Basin was shaped by the combined effect of horizontal disparities, manifested as differences between forest/grassland regions and agricultural/pastoral areas, and vertical stratification, evident as carbon storage gradients across the low-, middle-, and high-elevation zones. This pattern reflects the differential dominance of natural factors and human activity across varying altitude gradients. Analysis showed that the multidimensional coupling of carbon storage spatial heterogeneity is manifested through land use control in horizontal space, topographic–climatic and human activity influences along vertical gradients, and dynamic interactions between natural and anthropogenic factors across spatiotemporal scales. In the horizontal dimension, high-carbon storage zones are closely aligned with forest and grassland distribution areas. Meanwhile, low-value zones corresponded to agro-pastoral ecotones and alpine desert regions (Figure 1c), demonstrating the fundamental control of land use types on the spatial distribution of carbon storage capacity. In the vertical dimension, carbon storage exhibits a characteristic high in the middle and low at both ends pattern. The mid-elevation zone (2800–4400 m), characterized by optimal hydrothermal conditions and high vegetation cover, forms the dominant carbon storage belt. In contrast, the low-elevation zone (2100–2800 m) experiences strong human disturbance. Meanwhile, the high-elevation zone (4400–5000 m) is constrained by low temperatures and freezing effects, resulting in a significantly weakened carbon storage function and reflecting topographic–climatic constraints on carbon storage. In the spatial correlation dimension, although global autocorrelation (Moran’s I) remains generally stable, local clustering types demonstrate dynamic evolution. High-high clusters are stably distributed in mid-elevation forest–grassland dominant zones, indicating spatial continuity and stability of the carbon storage function in these areas. Low-low clusters exhibit elevation differentiation, reflecting different evolution mechanisms of carbon storage across regions. Meanwhile, partial spatial shifts of low-high and high-low clusters suggest localized intensification of natural recovery and human disturbance impacts. These patterns indicate that the spatial heterogeneity of carbon storage in the Gonghe Basin originates from static land cover and topographic zonation and is also more profoundly influenced by the coupling effects and dynamic evolution of natural processes and human activities along vertical gradients, demonstrating multiple couplings among the internal system structure, processes, and different elevation zones.

4.3. Comparison with and Implications from Global Studies on Carbon Storage in High-Altitude Regions

To contextualize this study within the global framework of carbon storage research in high-altitude ecosystems, the findings from the Gonghe Basin on the Qinghai-Tibet Plateau are compared with those from typical regions such as the Andes Mountains, the arid zones of Central Asia, and the European Alps, aiming to elucidate regional differences and their mechanistic implications. In general, existing studies in the Andes Mountains often emphasize the dominant control of natural factors (temperature and precipitation seasonality) on vegetation carbon pools (particularly aboveground biomass carbon) along elevation gradients, with common findings including a decreasing trend in vegetation carbon with increasing altitude. In contrast, although the Gonghe Basin is similarly constrained by climate-topography interactions, this study, through an elevation-stratified Geodetector analysis, further demonstrates that NDVI exhibits the highest and most stable explanatory power across all elevation zones (q > 0.4), and its interactive effects with natural factors such as temperature, precipitation, and slope are generally stronger than those of individual factors. Simultaneously, the explanatory power and interactive effects of human activity factors, including population density and GDP density, showed a significant increasing trend from 2010 to 2020, indicating that the carbon storage pattern in this high-altitude area is shaped not only by natural gradients, but also by ongoing coupled “natural-anthropogenic” processes [47,48]. When compared with studies in the arid zones of Central Asia, the relevant literature commonly points out that carbon processes in arid ecosystems are dominated by strong water stress, with carbon pools highly sensitive to precipitation fluctuations and drought processes, and human activities such as grazing, irrigation, and land-use change, can exacerbate carbon loss and interannual variability. Although situated in an arid-to-semi-arid context, the carbon storage peak in the Gonghe Basin does not correspond simply to the “more humid” lower elevation zones. Instead, it is concentrated within the 2800–4400 m hydrothermal matching zone. This suggests that under the regulation of the plateau basin topography, the synergistic matching of hydrothermal conditions is more likely to determine the optimal carbon storage range by shaping vegetation cover and carbon input processes, thereby forming a carbon storage trajectory distinct from that of typical arid zones [49]. Further comparison with research in temperate–alpine systems such as the European Alps shows that those studies, often based on detailed soil profile data, have long focused on systematic changes in soil organic carbon (SOC) stocks, chemical properties, and turnover rates along elevation gradients, with climate and soil type considered the dominant controlling factors. This study, from a macro perspective of total carbon storage and employing an “elevation stratification + spatial clustering” approach, provides supplementary evidence on the spatial aggregation structure of carbon storage and its coupling relationship with topography and land use, creating beneficial methodological and scale complementarity [50]. In summary, compared with similar global ecological regions, the regional uniqueness and academic contributions of this carbon storage research in the Gonghe Basin are mainly reflected in: (1) Pattern revelation: It clarifies the non-monotonic, zonally optimal pattern of carbon storage along the elevation gradient in a plateau arid basin, and the identification of the core advantageous zone (2800–4400 m) holds significant management implications. (2) Methodological application: By combining “elevation gradient stratification” with Geodetector and spatial autocorrelation analysis, it moves beyond the traditional paradigm of treating elevation as a single continuous factor, allowing for a fine-grained analysis of the differential mechanisms involving natural factor interactions and enhanced human activities within different elevation zones. (3) Process understanding: This emphasizes the increasing explanatory power of human activity factors within the context of ecological engineering projects. This provides an important scientific reference based on elevation-zonation for differentiated governance paradigms applicable to other high-altitude vulnerable regions globally that are implementing ecological restoration. Consequently, future carbon management in the Gonghe Basin should formulate differentiated regulation strategies based on elevation zonation.

4.4. Carbon Storage Management Strategies for Different Altitude Gradients

Geodetector results showed that there were significant differences in the dominant influencing factors and their interactions with carbon storage in the three elevation gradient ranges of 2100–2800 m, 2800–4400 m, and 4400–5000 m. Based on this, the following corresponding management strategies were proposed: The management of carbon storage in the Gonghe Basin should adhere to the principles of zonal regulation, factor synergy, and system stability, formulating differentiated strategies adapted to the natural–anthropogenic coupling characteristics of each elevation zone. In the 2100–2800 m zone, in addition to the influence of annual average precipitation and NDVI, the influences of GDP density and grazing intensity are also significant (q > 0.3). In this area, human disturbance is intense; overgrazing, land reclamation, and construction land expansion have led to vegetation degradation and soil organic carbon loss, causing substantial fluctuations in carbon storage. Regional management must enforce strict control over urban expansion, stabilize agricultural land use, and implement eco-agriculture alongside sustainable grass–livestock balance systems, while consolidating and addressing gaps in ecological projects, such as grazing retirement and grassland restoration, to stabilize anthropogenic pressures and enhance ecosystem carbon sequestration capacity. In the range of 2800–4400 m above sea level, NDVI (q > 0.4), slope, and annual average precipitation (q > 0.2) have significant effects. The combination of water and heat is the best, and the carbon sequestration capacity is outstanding. It is the core area of the carbon sink function in the Gonghe Basin, and its vegetation coverage has always been dominant. However, since 2010, the explanatory power of the population density factor has been significantly enhanced (q > 0.2), indicating the growing potential for synergistic effects between natural processes and human interventions. In the context of global change, it is imperative to establish a monitoring and response system for anomalous natural evolution in this region, enabling the assessment of the impacts of climate change on alpine ecosystems. Concurrently, human intervention in ecological processes should be minimized. This can be achieved by progressively phasing out anthropogenic disturbances, scientifically reducing grazing intensity and optimizing eco-compensation policies. These measures facilitate natural vegetation recovery and maintenance of system homeostasis, ensuring long-term stability and enhancing carbon sink functions in alpine meadows and forestlands [51]. In the 4400–5000 m elevation zone, the main influencing factors were annual average temperature and NDVI (q > 0.3), followed by slope, annual average precipitation, and GDP density (q > 0.18). Low temperatures, freezing conditions, and sparse vegetation severely constrain carbon accumulation capacity, with significant interactive effects among natural factors such as temperature and vegetation cover. Although human disturbance remains relatively low in this area, it has shown an intensifying trend. Management strategies should prioritize addressing natural stressors under climate change, including conducting baseline surveys of carbon stocks in alpine deserts and permafrost, establishing a long-term ecological monitoring network to track the potential impacts of glacial and permafrost retreats on the carbon cycle, and assessing the risk of carbon release from permafrost thawing. Therefore, all nonessential human activities should be strictly prohibited. The spatial heterogeneity of carbon storage in the Gonghe Basin results from the baseline control exerted by natural factors and the dynamic regulation of human activities along the elevation gradient. This is reflected in the distinct response mechanisms observed across altitudes: stable natural influence with intensified human pressure at low elevations, dominant natural influence with increasing human pressure at mid-elevations, and predominant natural constraints with high sensitivity to human pressure at high elevations. Therefore, future management should move beyond single-dimensional measures by advancing multifactor coordinated governance and coupling natural recovery processes with human regulatory actions to enhance the carbon storage potential and ecosystem resilience of the Gonghe Basin [52].

4.5. Limitations and Prospects

In this study, we examined the spatial differentiation patterns of carbon storage along elevation gradients in the Gonghe Basin and the coupled influences of natural and anthropogenic factors, clarifying the crucial function of mid-elevation forest–grassland zones as core carbon sinks and identifying differentiated regulatory needs for low-elevation human-disturbed areas and high-elevation environmentally constrained zones. This provides a scientific basis for the precise assessment and zonal management of carbon storage in alpine basins [53]. However, this study has several limitations. First, the analysis relied solely on triennial data (2000, 2010, and 2020) and lacked support from long-term continuous time series, potentially insufficiently capturing the dynamic evolution processes and hysteresis effects of carbon storage. Future studies should incorporate higher temporal resolution remote sensing and ground monitoring data to reveal changing trends more accurately [54,55]. Second, the applied InVEST model has constraints regarding localized parameter applicability and scale sensitivity, which may introduce uncertainties [30,56]. Statistically insignificant clusters were widely distributed across the 2100–5000 m elevation range and accounted for a substantial proportion of the study area, which may introduce uncertainty into the findings. Therefore, future research should integrate process-based models with multi-source data assimilation to enhance the accuracy and mechanistic representation of carbon storage simulations. Constrained by spatial resolution limitations, the current analysis did not adequately characterize small-scale ecological processes. Future studies should introduce high-resolution remote sensing products and UAV observation data to conduct multiscale collaborative analyses [57]. Regarding the research depth on influencing factors, the coupling mechanisms between climatic factors and vegetation–soil carbon cycle processes remain insufficiently resolved [58,59], particularly the quantification of the impacts of permafrost changes and extreme climate events on high-altitude carbon stability [60]. Moreover, geographic detectors identify spatial stratification heterogeneity, not strict causality. In future research, we will combine other methods to conduct more in-depth research to enhance the explanatory power of the impact mechanism and provide a basis for proposing more targeted spatial governance strategies. Future efforts should strengthen climate-ecological process-coupled modeling to establish an assessment index system that organically integrates meteorological elements, underlying surface properties, and human activity factors [61]. This will determine the dynamic change patterns of carbon storage capacity in the Gonghe Basin under climate change conditions [62,63] and provide more predictive decision-making support for achieving carbon neutrality goals in alpine basins [64,65].

5. Conclusions

In this study, we assessed the changing trends in carbon storage in the Gonghe Basin for 2000, 2010, and 2020, examining the spatial pattern dynamics of carbon storage across different elevation gradients and their influencing factors. These findings provide a scientific basis for formulating differentiated ecological restoration and carbon management strategies in the Gonghe Basin, offering valuable references for enhancing the carbon sink function in the ecological barrier zone of the northeastern Qinghai–Tibet Plateau. The conclusions are as follows:
(1)
Carbon storage showed significant spatial differentiation of half-mountain high, mountain top, and valley low on the altitude gradient. High-value areas were consistently concentrated in the forest–grassland ecotone between 2800 and 4400 m, where optimal combinations of moisture and heat conditions supported higher carbon accumulation. In contrast, low-value zones are predominantly found in the intensive human activity areas at 2100–2800 m, which are strongly influenced by urbanization, agricultural reclamation, and overgrazing, as well as in the alpine desert regions above 4400 m, where natural constraints such as low temperatures, freezing conditions, and sparse vegetation severely limit carbon storage.
(2)
The synergistic mechanisms influencing carbon storage exhibited pronounced variations across the elevation gradients. In the low-elevation zone of 2100–2800 m, vegetation cover showed strong interactions with precipitation, economic development intensity, and grazing pressure, reflecting a distinct natural–anthropogenic coupling dynamic. The mid-elevation zone, spanning 2800–4400 m, evolved from earlier synergies between vegetation cover and natural factors, such as slope and precipitation, toward increasingly prominent cooperative effects with socioeconomic factors, including population density, illustrating the continuing penetration of human influence. In the high-elevation zone of 4400–5000 m, a persistently stable synergistic relationship exists between vegetation coverage and temperature while demonstrating a gradually increasing sensitivity to human activity factors, particularly land-use intensity and grazing intensity pressure.
(3)
While natural factors remain the dominant force shaping the current spatial pattern of carbon storage in the Gonghe Basin, the explanatory power of human activity factors such as GDP density, land-use intensity, and grazing intensity showed a consistent upward trend across all elevation gradients over time. This trend signifies a deepening anthropogenic influence on the regional carbon cycle and indicates that human activities will play an increasingly critical role in future carbon storage dynamics.
(4)
This study revealed that carbon storage in the Gonghe Basin exhibits significant vertical zonality, driven by both natural processes and anthropogenic disturbances. In response, a collaborative management framework of “three zones with three strategies” based on elevation gradients is proposed: the low-elevation zone (2100–2800 m) focuses on “regulation and restoration” to reduce human disturbance, the mid-elevation zone (2800–4400 m) emphasizes “conservation and enhancement” to maintain core carbon sink functions, and the high-elevation zone (4400–5000 m) highlights “monitoring and early warning” to prevent ecological risks. This framework aims to achieve systematic management through zonal strategies—mitigating stress, preserving advantages, and preventing risks—thereby enhancing regional carbon sink capacity and ecological resilience and providing a scalable scientific paradigm for carbon management in similar mountain-basin systems.

Author Contributions

Conceptualization, Ailing Sun and Yanqin Wang; Methodology, Xingsheng Xia; Software, Ailing Sun; Validation, Ailing Sun and Xingsheng Xia; Formal Analysis, Xingsheng Xia; Investigation, Ailing Sun; Resources, Xuechang Zheng; Data Curation, Ailing Sun and Yanqin Wang; Writing—Original Draft Preparation, Ailing Sun; Writing—Review and Editing, Ailing Sun and Xingsheng Xia; Visualization, Ailing Sun; Supervision, Xuechang Zheng and Haifeng Zhang; Funding Acquisition, Xingsheng Xia. All authors have read and agreed to the published version of the manuscript.

Funding

This research was funded by the Second Tibetan Plateau Scientific Expedition and Research (2019QZKK0603) and the National Natural Science Foundation of China (42201027).

Data Availability Statement

The data sources and references have been included in the manuscript.

Acknowledgments

We sincerely appreciate the constructive comments and valuable suggestions provided by the editor and the anonymous reviewers. Thank you for the free data provided by various data sources.

Conflicts of Interest

The authors declare no financial or personal relationships that could influence research outcomes.

References

  1. Zhu, M.; Li, X.; Xing, L.; Liu, C.; Wu, J.; Wu, Z. Carbon emission reduction strategies in the Beijing-Tianjin-Hebei region based on spatio-temporal heterogeneity analysis. Geol. China 2025, 1–22. [Google Scholar]
  2. Zhou, W.; Han, Y.; Wang, J.; Yang, L.; Que, H. Spatiotemporal heterogeneity and driving forces of carbon storage in the Dongting Lake Basin. China Environ. Sci. 2024, 44, 1851–1862. [Google Scholar]
  3. Li, M.; Shangguan, Z.; Deng, L. Spatial distribution of carbon storages in the terrestrial ecosystems and its influencing factors on the Loess Plateau. Acta Ecol. Sin. 2021, 41, 6786–6799. [Google Scholar]
  4. Yang, Y.; Shi, Y.; Sun, W.; Chang, J.; Zhu, J.; Chen, L.; Wang, X.; Guo, Y.; Zhang, H.; Yu, L.; et al. Terrestrial carbon sinks in China and around the world and their contribution to carbon neutrality. Sci. China Life Sci. 2022, 65, 861–895. [Google Scholar] [CrossRef] [Scilit]
  5. Zhang, P.; Li, Y.; Yin, H.; Chen, Q.; Dong, Q.; Zhu, L. Spatio-temporal variation and dynamic simulation of ecosystem carbon storage in the north-south transitional zone of China. J. Nat. Resour. 2022, 37, 1183–1197. [Google Scholar] [CrossRef] [Scilit]
  6. Zhou, T.; Chen, X. Perspective on challenges in accurately estimating remaining carbon budget for climate targets of Paris agreement. Bull. Chin. Acad. Sci. 2022, 37, 216–229. [Google Scholar]
  7. Fu, B.; Zhang, L. Land-use change and ecosystem services: Concepts, methods and progress. Prog. Geogr. 2014, 33, 441–446. [Google Scholar]
  8. Yang, J.; Han, X.; Huang, J.; Pan, Q. Effects of land use change on carbon storage in terrestrial ecosystem. Chin. J. Appl. Ecol. 2003, 14, 1385–1390. [Google Scholar]
  9. Qi, M.; Wang, F.; Hua, Y.; Wang, M. Assessment of land use change and carbon storage in Inner Mongolia Autonomous Region based on PLUS and InVEST models. J. Soil Water Conserv. 2023, 37, 194–200. [Google Scholar]
  10. Meena, V.S.; Mondal, T.; Pandey, B.M.; Mukherjee, A.; Yadav, R.P.; Choudhary, M.; Singh, S.; Bisht, J.K.; Pattanayak, A. Land use changes: Strategies to improve soil carbon and nitrogen storage pattern in the mid-Himalaya ecosystem, India. Geoderma 2018, 321, 69–78. [Google Scholar] [CrossRef] [Scilit]
  11. Liu, K.; Zhang, H.; Zhang, D.; Zhen, W.; Zhang, C. Scenario simulation and driving factors of ecosystem carbon storage in the Loess Plateau: A study based on the PLUS-InVEST-Geodector model. China Environ. Sci. 2025, 45, 2159–2170. [Google Scholar]
  12. Kong, R.; Zhang, Z.; Zhang, F.; Tian, J.; Zhu, B.; Zhu, M.; Wang, Y. Spatial and temporal dynamics of forest carbon storage and its driving factors in the Yangtze River basin. Res. Soil Water Conserv. 2020, 27, 60–66. [Google Scholar]
  13. Lu, W.; Xu, Z.; Guo, Q. Research on the temporal evolution and spatial differentiation characteristics of carbon storage in terrestrial ecosystems on the Loess Plateau. Res. Soil Water Conserv. 2024, 31, 252–263. [Google Scholar]
  14. Zhao, M.; Zhou, G. Carbon storage of forest vegetation in China and its relationship with climatic factors. Clim. Change 2006, 74, 175–189. [Google Scholar] [CrossRef] [Scilit]
  15. Liu, G.; Zhao, Z. Analysis of carbon storage and its contributing factors—A case study in the Loess Plateau (China). Energies 2018, 11, 1596. [Google Scholar] [CrossRef] [Scilit]
  16. Guo, B.; Tang, X.; He, Y. Spatiotemporal evolution and influencing factors of topographic gradient effect on carbon storage in Lanzhou city. Environ. Sci. 2025, 47, 396–407. [Google Scholar]
  17. Gai, Z.; Zheng, W.; Faye, B.; Wang, H.; Du, G. Temporal and spatial characteristics and influencing factors of carbon storage in black soil area under topographic gradient. Land 2024, 14, 16. [Google Scholar] [CrossRef] [Scilit]
  18. Brunsdon, C.; Fotheringham, A.; Charlton, M. Geographically weighted regression: A method for exploring spatial nonstationarity. Geogr. Anal. 1996, 28, 281–298. [Google Scholar] [CrossRef] [Scilit]
  19. Wu, S.; Li, J.; Zhou, W.; Lewis, B.; Yu, D.; Zhou, L.; Lin, J.; Dai, L. A statistical analysis of spatiotemporal variations and determinant factors of forest carbon storage under China’s Natural Forest Protection Program. J. For. Res. 2018, 29, 415–424. [Google Scholar] [CrossRef] [Scilit]
  20. Wu, J.; Wang, G.; Chen, W.; Pan, S.; Zeng, J. Terrain gradient variations in the ecosystem services value of the Qinghai-Tibet Plateau, China. Glob. Ecol. Conserv. 2022, 34, e02008. [Google Scholar] [CrossRef] [Scilit]
  21. Ma, X.; Zhang, H. Variations in the value and trade-offs/synergies of ecosystem services on topographic gradients in Qinghai Province, China. Sustainability 2022, 14, 15546. [Google Scholar] [CrossRef] [Scilit]
  22. Ma, Y.; Zhong, J.; Mi, W.; Shi, J.L.; Jian, X. Assessment and vulnerability analysis on carbon storage based on multi-scenarios simulation and prediction of land use in Qinghai Lake basin. J. Arid Land Resour. Environ. 2023, 37, 46–55. [Google Scholar]
  23. Wang, J.; Ouyang, X.; Zhao, X. Review of grazing effect on carbon cycling in alpine grasslands. Acta Ecol. Sin. 2024, 44, 10119–10132. [Google Scholar]
  24. Yan, K.; Zhao, B.; Li, Y.; Wang, X.; Jin, J.; Jiang, J.; Dong, W.; Wang, R.; Yang, H.; Wang, T.; et al. Effects of the implementation intensity of ecological engineering on ecosystem service tradeoffs in Qinghai Province, China. Land 2024, 13, 848. [Google Scholar] [CrossRef] [Scilit]
  25. Borrelli, P.; Robinson, D.A.; Fleischer, L.R.; Lugato, E.; Ballabio, C.; Alewell, C.; Meusburger, K.; Modugno, S.; Schütt, B.; Ferro, V.; et al. An assessment of the global impact of 21st century land use change on soil erosion. Nat. Commun. 2017, 8, 2013. [Google Scholar] [CrossRef] [Scilit] [PubMed]
  26. Wang, Y.Q.; Xue, H.J.; Li, A.Q.; Ma, X.F.; Sun, A.L.; Zhang, J.H. Spatial-temporal differentiation and influencing factors of ecosystem health in Three-River-Source national park. Ecol. Indic. 2025, 171, 113183. [Google Scholar] [CrossRef] [Scilit]
  27. Liu, M.X.; Zhang, G.J.; Li, L.; Mu, R.L.; Xu, L.; Yu, R.X. Relationship between functional diversity and ecosystem multifunctionality of alpine meadow along an altitude gradient in Gannan, China. Chin. J. Appl. Ecol. 2022, 33, 1291–1299. [Google Scholar]
  28. Sun, A.; Zhang, H.; Xia, X.; Ma, X.; Wang, Y.; Chen, Q.; Fei, D.; Pan, Y. Response of ecosystem services to human activities in Gonghe Basin of the Qinghai–Tibetan Plateau. Land 2025, 14, 1350. [Google Scholar] [CrossRef] [Scilit]
  29. Zhang, Y.; Su, M.; Fang, T.; Yu, X.; Liu, L.; Wu, R.; Chi, Y.; Ding, Y. Practice and key construction tasks of grassland ecological protection compensation mechanism in China. Chin. J. Grassl. 2025, 46, 139–150. [Google Scholar]
  30. Zhang, X.; Li, Y.; Lv, C.; Bi, R.; Xia, L.; Guo, Y.; Wang, Y.; Xu, C.; Sun, B. Research progress on the application of ecosystem service functions based on InVEST model. Ecol. Sci. 2022, 41, 237–242. [Google Scholar]
  31. Hu, J.X.; Le, X.W.; Wang, W.L.; Xiong, Y.; Tan, X.L. Temporal and spatial evolution and prediction of ecosystem carbon storage in Jiangxi Province based on PLUS-InVEST model. Environ. Sci. 2024, 45, 3284–3296. [Google Scholar]
  32. Jiang, Y.; Alifujiang, Y.; Feng, P.; Yang, P.; Feng, J. A simulated assessment of land use and carbon storage changes in the Yanqi Basin under different development scenarios. Land 2024, 13, 744. [Google Scholar] [CrossRef] [Scilit]
  33. Zhang, X.; Tong, H.; Zhao, L.; Huang, E.; Zhu, G. Spatial and temporal dynamics and multi-scenario forecasting of habitat quality in Gansu–Qinghai contiguous region of the upper Yellow River. Land 2024, 13, 1060. [Google Scholar] [CrossRef] [Scilit]
  34. Hou, J. Assessment of Ecosystem Services in the Source Area of the Yellow River and Future Multi-Scenario Simulation; Guilin University of Technology: Guilin, China, 2023. [Google Scholar]
  35. Han, M.; Sun, R.; Feng, P.; Hua, E. Unveiling characteristics and determinants of China’s wind power geographies towards low-carbon transition. J. Environ. Manag. 2023, 331, 117215. [Google Scholar] [CrossRef] [Scilit]
  36. Wang, Y.; Xue, H.; Sun, A.; Li, A.; Wang, X.; Zhang, J. Effects of grazing activities on ecosystem health in three-river-source national park. J. Environ. Manag. 2026, 397, 128332. [Google Scholar] [CrossRef] [Scilit]
  37. Wang, J.; Xu, C. Geodetector: Principle and prospective. Acta Geogr. Sin. 2017, 72, 116–134. [Google Scholar]
  38. Li, M.; Zhang, X.; He, Y.; Niu, B.; Wu, J. Assessment of the vulnerability of alpine grasslands on the Qinghai-Tibetan Plateau. PeerJ 2020, 8, e8513. [Google Scholar] [CrossRef] [Scilit]
  39. Li, S.; He, W.; Wang, L.; Zhang, Z.; Chen, X.; Lei, T.; Wang, S.; Wang, Z. Optimization of landscape pattern in China Luojiang Xiaoxi basin based on landscape ecological risk assessment. Ecol. Indic. 2023, 146, 109887. [Google Scholar] [CrossRef] [Scilit]
  40. Gong, L.; Zhang, H.; Anwar, A.; Han, C. Spatial difference analysis of land use change and human impact in typical oasis in arid land. Arid Land Geogr. 2009, 32, 585–591. [Google Scholar]
  41. Wu, X.; Liu, F.; Liu, L.; Liu, F.; Caixiang, C.M. Changes and spatial characteristics of livestock population in Tibetan Plateau. Ecol. Sci. 2021, 40, 38–47. [Google Scholar]
  42. Zhang, S.; Yu, P.; Bai, S.; Gu, S.; Pan, J.; Shailaja, F.; Chen, Y. Study on the spatio-temporal stratified heterogeneity and driving factors of watershed landscape for national spatial planning. Ecol. Econ. 2020, 36, 219–227. [Google Scholar]
  43. Zheng, G.; Li, R.; Luo, J.; Li, C.; Li, M.; Zhu, H.; Guo, L. Study on ecological protection and restoration strategies of Qinghai-Tibet Plateau in the New Era: Take Qinghai Province as an example. J. Nat. Resour. 2024, 39, 2783–2797. [Google Scholar] [CrossRef] [Scilit]
  44. Yan, L. Study on the Impact of Photovoltaic Deployment in Taratan on Carbon Storage in Desert Grasslands. Master’s Thesis, Qinghai Normal University, Xining, China, 2024. [Google Scholar]
  45. Ye, M. Present situation and protection strategy of ecological environment in pastoral areas of Qinghai. Heilongjiang Environ. J. 2020, 33, 38–39. [Google Scholar]
  46. Jia, H.; Liu, L.; Liu, J. Desertification sensitivity assessment in the Gonghe Basin. J. Desert Res. 2025, 45, 1–9. [Google Scholar]
  47. Minaya, V.; Corzo, G.; Romero-Saltos, H.; Van Der Kwast, J.; Lantinga, E.; Galárraga-Sánchez, R.; Mynett, A. Altitudinal analysis of carbon stocks in the Antisana páramo, Ecuadorian Andes. J. Plant Ecol. 2016, 9, 553–563. [Google Scholar] [CrossRef] [Scilit]
  48. Pinto, E.; Cuesta, F.; Bernardi, A.; Llerena-Zambrano, M.; Pérez, Á.; van der Sande, M.; Gosling, W.; Burgess, K. Determinants of above-ground carbon stocks and productivity in secondary forests along a 3000-m elevation gradient in the Ecuadorian Andes. Plant Ecol. Divers. 2023, 16, 127–146. [Google Scholar] [CrossRef] [Scilit]
  49. Zhu, S.; Chen, X.; Zhang, C.; Fang, X.; Cao, L. Carbon variation of dry grasslands in Central Asia in response to climate controls and grazing appropriation. Environ. Sci. Pollut. Res. 2022, 29, 32205–32219. [Google Scholar] [CrossRef] [Scilit] [PubMed]
  50. Bonfanti, N.; Choler, P.; Khedim, N.; Clément, J.; Barré, P.; Goury, R.; Baudin, F.; Cécillon, L.; Saillard, A.; Thuiller, W.; et al. Drivers of soil organic carbon stocks and stability along elevation gradients. Geoderma 2025, 461, 117452. [Google Scholar] [CrossRef] [Scilit]
  51. Yan, H. Research report on the implementation of grassland ecological protection subsidy and reward policy in Haixi Prefecture, Qinghai Province in 2016. Chin. Qinghai J. Anim. Vet. Sci. 2018, 48, 35–38. [Google Scholar]
  52. Lu, N.; Wang, M.; Ning, B.; Yu, D.; Fu, B. Research advances in ecosystem services in drylands under global environmental changes. Curr. Opin. Environ. Sustain. 2018, 33, 92–98. [Google Scholar] [CrossRef] [Scilit]
  53. Cui, Y.; Mu, C.; Ji, W. Spatial differentiation and mechanism of carbon and nitrogen storage along water gradient in subalpine wetland ecosystem of Yueliangwan in Changbai Mountain. Acta Ecol. Sin. 2024, 44, 7977–7990. [Google Scholar]
  54. Li, F.; Han, H.; Yang, S. Analysis of land use change in Gansu Province from 2000 to 2020 and multi-scenario simulation of Gansu s ecological space based on PLUS. Sci. Technol. Eng. 2023, 23, 6316–6326. [Google Scholar]
  55. Hu, F.; Zhang, Y.; Guo, Y.; Zhang, P.; Lu, S.; Zhang, C. Spatial and temporal changes in land use and habitat quality in the Weihe River Basin based on the PLUS and InVEST models and predictions. Arid Land Geogr. 2022, 45, 1125–1136. [Google Scholar]
  56. Cord, A.F.; Bartkowski, B.; Beckmann, M.; Dittrich, A.; Hermans-Neumann, K.; Kaim, A.; Lienhoop, N.; Locher-Krause, K.; Priess, J.; Schröter-Schlaack, C.; et al. Towards systematic analyses of ecosystem service trade-offs and synergies: Main concepts, methods and the road ahead. Ecosyst. Serv. 2017, 28, 264–272. [Google Scholar] [CrossRef] [Scilit]
  57. Zhao, X.; Ma, P.; Li, W.; Du, Y. Spatiotemporal changes of supply and demand relationships of ecosystem services in the Loess Plateau. Acta Geogr. Sin. 2021, 76, 2780–2796. [Google Scholar]
  58. Zhang, Z.; Ding, J.; Zhu, C.; Wang, J.; Ge, X.; Li, X.; Han, L.; Chen, X.; Wang, J. Historical and future variation of soil organic carbon in China. Geoderma 2023, 436, 116557. [Google Scholar] [CrossRef] [Scilit]
  59. Valencia Torres, A.V.; Tiwari, C.; Atkinson, S.F. Progress in ecosystem services research: A guide for scholars and practitioners. Ecosyst. Serv. 2021, 49, 101267. [Google Scholar] [CrossRef] [Scilit]
  60. Shen, J.; Li, S.; Liang, Z.; Wang, Y.; Sun, F. Research progress and prospect for the relationships between ecosystem services supplies and demands. J. Nat. Resour. 2021, 36, 1909. [Google Scholar] [CrossRef] [Scilit]
  61. Yang, H.; Xu, Y.; Wang, L.; Xu, L. Spatio-temporal variation of human activity intensity and its driving factors on the Qinghai-Tibet Plateau. Acta Ecol. Sin. 2023, 43, 3995–4009. [Google Scholar]
  62. Zhang, Z.; Ding, J.; Li, L.; Cao, J.; Wang, K.; Zhu, C.; Ge, X.; Wang, J.; Yang, C.; Li, F.; et al. The impact of extreme climate on soil organic carbon in China. Geogr. Sustain. 2025, 100356. [Google Scholar] [CrossRef] [Scilit]
  63. Zhu, C.; Li, Y.; Ding, J.; Rao, J.; Xiang, Y.; Ge, X.; Wang, J.; Wang, J.; Chen, X.; Zhang, Z. Spatiotemporal analysis of AGB and BGB in China: Responses to climate change under SSP scenarios. Geosci. Front. 2025, 16, 102038. [Google Scholar] [CrossRef] [Scilit]
  64. Zhang, X.; Yin, Q.; Zheng, Z.; Sun, S.; Huang, J. Dynamic changes and key drivers of ecosystem service values in populous zones on the Tibetan Plateau: A 35-year analysis. Ecol. Indic. 2024, 167, 112620.52. [Google Scholar] [CrossRef] [Scilit]
  65. Li, T.; Feng, W.; Lü, Y.; Ma, L.; Liu, Y.; Luo, Y.; Liang, H. Quantifying impacts of livestock production on ecosystem services: Insights into grazing management under vegetation restoration. J. Clean. Prod. 2024, 470, 143359. [Google Scholar] [CrossRef] [Scilit]
Figure 1. Overview of the study area: (a) location of the Gonghe Basin on the Qinghai–Tibet Plateau, (b) geomorphology of the Gonghe Basin, and (c) land use in the Gonghe Basin.
Ijgi 15 00048 g001
Figure 2. Technical roadmap.
Ijgi 15 00048 g002
Figure 3. Spatiotemporal distribution of carbon storage at different altitudinal gradient in the Gonghe Basin.
Ijgi 15 00048 g003
Figure 4. Trends of carbon storage across elevation gradients in the Gonghe Basin, 2000–2020 (Figure (d): Mean value of carbon storage change during 2000–2020).
Ijgi 15 00048 g004
Figure 5. Spatial correlation analysis of carbon storage services at different altitudinal gradient in the Gonghe Basin, 2000–2020.
Ijgi 15 00048 g005
Figure 6. Vertical gradient correlation analysis of carbon storage services, 2000–2020.
Ijgi 15 00048 g006
Figure 7. Factor detection of the spatial heterogeneity of carbon storage across elevation gradients, 2000–2020. Slope (SLOPE), mean annual temperature (MAT), mean annual precipitation (MAP), NDVI, GDP density (GDPD), population density (PD), land use intensity (LUI), and grazing intensity (GI). (a) In the 2100–2800 m elevation zone independent effects of influencing factors, (b) In the 2800–4400 m elevation zone independent effects of influencing factors, (c) In the 4400–5500 m elevation zone independent effects of influencing factors, (d) In the2100–5500 m elevation zone independent effects of influencing factors.
Ijgi 15 00048 g007
Figure 8. Interactive effects of influencing factors on carbon storage across elevation gradients for 2000–2020.
Ijgi 15 00048 g008
Figure 9. The interactive explanatory power of NDVI and other factors and its coupling relationship with single factor explanatory power under different altitude gradients from 2000 to 2020 (Column: independent explanatory power of each factor q_single; broken line: NDVI × other factors’ interaction explanatory power q_interaction). (a) Elevation 2100–2800:q single & q interaction, (b) Elevation 2800–4400:q single & q interaction, (c) Elevation 4400–5000:q single & q interaction, (d) Elevation 2100–5000:q single & q interaction.
Ijgi 15 00048 g009
Table 1. Data sources and descriptions.
Data TypeData NameDataSpatial
Resolution
Source of Data
Land useChina land cover raster dataRaster30 × 30 mData Center for Resources and Environmental Sciences, Chinese Academy of Sciences
(http://www.resdc.cn/ (accessed on 5 May 2025))
Topographic and geomorphologic data Digital Elevation Model (DEM)Raster1 × 1 kmGeospatial data cloud
(http://www.gscloud.cn/ (accessed on 5 May 2025))
Meteorological
data
China’s 1 km resolution annual precipitation data
China’s 1 km resolution annual temperature Data
Raster1 × 1 kmNational Earth System Science Data Center (http://www.geodata.cn/ (accessed on 5 May 2025))
NDVINormalized Difference Vegetation IndexRaster30 × 30 mEarth Explorer
https://earthexplorer.usgs.gov/
(accessed on 5 May 2025)
Socioeconomic dataLivestock Carrying Capacity Raster1 × 1 kmThe National Tibetan Plateau Data Center (https://data.tpdc.ac.cn/ (accessed on 5 May 2025))
Population RasterRaster1 × 1 kmResource and Environmental Science Data Platform
(http://www.resdc.cn/ (accessed on 5 May 2025))
GDP RasterRaster1 × 1 kmResource and Environmental Science Data Platform
(http://www.resdc.cn/ (accessed on 5 May 2025))
Administrative boundariesAdministrative Division Map of China (2024)—From the National Fundamental Geographic Information DatabaseShp_China National fundamental geographic databases (https://www.webmap.cn/ (accessed on 5 May 2025))
Table 2. Carbon storage values across land cover categories.
Land Use TypeCaboveCbelowCsoilCdead
Arable land5.442.57123.831.24
Forest Land37.3615.60300.703.05
Grassland8.587.24205.220.36
Water body0.930.6682.201.23
Construction land3.292.1178.200.00
Unused land0.750.9856.500.00
Disclaimer/Publisher’s Note: The statements, opinions and data contained in all publications are solely those of the individual author(s) and contributor(s) and not of MDPI and/or the editor(s). MDPI and/or the editor(s) disclaim responsibility for any injury to people or property resulting from any ideas, methods, instructions or products referred to in the content.