Article

Vertical Urban Functional Pattern Analysis Based on Multi-Dimensional Geo Data Cube

Social Eco Tech Institute, KonKuk University, Seoul 05029, Republic of Korea
*
Author to whom correspondence should be addressed.
ISPRS Int. J. Geo-Inf. 2026, 15(1), 47; https://doi.org/10.3390/ijgi15010047
Submission received: 7 October 2025 / Revised: 9 January 2026 / Accepted: 17 January 2026 / Published: 21 January 2026
(This article belongs to the Special Issue Spatial Data Science and Knowledge Discovery)

Abstract

In a situation where cities are increasingly being developed vertically and complexly, a novel approach for analyzing vertical urban functional patterns is proposed. For this purpose, a multi-dimensional GDC (Geo Data Cube) consisting of spatial and temporal data x, y, z, t, and f dimensions containing layer information was created. At this time, the size of the GDC cell (interval in x, y, z dimensions) is calculated by cell point data using the three-dimensional (3D) Moran’s I index value calculated with the 3D Diversity Factor (DF) based on information entropy proposed to reduce the uncertainty of information for each cell. In other words, the cell with the smallest index value was chosen to minimize the influence of Modifiable Areal Unit Problem (MAUP) that occurs when mapping. The 3D land use index (3D LUI) is calculated as a linearly weighted sum of the spatial accessibility of uses between cells (3D KDF) and the enrichment of uses (3D EF), taking into account the first law of geography. Finally, the 3D LUI value for each use was calculated for each cell of the GDC, and the use with the highest value was determined as the urban function of the cell. As a result of applying this to Seocho-gu, Seoul, Republic of Korea (ROK) in June 2024 and visually evaluating it using the street view provided by Kakao Map, it was confirmed that commercial and residential functions were vertically separated in buildings with residential–commercial complexes or shops on the ground floor. It was also confirmed that such characteristics did not appear in the two-dimensional (2D) urban functional patter analysis.

1. Introduction

With the concentration of population in cities, urban areas are increasingly being developed in vertical and complex forms to enhance land use efficiency. In urban development research, concepts such as compact cities and mixed-use development have long been discussed. Mixed land use affects factors such as public transportation use and pedestrian volume, thereby explaining urban characteristics, and has been widely studied in urban planning, public health, transportation planning, and environmental studies [1,2,3]. Internationally, numerous studies have utilized Point of Interest (POI) data provided by private platforms to analyze the degree of land use mix and urban functions [4,5,6,7]. Researchers have applied natural language processing techniques and density-based methods to detect urban functions using the spatial coordinates and categorical information contained in POI data. For example, Wang et al. [4] used POI and road network data to extract urban functional regions through kernel density analysis, while Hu et al. [5] conducted analyses based on frequency density and category ratios of POI data. Furthermore, Niu and Silva [6] applied Doc2Vec-an extension of Word2Vec-to POI category data to extract urban functional regions, and Luo et al. [7] applied Kstar, a machine learning-based classifier, for the same purpose.
However, although mixed land use has emerged as a key strategy for sustainable and low-carbon urban development by promoting urban mobility and energy efficiency, previous studies have been limited to two-dimensional analyses. Such approaches fail to account for the vertical complexity of contemporary urban environments. In high-density compact cities, particularly metropolitan areas, it is necessary to understand three-dimensional (3D) spatial structures of land use, encompassing both horizontal and vertical dimensions [3]. For example, large-scale mixed-use complexes with vertically integrated functions, such as Lotte World Tower in Seoul, Republic or Korea (ROK), exert transportation and pedestrian flow impacts that differ substantially from those associated with horizontally distributed land use.
In recent years, increasing attention has been devoted to studies analyzing the characteristics of vertical urban space. Cai et al. [8] explored the spatial distribution, temporal evolution, and driving factors of 3D urban morphology in three major Chinese metropolitan areas using a modified Local Climate Zone (LCZ) framework. Their results demonstrated that high spatiotemporal resolution LCZ maps are useful for investigating urban issues from a 3D perspective and for improving the understanding of the dynamic mechanisms underlying 3D urban form and its influencing factors. Yang et al. [9] enhanced kernel density estimation and an improved contour tree approach to quantify spatial diversity and complexity, subsequently abstracting 3D urban structures through spatial interpolation after feature filtering. When applied to the central urban area of Chengdu, their method revealed a depressed 3D structure characterized by a low-lying core surrounded by higher peripheral areas. He et al. [10] proposed a horizontal and vertical multi-type urban landscape dynamics framework (HV-MVCA) at the parcel level. This framework integrates an SResNet-deep learning model to simulate horizontal urban landscape dynamics at the parcel level and a Random Forest-based vertical indicator prediction module incorporating natural physical and socioeconomic attributes. The multi-scenario simulation results provided rich horizontal and vertical information at the parcel scale. Wang et al. [11] simulated a 3D urban landscape model and vertical growth scenarios for Kwu Tung North (KTN), Hong Kong, to evaluate their impacts on habitability and aesthetic quality. They developed the Vertical Urban Habitability Index (VUHI) to propose optimization strategies for building height and floor area ratio. Chen et al. [12] constructed a 3D functional composition dataset using natural language processing and rule-based methods and developed a floor-level proximity index accounting for both horizontal travel time and vertical movement (e.g., stairs and elevators). Using Nanjing, China, as a case study, they assessed 15 min accessibility by aggregating POI-based facilities at the floor level and calculating the proportion of facility types per floor. These proportions were used as the basic functional composition of each floor. For buildings with available Area of Interest (AOI) data, AOI types were assigned to floors, while floor functions for buildings lacking AOI data were inferred from parcel-level land use types. Although these studies considered spatial characteristics to detect urban functions, floor-level functions were primarily derived from POI counts or proportional distributions within buildings, leaving the 3D spatial patterns of urban functions insufficiently explored.
Recently, the Ministry of Land, Infrastructure, and Transport (MOLIT), Republic of Korea (ROK) has been developing environments that enable 3D spatial analysis and simulation through projects such as the National Digital Twin project. In this context, the present study aims to analyze vertical land use patterns. However, detailed 3D spatial information containing surveyed height values is not publicly available due to security restrictions. To address this limitation, this study proposes a method to analyze the vertical urban functional pattern at the city scale by applying the Geo Data Cube (GDC), a model recently discussed by the Open Geospatial Consortium (OGC) for managing time-series satellite imagery [13]. Unlike conventional approaches that project POI data onto a two-dimensional (2D) grids for urban function analysis, this study utilizes the GDC to define and analyze multi-dimensional spatial structures. A Data Cube (DC) is a multi-dimensional data model composed of dimensions and facts [14]. DCs offer many advantages in policy applications, efficient data management, standardization, and interoperability of geospatial information [15]. Building upon the DC concept, the OGC defines GDC as a method for storing spatio-temporal data in multi-dimensional arrays.
Most previous studies related to DC and GDC [16,17,18,19,20,21] have focused on raster-based time-series satellite imagery, while recent research has begun to explore applications using vector-based spatial data. Gao et al. [22] proposed GeoCube to process multi-source geospatial data dimensions and enable high-performance spatial data processing. Abad et al. [23] proposed a vector data cube for structuring and analyzing spatial and temporal features with spatio-temporal variability, considering both cube (array) and table formats. While these studies presented methods and systems for constructing GDCs using vector data, they did not conduct 3D spatial analyses to examine urban spatial patterns and characteristics.
Therefore, this study constructs a multi-dimensional GDC by converting floor-level information from public data into height values, proposes a 3D land use index using floor-level usage information within each GDC cell, and aims to identify vertical urban functions. Whereas most existing DC-based studies are limited to 2D analyses using uniform grid sizes, this study proposes a 3D spatial analysis approach to infer vertical urban functional patterns.

2. Analyzing Vertical Urban Functional Pattern Based on Multi-Dimensional GDC

2.1. Technology for Constructing Multi-Dimensional GDC

2.1.1. Design of Multi-Dimensional GDC

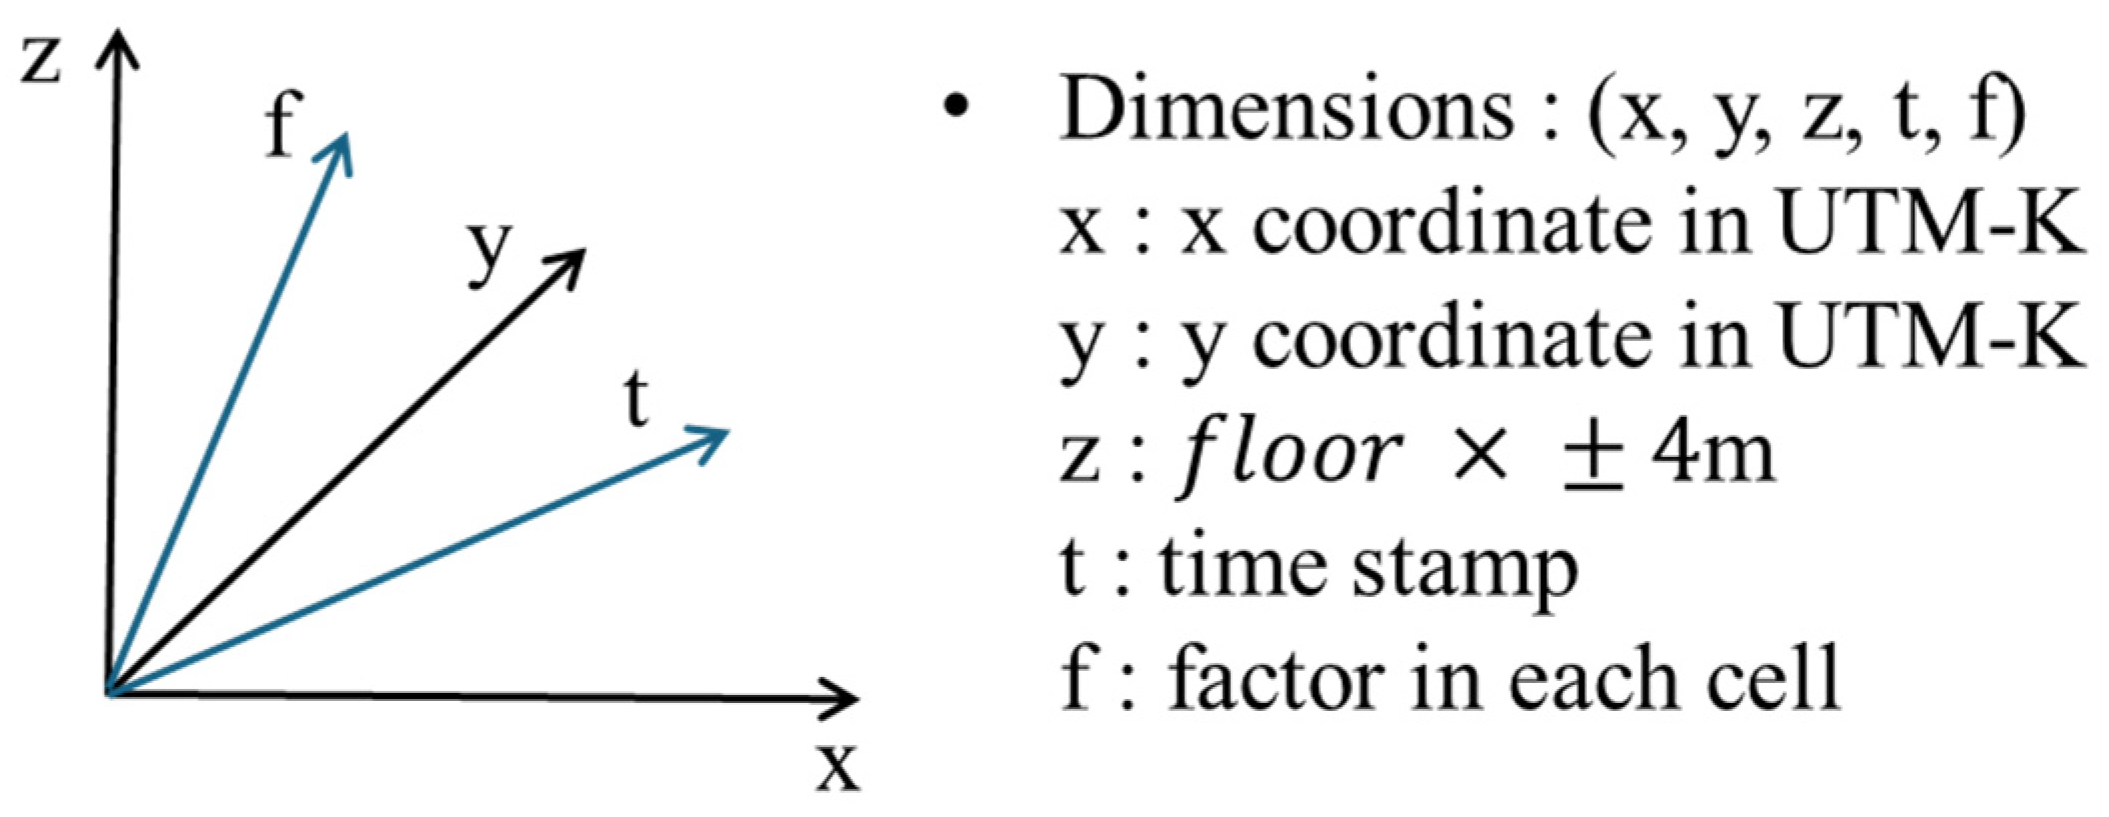
In this study, a multi-dimensional GDC was designed to analyze vertical land use by incorporating 3D spatial coordinates ( x , y , z ) , time t , and cell-level factors(attributes) f (Figure 1). Currently, comprehensive city-scale 3D spatial information has not been fully established in ROK. Consequently, analyses of vertical land use and urban characteristics at the city level must rely on 3D cell-based representations, such as voxels.
First, the x and y dimensions were defined using reference points of the National Point Number Grid, which is utilized by the Ministry of the Interior and Safety (MOIS) for applications in mountainous and other areas. These coordinates were expressed in a planar rectangular coordinate system (UTM-K). At present, datasets containing explicit height values are not widely available, which limits the direct use of elevation information. Therefore, floor-level information was derived from publicly available address data, specifically detailed address components indicating floor numbers.
To incorporate floor levels as an independent dimension of the GDC, the discrete attribute of floor number was transformed into a continuous variable. Although floor heights vary among buildings in urban environments, Article 119(1)9 of the Enforcement Decree of the Building Act [24] stipulates that, for buildings in which floor distinctions are unclear, one floor may be assumed to correspond to a height of 4 m. Based on this regulation, each floor was assumed to represent 4 m, and the z dimension was defined by converting floor numbers into height values. In other words, based on the previously defined 2D grid ( x and y ), the z dimension was stacked upward in increments of +4 m for above-ground floors and downward in increments of −4 m for underground floors. As a result, the z dimension was not referenced to geodetic vertical datums such as a geoid or ellipsoid. Instead, an arbitrary 3D GDC was constructed using 0   m , 0   m , 0   m as the origin.
Third, considering the update cycles of the public datasets used in this study, temporal units such as year, month, and day were defined as the t dimension.
Finally, representative values were derived from the public datasets corresponding to each four-dimensional GDC cell, and these values were defined as the factor dimension f . Through this process, the final multi-dimensional GDC was constructed.

2.1.2. Hierarchical Cell Partitioning Based on 3D Diversity Factor (DF)

The DF is a concept introduced by Shannon’s information theory and is used to quantify disorder within a system as well as to evaluate complexity and balance among systems, based on Information Entropy (IE) [25]. In the context of land use, DF represents the degree to which different land use types are evenly mixed within a spatial unit [26]. However, analyzing an entire city using spatial units of uniform may introduce uncertainty due to spatial heterogeneity, highlighting the need to determine appropriate cell size [27]. In particular, accurately identifying functional regions in mixed-use environments requires selecting an optimal grid size that reflects the degree of land use mixing [28]. Therefore, to analyze representative land use characteristics within each cell, it is necessary to adjust the cell sizes using DF so that the land use mixtures are expressed in a balanced manner.
In this study, a 3D DF is proposed to analyze vertical land use patterns. For example, the functional impact in which only the first floor is used for commercial purposes differs substantially from that of a building in which the first through third floors are all used commercially. To capture such vertical differences, the floor area of each building level was incorporated as a weighting factor. To minimize information uncertainty within a cell, a dynamic cell partitioning process based on the proposed 3D DF was designed as follows.
Identify building use data within each cell and account for the floor area associated with each land use type. If the building use type is denoted as l , the total floor area of building use type k within the cell is expressed as A k   ( k = 1 ,   2 ,   ,   l ) , and the total floor area of all building use types within the cell is A   ( A = k = 1 l A k ) .
Based on the building use composition within each cell, calculate the DF by considering floor area as a weight. Here, A k m   ( m = 1 , 2 , , M ) represents the total floor area of building use type k in cell ( m ) , and m denotes the total number of cells in the city. Consequently, the probability P k m that land use type k occurs in cell ( m ) , weighted by floor area, is calculated using Equation (1).
P k m = A k m k = 1 l A k m
Finally, the 3D DF( D F k m ) considering the area of each cell ( m ) is calculated by Equation (2).
D F k m = k = 1 i P k m × log P k m
When calculating the 3D DF, the process of mapping building use data (i.e., point data) to cells inevitably introduces the Modifiable Areal Unit Problem (MAUP), which can influence spatial analysis. Lee [29] noted that MAUP arises when the same geographic area is aggregated in different ways. Although the selection of spatial units is arbitrary, the results are systematically related to the selected units [30]. MAUP consists of two components: the scale effect and the zoning effect. The scale effect refers to variations in analytical results when different spatial resolutions are applied, while the zoning effect refers to differences in outcomes resulting from alternative aggregations or boundary configurations at the same scale. In other words, when floor-level building use point data are aggregated into grid-based or other spatial units, the number and distribution of points data assigned to each unit depend on the size and shape of those units (e.g., the placement of grid boundaries), resulting in different statistics and analytical outcomes.
Previous studies analyzing land use mixing or urban functional regions [31,32] has typically compared results derived from different spatial units, such as blocks, grids, objects, or traffic analysis zones. However, these studies did not explicitly assess MAUP at the level of spatial units. As MAUP is an inherent phenomenon arising from spatial aggregation and spatial dependence in geographic data. Therefore, in this study the initial cell size for constructing the GDC was determined to minimize MAUP effects, and cells were subsequently dynamically partitioned based on the DF value of each cell.
The x and y dimensions of the GDC were defined using grid resolutions of 1 km (1000 m), 500 m, 250 m, and 125 m. According to previous urban planning–related studies [4], a grid size of 1000 m represents a commonly adopted 2D spatial resolution that is consistent with the scale of most cities. In addition, considering the 200 m resolution applied by [7], the grid was further subdivided to 250 m and subsequently to 125 m by additional halving. For applications requiring more fine-grained spatial analysis, the cell size can be further refined. For the z dimension, the criteria for high-rise buildings—defined as buildings with 30 floors or more or heights of 120 m or more in Article 2, Clause 19 of the Building Act [33]—were applied. Accordingly, the vertical dimension was sequentially divided, in correspondence with the x and y dimensions into intervals of 120 m, 60 m, 30 m, and 15 m.
Subsequently, a spatial autocorrelation index was applied to quantify the degree to which attribute values of neighboring spatial units resemble one another using standard statistical formulations. Spatial autocorrelation analysis is widely used in studies of spatial partitioning because it can identify whether spatial patterns are clustered, discrete, or random [34,35,36]. To evaluate the similarity of 3D DF patterns across different cell sizes, the global 3D Moran’s I statistic for the entire study area was calculated [37] (Equation (3)).
I 3 D = N S o   j = 1 d 1 × d 2 × d 3 i = 1 d 1 × d 2 × d 3 w i j   x i x ¯ ( x j x ¯ ) i = 1 d 1 × d 2 × d 3 w i j x i x ¯ 2
where I 3 D is the 3D Moran’s I index; N , total number of cells in the dataset; S o , total number of contiguous pairs in the GDC dataset; w i j , weighted value of distance, 1 for contiguous neighbors and 0 otherwise; d 1 , d 3 , d 3 , respectively, the length, width, and height of the GDC study area; and x i , x j the value of the variable at cell i and cell j , respectively.
The calculated 3D Moran’s I values ( I 3 D ) range from −1 to +1. Positive values indicate positive spatial autocorrelation, meaning that neighboring spatial units exhibit similar attribute values, whereas negative values indicate negative spatial autocorrelation, where neighboring units exhibit dissimilar values. In this study, the cell with the smallest 3D Moran’s I value is considered the least affected by the MAUP when aggregating point data to cells. Accordingly, this cell is selected as the unit cell size for subsequent urban functional region analysis.
Next, the threshold for determining whether a cell should be subdivided was defined using the boxplot method, which has been proposed for matching heterogeneous spatial datasets [38]. Specifically, the third quartile (75th percentile, Q3) of the 3D DF distribution was adopted as the subdivision threshold. For example, if a cell with x and y dimensions of 500 m and a z dimension of 60 m has a 3D DF greater than Q3, the cell is subdivided into smaller cells of 250 m × 250 m × 30 m. This subdivision process applied iteratively until the minimum cell dimensions of 125 m, 125 m, and 15 m are reached along the x , y and z dimensions, respectively.

2.2. 3D LUI (Land Use Index) for Analyzing Urban Functional Patterns

Tobler [39] formulated what is widely known as the First Law of Geography, stating that “everything is related to everything else, but near things are more related than distant things” [35]. In essence, this principle implies that spatially proximate observational units tend to exhibit similar attributes [40,41]. Just as pharmacies tend to cluster around hospitals, urban functions also exhibit spatial dependence. To capture this characteristic in 3D urban space, we propose a 3D LUI.
The 3D LUI assigns representative values (fact dimension, f ) to cells defined by x and y coordinates, a temporal dimension ( t ), and z dimension derived from building floor levels. In this study, the 3D LUI is defined as a linear weighted sum of two components commonly used in urban function analysis: spatial accessibility between cells, represented by the 3D Kernel Density Factor (3D KDF) and the richness of land use types, represented by the 3D Enrichment Factor (3D EF). A higher 3D LUI value indicates that a given space is more likely to serve a specific urban function when it exhibits both strong spatial accessibility (high 3D KDF) and a rich composition of building uses (high 3D EF). After computing the 3D LUI values for each urban function category within a given cell, the urban function of that cell is ultimately identified as the category associated with the maximum 3D LUI value.

2.2.1. 3D KDF

Unlike conventional density measures based on simple counts or areal units, which may ignore the aggregation of objects or the continuity of spatial phenomena, the spatial accessibility of land use types can be evaluated using a continuous, cell-centered density that accounts for the probability of occurrence as a function of spatial distance between objects. In previous studies, urban functional regions have been identified using the KDF, derived from Kernel Density Estimation (KDE) applied to POI data [27,42,43].
KDF calculates the contribution of points within a given radius to the density at the center of cell using a kernel function. In this study, a spherical radius was adopted to compute the KDF in 3D space. Accordingly, the resulting 3D KDF reflects the spatial distribution pattern of building uses surrounding each cell, with higher values indicating more densely clustered distributions. The 3D KDF is calculated according to Equation (4).
K D F i q = 1 n q h j = 1 n q k ( x q x j q h q )
where K D F i q represents the 3D KDE of building in category q in cell i , k ( x q x j q h ) is the kernel function, n q is the number of known buildings in category q in cell i , h q is bandwidth of category q , and x q x j q is the distance from the cell center point to the known building j in category q in cell i .
In Equation (4), the determination of the bandwidth ( h ) plays a critical role in generating the kernel density estimation results, as it controls the degree of smoothing. In this study, the search radius proposed by [44] was adopted as the bandwidth, as defined in Equation (5). This approach considers the spatial dispersion of the input dataset, mitigates the ring-around-the-points phenomenon that often occurs in sparse datasets, and is robust to spatial outliers.
Yang et al. [9] conducted comparative experiments using fixed bandwidth values of 50, 100, 200, 400, 600, 800, and 1000 m, as well as bandwidths computed using the search radius. Their results demonstrated that the search radius effectively captures global spatial trends while preserving essential local variations, produces less fragmented patterns, and reveals more distinct structural characteristics.
h q = 0.9 × min S D , 1 ln 2 × D m × n 0.2
For the kernel function in Equation (4), the quartic function proposed by [44] was employed (Equation (6)).
K x = 4 m ( 1 X T X ) 3                                     i f   X T X < 1 0                                                                                         o t h e r w i s e

2.2.2. 3D EF

As suggested by [45], the EF provides a more effective means of identifying the intrinsic function of a cell than simple density-based measures of building land use. The EF has been widely applied to measure whether a specific type of POI is overrepresented or underrepresented within a cluster relative to the overall study area [6,46]. In this study, the same concept was extended to calculate the cell-level 3D EF (Equation (7)). When the 3D EF value is greater than 1 indicates that the corresponding land-use type is relatively overrepresented (i.e., functionally dominant) within the cell compared to the study-area average, whereas a 3D EF value less than 1 indicates an underrepresented distribution.
E F j q = ( N i q N i ) ( N q N )
where E F j q represents the 3D EF of building in category q in cell i , N i q represents the count of building in category q in cell i , N i represents the total building count in cell i , N q represents the total building count in category q , and N represents the total count of building throughout the city (study area).

2.2.3. 3D LUI

As shown in Equation (8), the 3D LUI, representing vertical function, which represents vertical urban functions, is calculated by applying weights to the 3D KDF and 3D EF values for each cell. The weights were determined using the Entropy Weight Method (EWM) [47], an objective weighting approach that assigns weights according to the information content (entropy) of multiple indicators. EWM has been widely applied in fields such as ecology, environmental studies, economic development, and social sciences. In this method, each indicator is first normalized to a common scale, after which entropy values are computed to determine the corresponding weights.
L U I i q = w 1 × K D F i q ¯ + w 2 × E F i q ¯
where K D F i q ¯ , E F i q ¯ are normalized values of K D F i q , E F i q respectively which are in the range of [0, 1]. w 1 , w 2 are determined by the EWM.
Once the 3D LUI are computed for all urban function categories within each cell, the urban function of that cell is assigned to the category associated with the maximum 3D LUI value.

3. Test and Results

3.1. Study Area and Data

3.1.1. Study Area

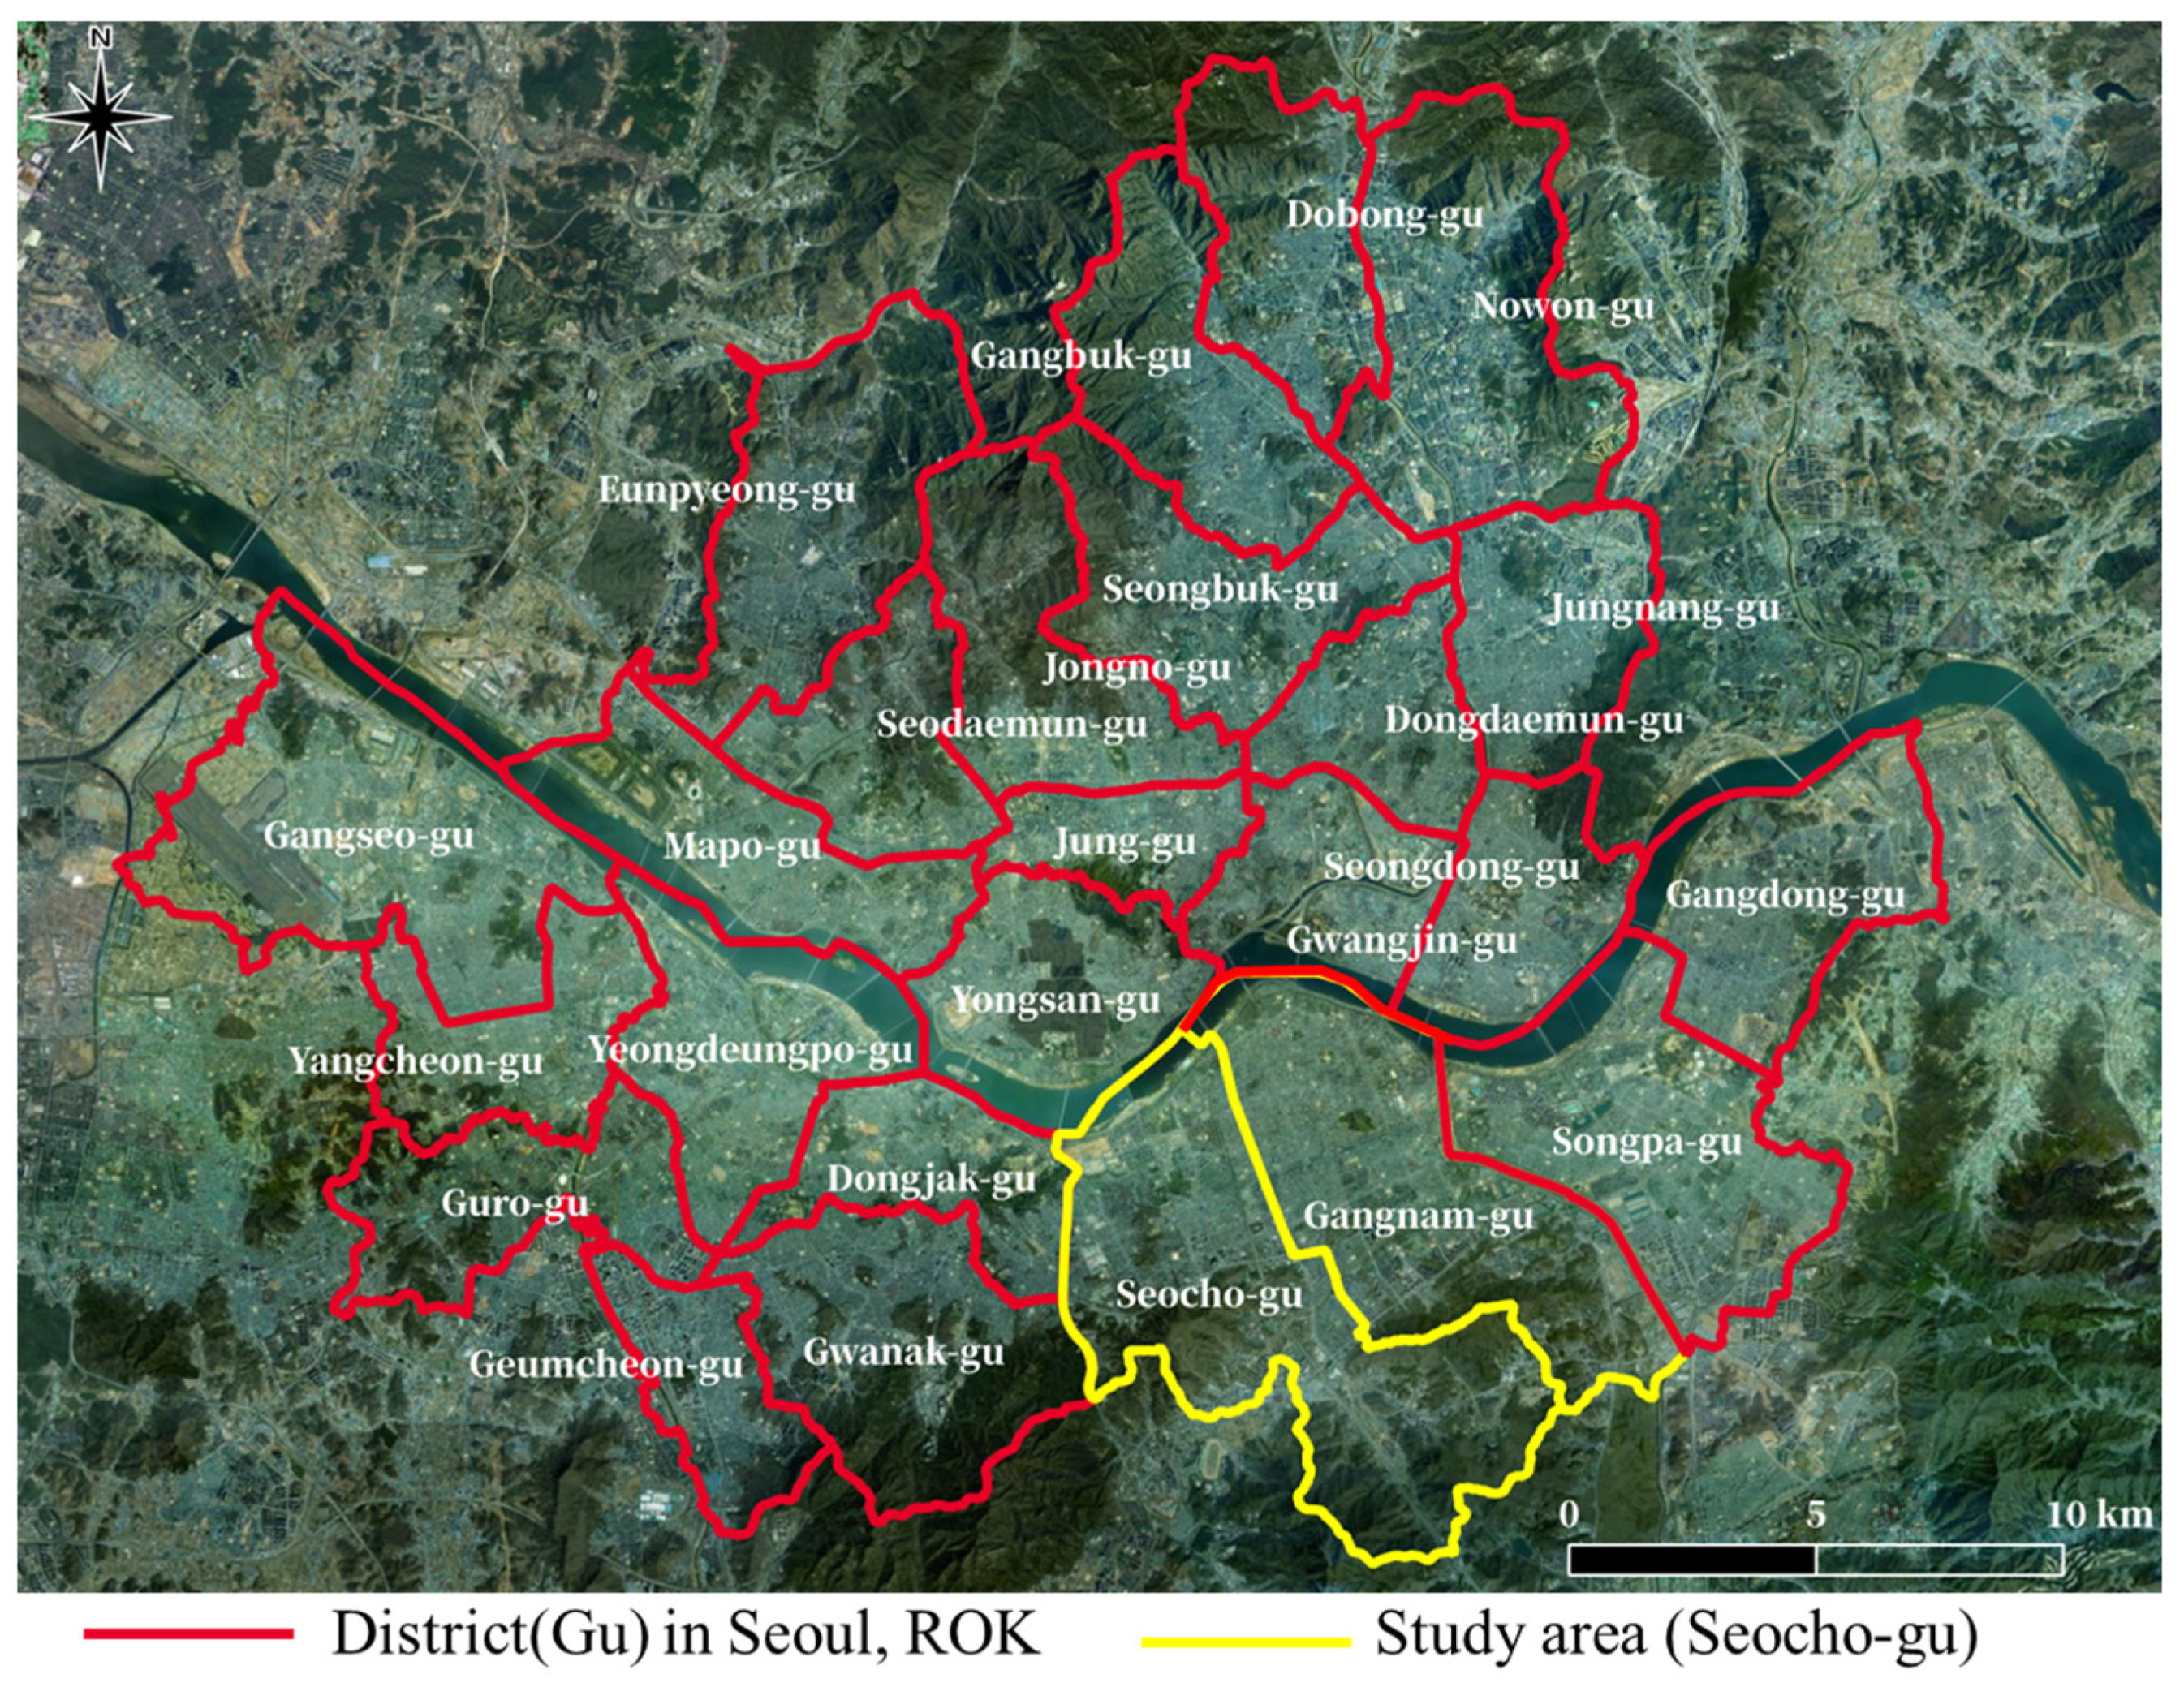
To analyze vertical urban functional patterns, this study focuses on Seoul, ROK, where building density is particularly high. As the capital of ROK, Seoul is almost entirely urbanized, with an urbanization rate approaching 100%. Within Seoul, Seocho-gu was selected as the study area (Figure 2).
In Seocho-gu, land designated for residential, commercial, and industrial uses accounts for 43.01% of the total administrative area, indicating a high level of land-use intensity and functional diversity. The district is not dominated by a single land-use type, such as exclusively residential or commercial zones, but instead contains a mixture of various urban functions. In addition, Seocho-gu has a population of 412,479, which is comparable to the average population of districts in Seoul, making it a representative case for analyzing vertical urban functional patterns.

3.1.2. Study Data and Preprocessing

Previous studies analyzing urban functions have frequently relied on POI provided by private portal services. However, in ROK, POI data are not freely available from private portal companies, and only a very limited subset of POIs accessible through portal OpenAPIs (Application Programming Interfaces) contains floor-level information. Moreover, while POI datasets typically include apartments or mixed-use residential–commercial buildings, they often exclude detached houses.
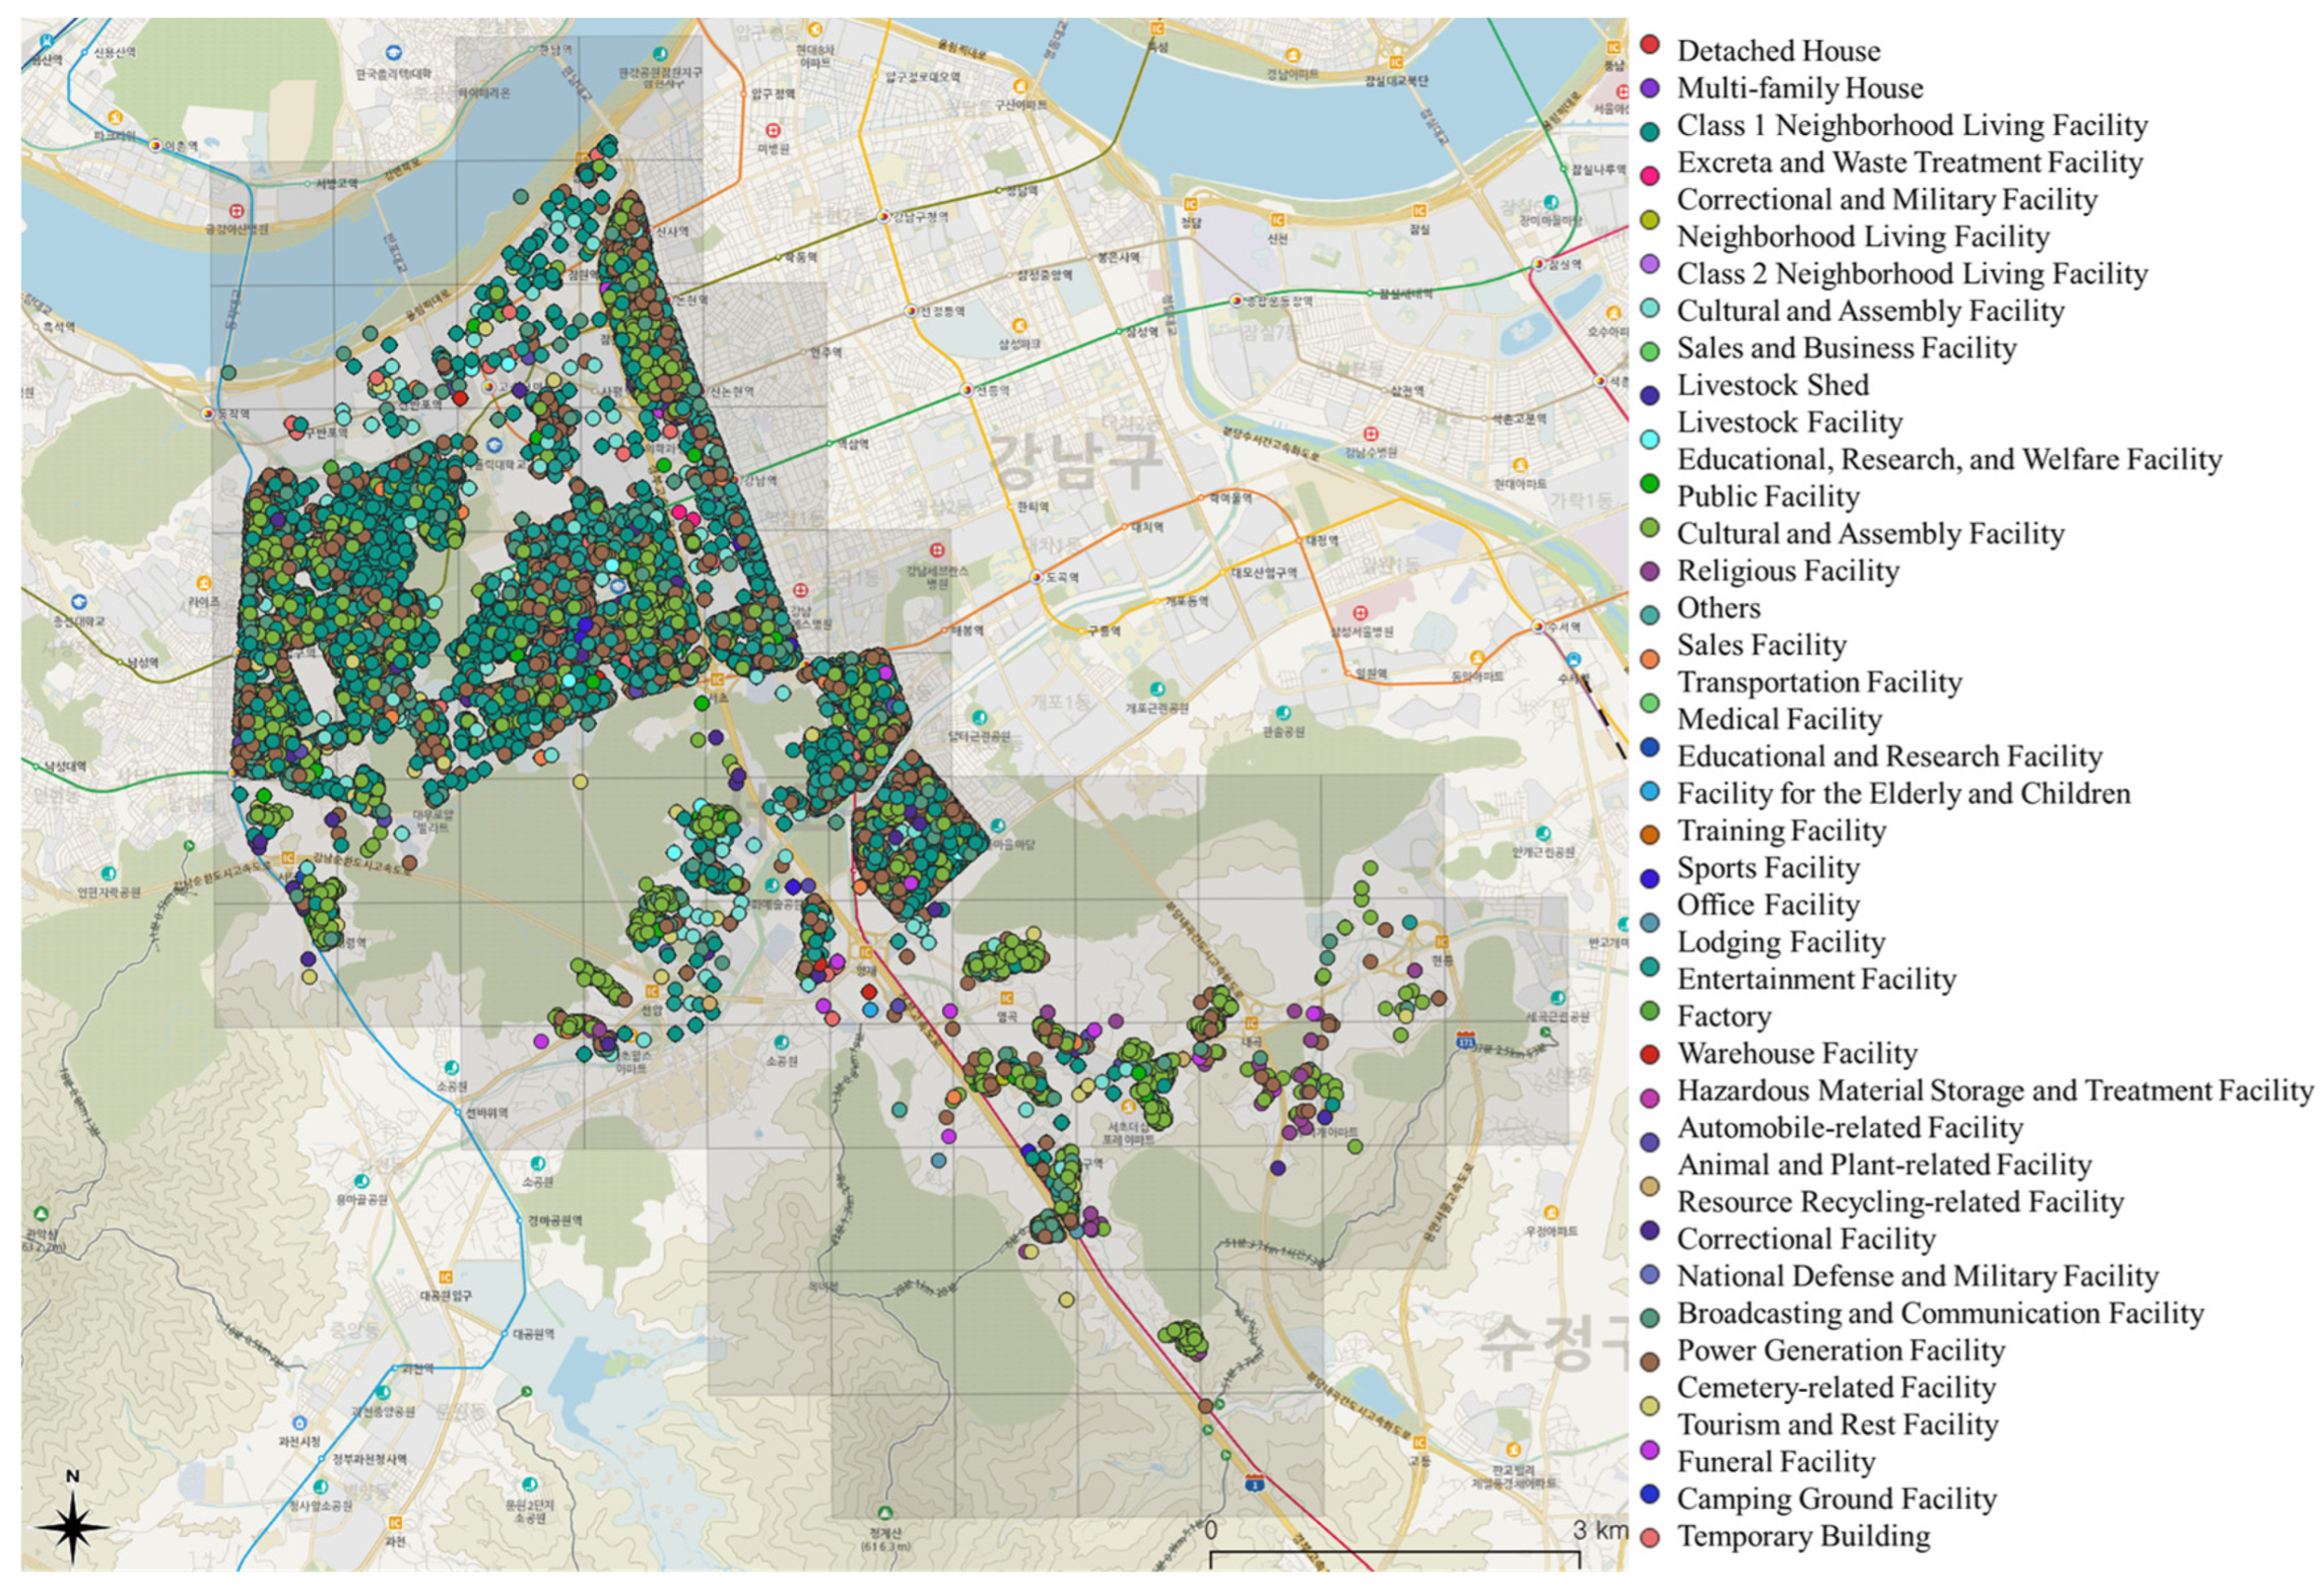
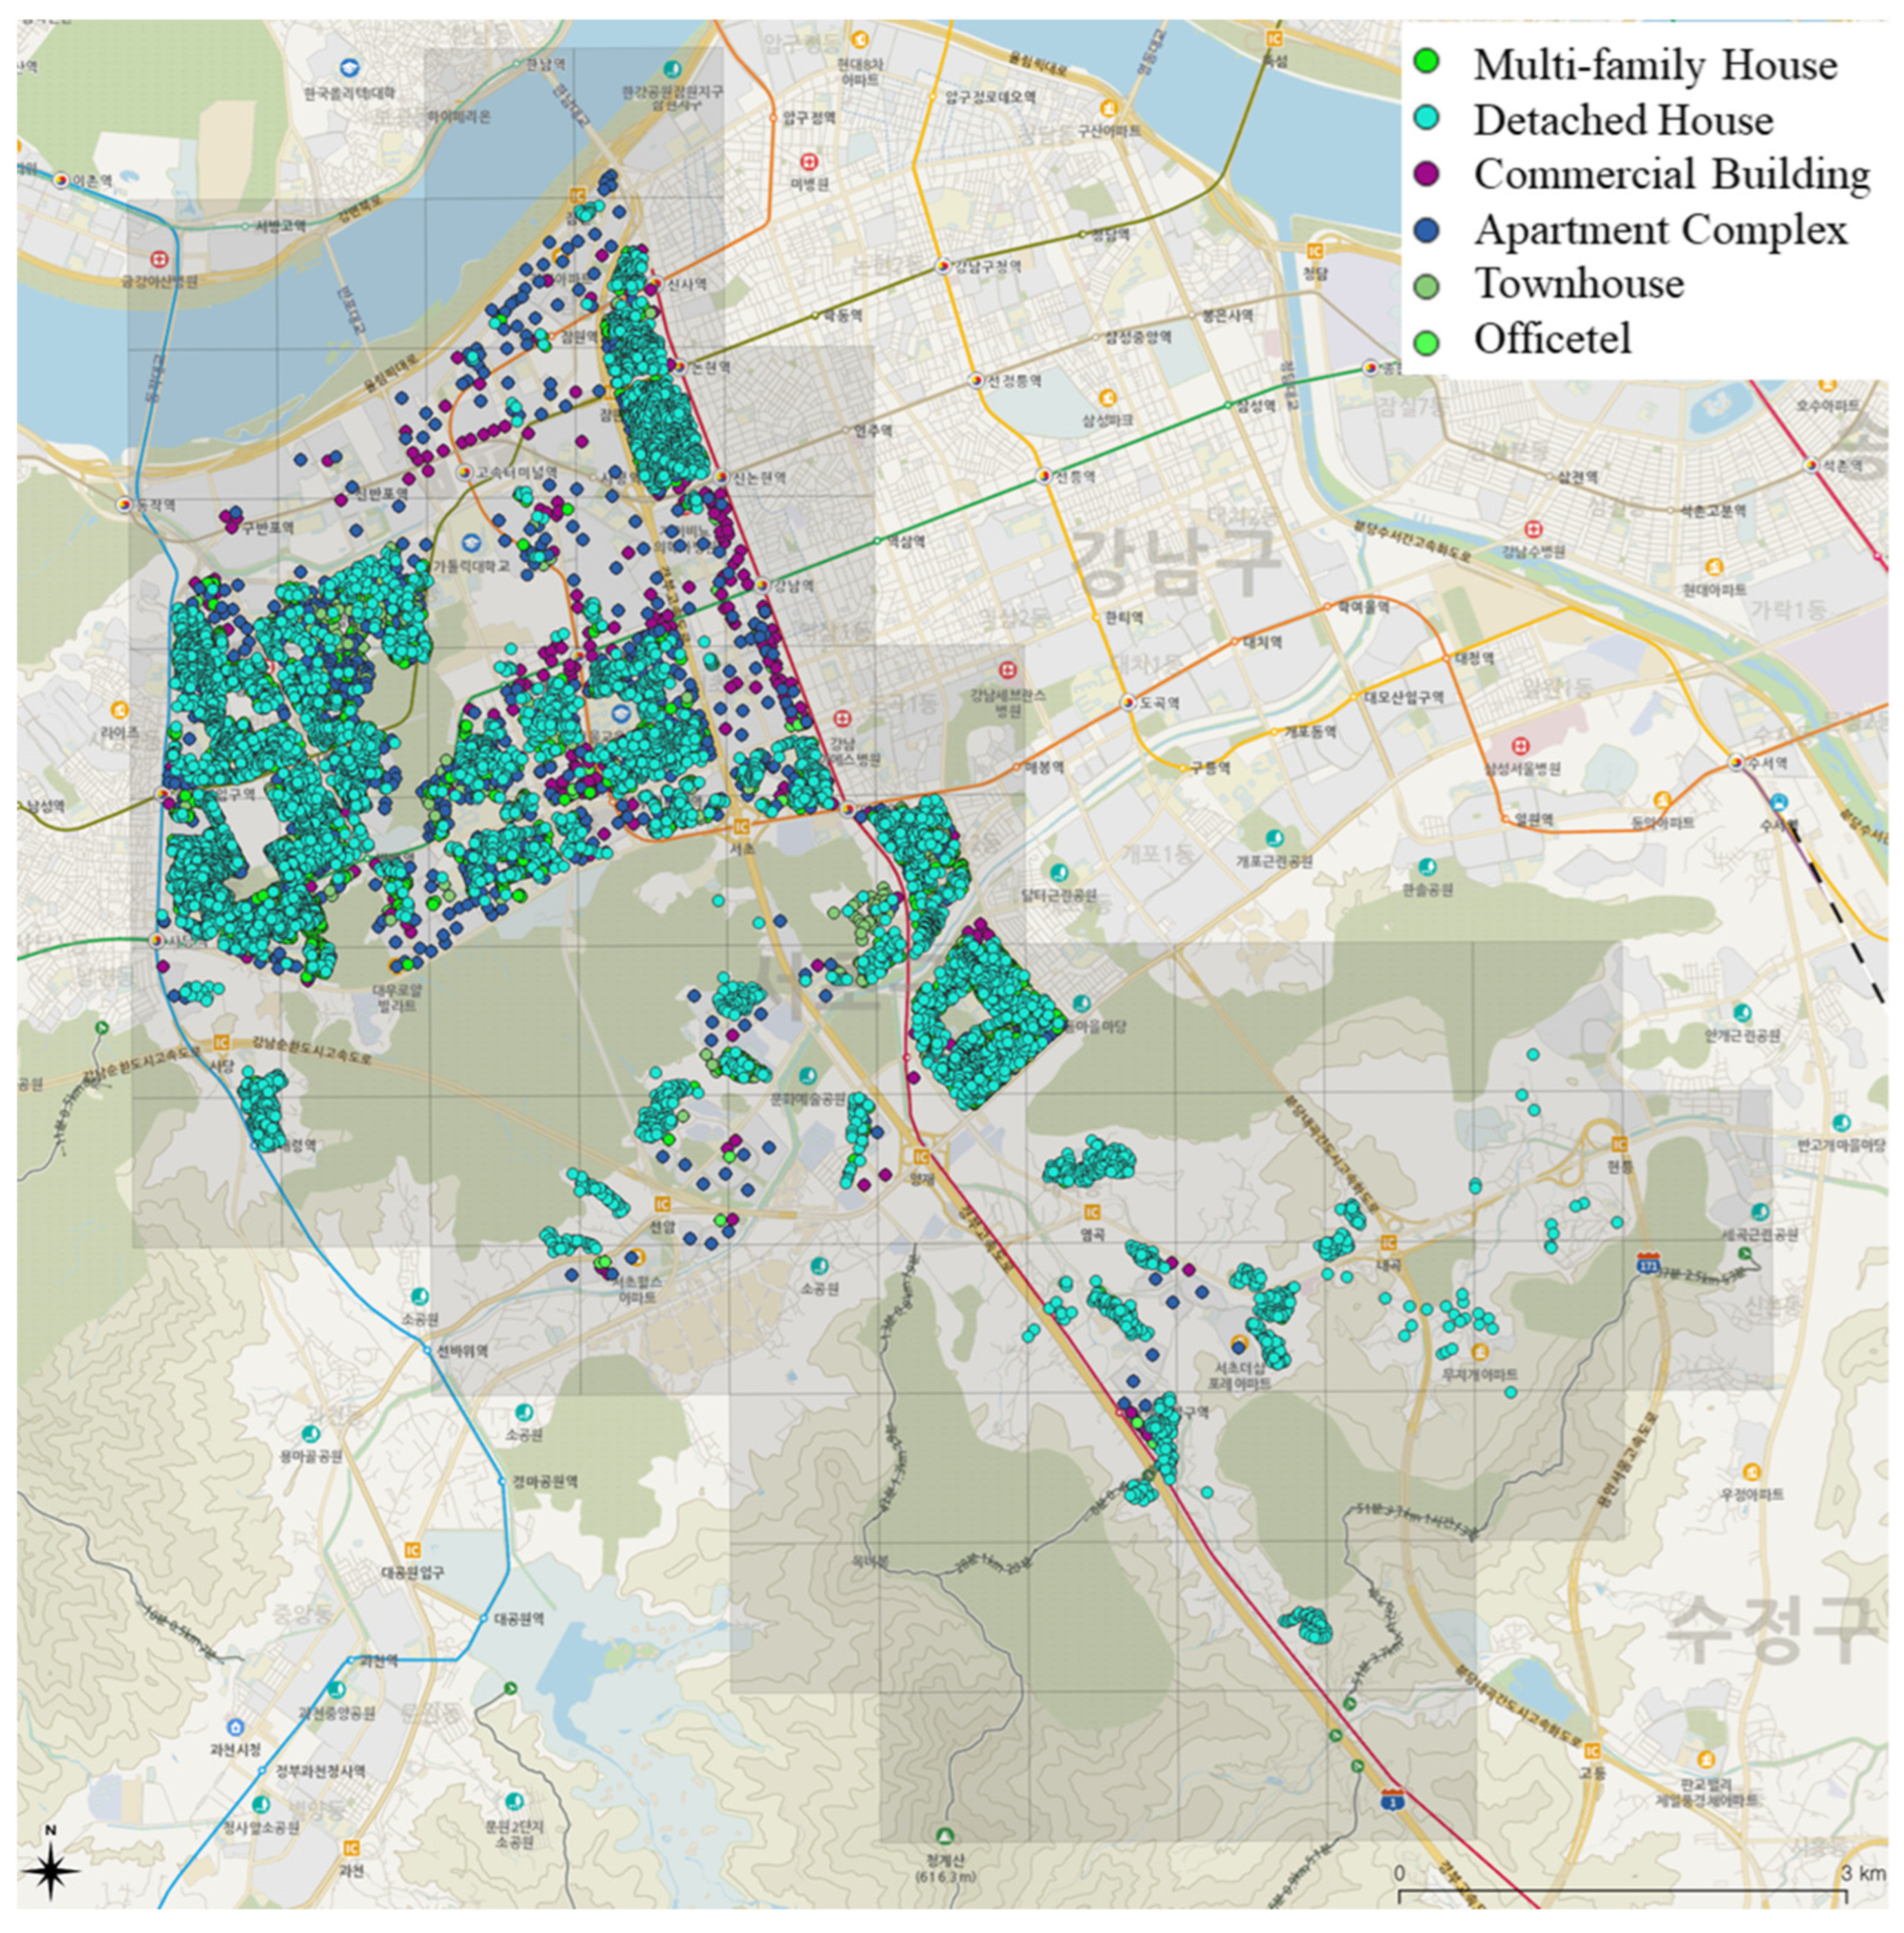
To address these limitations and accurately detect vertical urban functional patters, this study utilized floor-level use information registered in the Building Register, together with monthly floor-level summary data provided by the Building Data Open Platform (https://www.hub.go.kr/portal/main.do (accessed on 1 January 2026)). Using the ‘Si/Gun/Gu code’ field in the floor-level summary dataset, a total of 125,857 floor-use records corresponding to the study area of Seocho-gu, Seoul, were extracted (Figure 3). The 41 building-use categories recorded in the ‘Main Use Code’ field were subsequently reclassified into five functional groups: residential, commercial, industrial, public service, and transportation uses.
Next, the floor numbers were converted into floor-height values by multiplying the ’Floor Number’ field in the floor-level summary dataset by a per-floor height of 4 m. Subsequently, columns related to lot numbers or road-name addresses in the extracted floor-level summary dataset were matched with the address information fields in the building information table of the navigation database provided by the Address-Based Industry Support Service of the National Address Information Portal (https://business.juso.go.kr/addrlink/main.do (accessed on 1 January 2026)). Through this matching process, the address records were geocoded to obtain x and y coordinates.
Through these preprocessing steps, an experimental dataset containing urban function categories, spatial coordinates, floor numbers, and floor-height values was constructed. All datasets used in the experiments were compiled in June 2024, and detailed information on the datasets is summarized in Table 1.

3.2. Experimental Results

The experiments for generating the multidimensional GDC were conducted using Python (v3.9.13) with open-source spatial libraries such as Shapely and SciPy Spatial for spatial operations.
To determine the initial cell size, four cell configurations—1 km × 1 km × 120 m, 500 m × 500 m × 60 m, 250 m × 250 m × 30 m, and 125 m × 125 m × 15 m—were generated. The experimental data were mapped onto the GDC using floor-height information. Subsequently, the 3D DF was computed for each cell to evaluate the diversity of land-use functions within each cell. Based on the resulting 3D DF, the 3D Moran’s I statistics were calculated to assess the MAUP across different cell sizes and to determine the initial GDC cell size, i.e., the intervals for the x , y , and z dimensions (Table 2). When computing 3D Moran’s I, the spatial adjacency matrix was defined using the Rook (edge-contact) criterion [48].
Among the tested configurations, the 250 m × 250 m × 30 m cell size exhibited the lowest 3D Moran’s I value (0.401) in the experimental dataset was therefore selected as the initial cell size (i.e., the intervals of the x , y , and z dimensions). In general, regardless of how cell boundaries are defined, lower spatial clustering (i.e., weaker spatial autocorrelation) corresponds to a reduced zoning effect of the MAUP, allowing a more representative cell size to be identified [49,50]. By applying the proposed method, the initial cell size can be adaptively determined according to the spatial autocorrelation characteristics of different datasets.
Next, to ensure balanced distribution of information within each cell and to minimize uncertainty, the 3D DF values of the 10,512 cells with a size of 250 m × 250 m × 30 m were evaluated. Among them, 329 cells whose 3D DF values exceeded the threshold (Q3 = 1.214) were subdivided into 2632 smaller cells of 125 m × 125 m × 15 m. As a result, the final GDC consisted of 12,815 cells, comprising both 250 m × 250 m × 30 m and 125 m × 125 m × 15 m cells. In other words, the GDC forms a vector-structured dataset in which the x , y , and z dimensions are represented by two different cell resolutions.
The weights assigned to the 3D KDF and 3D EF were determined using the EWM and are summarized in Table 3. Commercial and residential functions, for example, received higher weights for the 3D KDF (0.717 and 0.707, respectively), indicating that spatial accessibility and clustering play a dominant role in characterizing these functions. In contrast, the public service function exhibited a substantially higher weight for the 3D EF (0.695), reflecting its relatively non-agglomerative nature and the importance of a balanced spatial distribution. This weighting pattern is consistent with theories in urban geography and economics, such as central place theory and agglomeration economics, which explain why accessibility tends to dominate economic functions, whereas diversity and spatial coverage are prioritized for public services.
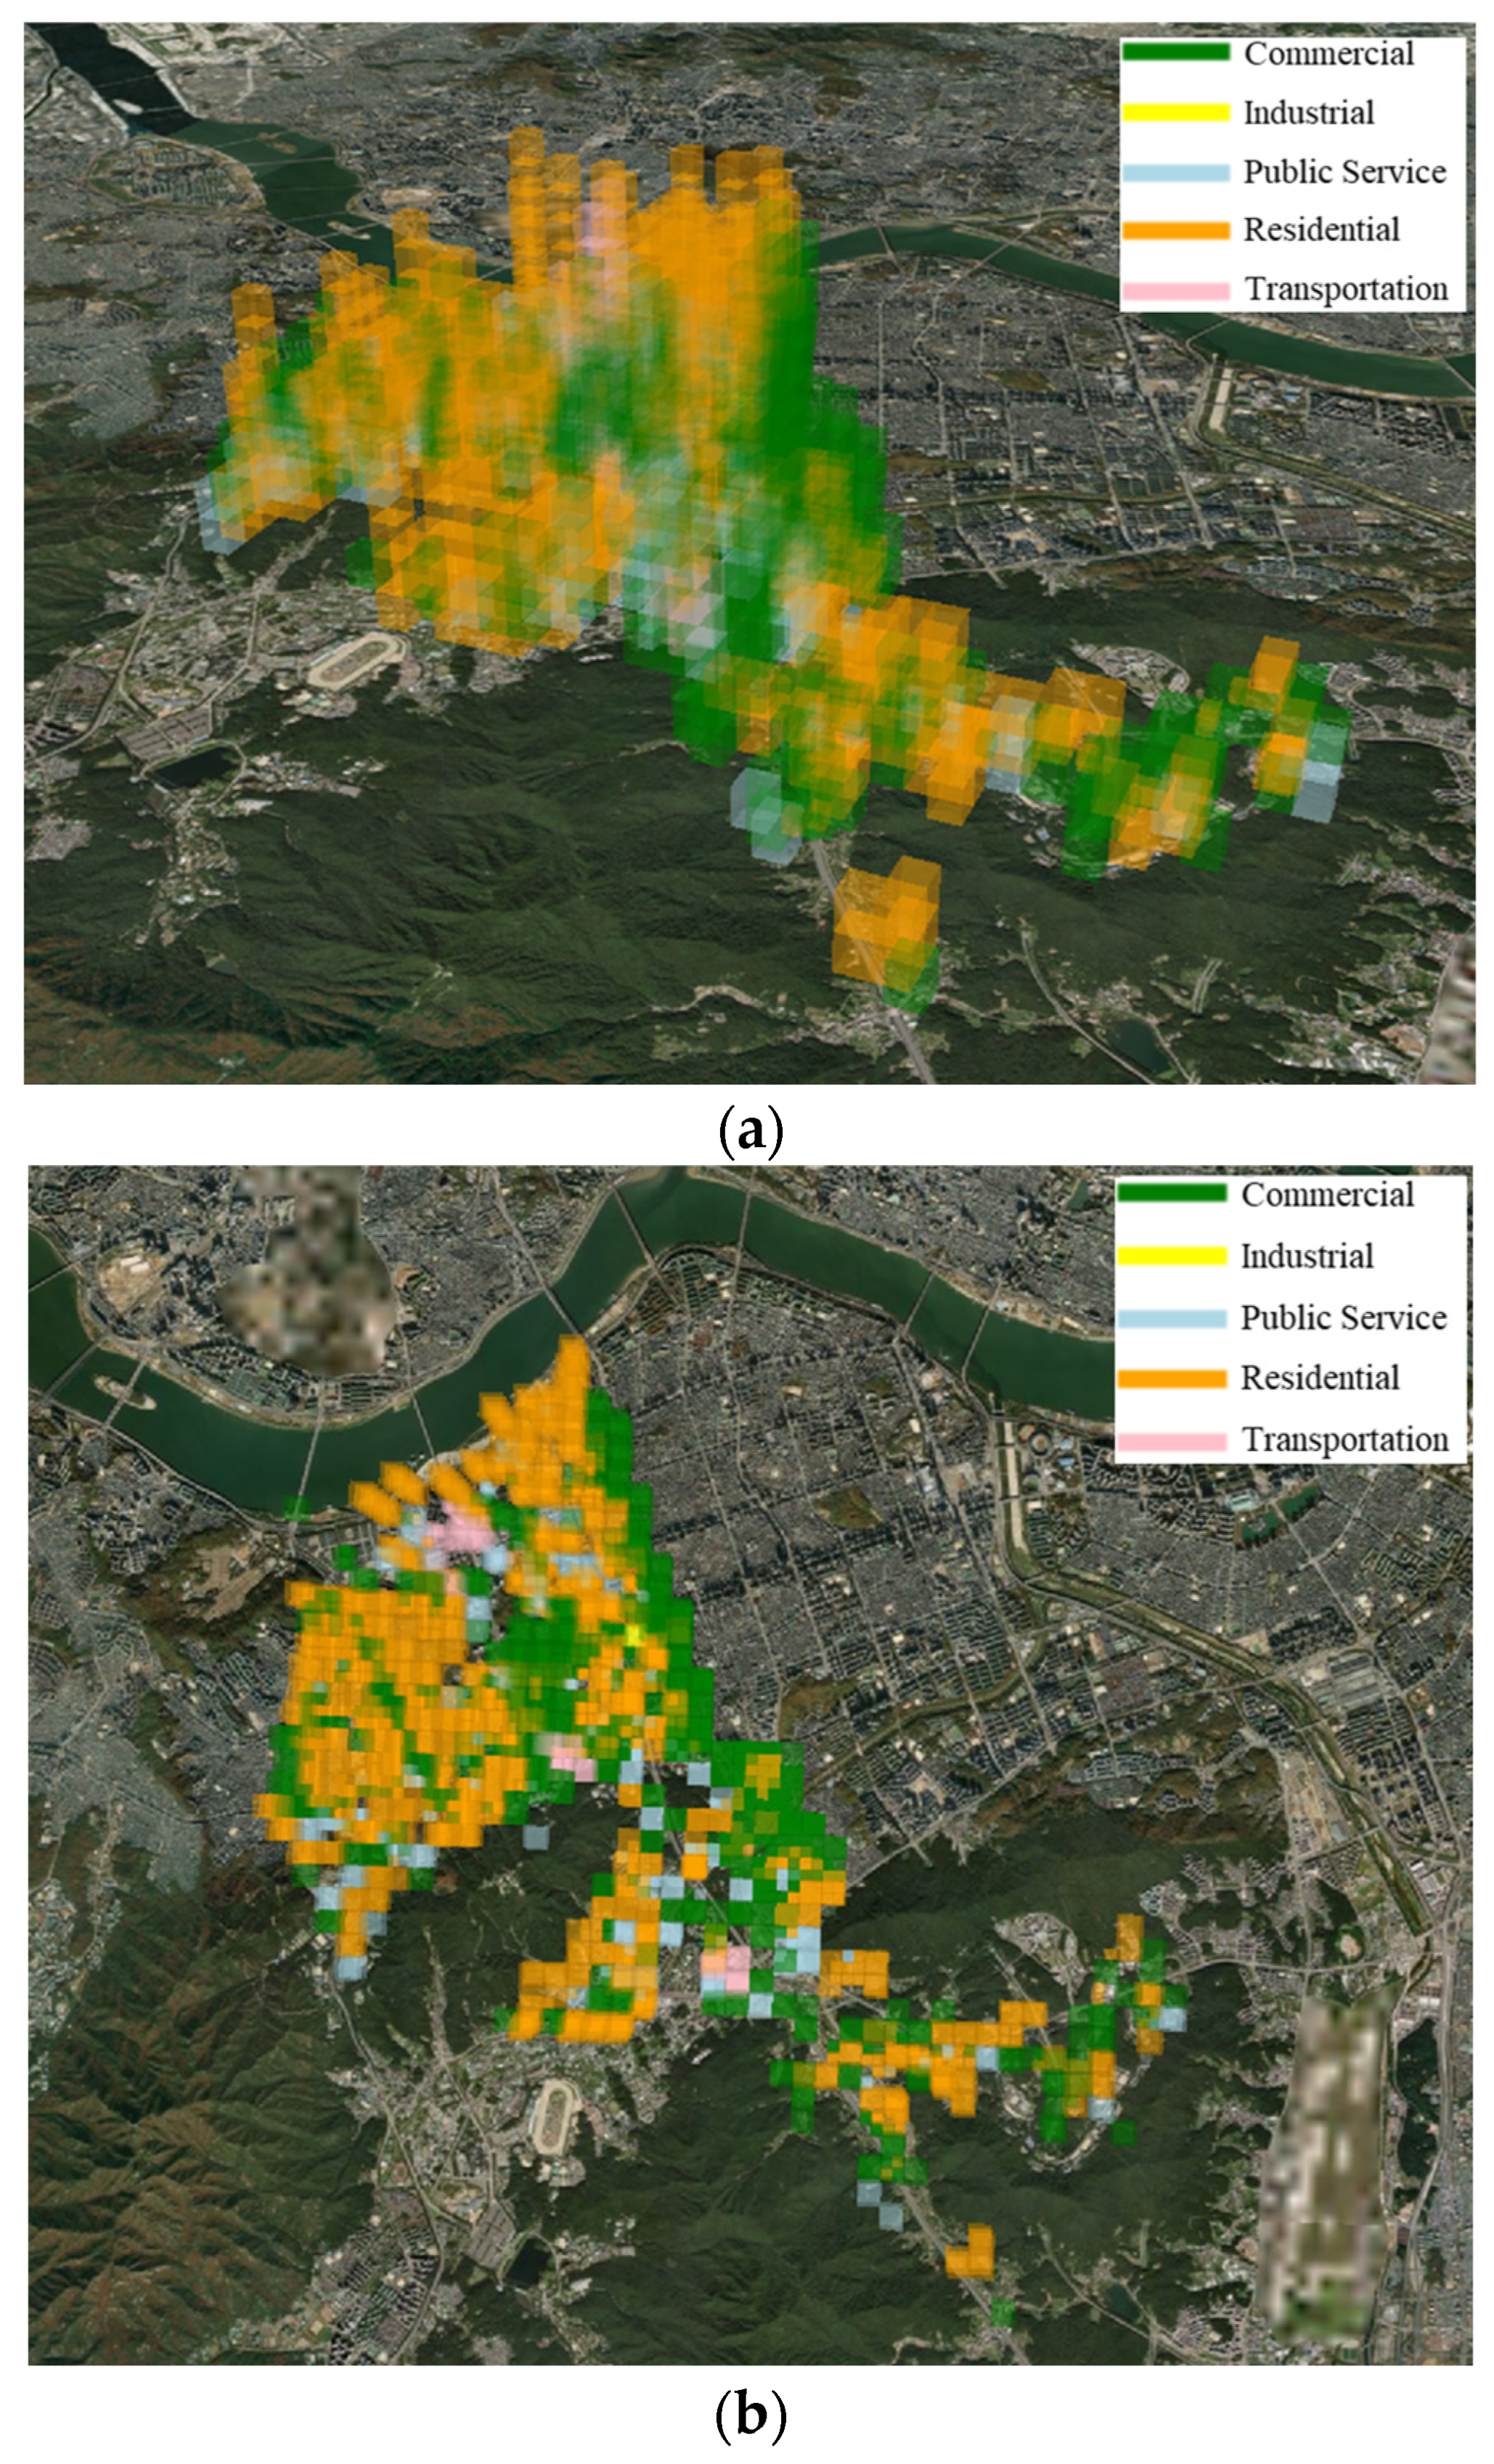
The x , y , and z dimensions of the GDC, representing spatial coordinates, were used as the axes of a 3D graph. For each cell, the building-use category associated with the highest 3D LUI value was assigned as the final urban function of that cell (Figure 4). As shown in Figure 4a, the study area of Seocho-gu, Seoul, is generally characterized by residential and commercial functions. Commercial and public service functions are mainly concentrated on the lower floors of buildings, whereas in certain areas, commercial functions extend to higher floors.
The adaptive grid subdivided generated by the proposed method can be clearly observed by visualizing the GDC from a top-down perspective, as illustrated in Figure 4b. In areas with high building density, the GDC cells were further subdivided, resulting in smaller cell sizes that more finely capture spatial heterogeneity.
A comprehensive quantitative evaluation of the vertical urban functions identified using the proposed method could not be fully conducted in this study, as land-use information in ROK is currently provided only in 2D format at the parcel level. Consequently, although limited in scope, this study selected representative areas within the study site where the 3D LUI exhibited clear vertical differentiation and performed a visual assessment by comparing the estimated urban functions with street-view images provided by Kakao Map [51], a major private map service platform in ROK.
In addition, POIs obtained through the Local API provided by Kakao Developers [52] were mapped onto the GDC and compared with the vertical urban functions identified by the 3D LUI. Although the POI classification scheme provided by Kakao Map differs from the used in this study, the POI categories were reclassified into the same five building-use groups adopted in this research. Floor numbers associated with the POIs were converted into height values by multiplying by 4 m and subsequently mapped onto the GDC. For each GDC cell, the building-use category with the highest frequency was inferred as the representative urban function.
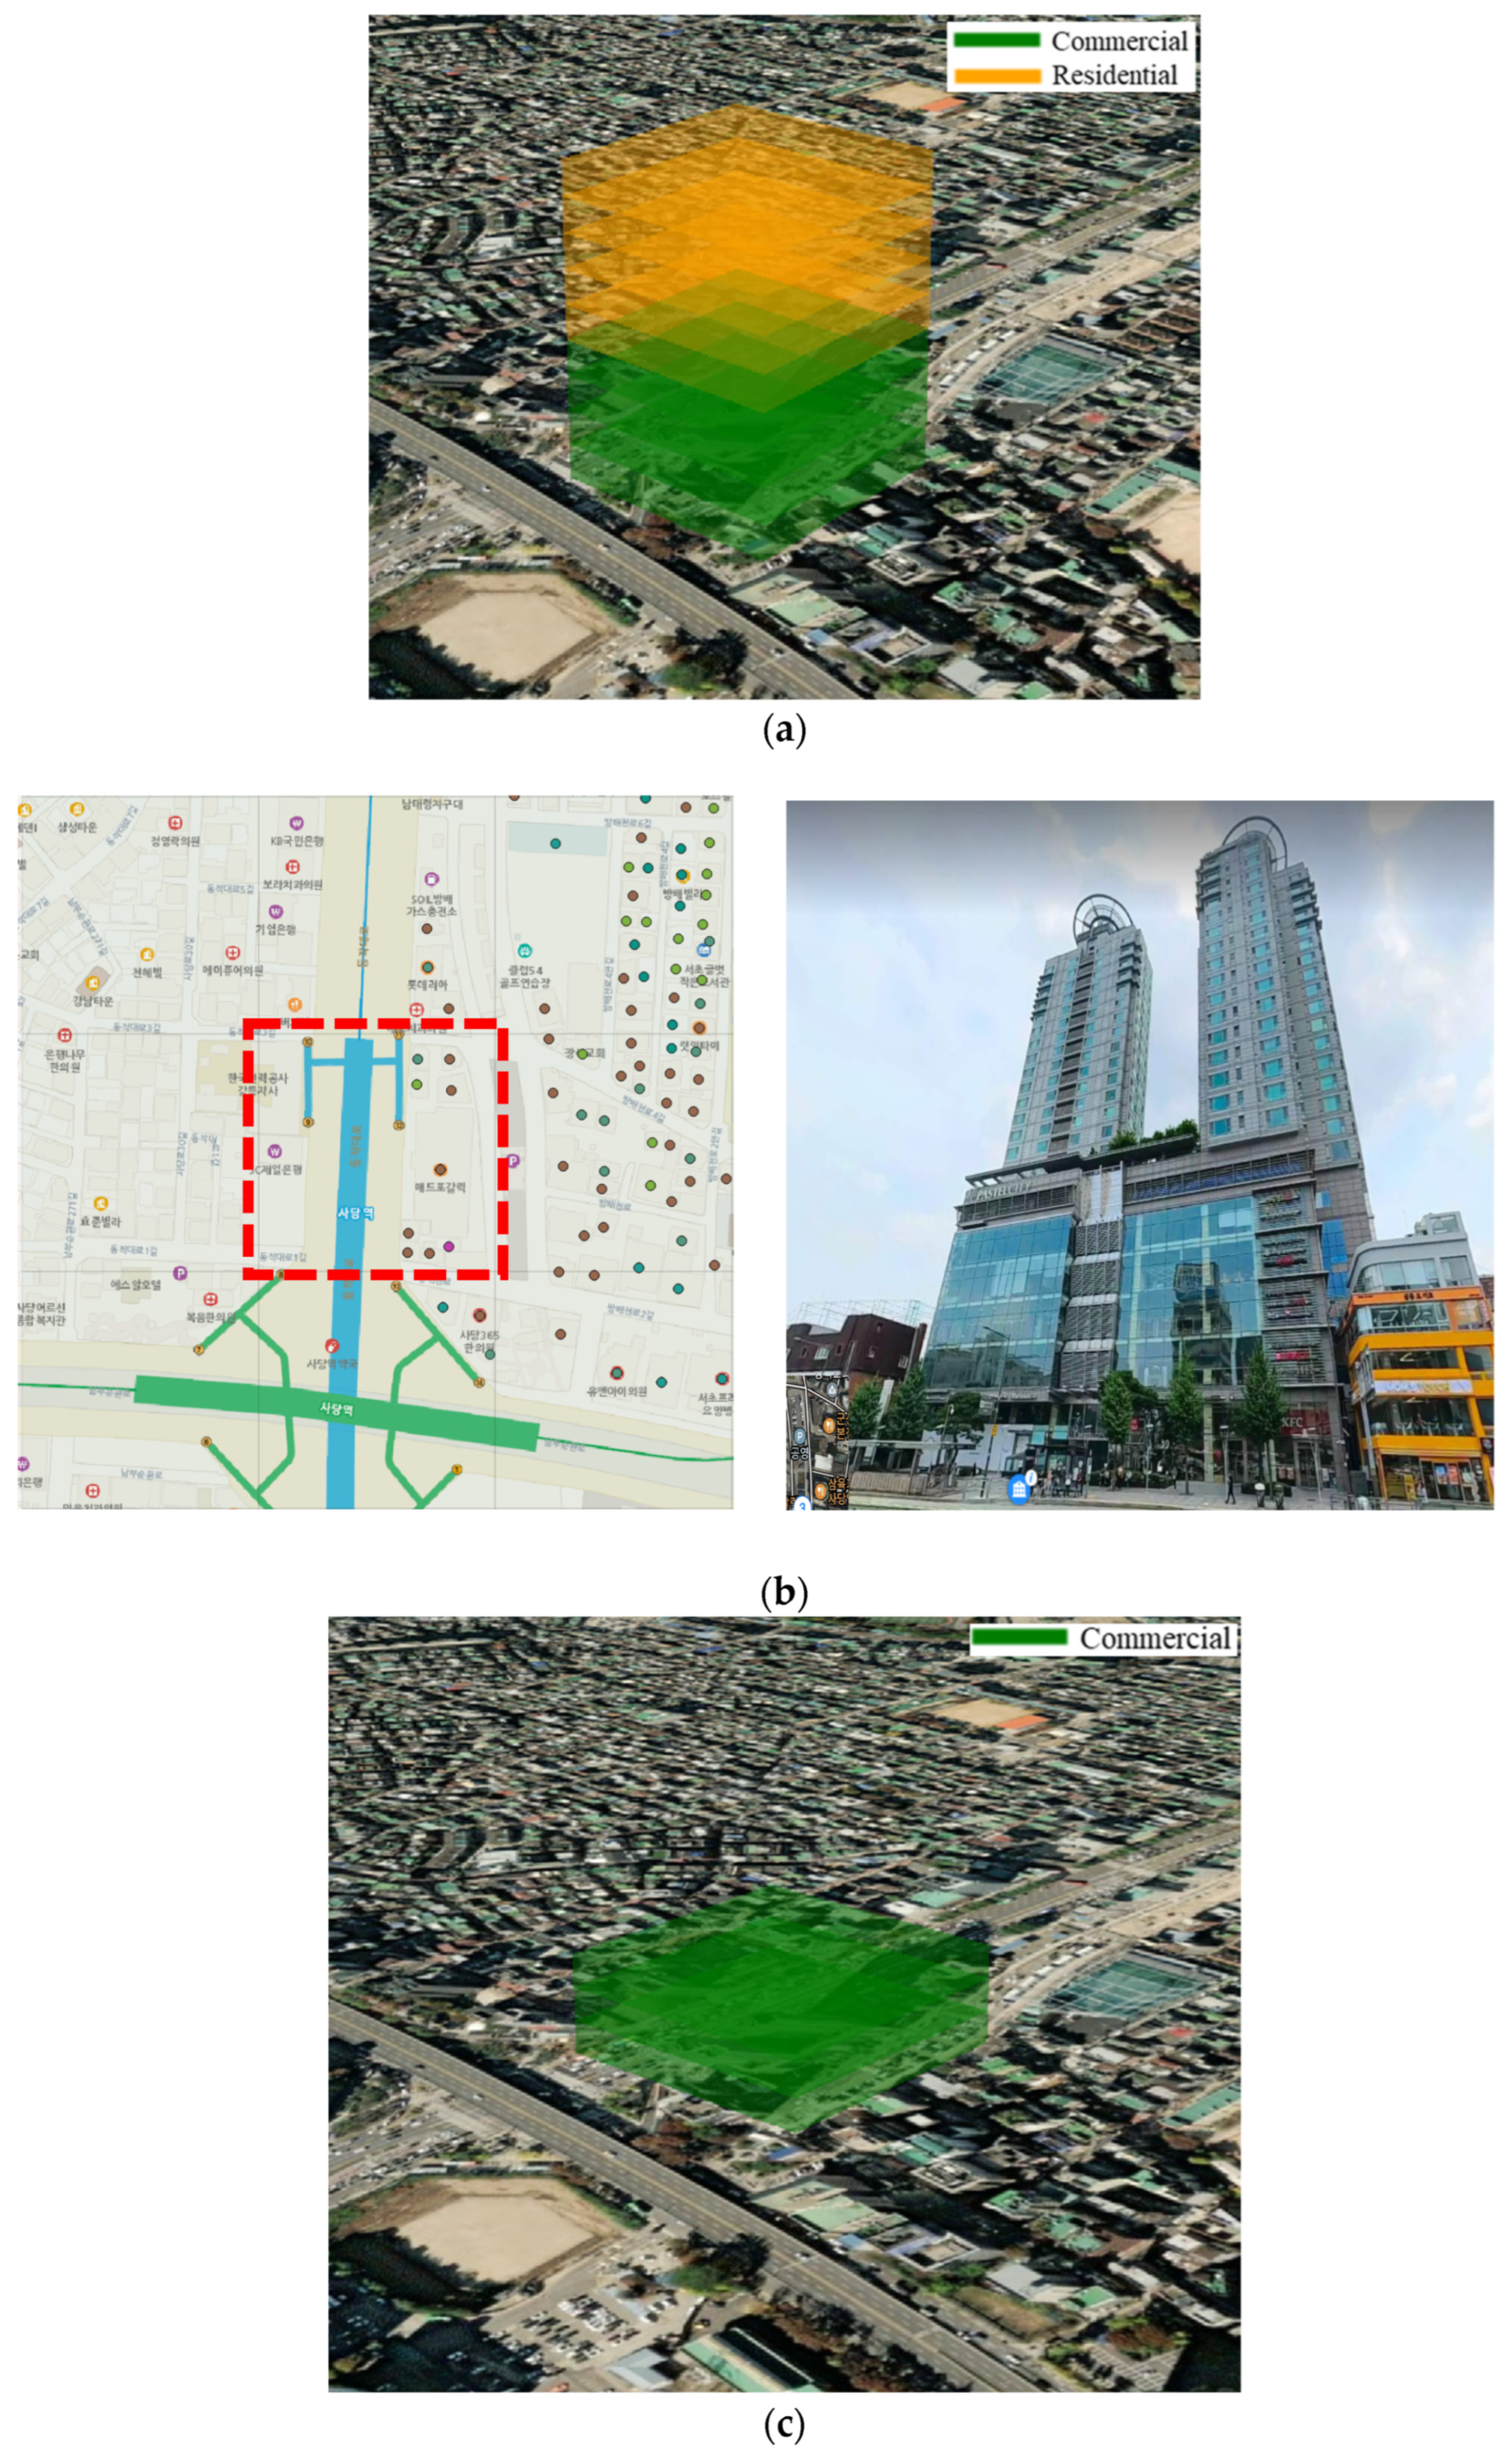
The first case area (Site 1) corresponds to a cell encompassing buildings located near a subway station, where the lower floors are predominantly used for commercial activities and the upper floors for residential purposes (Figure 5b). The urban functions identified using the proposed GDC-based approach (Figure 5a) clearly distinguished commercial functions in the lower floors and residential functions in the upper floors. Figure 5c shows the results of urban function estimation based on floor-level frequency using 47 POIs (Table 4) that include floor information, out of a total of 48 POIs within the area. Consistent with the results obtained by the proposed method, the lower floors of the buildings were characterized by dominant commercial functions.
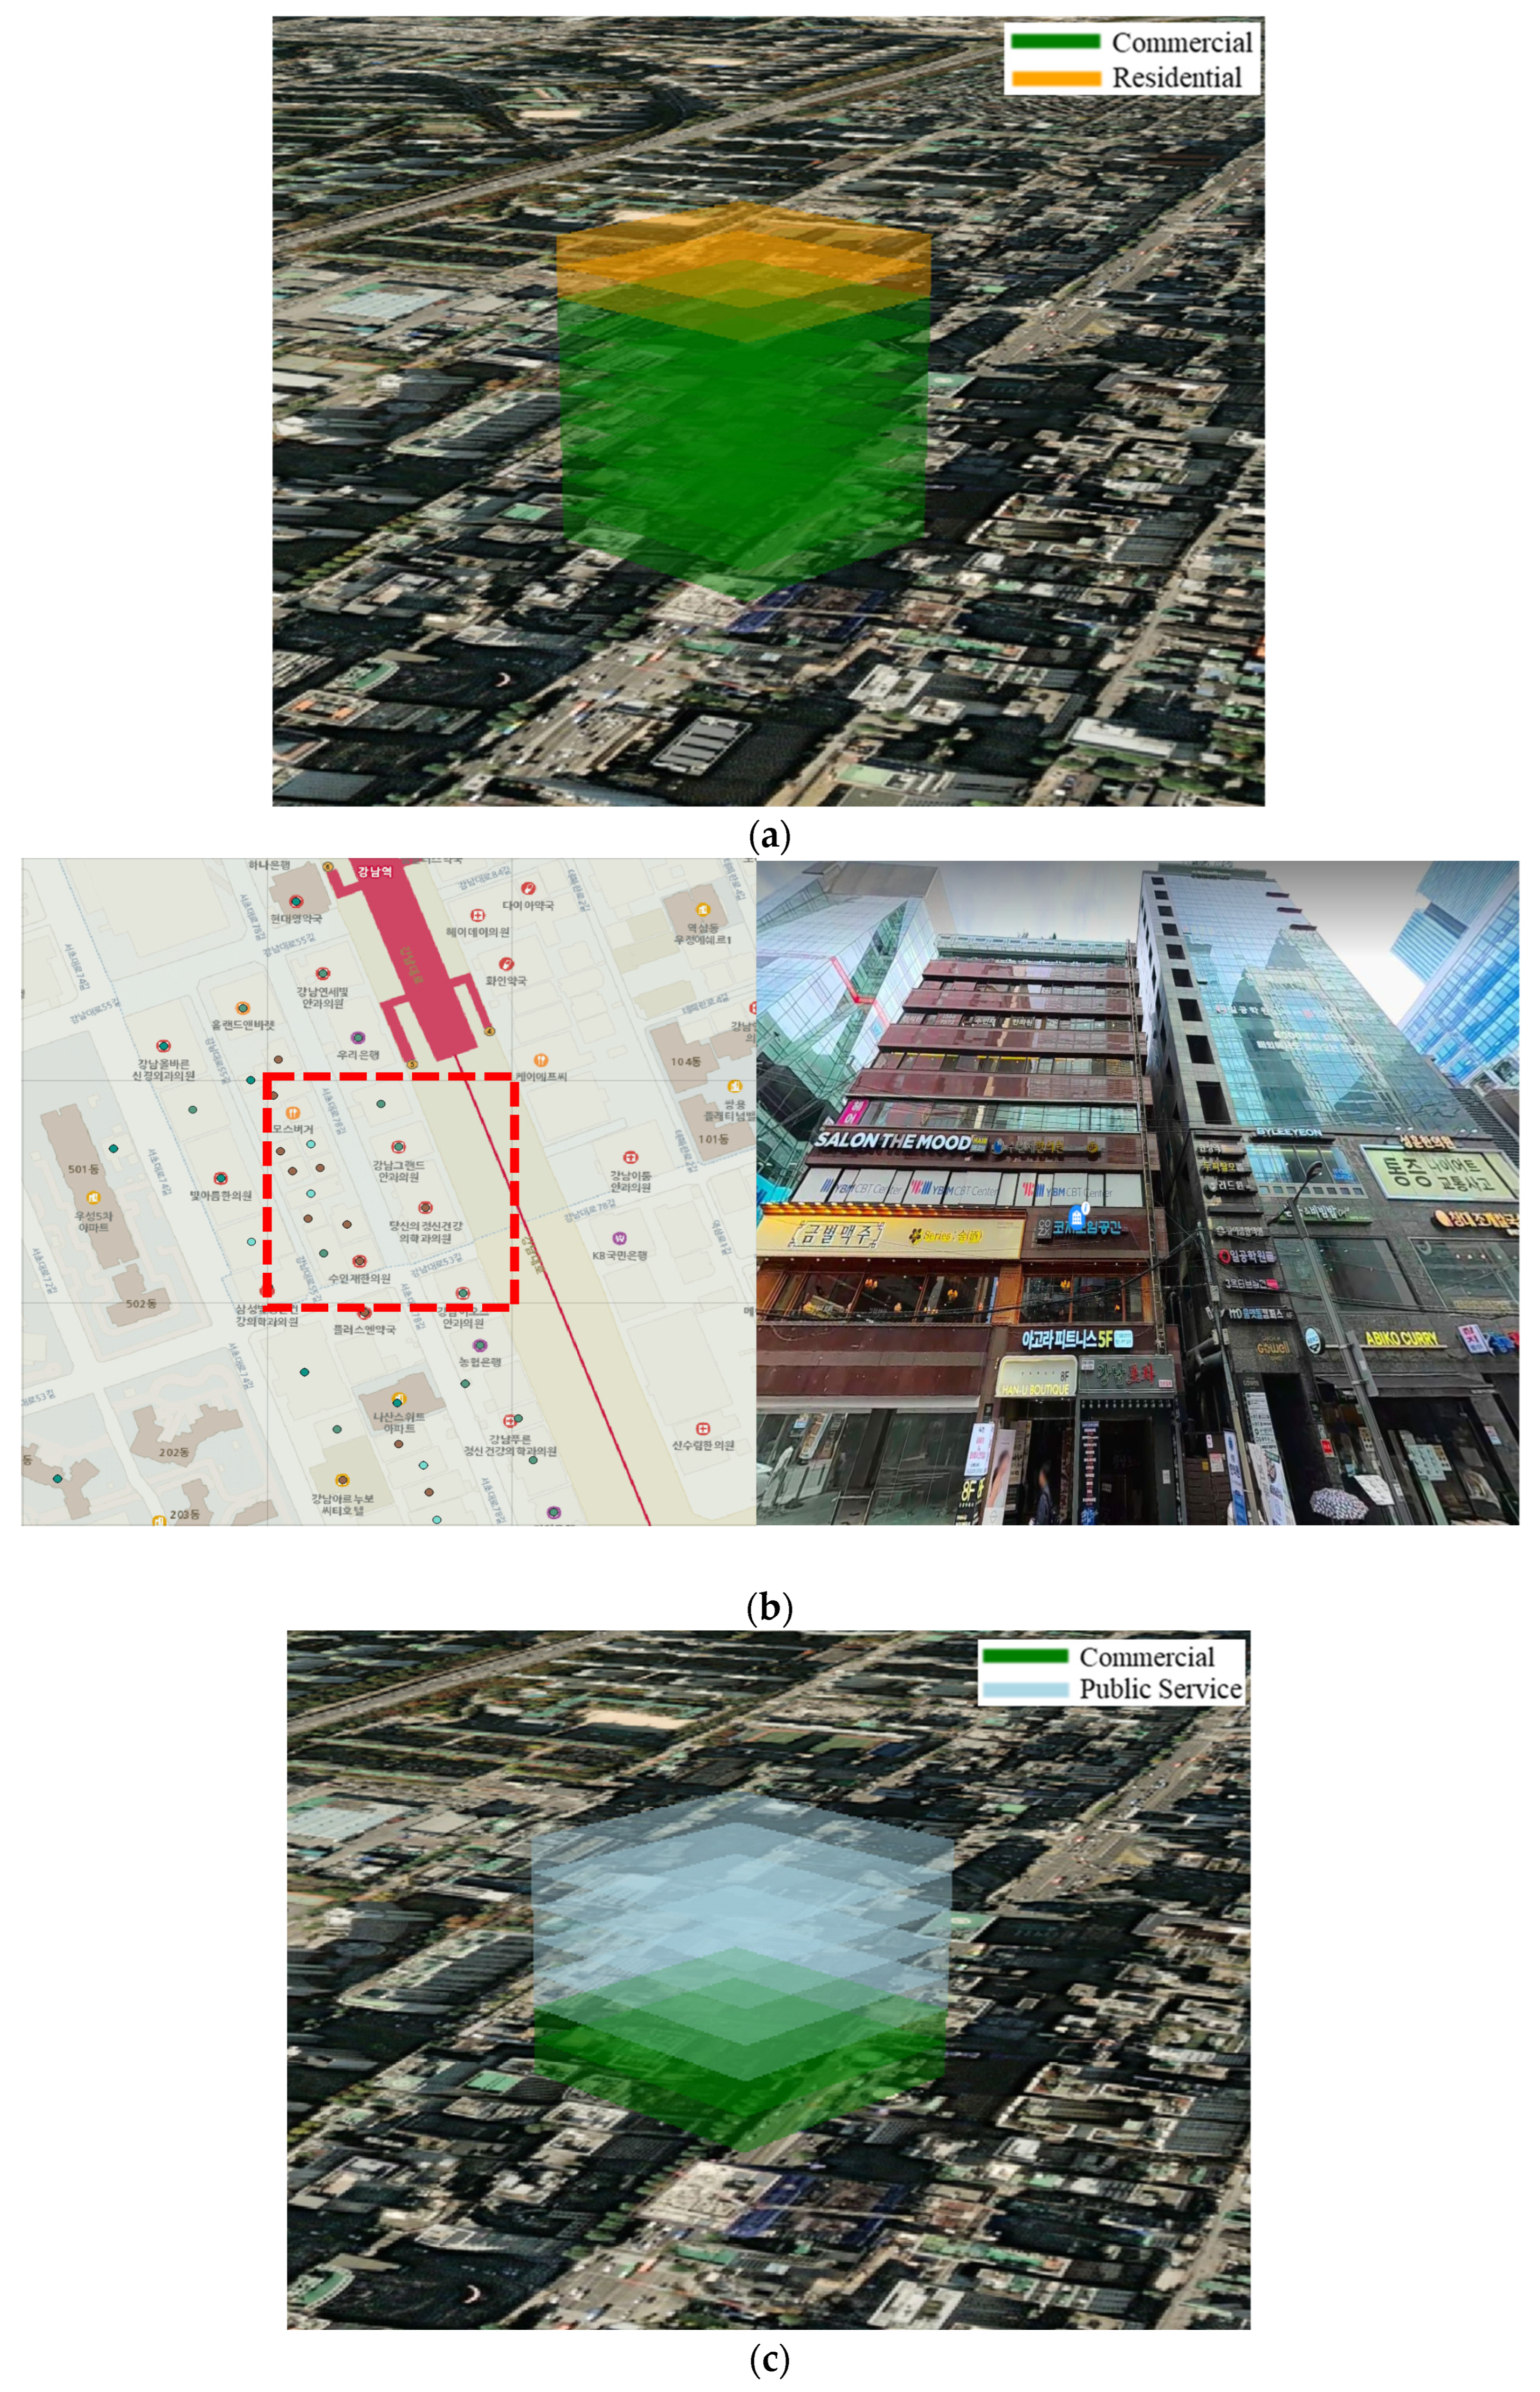
The second case area (Site 2) corresponds to a cell located south of a subway station, an area characterized by high pedestrian flows and a dense concentration of office buildings. As shown in Figure 6a, the proposed GDC-based approach identified residential functions in the upper floors of buildings, while commercial functions were detected across most floors beginning from the lower levels. As illustrated in Figure 6b, the lower floors in this area are indeed primarily utilized for commercial purposes, supporting the plausibility of the estimated results. Nevertheless, limitations remain in visually verifying whether the proposed GDC appropriately infers residential and commercial functions at the floor level. Figure 6c presents the results of urban function estimation based on floor-level frequency using 88 POIs (Table 4) that contain floor information, out of a total of 110 POIs in the area. While the proposed method predominantly identified commercial functions from the lower floors upward, the POI frequency-based estimation detected commercial functions in the lower floors and public service functions in the mid-level floors. This discrepancy can be attributed to methodological differences between the two approaches. The method proposed in this study identifies urban functions by evaluating spatial connectivity and relative dominance while explicitly accounting for vertical structures at the floor level. Rather than relying solely on frequency counts, it assesses whether activities are spatially clustered and functionally dominant relative to neighboring cells within the study area. As a result, areas in which commercial and public service activities are spatially interconnected and where commercial functions are relatively overrepresented may be classified as commercial, even when public service uses are locally prominent. This explains why the study area was ultimately identified as having a dominant commercial function rather than public service functions.
Due to the absence of datasets that explicitly provide vertical urban land use or functional information, this study conducted a limited validation by combining visual assessment with comparisons to privately provided POI data. Despite these constraints, the results suggest that the vertical urban functions identified using the proposed method are meaningful and reasonably reflect real-world urban functional patterns.
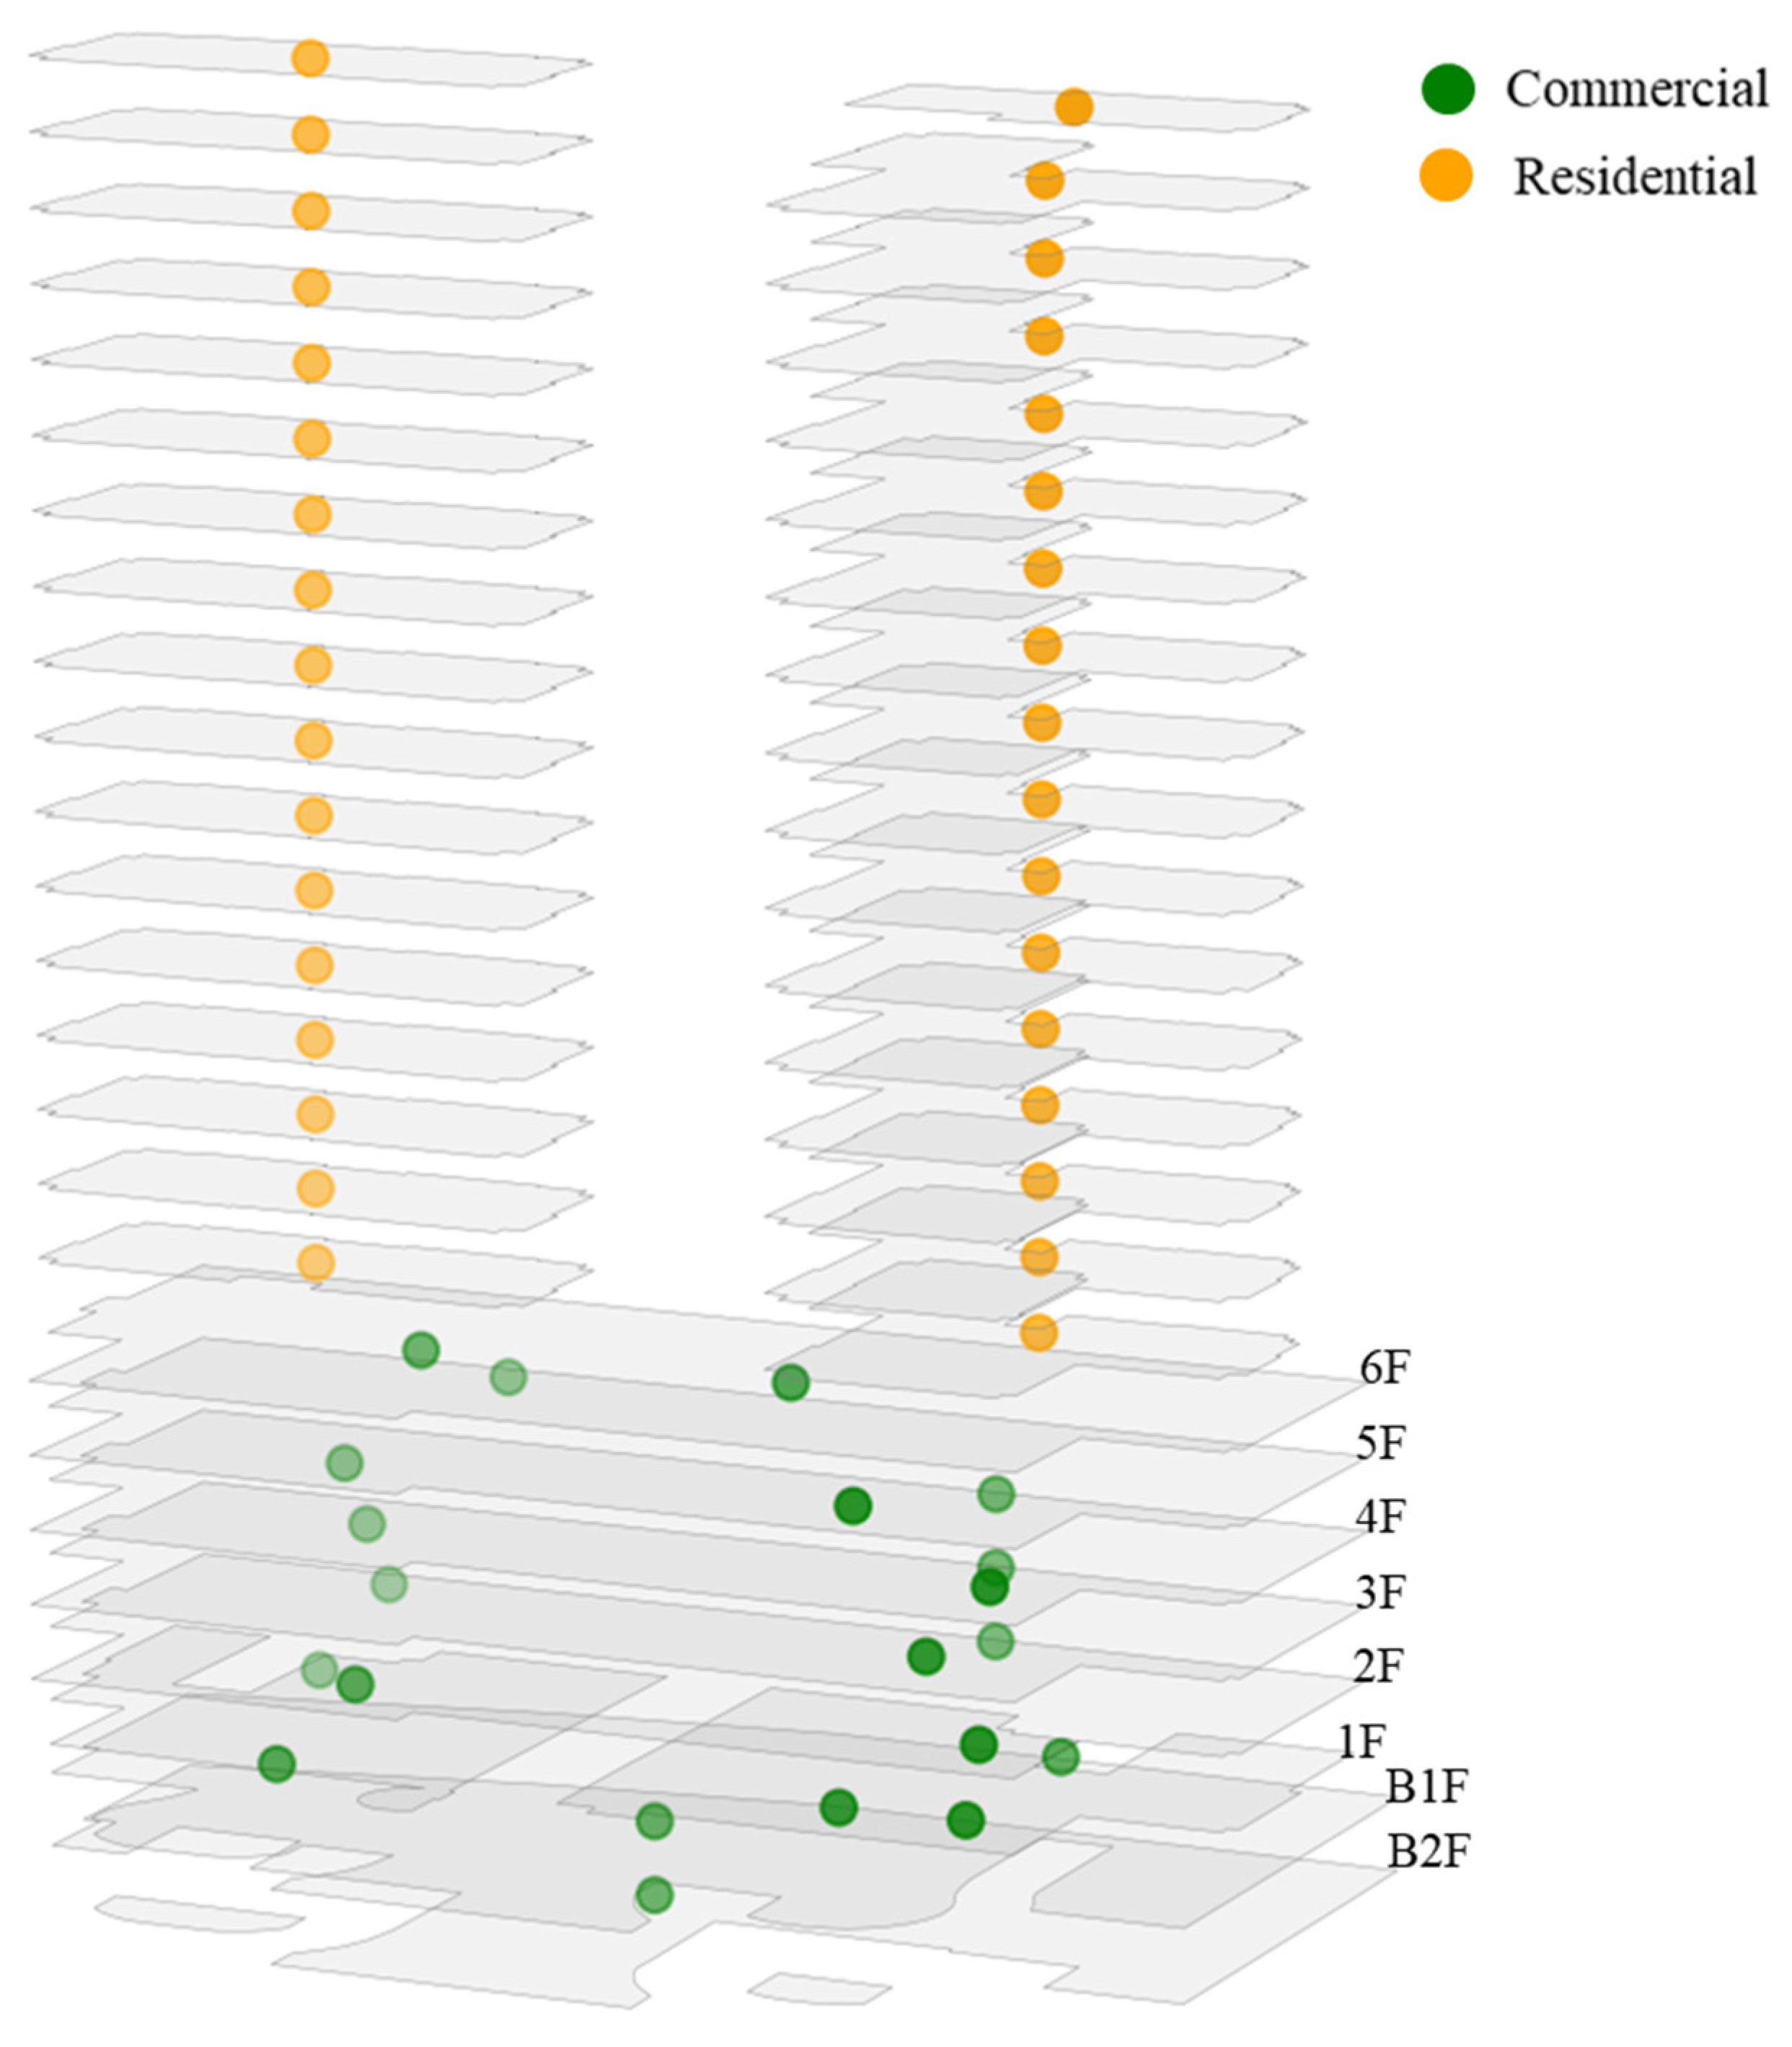
Site 1 contains a large, high-rise mixed-use building located within a single GDC cell. The lower floors, ranging from the second basement level (B2) to the sixth floor above ground, are used primarily for commercial purposes, while the upper floors are designated for residential use. A vertical cross-sectional view of this mixed-use building was visualized, as shown in Figure 7 by mapping Kakao POI data and building register together with floor-by-floor summary dataset from the Building Register, which includes residential uses not provided by the Kakao POI data. Using the proposed vertical urban functional pattern analysis method, the corresponding GDC cell (Figure 5a) was classified along the z dimension such that the lower three cells were identified commercial functions, while the upper five cells were classified as residential functions. Because each GDC cell represents a vertical height of 15 m, the three commercial cells correspond to a total vertical extent of 45 m. In the cross-section shown in Figure 7, assuming a uniform floor height of 4 m as adopted in this study, the commercial portion of the building—B2 to the sixth floor above ground—consists of eight floors, corresponding to a total height of approximately 32 m. Despite minor discrepancies attributable to the use of standardized floor-height assumptions and cell-based vertical aggregation, these results indicate that the vertical urban functional pattern derived using the proposed method closely corresponds to the actual floor-level functional composition of the building.

4. Discussion

4.1. Comparison Between the Proposed 3D LUI and Building Prices

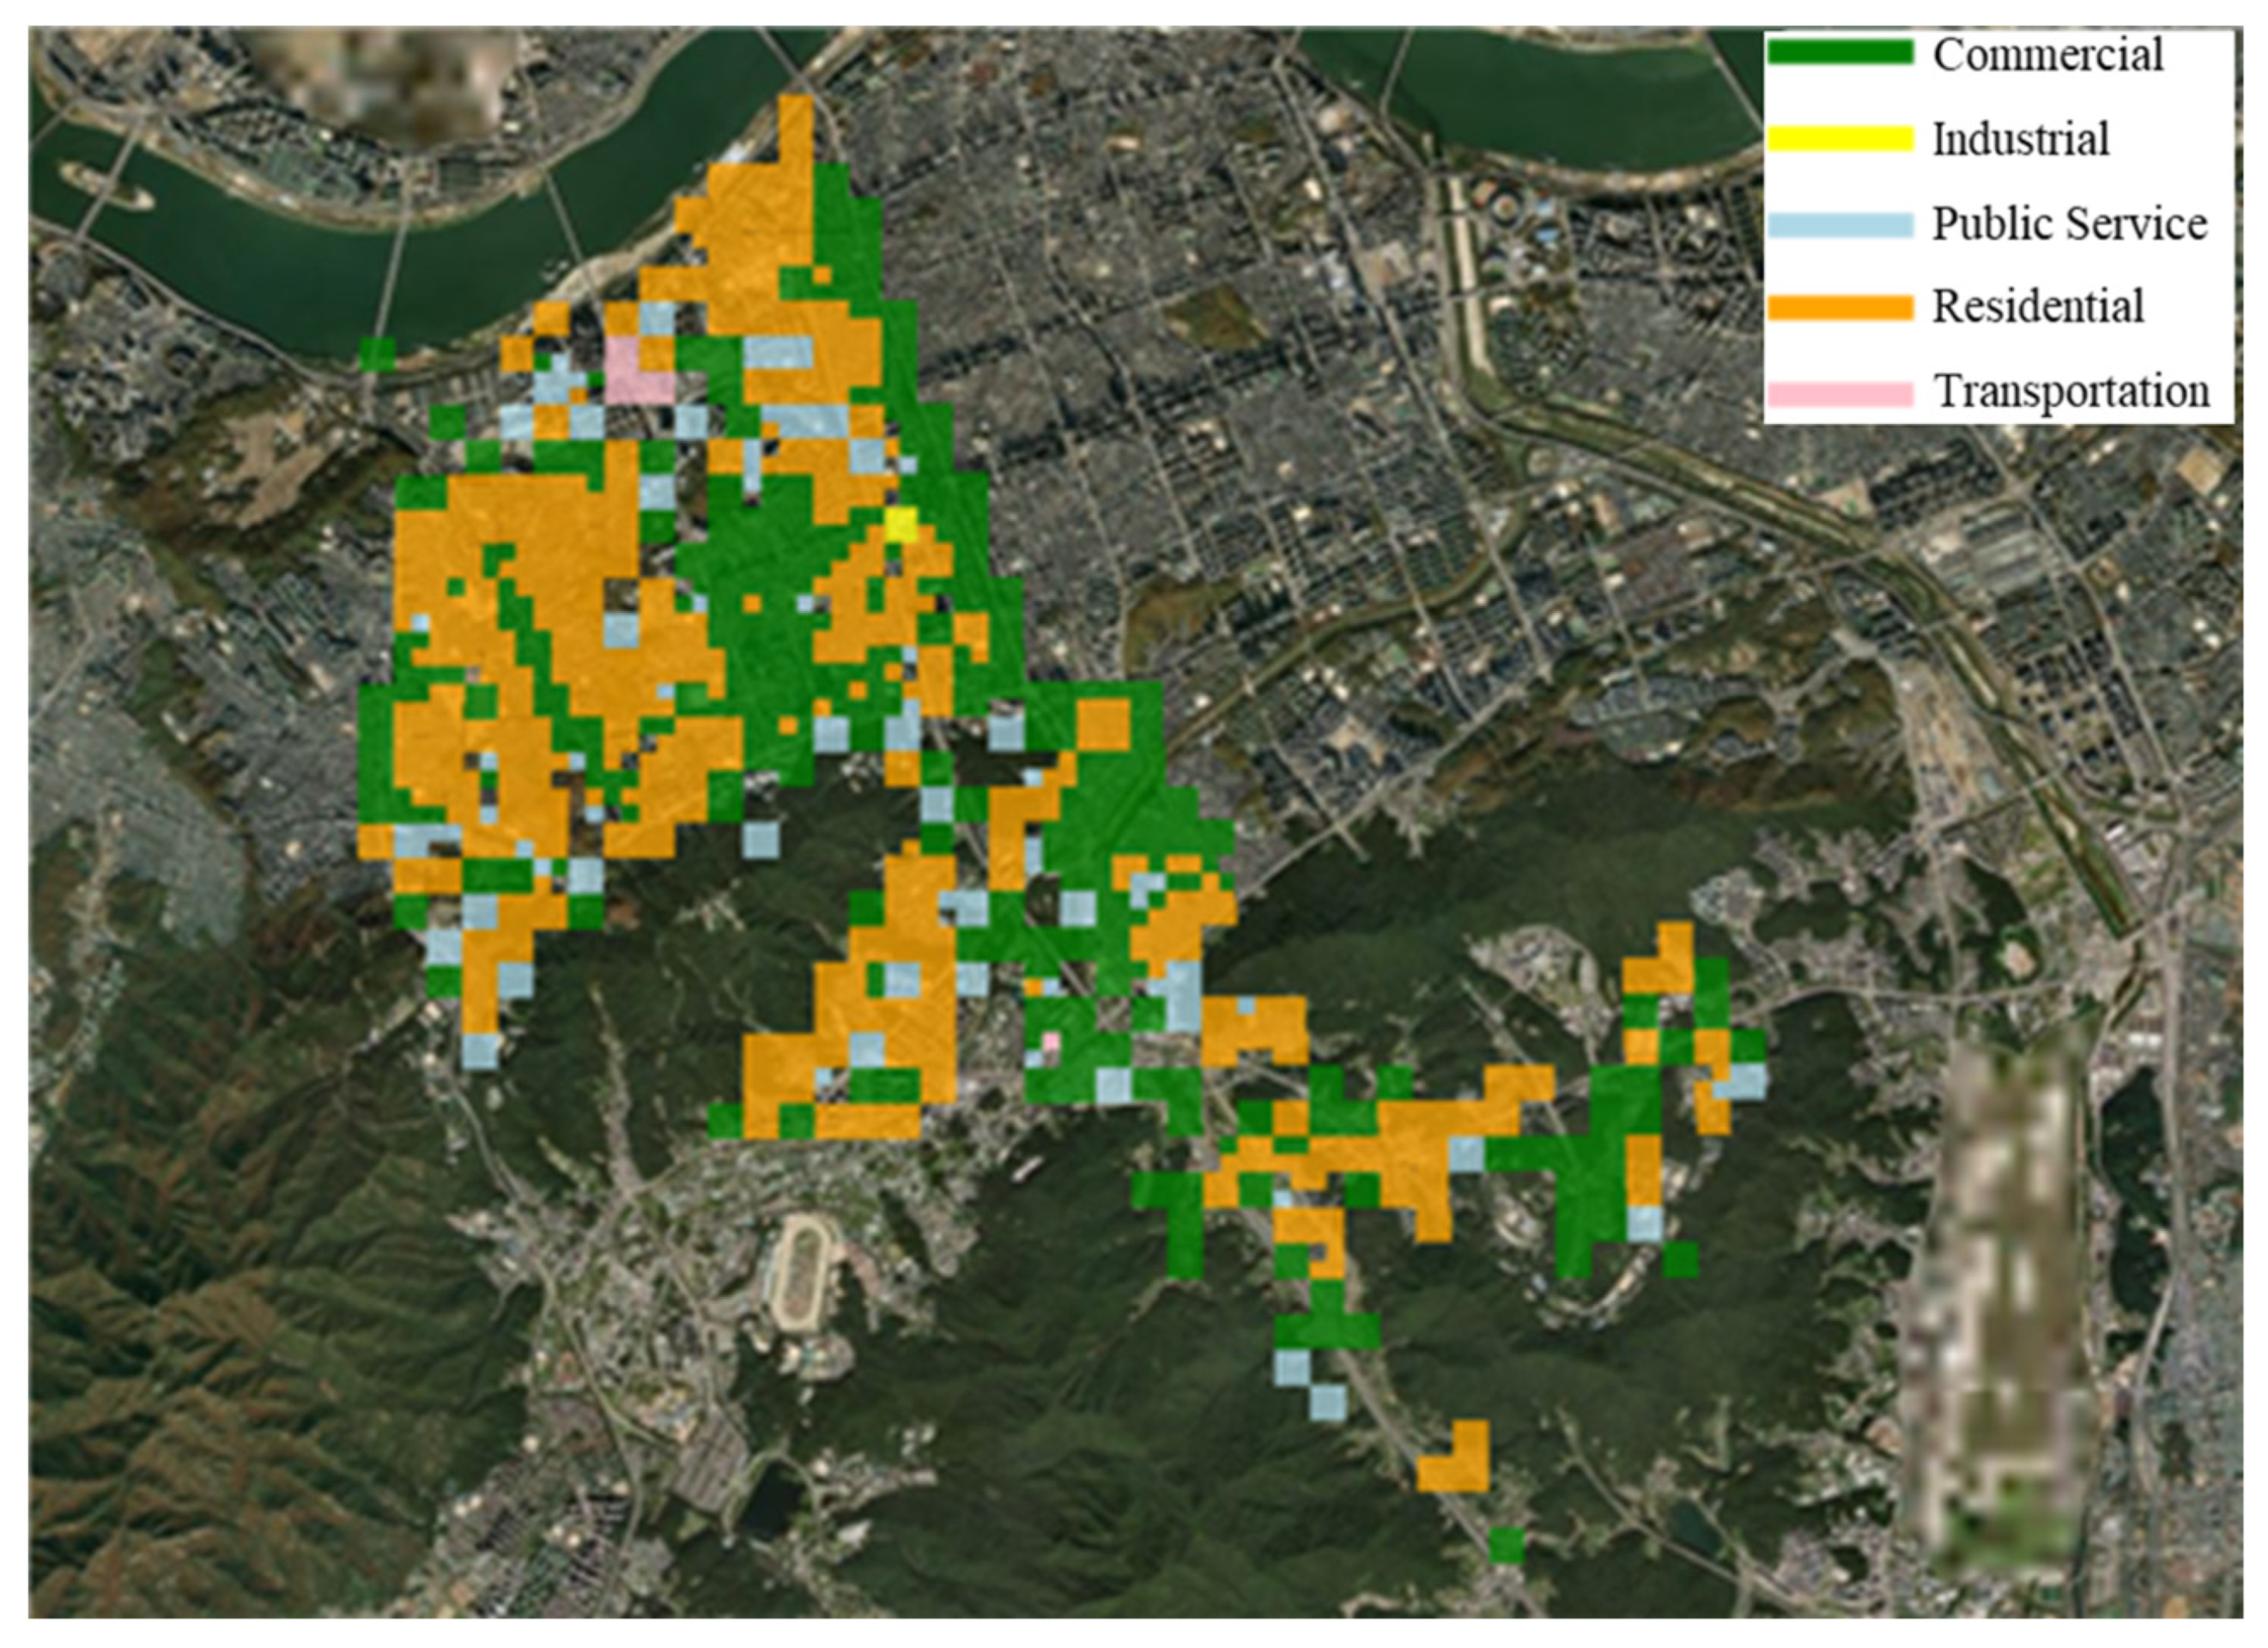
To examine the applicability of vertical urban functional pattern analysis, the urban functions identified using the proposed method were compared with those derived from a two-dimensional (planar) analysis. The 2D urban functions were generated by following the same process used for identifying vertical urban functional pattern analysis, with the proposed 3D LUI reformulated and calculated as a 2D LUI. Accordingly, floor-level building-use information was aggregated and mapped onto grids defined by the x and y dimensions, enabling the identification of planar urban functional patterns, as illustrated in Figure 7.
As shown in Figure 8, the resulting grids varied in size due to differences in the degree of subdivision, which was determined by the diversity of representative values within each grid. Overall, the spatial distributions of residential and commercial functions exhibited broadly similar patterns in both the 2D and 3D analyses, leading to comparable general characteristics of the identified urban function areas. However, areas classified as transportation functions were detected more frequently in the vertical urban function analysis, whereas such functions were identified less often in the 2D analysis.
Compared with the results of the vertical urban function analysis (Figure 4), a total of 946 planar grids were generated in the 2D analysis, whereas approximately three times more cells (2942) were generated in the vertical urban function analysis. Vertical urban functions were identified more frequently across residential, commercial, public service, and transportation categories, while the industrial function was identified in only one cell in both analyses.
In terms of functional proportions, the vertical and 2D analyses produced broadly similar results. Residential functions accounted for 0.5982 and 0.5941 of the total cells in the vertical and 2D analyses, respectively, while commercial functions accounted for 0.3460 and 0.3668, respectively. These results indicate that the study area is predominantly characterized by residential and commercial functions. In contrast, noticeable differences were observed for public service and transportation functions. Public service functions accounted for 0.0275 and 0.0317 of cells in the vertical and 2D analyses, respectively, whereas transportation functions accounted for 0.0279 in the vertical analysis but only 0.0063 in the 2D analysis. This discrepancy is likely attributable to multi-level facilities such as subway stations, which can be explicitly distinguished and identified as transportation functions in the vertical urban function analysis.
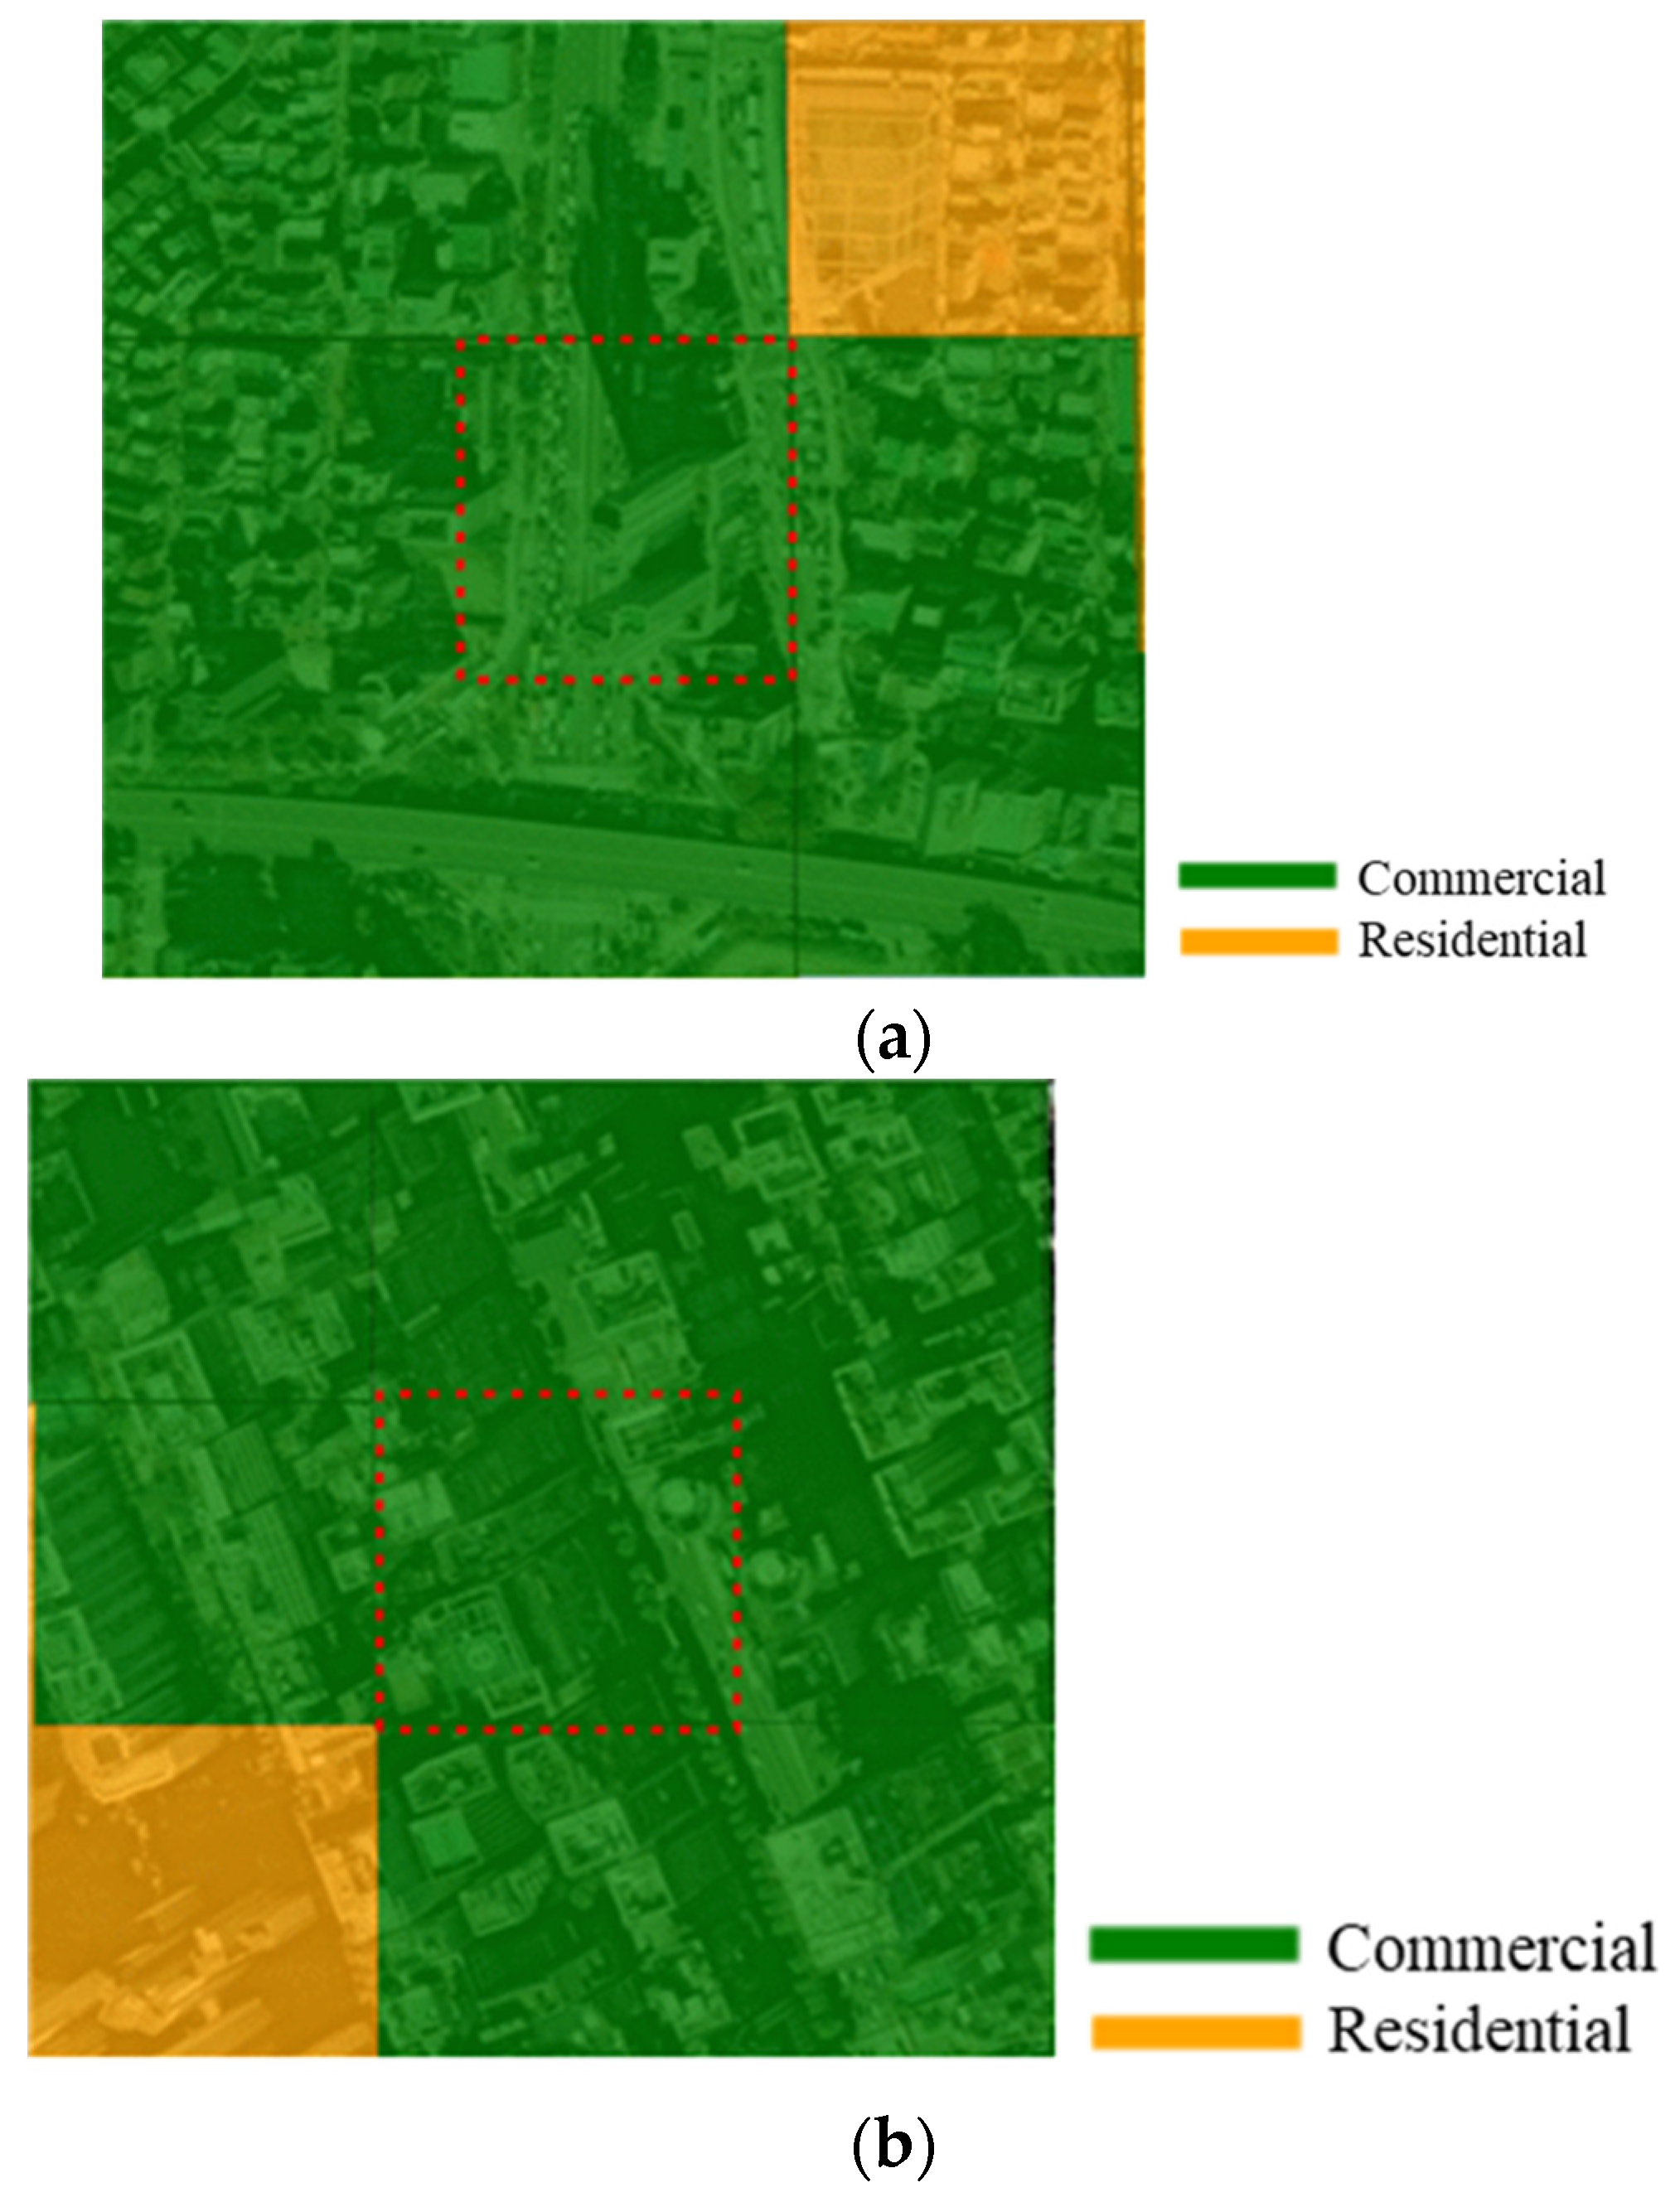
Next, when examining the urban functions identified for the same grid locations (red dotted box in Figure 9) corresponding to Site 1 (Figure 5) and Site 2 (Figure 6), which were visually evaluated in Section 3.2, both sites were classified as commercial functions in the 2D analysis (Figure 9a,b). However, a closer examination of the vertical urban functions reveals that, in Figure 9a, residential functions occupy five vertical levels, while commercial functions occupy four levels. Despite this vertically differentiated functional composition, the 2D analysis classified the area as a single commercial function. These results demonstrate that, compared with vertical urban function analysis, conventional 2D urban function identification has inherent limitations in capturing mixed-use and floor-differentiated urban functions.

4.2. Comparison with Building Prices

Previous studies have continuously investigated how surrounding land characteristics, urban functions, and accessibility to facilities affect building prices [53,54]. In this study, the effects of the proposed vertical urban functional index (3D LUI) on building prices were compared with those of the conventional two-dimensional urban functional index (2D LUI). To this end, a one-way analysis of variance (ANOVA) was applied. One-way ANOVA is a statistical method used to evaluate whether the mean of a dependent variable differs significantly across the levels of a single independent variable. Specifically, it was employed to examine whether unit land prices per square meter vary significantly according to classifications based on the 2D and 3D LUI. This analysis enables an evaluation of whether areas classified by the 2D and 3D urban functional indices exhibit statistically significant differences in real estate prices, and, more importantly, whether the inclusion of vertical spatial information in the 3D index provides improved explanatory power for price variation.
For the study area, unit building prices per square meter were collected for commercial buildings, such as officetels (Korean-style mixed-use(residential and office functions) residential unit) and retail buildings (January 2024, 38,724 records) [55], as well as for residential buildings, including apartments (August 2024, 125,948 records) [56] and detached houses (single-family home) (July 2024, 6001 records) [57]. Based on these datasets, floor-level building price information was constructed. As shown in Figure 10, the overall distribution of building prices is predominantly associated with residential uses.
The results of the one-way ANOVA for both the 2D and 3D LUI with respect to unit building prices are summarized in Table 5. The analysis indicates that unit prices differ significantly across groups classified by the 2D LUI (F = 26.428, p < 0.001). In contrast a substantially larger and highly significant difference is observed for the 3D LUI (F = 115.013, p < 0.001), indicating that the 3D LUI, which explicitly incorporates vertical spatial structure, explains variations in building prices more effectively than the planar 2D LUI. This finding suggests that vertical functional diversity within buildings, such as the vertical stacking of residential, commercial, and public service uses, plays a critical role in shaping property values in high-density urban environments. In Seoul, ROK, where mixed-use high-rise developments are prevalent, the strong association between the 3D LUI and unit building prices reflects the market premium associated with enhanced accessibility and the concentration of amenities across multiple floors. Furthermore, these results underscore the importance of incorporating vertical urban functional indicators, such as the 3D LUI, into future hedonic pricing models and spatial econometric frameworks to more accurately capture the economic implications of vertical urban form.

4.3. Limitations

This study proposed a method for analyzing vertical urban function patterns at the city scale by applying a GDC. Due to data limitations in the ROK, particularly the lack of freely available POI datasets with comprehensive floor-level information and the omission of unnamed buildings, such as detached houses, from POI datasets, building register data were used to obtain floor numbers and floor-level land-use information. However, if POI datasets containing both spatial coordinates and floor-level attributes become available in the future, the proposed method could be readily applied by constructing a GDC based on such POIs. In this case, POI addresses could be geocoded or existing coordinates could be directly mapped to the x and y dimensions, while floor numbers could be converted into height values at fixed intervals for the z dimension. This would enable the identification of floor-level urban functions in a manner consistent with previous city-scale studies that analyzed spatial land use and building-level functions.
To further identify vertical urban functions, this study introduced a 3D LUI framework. However, as noted by [6], the EF is sensitive to grid size. When grid cells become very small, the number of floor-level uses or POIs within a cell may be extremely limited or even absent, resulting in low richness values and frequent outliers. While smaller grids facilitate fine-grained analysis, they may produce unstable EF values due to data sparsity. Conversely, larger grids tend to contain a greater number of observations, yielding more stable EF values with fewer outliers, albeit at the expense of spatial detail. In this study, the MAUP was partially mitigated by adaptively determining grid sizes based on the diversity of information within each cell. However, this strategy does not provide a fundamental solution to the MAUP and remains an inherent limitation.
Additionally, for the 3D KDF analysis uniformly assumed a floor height of 4 m, following the Building Act of the ROK. Although this assumption simplifies the modeling process, it introduces limitations that warrant careful consideration. Previous studies have shown that variability in floor height can significantly influence spatial density estimation and urban morphology modeling [8,58]. Global-scale initiatives, such as the Ut-GLOBUS project proposed by Kamath et al. [59], further demonstrate that inaccuracies in height assumptions may propagate through density-based models, potentially leading to misinterpretations of urban intensity and functional clustering. However, practical constraints limit access to accurate height data: architectural section drawings are protected by copyright, and survey-based height measurements are often restricted for security reasons. As a result, incorporating actual floor-height variability into KDF calculations remains challenging. This limitation highlights the need for future research to alternative approaches for integrating reliable height information, as such improvements could substantially enhance the robustness 3D spatial analyses.
Despite these limitations, the primary contribution of this study lies in proposing a GDC-based methodological framework capable of exploring vertical urban functional patterns across large urban areas at the city scale. Future research should apply the proposed approach to a wider range of datasets and urban contexts to further validate its applicability and to address the limitations identified in this study.

5. Conclusions

This study proposed a method for analyzing vertical urban functional patterns in cities that are increasingly developed in a vertical and mixed-use manner as a result of urban population concentration. A multi-dimensional GDC was constructed by integrating spatio-temporal data with floor-level information across the x , y , z , t , and f dimensions. To mitigate uncertainty arising from the MAUP, the GDC cell size was determined by selecting the configuration that minimized the global 3D Moran’s I value calculated from the proposed 3D DF. Urban functions at the cell level were then identified using a 3D LUI, defined as a linear combination of spatial accessibility between land-use types (3D KDF) and land-use richness within each cell (3D EF). The land-use category with the highest 3D LUI value was assigned as the representative vertical urban function of each cell.
The proposed approach was applied to Seocho-gu, Seoul, ROK, using datasets compiled in June 2024. Visual evaluation using street-view imagery and comparisons with floor-level POI distributions from Kakao Map indicated that the method effectively captured vertical differentiation between commercial and residential functions, particularly in mixed-use buildings. Comparisons with planar (2D) urban function classification further demonstrated that vertical land-use characteristics cannot be adequately identified using 2D approaches alone. In addition, the 3D LUI exhibited stronger explanatory power for variations in building values when compared with floor-level real estate prices. Despite limitations related to data availability—such as the lack of official vertical urban function datasets and the approximation of building heights based on floor information—the proposed GDC-based framework demonstrates strong potential for analyzing vertical urban structure at the city scale through integrating heterogeneous spatio-temporal data.

Author Contributions

Conceptualization, Jiyoung Kim; methodology, Jiyoung Kim and Hyojoong Kim; software, Hyojoong Kim; validation, Jiyoung Kim and Jonghyeon Yang; formal analysis, Jiyoung Kim; investigation, Hyojoong Kim; resources, Jonghyeon Yang; data curation, Jonghyeon Yang; writing—original draft preparation, Jiyoung Kim; writing—review and editing, Jiyoung Kim; visualization, Jiyoung Kim and Hyojoong Kim; supervision, Jiyoung Kim and Jonghyeon Yang; project administration, Jiyoung Kim; funding acquisition, Jiyoung Kim. All authors have read and agreed to the published version of the manuscript.

Funding

This research was funded by the Korea Agency for Infrastructure Technology Advance-826 ment (KAIA) grant funded by the Ministry of Land, Infrastructure and Transport (Grant RS-2022-827 00143804).

Data Availability Statement

The datasets generated and/or analyzed during the current study are not publicly available but can be obtained from the corresponding author upon reasonable request.

Conflicts of Interest

The authors declare no conflicts of interest. The funders had no role in the design of the study; in the collection, analyses, or interpretation of data; in the writing of the manuscript; or in the decision to publish the results.

References

  1. Im, H.N.; Lee, S.; Choi, C.G. Empirical analysis of the relationship between land use mix and pedestrian volume in Seoul, Korea. J. Korea Plan. Assoc. 2016, 51, 21–38. [Google Scholar] [CrossRef]
  2. Cao, Y.; Lee, S. Analysis of urban vitality and its determinant factors Using POI Bigdata in Seoul, Korea. J. Korea Plan. Assoc. 2021, 56, 87–102. [Google Scholar] [CrossRef]
  3. Yi, J. The Influence of Mixed Land-Use on Travel Behavior—An Analysis on Horizontal and Vertical Mixed Land-Use. Master’s Thesis, Seoul National University, Seoul, Republic of Korea, 2021. [Google Scholar]
  4. Wang, Y.; Gu, Y.; Dou, M.; Qiao, M. Using spatial semantics and interactions to identify urban functional regions. ISPRS Int. J. Geo-Inf. 2018, 7, 130. [Google Scholar] [CrossRef]
  5. Hu, S.; He, Z.; Wu, L.; Yin, L.; Xu, Y.; Cui, H. A framework for extracting urban functional regions based on multiprototype word embeddings using points-of-interest data. Comput. Environ. Urban Syst. 2020, 80, 101442. [Google Scholar] [CrossRef]
  6. Niu, H.; Silva, E.A. Delineating urban functional use from points of interest data with neural network embedding: A case study in Greater London. Comput. Environ. Urban Syst. 2021, 88, 101651. [Google Scholar] [CrossRef]
  7. Luo, G.; Ye, J.; Wang, J.; Wei, Y. Urban functional zone classification based on POI data and machine learning. Sustainability 2023, 15, 4631. [Google Scholar] [CrossRef]
  8. Cai, Z.; Demuzere, M.; Tang, Y.; Wan, Y. The characteristic and transformation of 3D urban morphology in three Chinese mega-cities. Cities 2022, 131, 103988. [Google Scholar] [CrossRef]
  9. Yang, L.; Zhou, X.; Yang, X.; Chen, Y.; Zhang, H.; Na, J. A new hierarchical analysis framework of building heights: Towards a more intuitive understanding of 3D urban structure. Trans. GIS 2024, 28, 40–57. [Google Scholar] [CrossRef]
  10. He, J.; Liu, P.; Li, X. Modeling multi-type urban landscape dynamics along the horizontal and vertical dimensions. Landsc. Urban Plan. 2023, 233, 104683. [Google Scholar] [CrossRef]
  11. Wang, H.; He, P.; Wong, M.S.; Wong, S.W.; Song, Y.; Shen, G.Q. Optimizing vertical urban development: The role of a multidimensional assessment framework for balancing vertical growth and habitability. Habitat Int. 2025, 161, 103424. [Google Scholar] [CrossRef]
  12. Chen, Y.; Yang, X.; Li, X.; Yang, L.; Cheng, X.; Tang, G.; Biljecki, F. Vertical 15-min city: Modeling urban density and functional mix with multi-source geospatial data. Cities 2026, 169, 106516. [Google Scholar] [CrossRef]
  13. OGC Geodatacube Standard Working Group Charter. Available online: http://www.opengeospatial.org/legal/ (accessed on 23 November 2024).
  14. Noh, B.; Lee, J.; Park, D.H.; Chung, Y. Crisis management analysis of foot-and-mouth disease using multi-dimensional data cube. J. Korea Content Assoc. 2017, 17, 565–573. [Google Scholar] [CrossRef]
  15. Strobl, P.; Baumann, P.; Lewis, A.; Szantoi, Z.; Killough, B.; Purss, M.; Craglia, M.; Nativi, S.; Held, A.; Dhu, T. The Six Faces of the Data Cube. In Proceedings of the 2017 Conference on Big Data from Space (BIDS’ 2017), Toulouse, France, 28–30 November 2017. [Google Scholar]
  16. Ferreira, K.R.; Queiroz, G.R.; Vinhas, L.; Marujo, R.F.B.; Simoes, R.E.O.; Picoli, M.C.A.; Camara, G.; Cartaxo, R.; Gomes, V.C.F.; Santos, I.A.; et al. Earth observation data cubes for Brazil: Requirements, methodology and products. Remote Sens. 2020, 12, 4033. [Google Scholar] [CrossRef]
  17. Cheng, M.-C.; Chiou, C.-R.; Chen, B.; Liu, C.; Lin, H.-C.; Shih, I.-L.; Chung, C.-H.; Lin, H.-Y.; Chou, C.-Y. Open Data Cube (ODC) in Taiwan: The Initiative and Protocol Development. In Proceedings of the IGARSS 2019–2019 IEEE International Geoscience and Remote Sensing Symposium, Yokohama, Japan, 1 August 2019. [Google Scholar]
  18. Lee, K.-W.; Kim, K.-S.; Lee, S.-G.; Kim, Y.-S. Consideration points for application of KOMPSAT data to open data cube. J. Korean Assoc. Geogr. Inf. Stud. 2019, 22, 62–77. [Google Scholar] [CrossRef]
  19. Lee, K.; Kim, K. A suggestion for surface reflectance ARD building of high-resolution satellite images and its application. Korean J. Remote Sens. 2021, 37, 1215–1227. [Google Scholar] [CrossRef]
  20. Kim, J.; Kim, H. Method of hierarchical grid partition based on geo data cube model for extracting urban functional areas. J. Korean Soc. Surv. Geod. Photogramm. Cartogr. 2023, 41, 617–626. [Google Scholar] [CrossRef]
  21. Kim, Y.; Noh, B.; Yeo, H. Urban structure-based factor analysis of two-wheeler accidents using data cube model. J. Korean Soc. Transp. 2022, 40, 358–379. [Google Scholar] [CrossRef]
  22. Gao, F.; Yue, P.; Cao, Z.; Zhao, S.; Shangguan, B.; Jiang, L.; Hu, L.; Fang, Z.; Liang, Z. A multi-source spatio-temporal data cube for large-scale geospatial analysis. Int. J. Geogr. Inf. Sci. 2022, 36, 1853–1884. [Google Scholar] [CrossRef]
  23. Abad, L.; Sudmanns, M.; Hölbling, D. Vector Data Cubes for Features Evolving in Space and Time. In Proceedings of the AGILE Conference 2024: Geographic Information Science for a Sustainable Future, Glasgow, UK, 4–7 September 2024. [Google Scholar]
  24. MOLIT. Available online: https://www.law.go.kr/%EB%B2%95%EB%A0%B9/%EA%B1%B4%EC%B6%95%EB%B2%95%EC%8B%9C%ED%96%89%EB%A0%B9 (accessed on 23 November 2024).
  25. Guo, F.; Li, C.; Cheng, G.; Chen, C.; Gan, J. Spatial-temporal coupling characteristics of population urbanization and land urbanization in northeast China. J. Econ. Geogr. 2015, 35, 49–56. [Google Scholar]
  26. Zhao, X.; Xia, N.; Li, M.C. 3-D multi-aspect mix degree index: A method for measuring land use mix at street block level. Comput. Environ. Urban Syst. 2023, 104, 102005. [Google Scholar] [CrossRef]
  27. Jing, C.; Zhang, H.; Xu, S.; Wang, M.; Zhuo, F.; Liu, S. A hierarchical spatial unit partitioning approach for fine-grained urban functional region identification. Trans. GIS 2022, 26, 2691–2715. [Google Scholar] [CrossRef]
  28. Luo, S.; Liu, Y.; Du, M.; Gao, S.; Wang, P.; Liu, X. The influence of spatial grid division on the layout analysis of urban functional areas. ISPRS Int. J. Geo-Inf. 2021, 10, 189. [Google Scholar] [CrossRef]
  29. Lee, S. The delineation of function regions and modifiable areal unit problem. J. Geogr. Environ. Educ. 1999, 7, 757–783. [Google Scholar]
  30. Openshaw, S. The Modifiable Areal Unit Problem; GeoBooks: Norwich, UK, 1984. [Google Scholar]
  31. Dong, X.; Xu, Y.; Huang, L.; Liu, Z.; Xu, Y.; Zhang, K.; Hu, Z.; Wu, G. Exploring impact of spatial unit on urban land use mapping with multisource data. Remote Sens. 2020, 12, 3597. [Google Scholar] [CrossRef]
  32. Deng, Y.; He, R. Refined urban functional zone mapping by integrating open-source data. ISPRS Int. J. Geo-Inf. 2022, 11, 421. [Google Scholar] [CrossRef]
  33. MOLIT. Available online: https://www.law.go.kr/%EB%B2%95%EB%A0%B9/%EA%B1%B4%EC%B6%95%EB%B2%95 (accessed on 23 November 2024).
  34. Gomes, M.J.T.L.; Cunto, F.J.C. Influence of different spatial aggregations on variables implemented in macroscopic road-safety modeling. J. Transp. Eng. A 2020, 146, 04020014. [Google Scholar] [CrossRef]
  35. Lee, S.-I.; Cho, D.; Lee, M. Comparing univariate spatial association statistics (I): Focusing on global Lee’s s statistics. J. Assoc. Korean Geogr. 2015, 4, 329–345. [Google Scholar] [CrossRef]
  36. Li, T.; Zhang, M.; Jing, P. Understanding the modifiable areal unit problem and identifying appropriate spatial units while studying the influence of the built environment on the traffic system state. J. Adv. Transp. 2022, 2022, 8288248. [Google Scholar] [CrossRef]
  37. Jjumba, A.; Dragićević, S. Spatial indices for measuring three-dimensional patterns in a voxel-based space. J. Geogr. Syst. 2016, 18, 183–204. [Google Scholar] [CrossRef]
  38. Huh, Y.; Yu, Y.; Heo, J. Detecting conjugate-point pairs for map alignment between two polygon datasets. Comput. Environ. Urban Syst. 2011, 35, 250–262. [Google Scholar] [CrossRef]
  39. Tobler, W.R. A computer movie simulating urban growth in the Detroit region. Econ. Geogr. 1970, 46, 234–240. [Google Scholar] [CrossRef]
  40. Anselin, L. Spatial Econometrics: Methods and Models; Kluwer Academic Publishers: Boston, MA, USA, 1988. [Google Scholar]
  41. Anselin, L.; Griffith, D.A. Do spatial effects really matter in regression analysis? Pap. Reg. Sci. 1988, 65, 11–34. [Google Scholar] [CrossRef]
  42. Du, S.; Wu, Y.; Guo, L.; Fan, D.; Sun, W. How does the 2D/3D urban morphology affect the urban heat island across urban functional zones? A case study of Beijing, China. ISPRS Int. J. Geo-Inf. 2024, 13, 120. [Google Scholar] [CrossRef]
  43. Lin, A.; Sun, X.; Wu, H.; Luo, W.; Wang, D.; Zhong, D.; Wang, Z.; Zhao, L.; Zhu, J. Identifying urban building function by integrating remote sensing imagery and POI data. IEEE J. Sel. Top. Appl. Earth Observ. Remote Sens. 2021, 14, 8864–8875. [Google Scholar] [CrossRef]
  44. Silverman, B.W. Density Estimation for Statistics and Data Analysis; Chapman & Hall: London, UK, 1986. [Google Scholar]
  45. Zhai, W.; Bai, X.; Shi, Y.; Han, Y.; Peng, Z.R.; Gu, C. Beyond word2vec: An approach for urban functional region extraction and identification by combining place2vec and POIs. Comput. Environ. Urban Syst. 2019, 74, 1–12. [Google Scholar] [CrossRef]
  46. Zhang, C.; Xu, L.; Yan, Z.; Wu, S. A GloVe-Based POI Type Embedding Model for Extracting and Identifying Urban Functional Regions. ISPRS Int. J. Geo-Inf. 2021, 10, 372. [Google Scholar] [CrossRef]
  47. Zhu, Y.; Tian, D.; Yan, F. Effectiveness of entropy weight method in decision-making. Math. Probl. Eng. 2020, 2020, 3564835. [Google Scholar] [CrossRef]
  48. Shen, T.; Zhou, W.; Yuan, S.; Huo, L. Spatiotemporal characterization of the three-dimensional morphology of urban buildings based on Moran’s I. Sustainability 2024, 16, 6540. [Google Scholar] [CrossRef]
  49. Lee, S.-I.; Lee, M.; Chun, Y.; Griffith, D.A. Uncertainty in the effects of the modifiable areal unit problem under different levels of spatial autocorrelation: A simulation study. Int. J. Geogr. Inf. Sci. 2019, 33, 1135–1154. [Google Scholar] [CrossRef]
  50. Manley, D. Scale, aggregation, and the modifiable areal unit problem. In Handbook of Regional Science, 2nd ed.; Fischer, M.M., Nijkamp, P., Eds.; Springer: Berlin/Heidelberg, Germany, 2021; pp. 1711–1725. [Google Scholar] [CrossRef]
  51. Kakao Map. Available online: https://map.kakao.com/ (accessed on 23 November 2024).
  52. Kakao Developers. Available online: https://developers.kakao.com/docs/latest/ko/local/dev-guide#search-by-category (accessed on 17 September 2025).
  53. Qian, J.; Liu, Z.; Du, Y.; Liang, F.; Yi, J.; Ma, T.; Pei, T. Quantify city-level dynamic functions across China using social media and POIs data. Comput. Environ. Urban Syst. 2021, 85, 101552. [Google Scholar] [CrossRef]
  54. Tam, V.W.Y.; Fung, I.W.H.; Wang, J.; Ma, M. Effects of locations, structures and neighbourhoods to housing price: An empirical study in Shanghai, China. Int. J. Constr. Manag. 2019, 22, 1288–1307. [Google Scholar] [CrossRef]
  55. Public Data Portal. Available online: https://www.data.go.kr/data/3036455/fileData.do (accessed on 4 January 2026).
  56. VWorld. Available online: https://www.vworld.kr/dtmk/dtmk_ntads_s002.do?pageIndex=&searchDsNm=&svcCde=NA&dsId=8 (accessed on 4 January 2026).
  57. VWorld. Available online: https://www.vworld.kr/dtmk/dtmk_ntads_s002.do?svcCde=NA&dsId=7 (accessed on 4 January 2026).
  58. Shen, T.; Kong, F.; Yuan, S.; Wang, X.; Sun, D.; Ren, Z. From 2D to 3D urban analysis: An adaptive urban zoning framework that takes building height into account. Buildings 2025, 15, 1182. [Google Scholar] [CrossRef]
  59. Kamath, H.G.; Singh, M.; Malviya, N.; Martilli, A.; He, L.; Aliaga, D.; He, C.; Chen, F.; Magruder, L.A.; Yang, Z.-L.; et al. Global building heights for urban studies (UT-GLOBUS) for city- and street-scale urban simulations: Development and first applications. Sci. Data 2024, 11, 886. [Google Scholar] [CrossRef]
Figure 1. Multi-dimensional GDC schema.
Ijgi 15 00047 g001
Figure 2. Seocho-gu in Seoul, ROK.
Ijgi 15 00047 g002
Figure 3. 1000 m (1 km) grid and floor-level building-use data.
Ijgi 15 00047 g003
Figure 4. Results of the vertical urban function pattern analysis by proposed method: (a) side view visualization of the GDC; (b) top-down visualization of the GDC.
Ijgi 15 00047 g004
Figure 5. Visual evaluation of the vertical urban functions of Site 1 using Kakao Map Street View: (a) proposed GDC; (b) street view image (point colors are consistent with the 41 building-use categories in Figure 3); (c) estimated based on POI frequency.
Ijgi 15 00047 g005
Figure 6. Visual evaluation of the vertical urban functions of Site 2 using Kakao Map Street View: (a) proposed GDC; (b) street view image (point colors are consistent with the 41 building-use categories in Figure 3); (c) estimated based on POI frequency.
Ijgi 15 00047 g006
Figure 7. Visualization of Kakao POI data acquired for Site 1 and the mapping results of the mixed-use building (floor-level cross-sectional view).
Ijgi 15 00047 g007
Figure 8. Analysis results of planar urban function patterns when applying the proposed analysis method to a two-dimensional grid.
Ijgi 15 00047 g008
Figure 9. Results of 2D urban function for visual evaluation between 3D LUI and 2D LUI: (a) Site 1; (b) Site 2.
Ijgi 15 00047 g009
Figure 10. Visualization of unit building price distribution.
Ijgi 15 00047 g010
Table 1. Study data.
Data NameFormatDateUpdate CycleManaging
Authority
URL
Building
Register
(Floor-by-Floor Summary)
TextJune 2024MonthlyMOLIThttps://www.hub.go.kr/portal/opn/tyb/idx-bdrg-flr.do
(accessed on 1 January 2026)
Navigation DB
(Building
Information)
TextJune 2024MonthlyMOIShttps://business.juso.go.kr/jst/jstAddressDownload
(accessed on 1 January 2026)
Table 2. 3D Moran’s I index value results for unit cell size.
Cell Size
(x, y, z)
(1 km, 1 km, 120 m)(500 m, 500 m, 60 m)(250 m, 250 m, 30 m)(125 m, 125 m, 15 m)
3D Moran’s I
index value
0.4820.4860.4010.429
Table 3. Weights of each factor.
Floor-Level Use Category3D KDF3D EF
Commercial0.7170.283
Residential0.7070.293
Public Service0.3060.695
Transportation0.6390.361
Industrial0.7030.298
Table 4. Number of POIs with floors in in Site 1 and Stie 2.
Building Use TypeSite 1Site 2
Commercial4152
Residential--
Public Service536
Transportation1-
Total4788
Table 5. One-way ANOVA results between unit building price and 2D/3D LUI.
Data NameF-Valuep-ValueInterpretation
2D LUI
vs. unit building price
26.4288.53 × 10−21Significant
3D LUI
vs. unit building price
115.0133.12 × 10−91Highly significant
Disclaimer/Publisher’s Note: The statements, opinions and data contained in all publications are solely those of the individual author(s) and contributor(s) and not of MDPI and/or the editor(s). MDPI and/or the editor(s) disclaim responsibility for any injury to people or property resulting from any ideas, methods, instructions or products referred to in the content.