Abstract
Objective crime risk and perceived safety constitute distinct yet interrelated dimensions of urban security, whose spatial discrepancies may lead to misaligned policy interventions. This study develops a street-level analytical framework to examine the (mis)match between perceived safety and crime risk in Chaoyang District, Beijing. An enhanced Street-view imagery (SVI) segmentation model with object detection was applied to extract streetscape elements and estimate perceived safety scores, which were then standardized and compared with street-level crime data, yielding two types of matches and two types of mismatches. Three conditions were analyzed using multinomial logit regression: (1) objective unsafety with low perceived safety, (2) objective safety with low perceived safety, and (3) objective unsafety with high perceived safety. Findings demonstrate how visual and social environmental factors jointly shape discrepancies between perceived and actual safety and identify potential determinants to mitigate such (mis)matches.
1. Introduction
Streets constitute the fundamental unit of urban environments, shaping urban dynamic functions (e.g., transportation, logistics) and influencing human psychological perceptions and behaviors [1]. Street-view imagery (SVI) provides a digital representation that most closely reflects the micro-scale urban environment [2]. In recent years, the rapid development of SVI has offered new opportunities for micro-scale quantitative analyses of cities, including mobility, public health, and environmental impacts [3,4,5].
In the field of environmental criminology, the influence of the built environment on crime and safety perception is well established [6,7,8,9] through foundational theories including routine activity theory, crime pattern theory, and defensible space theory, which explain how environmental features create crime opportunities and shape human perceptions. These theoretical frameworks provide complementary perspectives on the perception-reality gap: routine activity theory explains how suitable targets, motivated offenders, and absent guardians converge in space; crime pattern theory elucidates how activity nodes create crime concentrations; and defensible space theory demonstrates how physical design influences territoriality and surveillance. Together, they form the conceptual foundation for examining how micro-environmental features simultaneously shape both objective crime risks and subjective safety perceptions. Streetscapes influence both offenders’ target selection [10,11] and residents’ safety perception [7,12,13,14,15]. Street-view imagery (SVI), by capturing the physical environment from a human perspective, enables the study of how criminals and residents perceive urban spaces. Although prior research has examined the relationship between the built environment, crime, and safety perception, studies exploring the causes of the (mis)match between perceived and actual safety remain limited. In practice, residents’ subjective sense of security often diverges from objective crime patterns. For instance, locations perceived as unsafe may indeed correspond to high-crime areas [16,17], yet areas perceived as safe can still be selected by offenders for criminal activity [18,19]. A comprehensive understanding of the relationship between perceived and actual safety is therefore essential for uncovering the sources of misalignment between subjective perception and objective risk. Such insights can also inform more effective crime prevention strategies through environmental design and urban planning.
In summary, to investigate the causes of the (mis)match between perceived safety and objective crime risk, we proposed a novel street-level analytical framework and applied it to a case study of Chaoyang District, Beijing. First, we employed an enhanced SVI segmentation model that integrates object detection to extract both SVI elements and street-level perceived safety scores. We then matched the standardized perceived safety scores with objective crime risk at the street level, yielding two categories of matches and two categories of mismatches. Among these, three conditions were analyzed using multinomial logit regression: (1) objective unsafety with low perceived safety, (2) objective safety with low perceived safety, and (3) objective unsafety with high perceived safety. These analyses investigated the effects of street-level visual features and social environmental factors on the observed patterns. Finally, the determinants of mismatch situations were interpreted in the context of previous research, with particular emphasis on identifying factors that may mitigate or prevent such mismatches. This approach extends theoretical understanding of the perception-reality gap while providing methodological innovations for micro-scale urban safety analysis.
This paper is organized as follows. Section 2 provides a systematic review of related work. Section 3 describes the study area and data. Section 4 outlines the methodology. Section 5 presents the empirical results. Finally, Section 6 summarizes the main findings, highlights the contributions, and discusses the limitations of the study.
2. Related Work
2.1. Research on Urban Environment and Crime
Crime Prevention Through Environmental Design (CPTED) posits that modifying the built environment can deter criminal behavior by influencing offenders’ decision-making processes [20]. Numerous studies have applied CPTED principles to investigate how urban form shapes crime distribution, particularly at the city scale [20,21,22].
Key findings suggest that crime tends to cluster around activity nodes and movement corridors, reflecting offenders’ routine activities [23]. Commercial facilities such as bars, hotels, and retail stores show strong correlations with theft, robbery, and assault [24], while residential areas and transit hubs also serve as crime attractors [25]. Kim and Hipp [22] further demonstrated that higher commercial density and land-use diversity are associated with elevated crime rates, whereas urban design qualities such as walkability and visibility are negatively related to crime occurrence. Similar patterns have been observed in Chinese cities, where facilities including bus stops, subway stations, entertainment venues, shopping malls, supermarkets, and residential buildings significantly influence crime risks [26,27].
At the micro scale, street-view imagery (SVI) has emerged as a powerful tool for quantifying environmental features and their criminogenic effects across different crime types. Studies using street view imagery (SVI) from platforms such as Google, Baidu, and Amap have linked visual streetscape attributes, such as greenery, lighting, and pedestrian activity, to crime patterns [28,29]. For example, physical disorder (e.g., poor maintenance, abandoned buildings) has been found to amplify violent crime risks [30], while natural surveillance (e.g., shops, snack bars) deters property crimes by increasing the perceived risk of detection for potential offenders [31]. Vegetation exhibits mixed effects: some studies report associations with reduced property and violent crime [32,33], whereas others find negligible relationships [34]. Infrastructure elements also matter; traffic lights and utility infrastructure poles (including electrical, telecommunications, and traffic signal installations) may help suppress drug-related crime [35], while high street density and compact building coverage can increase crime risks [36].
The extant literature demonstrates that both macro-scale urban configurations (e.g., commercial density, land-use diversity) and micro-scale streetscape characteristics (e.g., visibility, physical disorder) exhibit systematic relationships with crime patterns. By leveraging street view imagery (SVI), researchers have bridged socio-spatial theory with empirical analysis, revealing that fine-grained environmental features, including pedestrian activity and vegetation coverage, interact with socioeconomic dynamics to shape criminal opportunities and community perceptions. Collectively, these findings underscore that crime is not solely a social phenomenon but also a spatially embedded process, mediated by the interplay among built environments, human behaviors, and institutional contexts.
2.2. Research on Crime and Safety Perception
In recent years, research has expanded beyond examining the relationships between physical or social characteristics and crime to investigating the association between crime and subjective safety perception. Unlike the affective dimension of fear of crime, safety perception reflects a cognitive evaluation of the built environment, which can influence the pool of potential crime targets and ultimately shape criminal opportunities [12]. Recent studies have applied deep learning techniques to derive safety perception scores from SVI and analyze their spatial correlations with crime. For example, Zhang et al. [18] reported a significant positive association between safety perception and crime rates at the block-group level. In contrast, Zhou et al. [35] found that safety perception, along with traffic lights and utility poles, exerted a deterrent effect on drug-related activities, whereas traffic signs and street density were positively correlated with crime. To enhance model interpretability, Liu et al. [37] developed an explainable machine learning framework, which was validated through a case study in central London. Addressing the modifiable areal unit problem, Zhou et al. [12] examined scale dependency in the perception–crime relationship, showing that safety perception was positively correlated with street theft and robbery at the street-segment and census block levels but negatively correlated at the block-group level. These findings underscore the non-transferability of perception–crime relationships across spatial scales and highlight the necessity of multi-scale evaluations.
Despite these advances, three critical limitations persist in the current literature. First, existing studies predominantly focus on correlation analysis between aggregated safety perception scores and crime incidents, often overlooking the spatial (mis)alignment between subjective assessments and objective risk at micro-geographic scales. Second, the literature lacks theoretical frameworks that simultaneously account for both environmental determinants of crime opportunities and perceptual mechanisms of safety evaluation within the same analytical unit. Third, prior research has insufficiently examined how streetscape elements and social contexts jointly produce conditions where perception diverges from objective reality.
These limitations are particularly consequential because the absence of street-level evidence on perception-crime (mis)matches impedes the development of targeted environmental interventions. When residents’ safety perceptions systematically diverge from actual crime patterns, urban planning and crime prevention strategies risk misallocating resources to areas of perceived rather than actual vulnerability. This knowledge gap limits our understanding of how micro-scale urban environments contribute to discrepancies between perception and reality, a limitation that must be addressed to inform evidence-based urban safety interventions.
3. Study Area and Data
We selected Chaoyang District in Beijing (excluding the Capital International Airport) as the study area. Covering 460.8 square kilometers, the district comprises 24 subdistricts and 19 administrative regions. Chaoyang is highly representative due to its diverse street network and complex population structure, encompassing core business zones, transitional areas, and aging residential communities with aging building infrastructure. These characteristics make it a typical case for examining urban safety perception and crime. Furthermore, the availability of high-quality SVI and detailed crime data enhances its suitability for this analysis.
3.1. Street Network and SVI
The street network served as the fundamental spatial unit for analysis. Street data were sourced from OpenStreetMap (OSM), and duplicate segments were removed, resulting in 9654 unique street segments. Sampling points were generated at 50 m intervals along each segment, a distance selected based on empirical studies of urban micro-environments [18,38], producing approximately 40,000 sample points. It is important to note the temporal context of our visual data: all street view imagery was captured during 2018–2019, reflecting the typical update cycle of commercial street view services at that time. During this period, street view data generally followed annual update frequencies in urban areas, while low-density regions often experienced multi-year intervals between updates. This temporal limitation is particularly relevant for rapidly developing urban contexts, as environmental changes occurring after the image capture date would not be reflected in our analysis. For each point, four Tencent Street View (TSV) images were retrieved via the TSV API, covering four cardinal orientations: two images parallel to the street (0–90°, 90–180° axis) and two images perpendicular to the street (180–270°, 270–360° axis). In total, the dataset comprised 160,000 images. The subsequent image preprocessing steps were as follows in Figure 1.
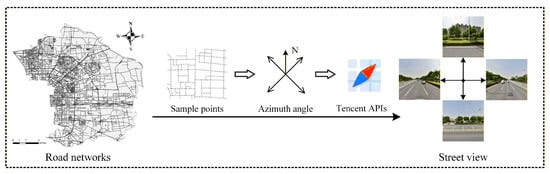
Figure 1.
Workflow for Acquiring SVI.
3.2. Crime and Population Data
To avoid potential distortions caused by the COVID-19 pandemic, this study focused on theft and violent crime (robbery and assault) incidents occurring in 2019 in Chaoyang District. A total of 13,930 theft cases and 1959 violent crime cases were recorded. To accurately analyze the relationship between safety perception and crime, crime data were mapped onto the street network for spatial analysis [39,40]. Population data for 2019 were obtained from WorldPop at 100 m resolution. To align this raster dataset with our 50 m street segments, it was employed an area-weighted interpolation approach. Specifically, each street segment was spatially intersected with WorldPop grid cells, and population values were allocated proportionally based on the overlapping area between the street buffer (25 m width on each side) and each 100 m grid cell. ArcMap 10.8 was used to extract population and population density values for each spatial analysis unit. By the end of 2019, Chaoyang District had a permanent population of approximately 3.473 million, with an average population density of 7626 people per square kilometer.
3.3. Points of Interest (POI) Data
Points of Interest (POI) data provide a detailed representation of urban functional infrastructure, offering broad spatial coverage at relatively low acquisition cost. For Chaoyang District in 2019, a total of 137,385 POI records were obtained from Baidu Maps, encompassing 13 categories, including food services, retail, personal services, and healthcare facilities.
Based on crime pattern theory, land-use and criminal behavior are associated through three types of spatial relationships: generative, attractive, and suppressive. Accordingly, POIs were classified into three categories:
- (1)
- Crime generator: Locations that attract individuals without initial criminal intent by providing dense target opportunities [41,42,43,44].
- (2)
- Crime attractor: Locations offering environments rich in opportunities, often becoming hotspots for repeat offenses by motivated offenders [45].
- (3)
- Crime inhibitor: Locations that deter criminal activity through the presence of authority or restricted accessibility, creating psychological or physical barriers for offenders [46,47].
These POI categories reflect differential crime opportunities: commercial and entertainment venues function as crime generators by concentrating potential targets and creating anonymity through high foot traffic, while bars and nightclubs often serve as crime attractors that specifically draw motivated offenders. Conversely, security facilities and community spaces act as crime inhibitors through increased surveillance and guardianship. A detailed categorization of POI types and their corresponding crime-related functions is presented in Table 1.

Table 1.
Classification and description of POIs by crime-related function.
4. Methodology
The workflow of this study is illustrated in Figure 2 and consists of four primary stages:
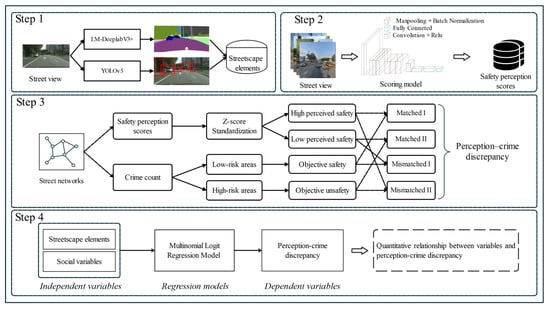
Figure 2.
Workflow of this study.
- (1)
- Extraction of streetscape elements: Semantic segmentation and object detection techniques were applied to SVI to identify and quantify streetscape features.
- (2)
- Computation of safety perception scores: A deep learning–based perception assessment model was used to estimate safety perception for each street segment.
- (3)
- Integration with crime data: Safety perception scores and actual crime occurrences were embedded into the street network, allowing each segment to be classified into one of four perception–crime discrepancy types.
- (4)
- Modeling relationships: Multinomial logit regression was developed to examine the associations between independent variables (streetscape elements and surrounding social factors) and dependent variables, namely perception–crime discrepancies.
4.1. Extraction of Streetscape Elements
In recent years, scholars have explored the sensitivity of environmental element extraction from SVI when employing deep learning methods for streetscape quantification. Yue [48] and Xie [49] argue that elements with small spatial footprints, fixed shapes, and discrete distributions are not well suited for extraction via semantic segmentation techniques. Such features (e.g., traffic signs or pedestrians) occupy relatively small pixel areas in images compared to larger elements like buildings, vegetation, or streets, and may therefore be underestimated in pixel-based segmentation. In these cases, object detection can be used to count the frequency of their occurrence, providing a more accurate reflection of their presence [50]. Conversely, elements with larger footprints, irregular shapes, and continuous distributions (e.g., sky, streets, vegetation, or buildings) cannot be accurately counted and are better captured using semantic segmentation. Accordingly, this study adopts a hybrid approach:
- (1)
- Non-discrete, large-area elements: LM-DeeplabV3+ [51] was used to extract the proportional area of each element in the images.
- (2)
- Discrete, easily quantifiable elements: Both semantic segmentation (LM-DeeplabV3+) and object detection (YOLOv5 [52]) were applied to extract these streetscape features.
The formulas used to calculate the proportion and count of various streetscape elements through semantic segmentation and object detection are as follows:
where denote the total number of sampling points along a given street segment. represents the pixel area of element in the j-th image at the i-th sampling point, and is the total pixel area of this image. denotes the number of in the j-th image at the i-th sampling point.
A summary of the extracted streetscape element statistics is provided in Table 2. The semantic categories in Table 2 (except for the last 4 statistical metrics) follow the standardized classification system of the Cityscapes dataset [53].
Table 2.
The statistics of extracted streetscape elements.
4.2. Safety Perception Scores and Perception-Crime Discrepancy
The SVI safety perception scores model was primarily trained using a combination of large-scale human-labeled perception scores and deep learning techniques. To extract sufficient visual features from the images, we employed the end-to-end CNN model developed by Wang et al. [54], which is specifically designed for evaluating streetscape safety perception. This perception model is based on the architecture of VGG16 [55], a structure widely recognized for its robustness in visual feature extraction tasks. Notably, the model was trained on a localized dataset from China, making it more suitable for studies conducted in the China compared to models trained on Place Pulse 2.0 [56,57].
The distribution of safety perception scores approximates a normal distribution. Z-score standardization was applied to the safety perception scores, with standardized values above zero defined as perceived safe and values below zero defined as perceived unsafe. To further refine the classification, ±0.5 (i.e., one standard deviation) was added to and subtracted from the mean (0 after standardization). Scores below −0.5 were classified as low safety perception, while scores above +0.5 were classified as high safety perception. For objective safety, any street segment with a recorded crime was classified as objective unsafety, whereas segments without crime records were considered objective safety. Combining this classification with the standardized safety perception scores, each segment could thus be categorized into one of four match/mismatch types:
Table 3 summarizes the cross-tabulation of objective safety and perceived safety under two types of crime: theft and violent crime. For theft, matched perceptions accounted for 46.2% of the whole street network, with 34.7% falling into Matched I and 11.5% into Matched II. In contrast, mismatched perceptions were slightly more prevalent, totaling 53.8%, with the largest share (40.5%) in Mismatched I and 13.2% in Mismatched II.
Table 3.
The statistics of match/mismatch types.
A similar pattern was observed for violent crime, where matched perceptions represented 47.4% of cases (43.26% in Matched I and only 4.12% in Matched II), while mismatches reached 52.6%. Again, Mismatched I dominated (47.61%), followed by Mismatched II (5.01%).
Overall, the results indicate that mismatches between objective and perceived safety are widespread, particularly under conditions of objective safety where residents nonetheless perceive low safety. Given the theoretical and practical importance of these discrepancies, the subsequent Multinomial Logit Regression analysis focuses on the two mismatched categories, using Matched II as the reference group.
4.3. Modeling for Crime, Safety Perception, and Their Discrepancy
The match between actual crime and safety perception was modeled as a categorical outcome. Following Zhang et al. [58], a Multinomial Logit (Multi-logit) Regression model was used to analyze this relationship. Matched II (objective unsafety with low perceived safety) was selected as the reference category. This category represents the most rational response under objectively unsafe conditions, where individuals correctly recognize environmental risks and adjust their perceptions accordingly. Using this group as the baseline provides a theoretically meaningful benchmark against which mismatched perceptions can be interpreted as deviations from accurate risk recognition. In contrast, Matched I (objective safety with high perceived safety) reflects a context of low objective risk and thus offers limited analytical value for examining discrepancies between perception and reality. Moreover, focusing on Matched II as the reference enhances the policy relevance of the analysis, as it emphasizes situations where risk is present and the critical question is whether residents adequately perceive and respond to it.
The Multi-logit model is an extension of logistic regression designed for dependent variables with more than two unordered categories. The principle is as follows:
Assuming there are unordered categories and m explanatory variables, the model equation for category is:
where denotes the probability that the response variable falls into category , and indicates that for each one-unit increase in the i-th explanatory variable, the log-odds of being in category (relative to the reference category) change by units. The probabilities for each outcome category are then calculated as:
Prior to model estimation, multicollinearity diagnostics were conducted using variance inflation factors (VIF) to ensure the validity of regression coefficients, particularly for potentially correlated variables such as population and population density. Variables exhibiting VIF values exceeding the threshold of 5 would be subject to exclusion or transformation to mitigate collinearity concerns.
Model fit was assessed using McFadden’s pseudo R2, a standard goodness-of-fit measure for multinomial logistic regression models. Unlike the R2 in linear regression, McFadden’s pseudo R2 typically ranges from 0 to 1 but generally yields lower values, with values above 0.2 considered indicative of excellent model fit and values above 0.4 considered rare in social science applications [59]. This metric evaluates the improvement in model log-likelihood relative to the intercept-only model, providing a conservative estimate of explanatory power appropriate for our explanatory research design. While predictive accuracy metrics remain secondary to coefficient interpretation in this explanatory context, McFadden’s pseudo R2 offers a standardized benchmark for comparing model specifications and assessing the relative contribution of streetscape versus social variables.
5. Results
5.1. Spatial Distribution of Crime and Safety Perception
The spatial distribution of crime in the study area is shown in Figure 3. Units with higher levels of criminal activity tend to cluster, forming distinct crime hotspots. Based on the presence of criminal incidents on each street segment, units were categorized as either objectively safe or unsafe. Street segments without recorded crime incidents were classified as objectively safe, whereas segments with at least one recorded incident were defined as objectively unsafe. Following this classification, 7264 segments were labeled as objectively safe, and 2390 segments as objectively unsafe.
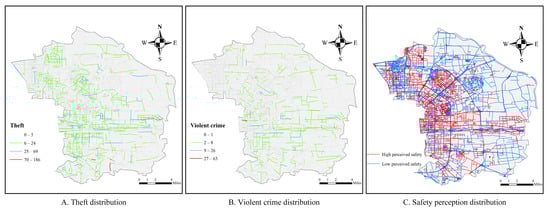
Figure 3.
Spatial distribution of theft (A), violent crime (B) and safety perception (C). The left panel shows the distribution of objective crime incidents, while the right panel illustrates the spatial pattern of safety perception scores derived from SVI.
As shown in Figure 3, the overall safety perception level in Chaoyang District is relatively high. The highest levels of safety perception are observed in the central-western area, where the street network is denser, economic development is more advanced, the population is denser, and street infrastructure is more complete. In contrast, the eastern region exhibits lower safety perception, with a sparser street network, suggesting lower levels of development and less well-constructed streets compared to the west.
5.2. Independent Variables
Although object detection techniques were employed to extract the numbers of pedestrians, bicycles, and vehicles from SVI, these images capture only a single snapshot in time. Given the substantial variation in street activity across different areas, seasons, and times of day, pedestrian, bicycle, and vehicle counts were excluded from the explanatory variables. The descriptive statistics of the selected variables are presented in Table 4. Variables were selected based on environmental criminology theory and prior empirical research [7,11,18,19]. A total of 14 explanatory variables were included: eight types of streetscape elements (street, sidewalk, building, wall, fence, tree, ground, and number of traffic lights), two sociodemographic variables (population and population density), and four social-built environment variables (street length, crime generator, crime attractor, and crime inhibitor). The number of theft cases per unit ranged from 0 to 186, with the majority of units recording zero incidents. The number of violent cases per unit ranged from 0 to 63, with the majority of units recording zero incidents either. Safety perception scores ranged from 1.73 to 4.08 and approximately follow a normal distribution, with a higher concentration around the middle range. Variance inflation factors (VIFs) for all variables were below 5, with an average VIF of 2.1, indicating no significant multicollinearity.
Table 4.
The statistics of regression variables.
5.3. Regression Results
Table 5 presents the associations between two types of spatial mismatch: (1) objective safety with low perceived safety and (2) objective unsafety with high perceived safety, and their relationships with various streetscape and social variables. The findings highlight how streetscape elements and social variables can jointly shape the divergence between actual crime risk and perceived safety for both theft and violent crime. The multinomial logit models demonstrate strong explanatory power, yielding McFadden’s pseudo R2 values of 0.256 for theft and 0.337 for violent crime. These goodness-of-fit statistics confirm the models’ ability to effectively capture the complex relationships between spatial mismatches and environmental determinants.
Table 5.
Regression results for the match types of theft and violent crime.
- (1)
- Objective safety with low perceived safety
For both theft and violent crime, street segments with higher sidewalk and building ratios are associated with greater perceived safety, whereas greater proportions of walls, vegetation, and terrain tend to elicit lower perceived safety, even though such areas typically exhibit lower objective crime risk.
Additional factors associated with this mismatch pattern include low population density and complex street networks, which correlate with reduced perceived safety despite lower actual crime risk. Visual elements such as greenery coverage and sidewalk presence show paradoxical effects, while they correlate with lower objective crime risk, they may simultaneously reduce perceived safety when present in excessive amounts or in poorly structured configurations.
- (2)
- Objective unsafety with high perceived safety
In these areas, residents report perceived safe, despite high actual crime risk. The mechanisms underlying this mismatch differ for theft and violent crime, reflecting how streetscape elements interact with urban activities.
For theft, areas with lower wall ratios tend to enhance perceived safety, but these same areas are more susceptible to theft incidents. These locations typically feature longer streets, larger populations, and higher densities of crime generators, attractors, and inhibitors. The subjective sense of safety arises from open streetscapes, ambiguous boundaries, and wide visual fields. These areas are often located in urban center with high foot traffic and diverse functions. However, the objective risk is heightened because areas with fewer walls and buildings offer weaker spatial control and surveillance.
For violent crime, a different mismatch mechanism emerges. Areas with more greenery, longer streets, and a greater presence of crime attractors (such as restaurants, shopping venues, scenic spots, and transportation hubs) are more likely to be perceived as safe, yet are statistically more vulnerable to violence. Dense vegetation in areas with fewer buildings or walls reduces visibility, weakening environmental control and surveillance. Moreover, such attractors frequently serve as hotspots for violent incidents.
In summary, areas classified as “objectively unsafe but perceived as safe” are typically marked by overexposed spaces, ambiguous territorial boundaries, and intense urban activity, all of which increase actual crime risk. Although open and green streetscapes often promote positive safety perceptions, the absence of effective natural surveillance and spatial control can render these environments vulnerable to crime despite their apparent security.
6. Discussion
Our empirical findings reveal fundamental tensions between environmental features that shape safety perception and those that influence actual crime patterns. This section interprets these patterns through established criminological theories to elucidate the mechanisms driving perception-crime mismatches.
The mismatch of objective safety with low perceived safety aligns with, yet also nuances, existing scholarship. Harvey et al. [6] argue that spatial enclosure (such as street tree canopies, building density, and the height-to-width ratio) can enhance perceived safety. Lu et al. [60] find that excessive vegetation and a lack of built structures are often linked to lower safety perceptions. Hinkle and Yang [61] further stress the importance of the orderly function of greenery, particularly in separating pedestrian and vehicular space. Lei et al. [62] and Adachi and Nakaya [63] suggest that a high proportion of wall surfaces causes visual blockage and psychological oppression, weakening natural surveillance mechanisms [64], and amplifying negative perceptions. These findings suggest that perceived safety follows a different theoretical logic than objective crime patterns: perception responds primarily to immediate visual cues and environmental legibility (defensible space theory), while actual crime distribution follows opportunity structures and offender rationality (routine activity theory). Well-defined, orderly streetscapes enhance perceived safety by providing clear territorial markers and visual coherence. Conversely, environments with excessive walls, unmanaged greenery, and open ground may induce anxiety despite their objective safety.
For objective unsafety with high perceived safety, our results reveal how design elements that theoretically enhance surveillance can create false security when they mask underlying opportunity structures. The theft-related mismatch aligns with routine activity theory, and areas with high commercial density and mixed land use concentrate motivated offenders, suitable targets, and reduced guardianship [22,24,25], particularly around transportation hubs and entertainment venues. Similarly, for violent crime, the paradoxical relationship between greenery and safety perception challenges traditional defensible space principles [64,65], as comfortable environments with dense vegetation and attractors create opportunities for violence despite fostering positive perceptions [66].
This tension between perception and reality highlights the need to adapt Western-derived crime prevention theories to the cultural context of rapidly developing Chinese urban environments. Our street-level analysis shows that when residents’ perceptions of safety consistently differ from actual crime patterns, urban interventions may allocate resources based on perceived rather than actual vulnerability.
7. Conclusions
7.1. Key Findings
The mechanisms underlying the spatial distribution of criminal activities and residents’ safety perception exhibit notable differences, which aligns with recent studies [12,18]. To investigate these discrepancies and their potential causes, this study conducts a comparative analysis of perceived safety and crime distribution within the urban microenvironment. First, streetscape elements were extracted using deep learning techniques, and a pre-trained model was employed to generate perceived safety scores across Chaoyang District, Beijing, revealing the spatial pattern of perceived safety in the area. Next, theft and violence crime data were integrated with environmental and social variables (including streetscape features, street length, population density, and POIs) mapped onto the urban street network. Finally, the spatial discrepancies of perceived safety and objective crime risk were analyzed and compared.
The main findings are as follows: crime incidents are more prevalent in the western part of Chaoyang District, whereas safety perception scores are generally higher in the west and lower in the east. These spatial patterns yield four types of correspondence between actual and perceived safety: (1) Matched I: Objective safety with high perceived safety. (2) Matched II: Objective unsafety with low perceived unsafety. (3) Mismatched I: Objective safety with low perceived safety. (4) Mismatched II: Objective unsafety with high perceived safety. No significant correlation was observed between macro-level crime distribution and safety perception, indicating that objective safety and perceived safety constitute two distinct dimensions of urban safety. Each dimension is shaped by different spatial dynamics and influencing factors, and thus should be examined both independently and comparatively to achieve a comprehensive understanding of urban safety at the micro level.
The influencing factors of crime distribution and safety perception differ substantially. For crime distribution, key determinants include both environmental and social variables. Among streetscape elements, a higher proportion of building area is positively associated with crime risk, whereas greater coverage of vegetation and terrain is negatively associated. In terms of social variables, total population, population density, street length, and the presence of crime generators all show a positive correlation with crime occurrence.
By contrast, safety perception is shaped by a distinct set of factors. Streetscape elements such as streets, sidewalks, and building fences exhibit a positive association with perceived safety, while walls and terrain are negatively associated. With respect to social variables, population density and the density of crime attractors are positively related to perceived safety, whereas street length is negatively associated.
The three types of matched or mismatched between perceived safety and actual crime risk are influenced by distinct factors:
- (1)
- Matched II (Objective unsafety, perceived unsafety): Key contributing streetscape elements include walls, fences, and terrain. In addition, social variables such as street length, population density, crime generators, crime attractors, and crime suppressors are all positively associated with this pattern.
- (2)
- Mismatched I (Objective safety, perceived unsafety): This pattern is primarily driven by walls and terrain in the streetscape. With respect to social variables, population size and street length emerge as the main drivers of discrepancy between actual and perceived safety.
- (3)
- Mismatched II (Objective unsafety, perceived safety): No streetscape elements are significantly associated with this pattern. However, several social variables, including population size, street length, population density, crime generators, and crime attractors, exert significant influence.
7.2. Policy Implications
The findings of this study offer practical implications for multiple stakeholders in urban safety governance. Urban planners can utilize the streetscape-crime relationships to inform evidence-based design guidelines, particularly regarding building layouts and visibility optimization. Law enforcement agencies may benefit from the spatial prediction model to allocate patrol resources more efficiently across high-risk street segments. Community administrators can prioritize environmental interventions in residential communities where safety perception significantly deviates from actual crime patterns. Finally, the quantified relationship between specific street elements and safety outcomes provides actionable metrics for architects and developers when designing new urban spaces or renovating existing ones. These targeted applications demonstrate how computational criminology can bridge academic research with practical safety interventions across institutional boundaries.
8. Limitations
This study has several limitations that should be acknowledged:
First, the spatial unit of analysis is based on street segments. However, streets of different hierarchies may exert varying influences on both residents’ safety perception and crime spatial distribution. Future research should consider incorporating street classification and account for factors such as street type, traffic volume, and the number of lanes to improve the precision of analysis.
Second, the characteristics of the same spatial unit may vary across seasons and between day and night. Due to data limitations, this study did not account for these temporal variations. Future studies could refine the analysis by disaggregating crime data by season and time of day to explore how temporal dynamics affect crime patterns.
Third, the multinomial logit model’s interpretability proved valuable for deriving actionable urban design insights, though its limitation in capturing non-linear environmental-crime relationships should be noted.
Author Contributions
Conceptualization, Haishuo Gu and Jinguang Sui; methodology, Peng Chen; software, Miaoxuan Shan; validation, Haishuo Gu, Jinguang Sui and Miaoxuan Shan; formal analysis, Peng Chen; investigation, Jinguang Sui and Peng Chen; data curation, Haishuo Gu and Xinyu Hou; writing—original draft preparation, Jinguang Sui; writing—review and editing, Peng Chen; visualization, Miaoxuan Shan and Xinyu Hou; funding acquisition, Jinguang Sui and Haishuo Gu. All authors have read and agreed to the published version of the manuscript.
Funding
This work is supported by the National Science and Technology Support Program Project (Grant No. 2023YFC3321604) and the National Natural Science Foundation of China (Grant No. 721).
Data Availability Statement
The data supporting the findings of this study are not publicly available due to legal and ethical restrictions concerning participant confidentiality and national/regional data protection policies. Requests for access may be submitted to the corresponding author and will be considered on a case-by-case basis.
Conflicts of Interest
The authors declare no conflicts of interest.
References
- Knipprath, K.; Crul, M.; Waldring, I.; Bai, X. Urban Space and Social Cognition: The Effect of Urban Space on Intergroup Perceptions. Ann. Am. Acad. Political Soc. Sci. 2021, 697, 192–206. [Google Scholar] [CrossRef]
- Andersson, V.O.; Birck, M.A.F.; Araújo, R.M.; Cechinel, C. Towards crime rate prediction through street-level images and siamese convolutional neural networks. ENIAC—Encontro Nac. De Inteligência Artif. Comput. 2017, 12, 448–459. [Google Scholar]
- Biljecki, F.; Ito, K. Street view imagery in urban analytics and GIS: A review. Landsc. Urban Plan. 2021, 215, 104217. [Google Scholar] [CrossRef]
- Ito, K.; Zhu, Y.; Abdelrahman, M.; Liang, X.; Fan, Z.; Hou, Y.; Zhao, T.; Ma, R.; Fujiwara, K.; Ouyang, J.; et al. ZenSVI: An open-source software for the integrated acquisition, processing and analysis of street view imagery towards scalable urban science. Comput. Environ. Urban Syst. 2025, 119, 102283. [Google Scholar] [CrossRef]
- Wang, S.; Huang, X.; Liu, P.; Zhang, M.; Biljecki, F.; Hu, T.; Fu, X.; Liu, L.; Liu, X.; Wang, R.; et al. Mapping the landscape and roadmap of geospatial artificial intelligence (GeoAI) in quantitative human geography: An extensive systematic review. Int. J. Appl. Earth Obs. Geoinf. 2024, 128, 103734. [Google Scholar] [CrossRef]
- Harvey, C.; Aultman-Hall, L.; Hurley, S.E.; Troy, A. Effects of skeletal streetscape design on perceived safety. Landsc. Urban Plan. 2015, 142, 18–28. [Google Scholar] [CrossRef]
- Tang, F.; Zeng, P.; Wang, L.; Zhang, L.; Xu, W. Urban Perception Evaluation and Street Refinement Governance Supported by Street View Visual Elements Analysis. Remote Sens. 2024, 16, 3661. [Google Scholar] [CrossRef]
- Zhang, F.; Zhang, D.; Liu, Y.; Lin, H. Representing place locales using scene elements. Comput. Environ. Urban Syst. 2018, 71, 153–164. [Google Scholar] [CrossRef]
- Pánek, J.; Ivan, I.; Macková, L. Comparing Residents’ Fear of Crime with Recorded Crime Data—Case Study of Ostrava, Czech Republic. ISPRS Int. J. Geo-Inf. 2019, 8, 401. [Google Scholar] [CrossRef]
- Xia, C.; Zhang, A.; Yeh, A.G.O. The Varying Relationships between Multidimensional Urban Form and Urban Vitality in Chinese Megacities: Insights from a Comparative Analysis. Ann. Am. Assoc. Geogr. 2021, 112, 141–166. [Google Scholar] [CrossRef]
- Liu, L.; Xie, H.; Yue, H. A Comparative Study of Different Street View Image Micro-environment Extraction Methods for Explaining Street Property Crimes. J. Geo-Inf. Sci. 2023, 25, 1432–1447. [Google Scholar] [CrossRef]
- Zhou, H.; Liu, L.; Wang, J.; Wilson, K.; Lan, M.; Gu, X. A Multiscale Assessment of the Impact of Perceived Safety from Street View Imagery on Street Crime. Ann. Am. Assoc. Geogr. 2024, 114, 69–90. [Google Scholar] [CrossRef]
- Kang, Y.; Abraham, J.; Ceccato, V.; Duarte, F.; Gao, S.; Ljungqvist, L.; Zhang, F.; Näsman, P.; Ratti, C. Assessing differences in safety perceptions using GeoAI and survey across neighbourhoods in Stockholm, Sweden. Landsc. Urban Plan. 2023, 236, 104768. [Google Scholar] [CrossRef]
- Zhang, F.; Liu, Y. Street view imagery: Methods and applications based on artificial intelligence. Natl. Remote Sens. Bull. 2021, 25, 1043–1054. [Google Scholar] [CrossRef]
- Zhang, F.; Zhou, B.; Ratti, C.; Liu, Y. Discovering place-informative scenes and objects using social media photos. R. Soc. Open Sci. 2019, 6, 181375. [Google Scholar] [CrossRef]
- Brunton-Smith, I.; Sturgis, P. Do neighborhoods generate fear of crime? An empirical test using the British Crime Survey. Criminology 2011, 49, 331–369. [Google Scholar] [CrossRef]
- Hanslmaier, M. Crime, fear and subjective well-being: How victimization and street crime affect fear and life satisfaction. Eur. J. Criminol. 2013, 10, 515–533. [Google Scholar] [CrossRef]
- Zhang, F.; Fan, Z.; Kang, Y.; Hu, Y.; Ratti, C. “Perception bias”: Deciphering a mismatch between urban crime and perception of safety. Landsc. Urban Plan. 2021, 207, 104003. [Google Scholar] [CrossRef]
- Yanji, Z.; Jialing, H.; Yongyi, Y. Spatial pattern and influencing factors of fear of crime and their differences with those of criminal activities: Application of deep learning algorithm to street view images in Beijing. Prog. Geogr. 2024, 43, 2271–2283. [Google Scholar] [CrossRef]
- Cozens, P.M.; Saville, G.; Hillier, D. Crime prevention through environmental design (CPTED): A review and modern bibliography. Prop. Manag. 2005, 23, 328–356. [Google Scholar] [CrossRef]
- Brantingham, P.L.; Brantingham, P.J. Nodes, paths and edges: Considerations on the complexity of crime and the physical environment. J. Environ. Psychol. 1993, 13, 3–28. [Google Scholar] [CrossRef]
- Kim, Y.-A.; Hipp, J.R. Density, diversity, and design: Three measures of the built environment and the spatial patterns of crime in street segments. J. Crim. Justice 2021, 77, 101864. [Google Scholar] [CrossRef]
- Felson, M.; Boivin, R. Daily crime flows within a city. Crime Sci. 2015, 4, 31. [Google Scholar] [CrossRef]
- Lee, S.; Lee, C.; Won Nam, J.; Vernez Moudon, A.; Mendoza, J.A. Street environments and crime around low-income and minority schools: Adopting an environmental audit tool to assess crime prevention through environmental design (CPTED). Landsc. Urban Plan. 2023, 232, 104676. [Google Scholar] [CrossRef] [PubMed]
- Su, N.; Li, W.; Qiu, W. Measuring the associations between eye-level urban design quality and on-street crime density around New York subway entrances. Habitat Int. 2023, 131, 102728. [Google Scholar] [CrossRef]
- Wang, Z.; Liu, L.; Haberman, C.; Lan, M.; Yang, B.; Zhou, H. Burglaries and entry controls in gated communities. Urban Stud. 2021, 58, 2920–2932. [Google Scholar] [CrossRef]
- Zeng, M.; Mao, Y.; Wang, C. The relationship between street environment and street crime: A case study of Pudong New Area, Shanghai, China. Cities 2021, 112, 103143. [Google Scholar] [CrossRef]
- Deng, M.; Yang, W.; Chen, C.; Liu, C. Exploring associations between streetscape factors and crime behaviors using Google Street View images. Front. Comput. Sci. 2022, 16, 164316. [Google Scholar] [CrossRef]
- Hipp, J.R.; Lee, S.; Ki, D.; Kim, J.H. Measuring the Built Environment with Google Street View and Machine Learning: Consequences for Crime on Street Segments. J. Quant. Criminol. 2022, 38, 537–565. [Google Scholar] [CrossRef]
- He, L.; Páez, A.; Liu, D. Built environment and violent crime: An environmental audit approach using Google Street View. Comput. Environ. Urban Syst. 2017, 66, 83–95. [Google Scholar] [CrossRef]
- Troy, A.; Nunery, A.; Grove, J.M. The relationship between residential yard management and neighborhood crime: An analysis from Baltimore City and County. Landsc. Urban Plan. 2016, 147, 78–87. [Google Scholar] [CrossRef]
- Donovan, G.H.; Prestemon, J.P. The Effect of Trees on Crime in Portland, Oregon. Environ. Behav. 2012, 44, 3–30. [Google Scholar] [CrossRef]
- Jing, F.; Liu, L.; Zhou, S.; Song, J.; Wang, L.; Zhou, H.; Wang, Y.; Ma, R. Assessing the Impact of Street-View Greenery on Fear of Neighborhood Crime in Guangzhou, China. Int. J. Environ. Res. Public Health 2021, 18, 311. [Google Scholar] [CrossRef]
- Locke, D.H.; Han, S.; Kondo, M.C.; Murphy-Dunning, C.; Cox, M. Did community greening reduce crime? Evidence from New Haven, CT, 1996–2007. Landsc. Urban Plan. 2017, 161, 72–79. [Google Scholar] [CrossRef]
- Zhou, H.; Liu, L.; Lan, M.; Zhu, W.; Song, G.; Jing, F.; Zhong, Y.; Su, Z.; Gu, X. Using Google Street View imagery to capture micro built environment characteristics in drug places, compared with street robbery. Comput. Environ. Urban Syst. 2021, 88, 101631. [Google Scholar] [CrossRef]
- Dakin, K.; Xie, W.; Parkinson, S.; Khan, S.; Monchuk, L.; Pease, K. Built environment attributes and crime: An automated machine learning approach. Crime Sci. 2020, 9, 12. [Google Scholar] [CrossRef]
- Liu, Y.; Chen, M.; Wang, M.; Huang, J.; Thomas, F.; Rahimi, K.; Mamouei, M. An interpretable machine learning framework for measuring urban perceptions from panoramic street view images. iScience 2023, 26, 106132. [Google Scholar] [CrossRef]
- Liu, K.; Zhang, L.; Tsou, S.; Wang, L.; Hu, Y.; Yang, K. Exploring the Complex Association Between Urban Built Environment, Sociodemographic Characteristics and Crime: Evidence from Washington, D.C. Land 2024, 13, 1886. [Google Scholar] [CrossRef]
- Ratcliffe, J.H. Geocoding crime and a first estimate of a minimum acceptable hit rate. Int. J. Geogr. Inf. Sci. 2004, 18, 61–72. [Google Scholar] [CrossRef]
- Rosser, G.; Davies, T.; Bowers, K.J.; Johnson, S.D.; Cheng, T. Predictive Crime Mapping: Arbitrary Grids or Street Networks? J. Quant. Criminol. 2017, 33, 569–594. [Google Scholar] [CrossRef] [PubMed]
- Groff, E.R. Informal Social Control and Crime Events. J. Contemp. Crim. Justice 2015, 31, 90–106. [Google Scholar] [CrossRef]
- Kurland, J.; Johnson, S.D.; Tilley, N. Offenses around Stadiums: A Natural Experiment on Crime Attraction and Generation. J. Res. Crime Delinq. 2014, 51, 5–28. [Google Scholar] [CrossRef]
- Long, D.; Liu, L.; Xu, M.; Feng, J.; Chen, J.; He, L. Ambient population and surveillance cameras: The guardianship role in street robbers’ crime location choice. Cities 2021, 115, 103223. [Google Scholar] [CrossRef]
- Song, G.; Liu, L.; Bernasco, W.; Xiao, L.; Zhou, S.; Liao, W. Testing Indicators of Risk Populations for Theft from the Person across Space and Time: The Significance of Mobility and Outdoor Activity. Ann. Am. Assoc. Geogr. 2018, 108, 1370–1388. [Google Scholar] [CrossRef]
- Kinney, J.B.; Brantingham, P.L.; Wuschke, K.; Kirk, M.G.; Brantingham, P.J. Crime Attractors, Generators and Detractors: Land Use and Urban Crime Opportunities. Built Environ. 2008, 34, 62–74. [Google Scholar] [CrossRef]
- Bernasco, W.; Block, R.; Ruiter, S. Go where the money is: Modeling street robbers’ location choices. J. Econ. Geogr. 2013, 13, 119–143. [Google Scholar] [CrossRef]
- Luo, L.; Deng, M.; Shi, Y.; Gao, S.; Liu, B. Associating street crime incidences with geographical environment in space using a zero-inflated negative binomial regression model. Cities 2022, 129, 103834. [Google Scholar] [CrossRef]
- Yue, H.; Xie, H.; Liu, L.; Chen, J. Detecting People on the Street and the Streetscape Physical Environment from Baidu Street View Images and Their Effects on Community-Level Street Crime in a Chinese City. ISPRS Int. J. Geo-Inf. 2022, 11, 151. [Google Scholar] [CrossRef]
- Xie, H.; Liu, L.; Yue, H. Modeling the Effect of Streetscape Environment on Crime Using Street View Images and Interpretable Machine-Learning Technique. Int. J. Environ. Res. Public Health 2022, 19, 13833. [Google Scholar] [CrossRef]
- Zhang, W.; Witharana, C.; Li, W.; Zhang, C.; Li, X.; Parent, J. Using Deep Learning to Identify Utility Poles with Crossarms and Estimate Their Locations from Google Street View Images. Sensors 2018, 18, 2484. [Google Scholar] [CrossRef]
- Hou, X.; Chen, P.; Gu, H. LM-DeeplabV3+: A Lightweight Image Segmentation Algorithm Based on Multi-Scale Feature Interaction. Appl. Sci. 2024, 14, 1558. [Google Scholar] [CrossRef]
- Jocher, G.; Chaurasia, A.; Stoken, A.; Borovec, J.; Kwon, Y.; Michael, K.; TaoXie; Fang, J.; Imyhxy; Lorna; et al. Ultralytics/yolov5: V7.0—YOLOv5 SOTA Realtime Instance Segmentation (Version v7.0) [Computer software]. Zenodo 2022. [Google Scholar] [CrossRef]
- Cordts, M.; Omran, M.; Ramos, S.; Rehfeld, T.; Enzweiler, M.; Benenson, R.; Franke, U.; Roth, S.; Schiele, B. The Cityscapes Dataset for Semantic Urban Scene Understanding. arXiv 2016, arXiv:1604.01685. [Google Scholar] [CrossRef]
- Wang, R.; Ren, S.; Zhang, J.; Yao, Y.; Wang, Y.; Guan, Q. A comparison of two deep-learning-based urban perception models: Which one is better? Comput. Urban Sci. 2021, 1, 3. [Google Scholar] [CrossRef]
- Simonyan, K.; Zisserman, A. Very deep convolutional networks for large-scale image recognition. arXiv 2014, arXiv:1409.1556. [Google Scholar]
- Ordonez, V.; Berg, T.L. Learning High-Level Judgments of Urban Perception. In Computer Vision—ECCV 2014, 13th European Conference, Zurich, Switzerland, 6–12 September 2014, Proceedings, Part VI; Fleet, D., Pajdla, T., Schiele, B., Tuytelaars, T., Eds.; Springer International Publishing: Cham, Switzerland, 2014; pp. 494–510. [Google Scholar]
- Porzi, L.; Rota Bulò, S.; Lepri, B.; Ricci, E. Predicting and Understanding Urban Perception with Convolutional Neural Networks. In Proceedings of the 23rd ACM International Conference on Multimedia, Brisbane, Australia, 26–30 October 2015; pp. 139–148. [Google Scholar] [CrossRef]
- Zhang, Y.; You, Y.; Zhu, C.; Guo, H. Spatial Matching Relationship Between Criminal Activities and Fear of Crime and Its Influential Factors: A Case of Beijing. Geogr. Sci. 2022, 42, 1024–1033. [Google Scholar] [CrossRef]
- McFadden, D. Conditional Logit Analysis of Qualitative Choice Behavior. 1972. Available online: https://escholarship.org/uc/item/61s3q2xr (accessed on 18 October 2025).
- Lu, X.; Li, Q.; Ji, X.; Sun, D.; Meng, Y.; Yu, Y.; Lyu, M. Impact of streetscape built environment characteristics on human perceptions using street view imagery and deep learning: A case study of Changbai Island, Shenyang. Buildings 2025, 15, 1524. [Google Scholar] [CrossRef]
- Hinkle, J.C.; Yang, S.-M. A New Look into Broken Windows: What Shapes Individuals’ Perceptions of Social Disorder? J. Crim. Justice 2014, 42, 26–35. [Google Scholar] [CrossRef]
- Lei, Y.; Zhou, H.; Xue, L.; Yuan, L.; Liu, Y.; Wang, M.; Wang, C. Evaluating and Comparing Human Perceptions of Streets in Two Megacities by Integrating Street-View Images, Deep Learning, and Space Syntax. Buildings 2024, 14, 1847. [Google Scholar] [CrossRef]
- Adachi, H.M.; Nakaya, T. Analysis of the risk of theft from vehicle crime in Kyoto, Japan using environmental indicators of streetscapes. Crime Sci. 2022, 11, 13. [Google Scholar] [CrossRef]
- Row, A.T.; Jacobs, J. The Death and Life of Great American Cities. Yale Law J. 1962, 71, 1597–1602. [Google Scholar] [CrossRef]
- Kuo, F.E.; Sullivan, W.C. Environment and Crime in the Inner City: Does Vegetation Reduce Crime? Environ. Behav. 2001, 33, 343–367. [Google Scholar] [CrossRef]
- Bowen, D.A.; Anthony, K.M.; Sumner, S.A. Business and property types experiencing excess violent crime: A micro-spatial analysis. J. Inj. Violence Res. 2022, 14, 1–10. Available online: https://jivresearch.org/jivr/index.php/jivr/article/view/1566 (accessed on 18 October 2025). [PubMed]


Disclaimer/Publisher’s Note: The statements, opinions and data contained in all publications are solely those of the individual author(s) and contributor(s) and not of MDPI and/or the editor(s). MDPI and/or the editor(s) disclaim responsibility for any injury to people or property resulting from any ideas, methods, instructions or products referred to in the content. |
© 2025 by the authors. Published by MDPI on behalf of the International Society for Photogrammetry and Remote Sensing. Licensee MDPI, Basel, Switzerland. This article is an open access article distributed under the terms and conditions of the Creative Commons Attribution (CC BY) license.