An Analysis of the Spatiotemporal Evolution, Key Control Features, and Driving Mechanisms of Carbon Source/Sink in the Continental Ecosystem of China’s Shandong Province from 2001 to 2020
Abstract
1. Introduction
2. Materials and Methods
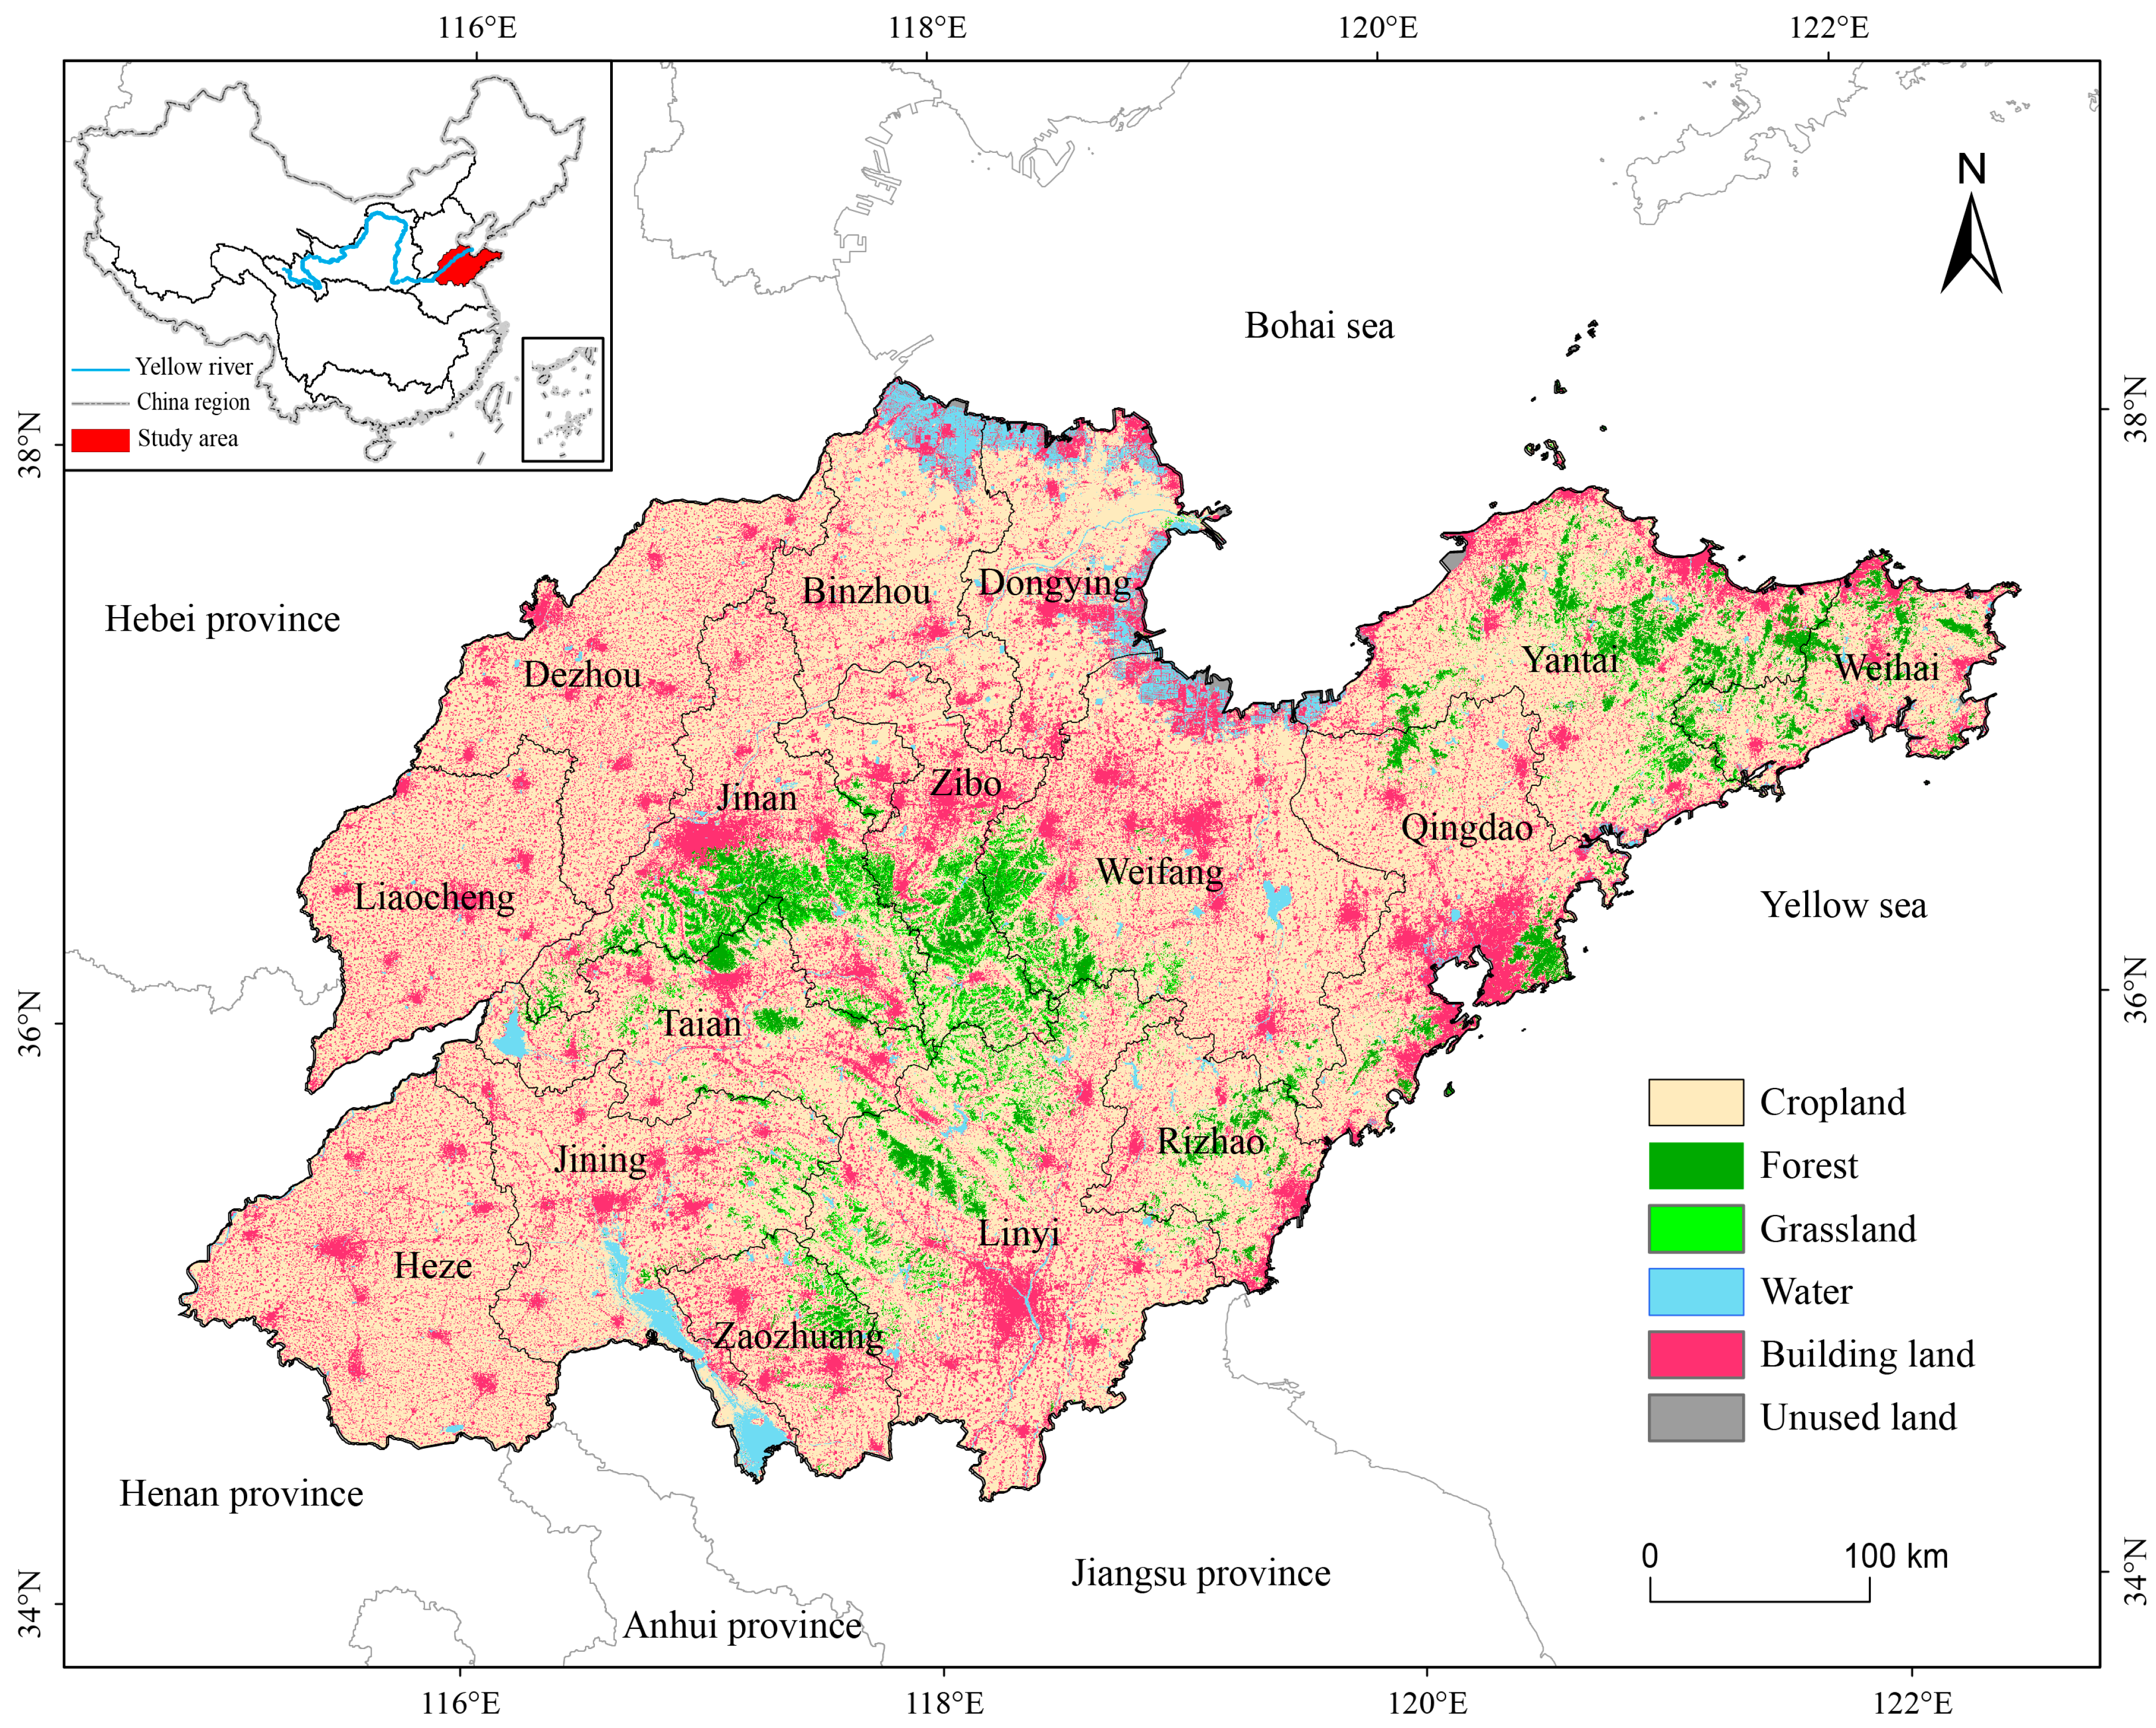
2.1. Study Area
2.2. Data Origins and Preparation
- (1)
- Land utilization data: exhibiting a spatial detail of 1 km × 1 km.
- (2)
- Atmospheric data: temperature, precipitation, potential evapotranspiration, and sunshine duration exhibiting a spatial accuracy of 1 km × 1 km; atmospheric CO2 concentration data with a spatial resolution of 2° × 2.5°, stored in NC format and converted to raster format using MATLAB2016 software.
- (3)
- Socioeconomic data: population density and GDP data at a spatial scale of 1 km × 1 km; nighttime lighting data are composed of DMSP-OLS data (2000–2013) and VIIRS (2014–2020), together with spatial resolutions, respectively, is 2.7 km and 742 m.
- (4)
- Topographic data: exhibiting a spatial detail of 30 m.
- (5)
- Satellite imagery data: NDVI data were gathered from the MOD13Q product, exhibiting a spatial accuracy of 250 m. After format conversion and reprojection, the year-by-year NDVI data were obtained using the Maximum Synthesis Method (MVC), and the vegetation cover (FVC) was calculated by using the Image Element Dichotomous Model (IEDM). The GPP and NPP data came from the GPP, and the NPP data were obtained from the MOD17A3HGF product (source ibid.), exhibiting a spatial accuracy of 500 m × 500 m.
2.3. Research Techniques
2.3.1. Carbon Source and Sink Indicator Simulation
- (1)
- (2)
- Ra represents the amount of carbon consumed by the plant during its own respiration, and its value is the result of the subtraction of NPP from GPP:
- (3)
- Rs represents the total ecosystem respiration, and its value is the sum of Ra and Rh:
- (4)
- NEP simulation.
2.3.2. Sen Trend Analysis + MK Test
2.3.3. Carbon Source/Sink Master Characterization Model
- (1)
- Model setting.
- (2)
- Identification of regional master control indicators.
2.3.4. Analysis of Carbon Source/Sink Driving Mechanisms Based on Cloud Modeling
- (1)
- Construction of cloud model for carbon source/sink distribution.
- (2)
- Cloud model of driving factor weights.
3. Results
3.1. Spatiotemporal Evolution Trend of Carbon Source/Sink in Continental Ecosystems of Shandong Province
3.2. Dominant Control Patterns of Carbon Source/Sink in Continental Ecosystems of Shandong Province
3.3. Spatial Heterogeneity of Carbon Fluxes Driving Factors in the Continental Ecosystems of Shandong Province
3.3.1. Spatial Variation of Carbon Source/Sink Driving Factors at the Provincial Scale
- (1)
- Dominant Driving Factors
- (2)
- Ex, En, and He of Driving Factor Weights
3.3.2. Spatial Variation of Carbon Source/Sink Driving Factors at the Urban Scale
- (1)
- Dominant Driving Factors
- (2)
- Ex, En, and He of Driving Factor Weights
4. Discussion
4.1. Ramifications of Landscape Conversion on Carbon Release and Sequestration Variations in Shandong Province
4.2. Impact of the Dominant Drivers of Carbon Source/Sink Dynamics on Urban Ecological Security in Shandong Province
4.3. Research Gaps and Prospects
5. Conclusions
- (1)
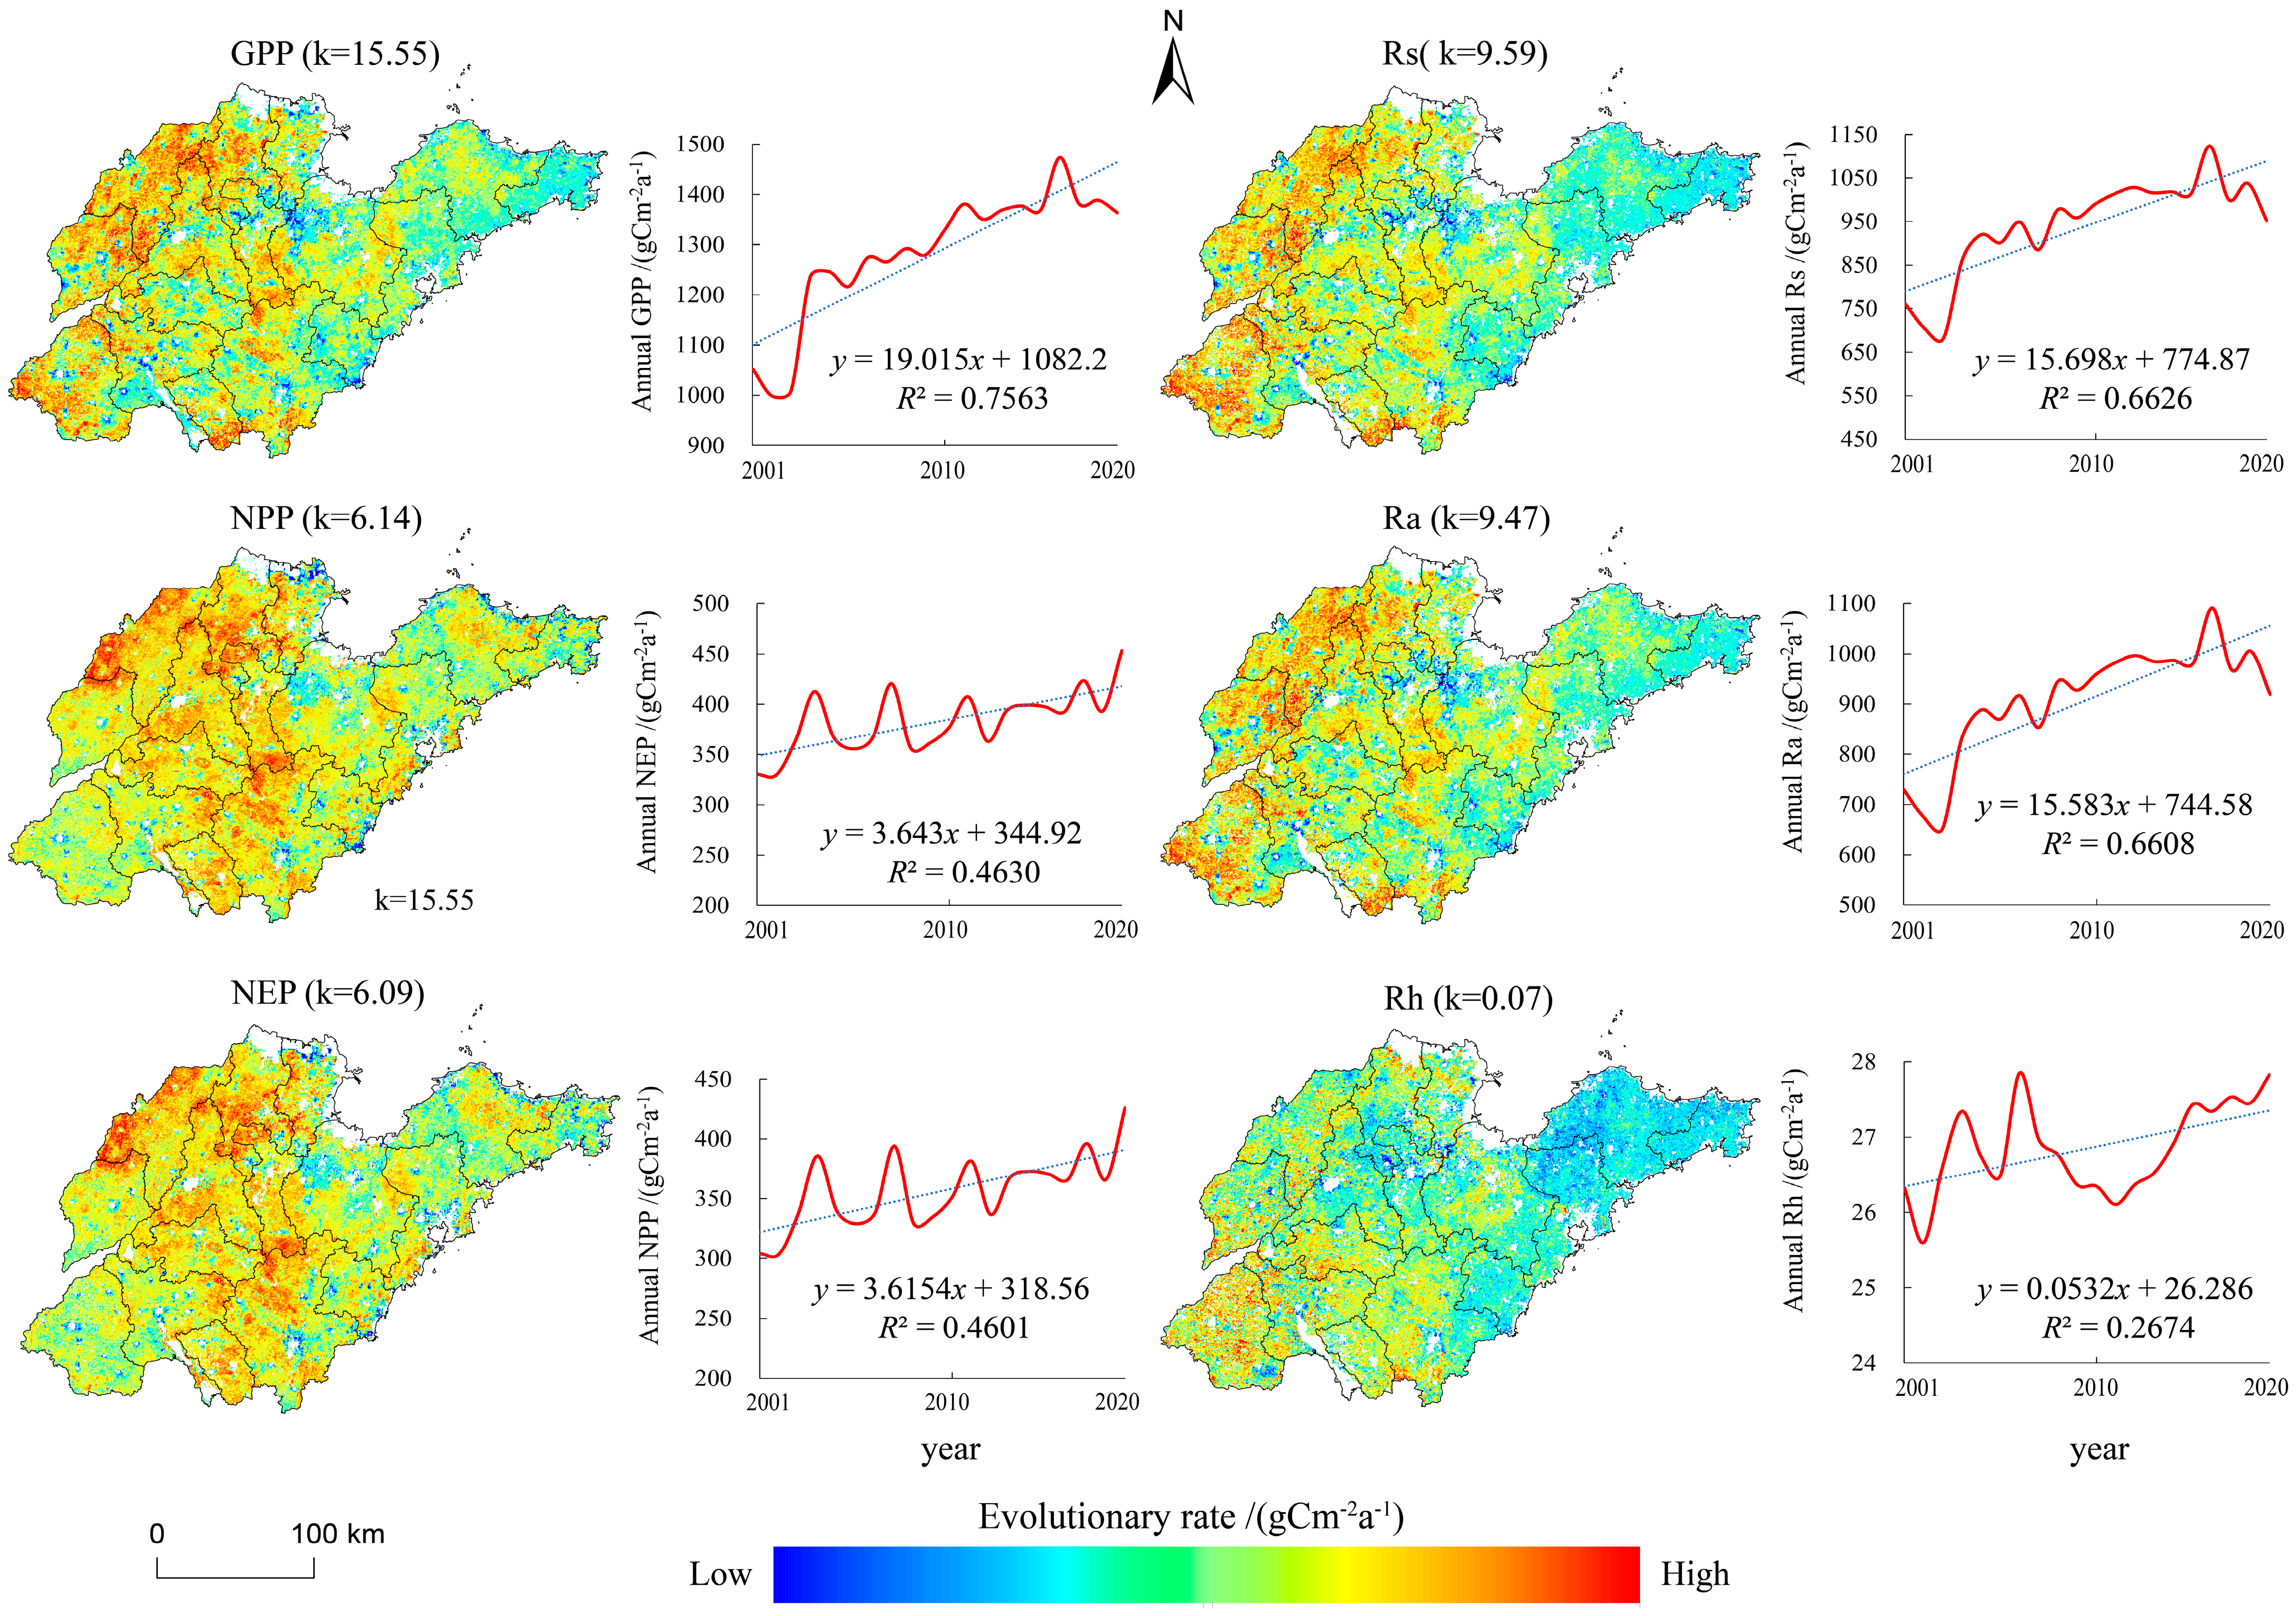
- From 2001 to 2020, carbon sources and carbon sinks in Shandong Province showed a fluctuating upward trend. The values decreased from the southwest to the northeast. In terms of spatial variation, it manifests as “significant increases in most areas, with scattered occurrences in the remaining areas.” The growth rates of GPP, NEP, and NPP were 15.55, 6.14, and 6.09 gCm−2a−1, respectively, while the growth rates of Rs, Ra, and Rh were 9.59, 9.47, and 0.07 gCm−2a−1, respectively. Due to significant respiratory activities, the overall terrestrial ecosystem in Shandong is characterized as a weak carbon sink.
- (2)
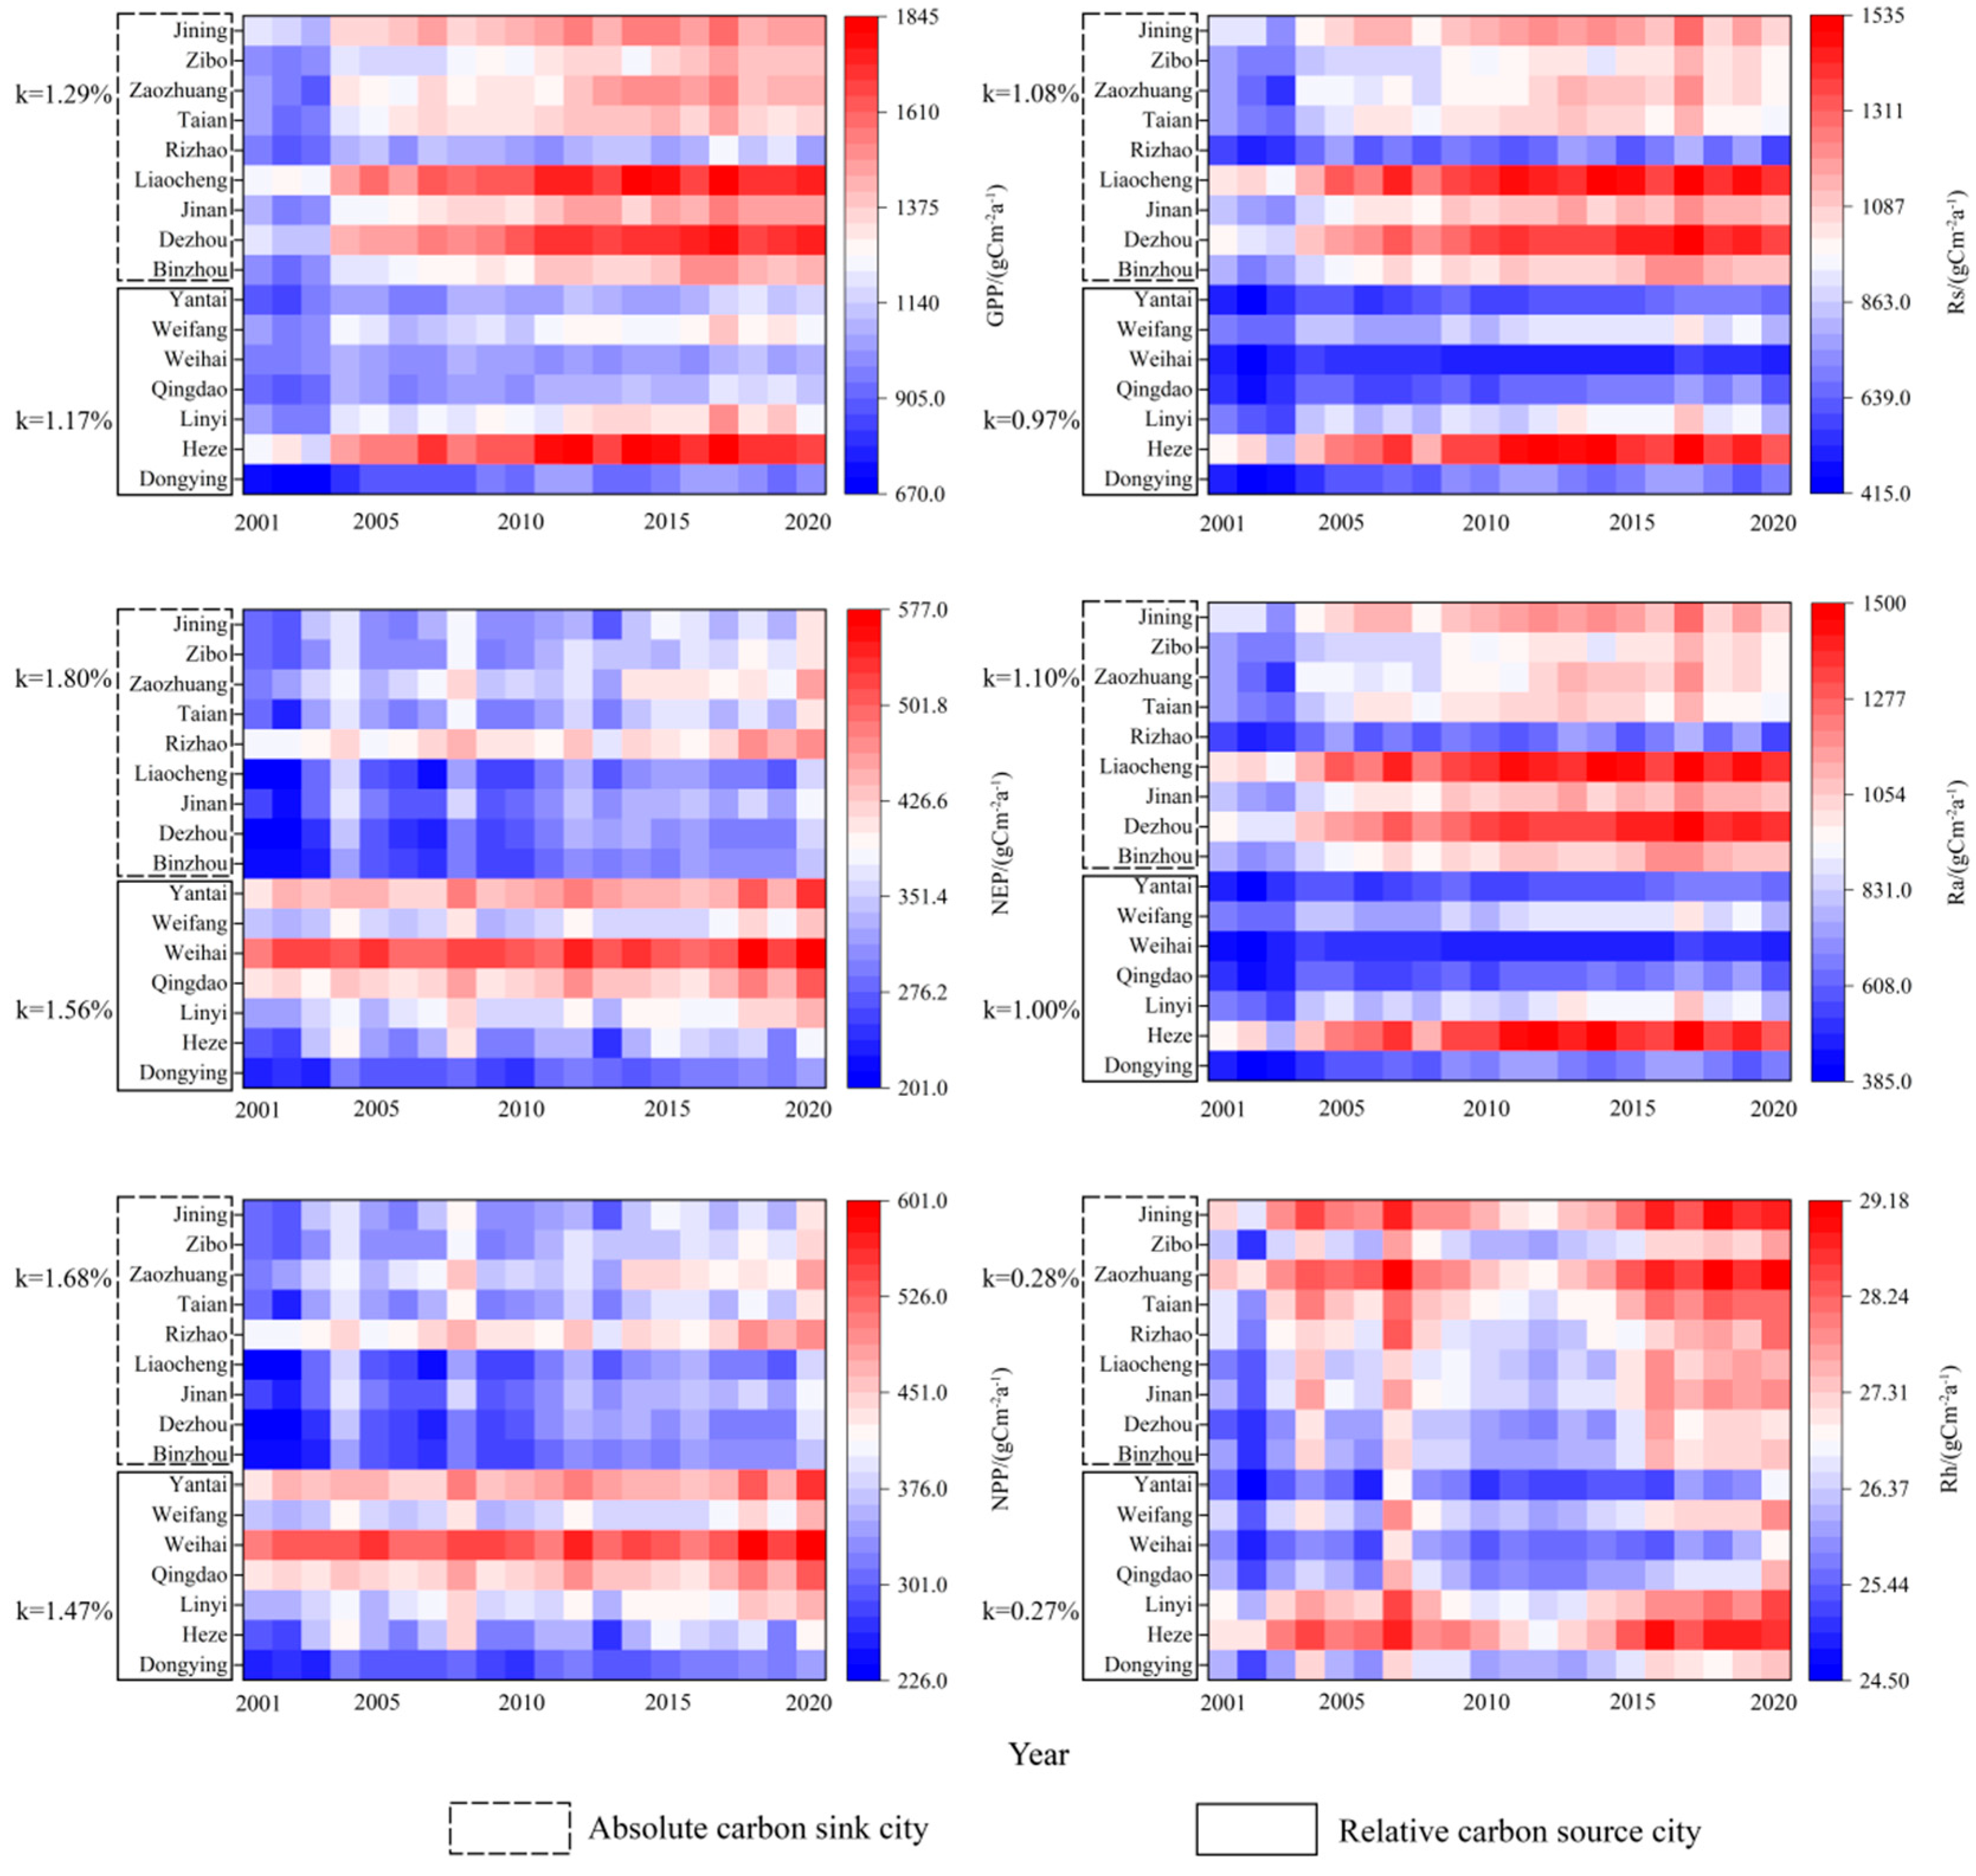
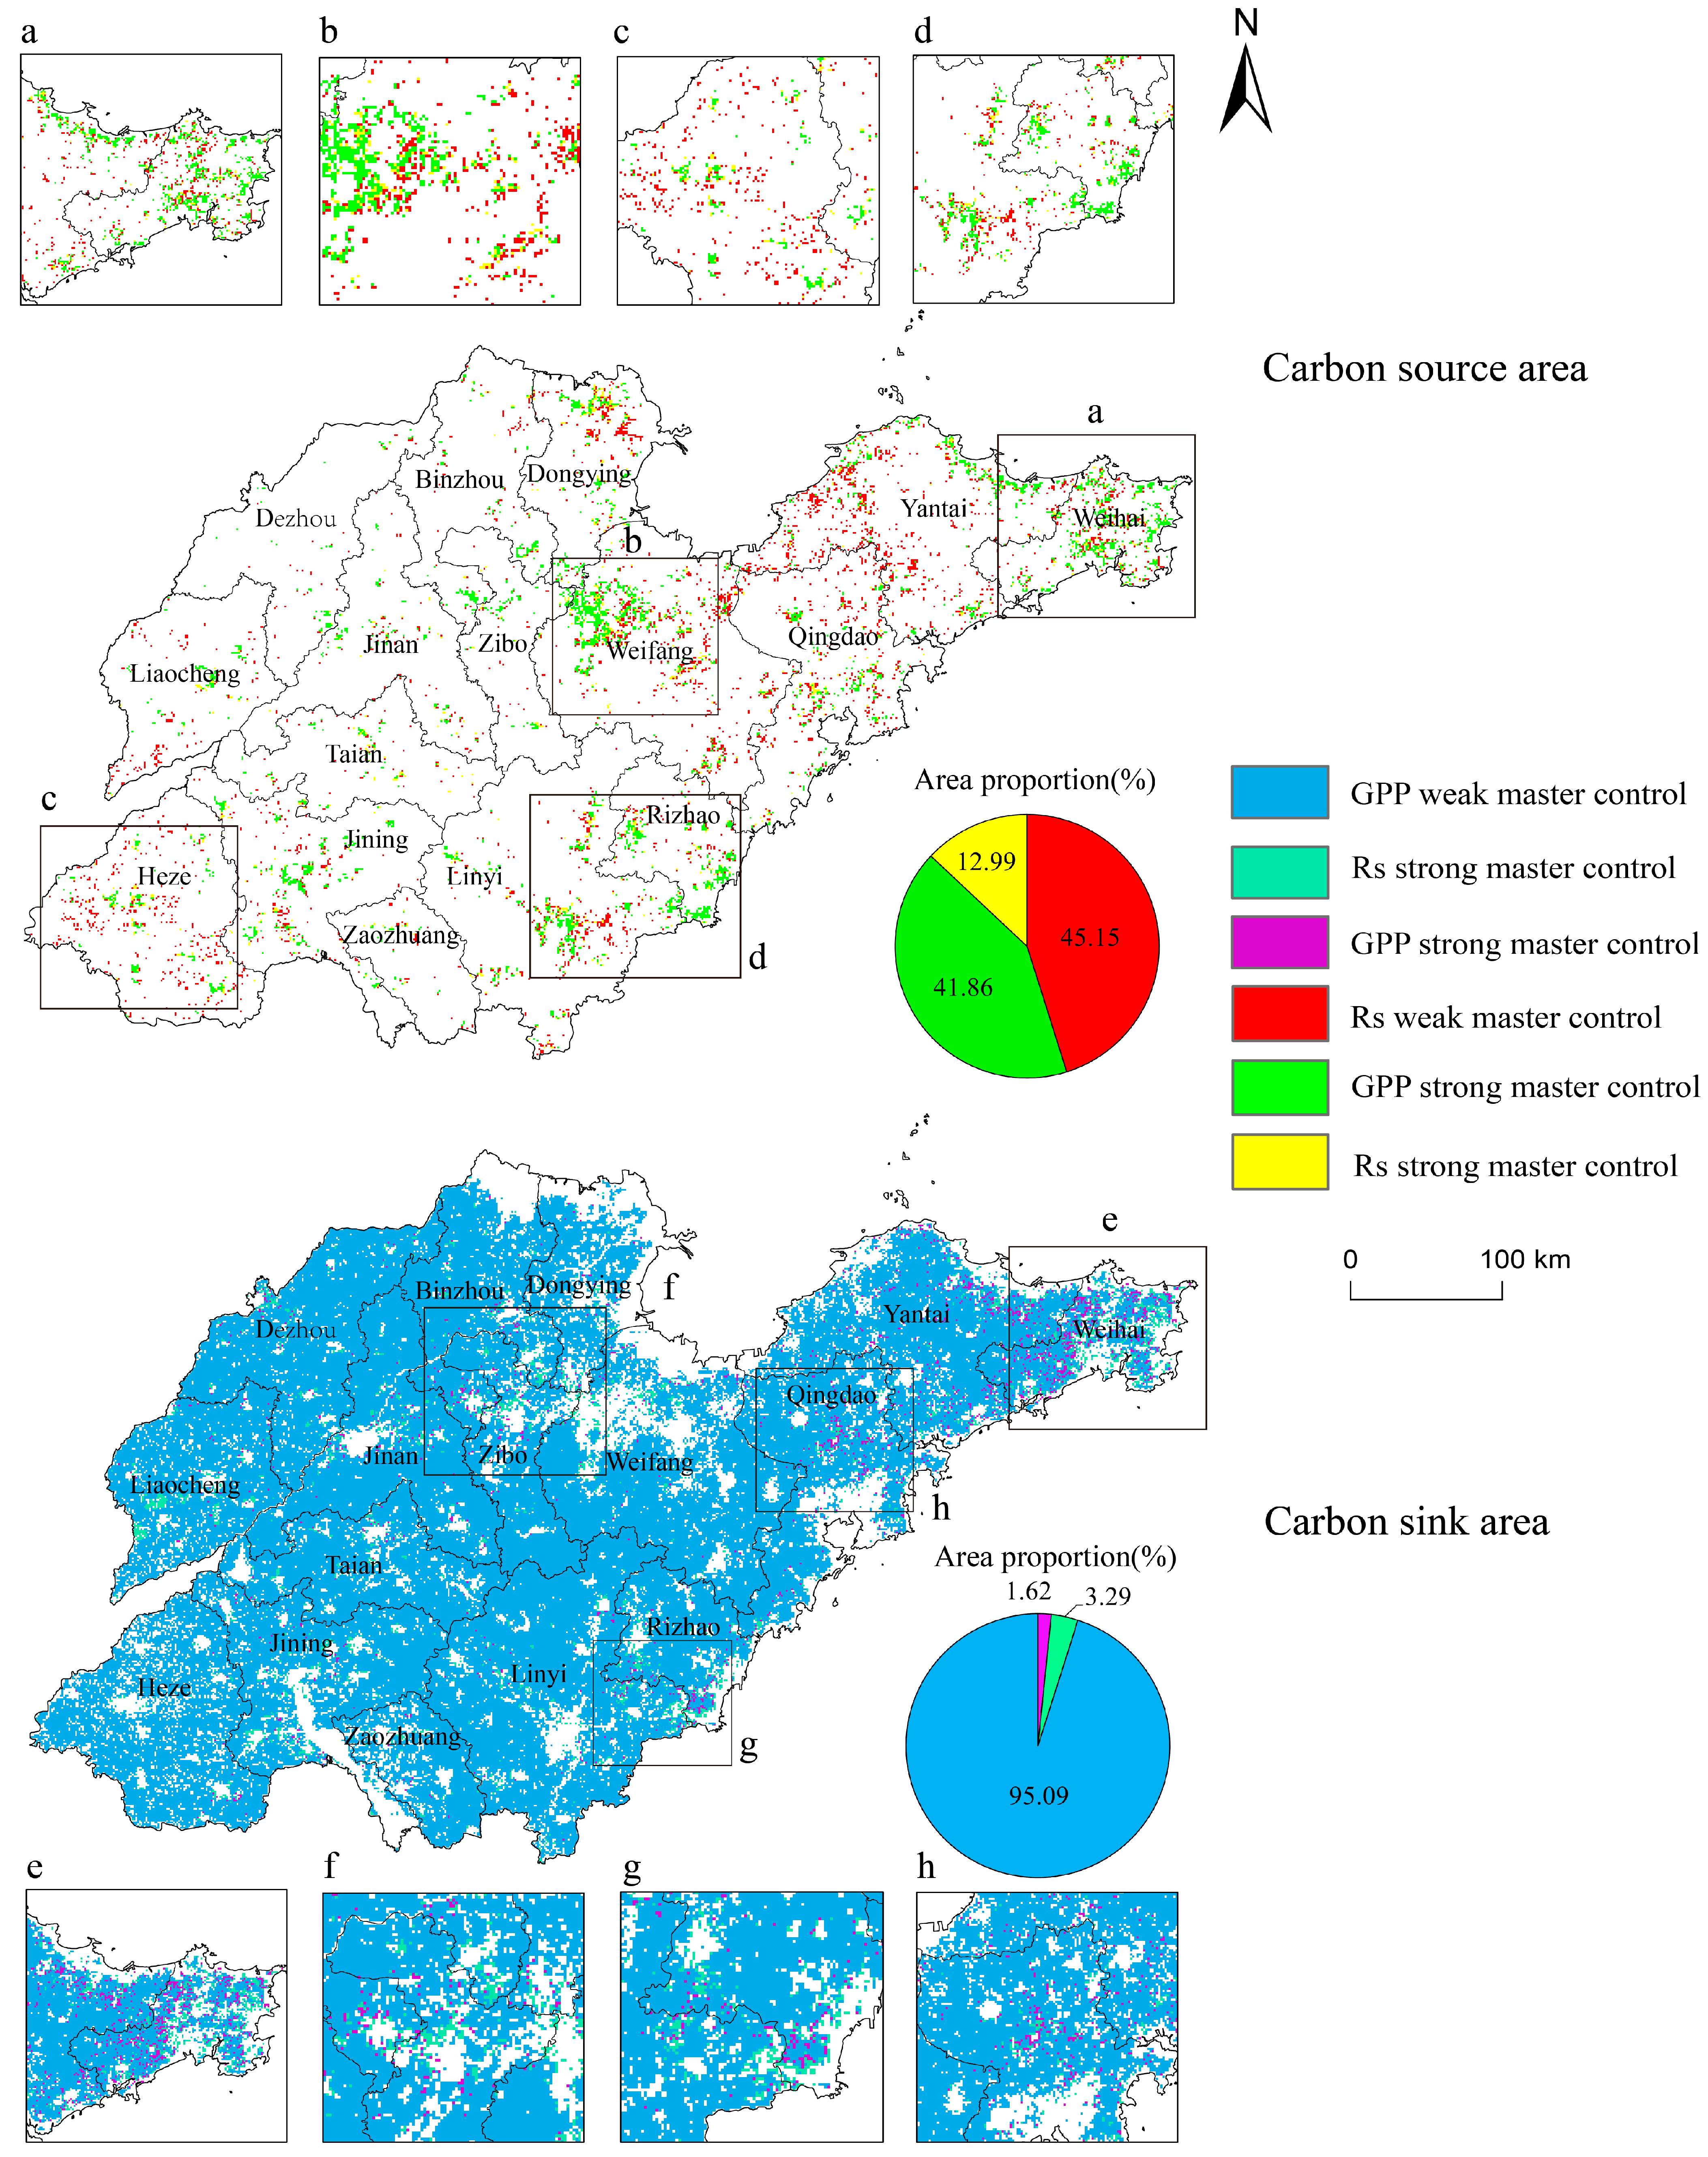
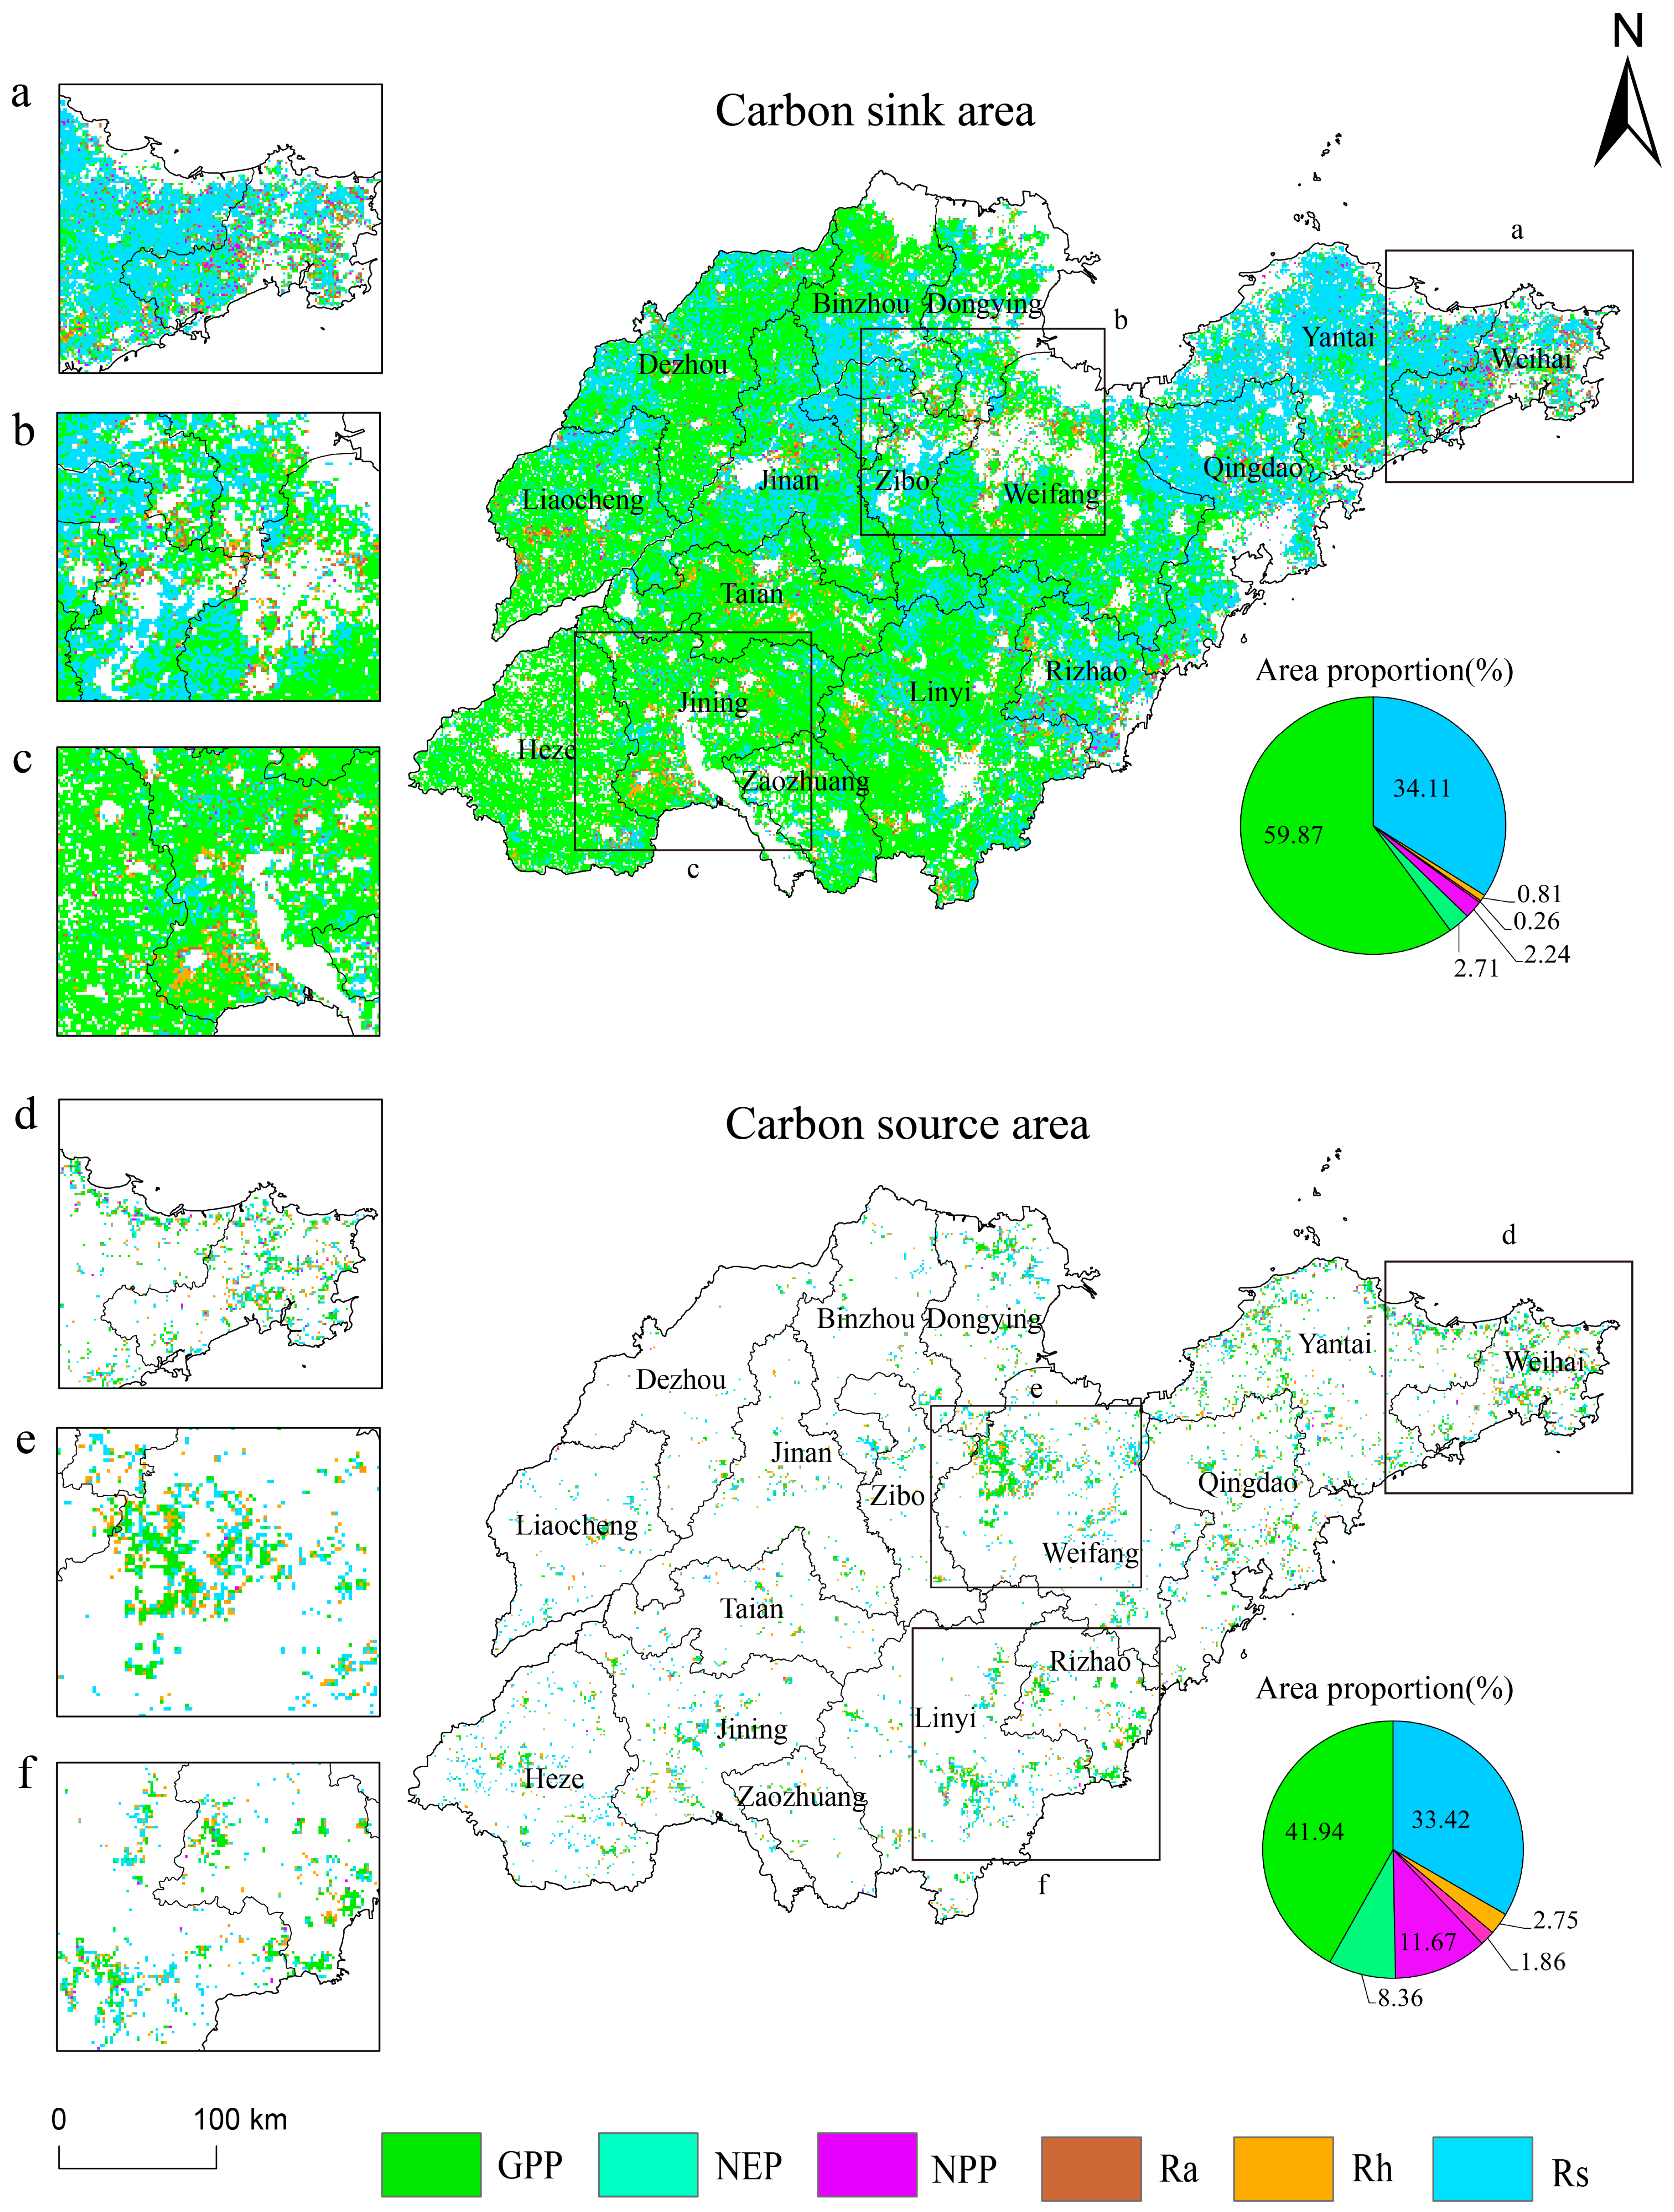
- The spatial dispersion of the dominant carbon source/sink characteristics in Shandong Province shows significant regional differentiation. It generally exhibits a distribution trend characterized by being a major carbon sink with some carbon sources. The province is mainly divided into absolute carbon sink cities (Jinan, Zibo, Rizhao, Jining, Liaocheng, Zaozhuang, Binzhou, Dezhou, and Tai’an) and relative carbon source cities (Weifang, Yantai, Weihai, Linyi, Qingdao, Heze, and Dongying). GPP is the dominant characteristic factor for carbon sink areas, widely distributed across the province, while Rs and GPP are the main driving factors for carbon source areas, concentrated along the eastern coast and southwestern inland.
- (3)
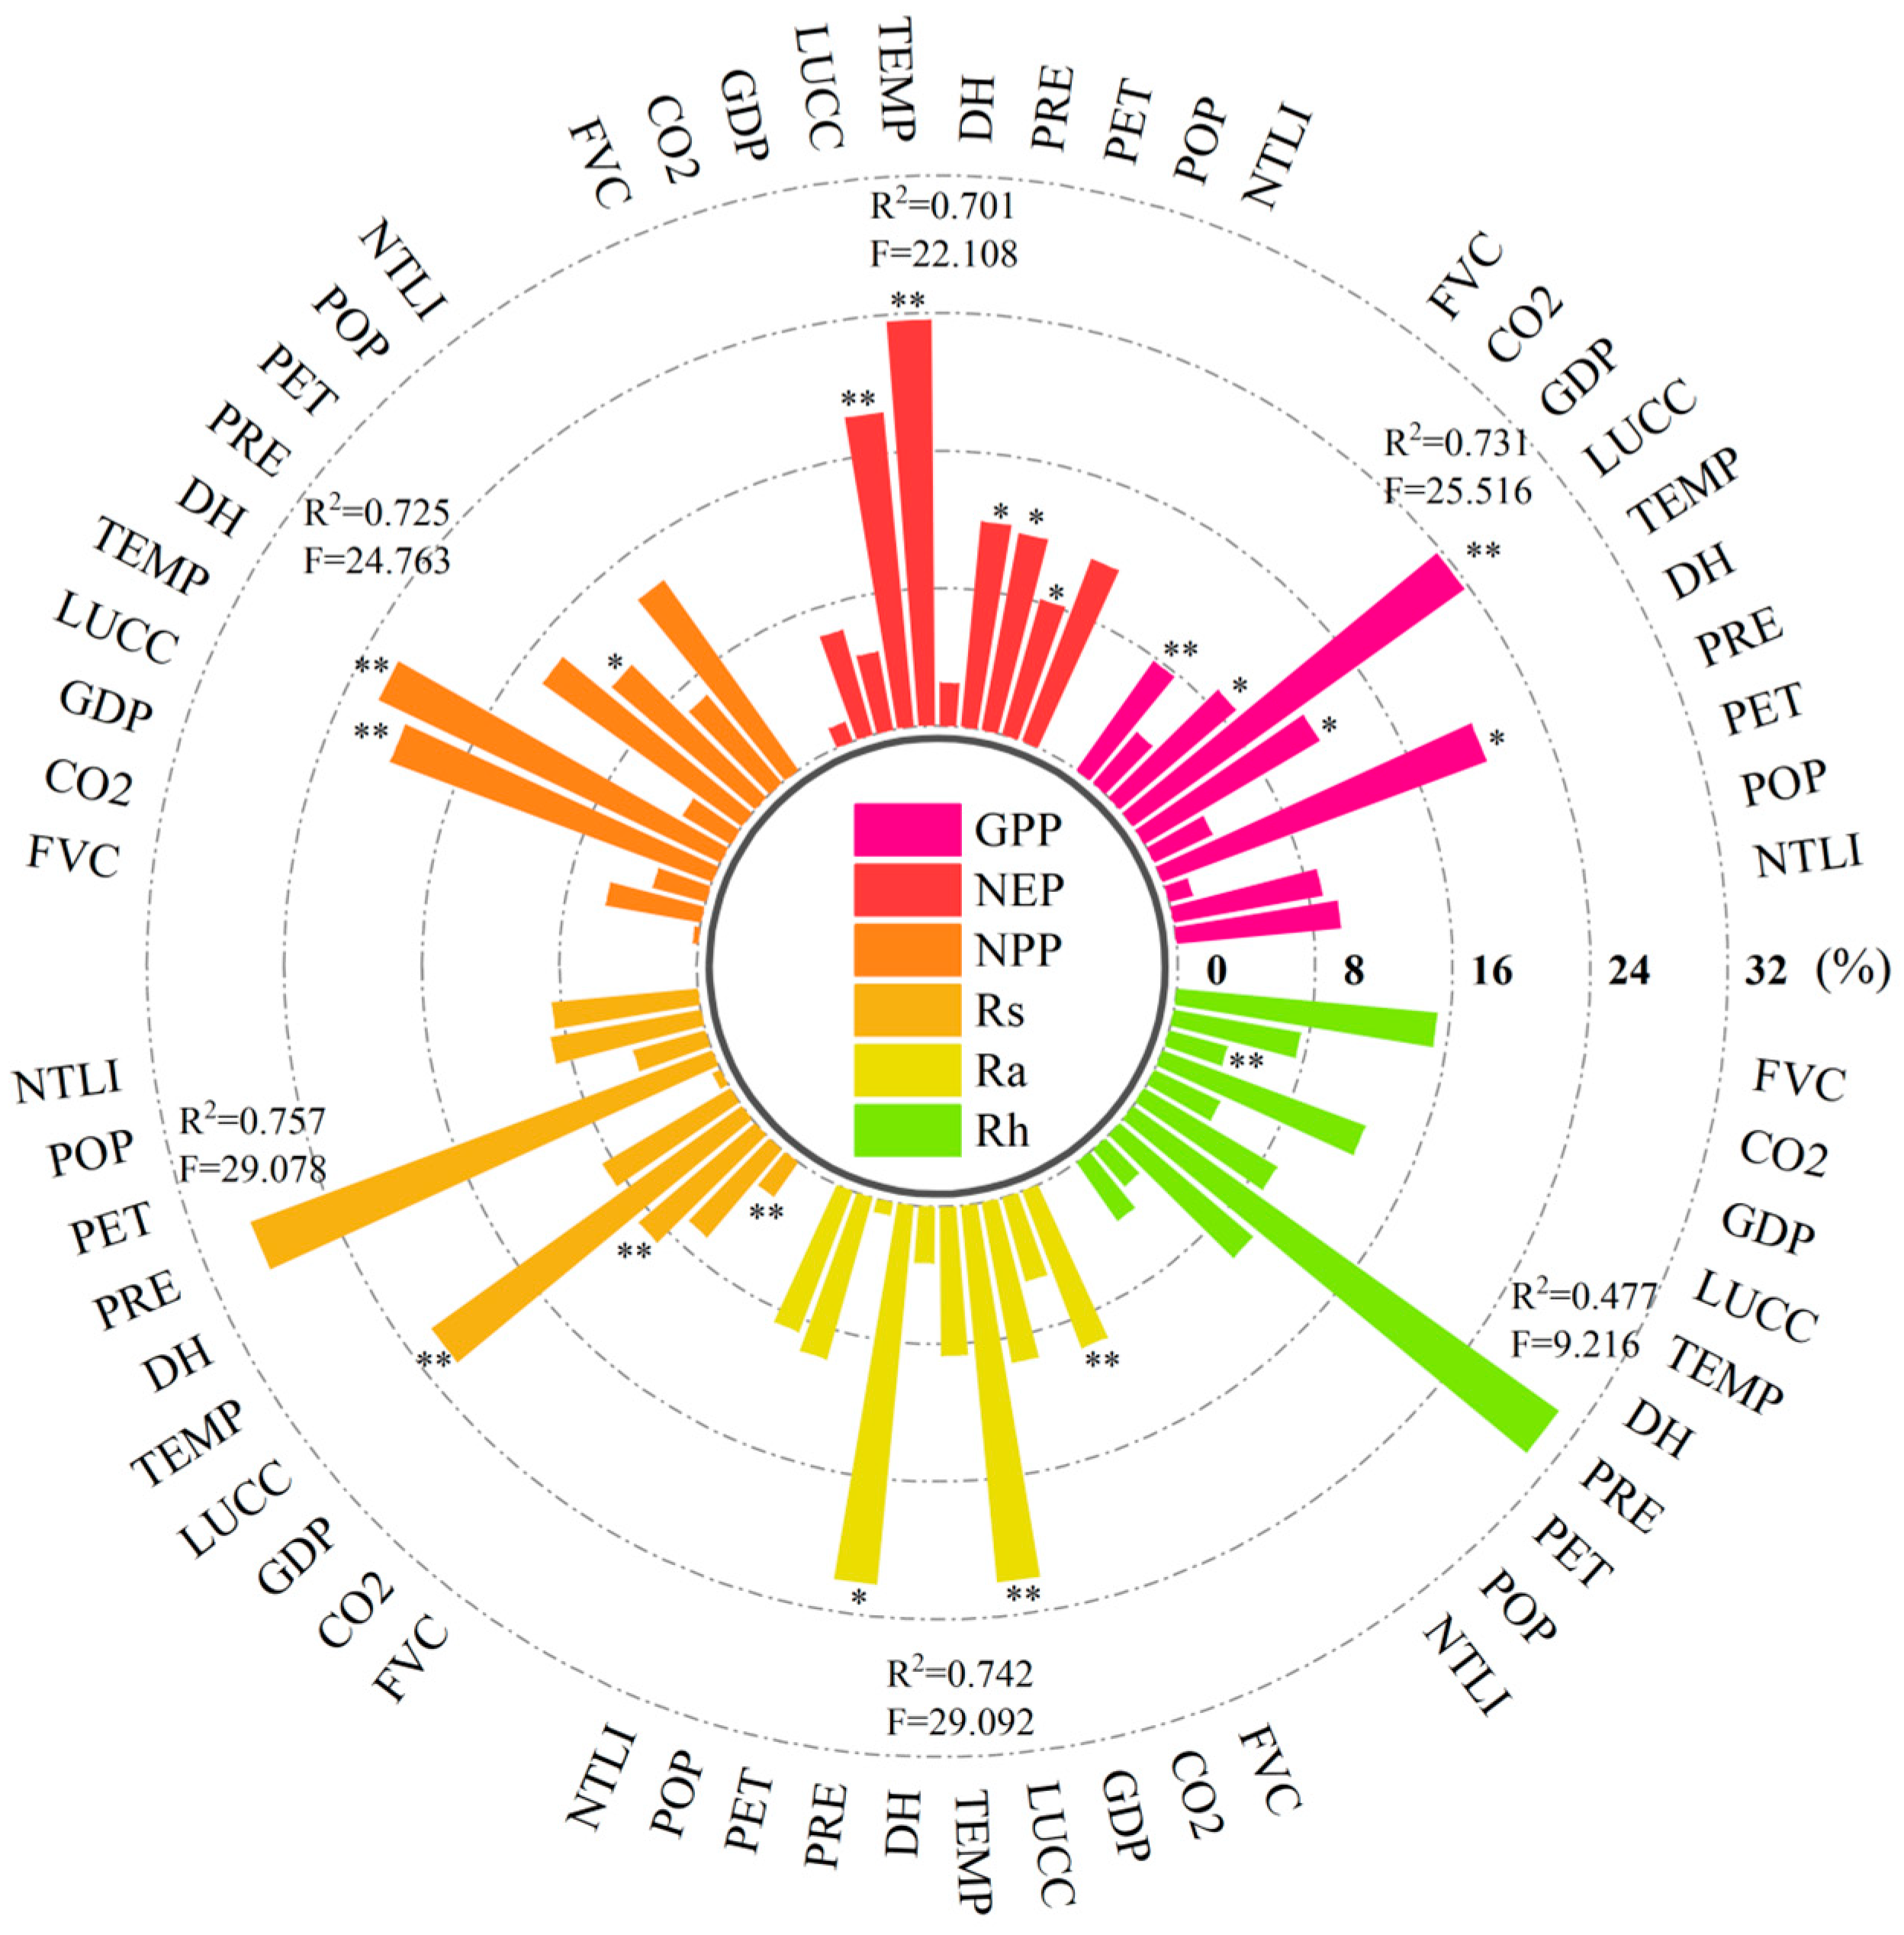
- Land-use modification is the key determinant driving changes in terrestrial ecosystem carbon sinks, with an average contribution rate of 21.90%. The variation in the driving force of land conversion shows the least spatial differentiation. Precipitation and land-use change are the main drivers influencing changes in carbon sources, with average contribution rates of 27.06% and 20.93%, respectively. Among these, the variation in the driving weight of land-use changes shows the smallest spatial differentiation.
- (4)
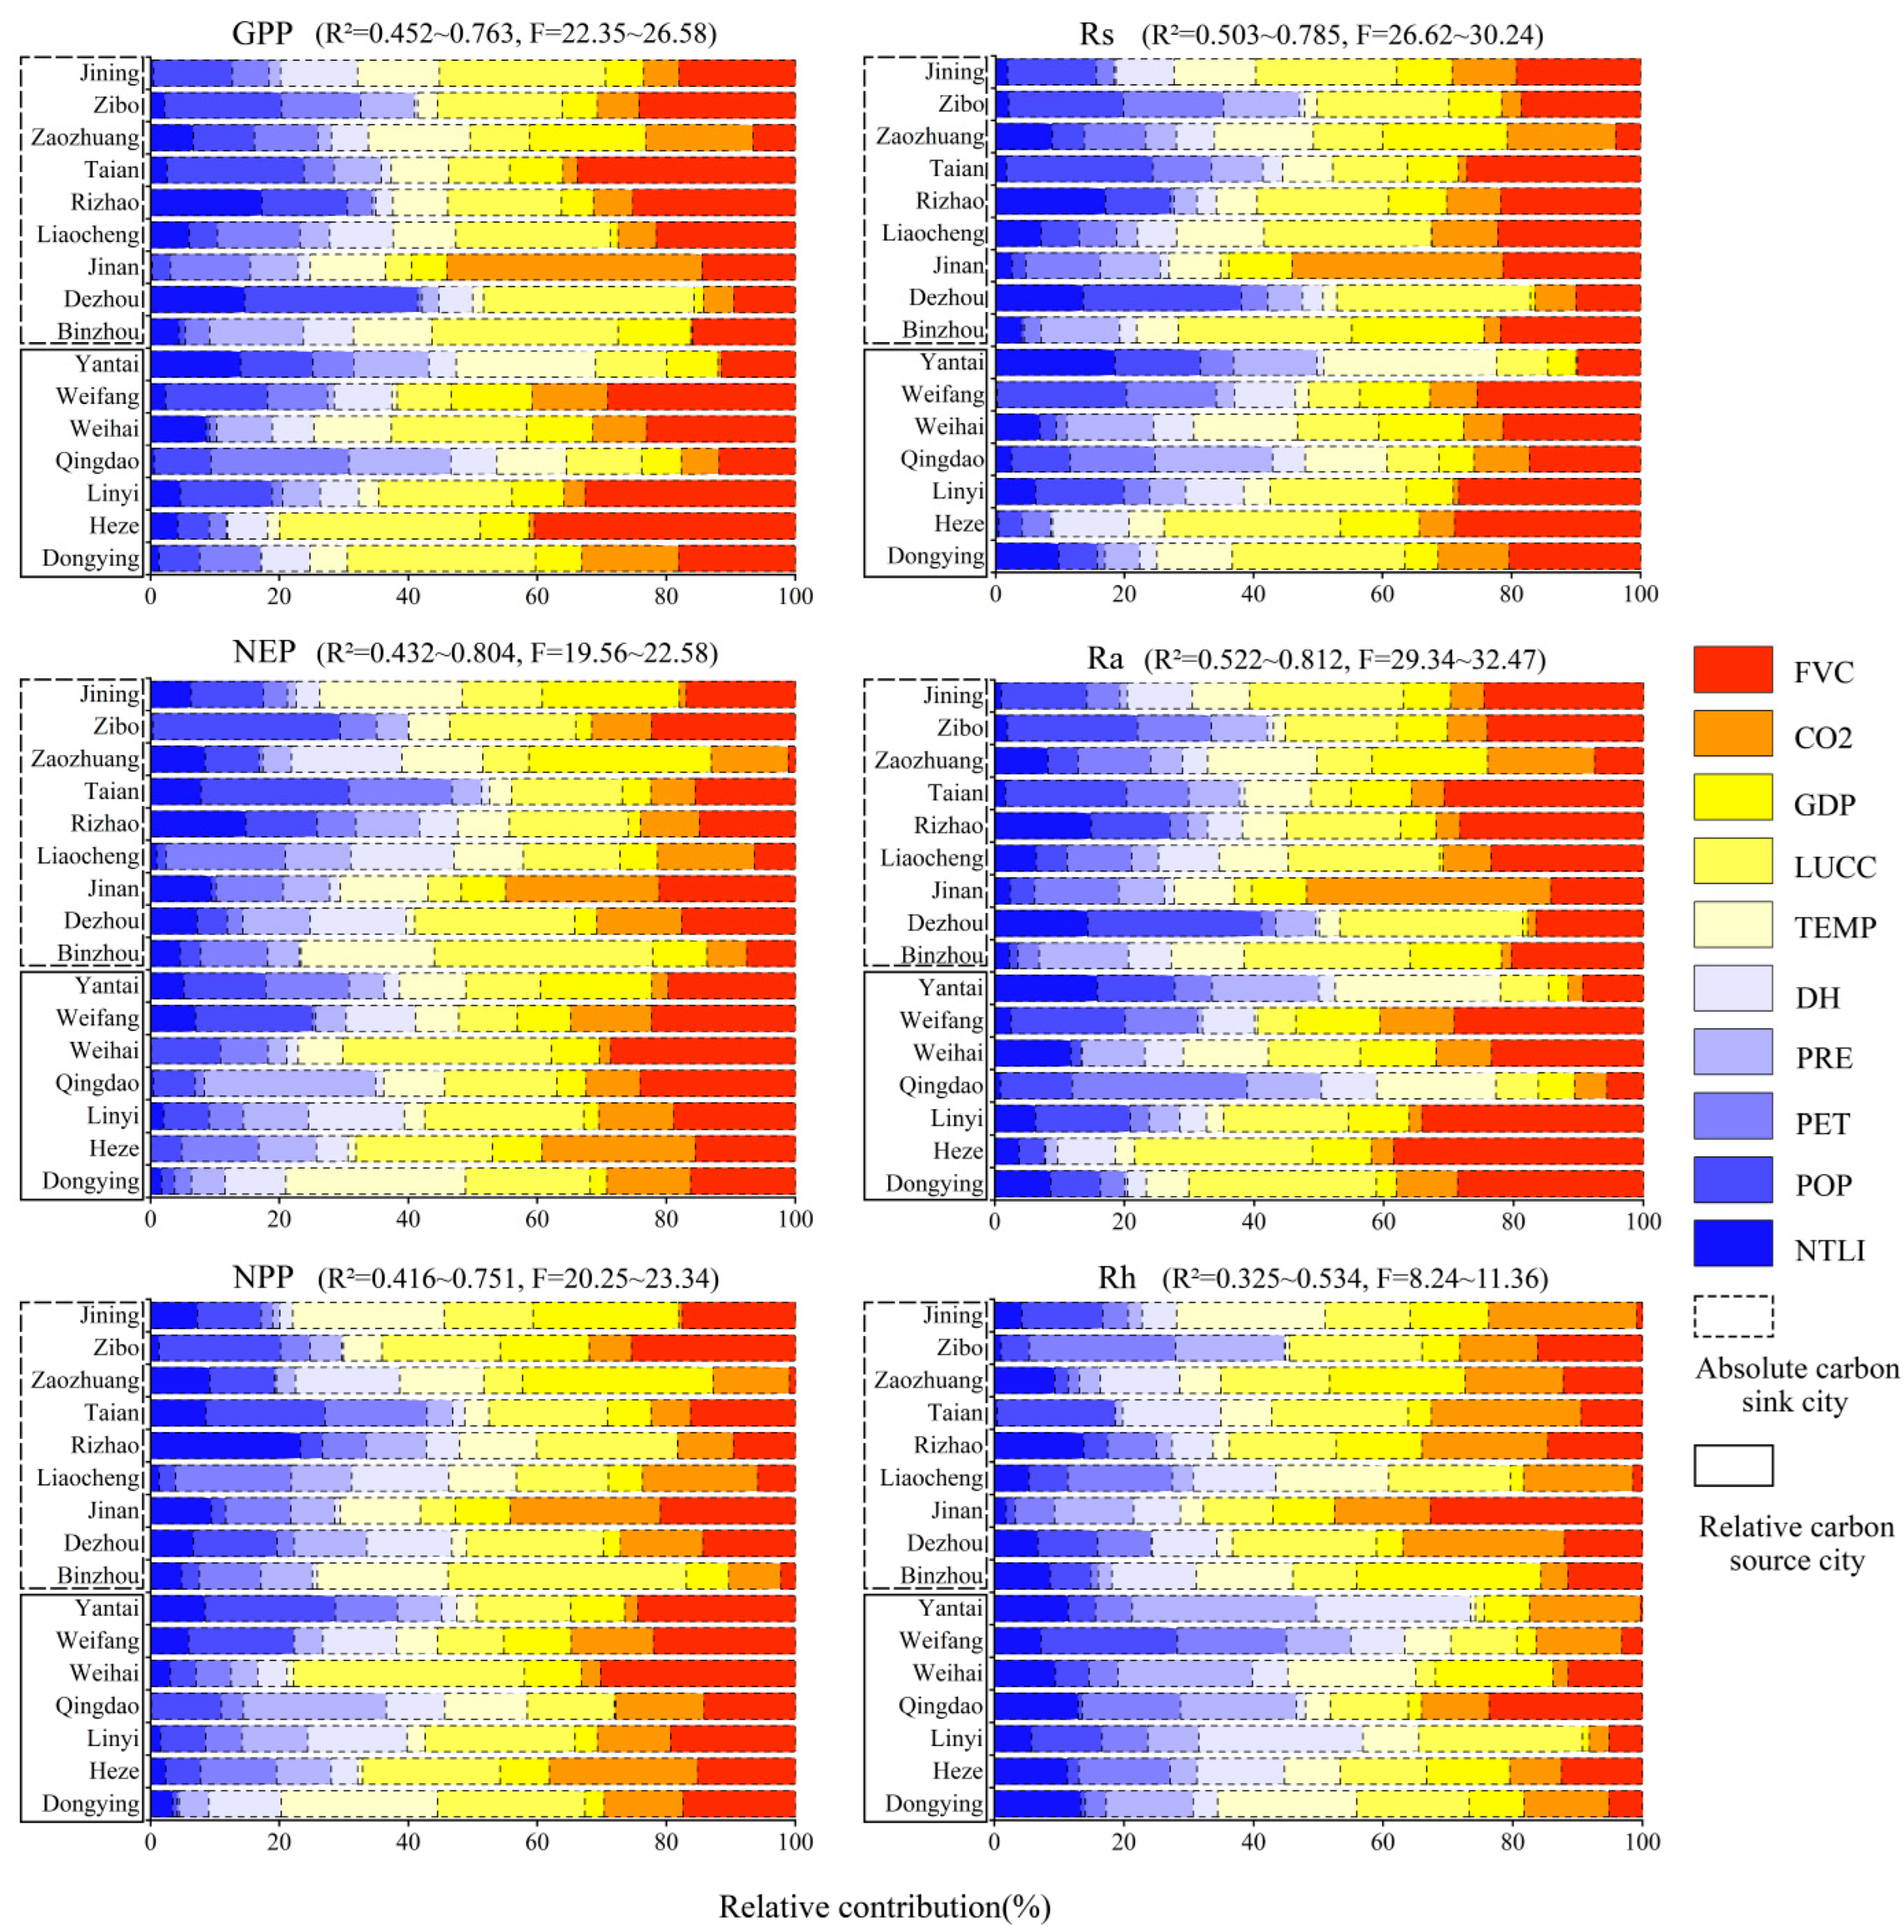
- The mechanisms underlying carbon source/sink changes vary significantly across cities. In absolute carbon sink cities, land-use changes and vegetation cover are the primary factors influencing carbon sinks; whereas in relative carbon source cities, vegetation cover and landscape changes have a more pronounced impact on carbon source variations. Particularly in absolute carbon sink cities, the scope and spatial variability of land-use changes are most pronounced, highlighting the influence of regional development disparities on carbon sinks.
Author Contributions
Funding
Data Availability Statement
Conflicts of Interest
Abbreviations
| GPP | Gross Primary Production |
| NPP | Net Primary Production |
| NEP | Net Ecosystem Productivity |
| Rs | Total Ecosystem Respiration |
| Ra | Autotrophic Respiration |
| Rh | Heterotrophic Respiration |
| Ex | Expectation |
| En | Entropy |
| He | Hypermetropy |
References
- Church, J.; Clark, P.; Cazenave, A.; Gregory, J.; Jevrejeva, S.; Levermann, A.; Merrifield, M.; Milne, G.; Nerem, R.; Nunn, P.; et al. Climate Change 2013: The Physical Science Basis. Contribution of Working Group I to the Fifth Assessment Report of the Intergovernmental Panel on Climate Change; Sea Level Change; Cambridge University Press: Cambridge, UK; New York, NY, USA, 2013; pp. 1138–1191. [Google Scholar]
- Schimel, D.; House, J.; Hibbard, K.; Bousquet, P.; Ciais, P.; Peylin, P.; Braswell, B.H.; Apps, M.J.; Baker, D.; Bondeau, A.; et al. Recent patterns and mechanisms of carbon exchange by terrestrial ecosystems. Nature 2001, 414, 169–172. [Google Scholar] [CrossRef]
- Piao, S.L.; Yue, C.; Ding, J.; Guo, Z. Perspectives on the role of terrestrial ecosystems in the “carbon neutrality” strategy. Sci. China Earth Sci. 2022, 65, 1178–1186. [Google Scholar] [CrossRef]
- Liu, K.; Zhang, H.; Kong, L.H.; Qiao, Y.J.; Hu, M.T. An overview of terrestrial ecosystem carbon sink assessment methods towards achieving carbon neutrality in China. Acta Ecol. Sin. 2023, 43, 4294–4307. [Google Scholar] [CrossRef]
- Houghton, R.A.; Hackler, J.; Lawrence, K.T. The U.S. carbon budget: Contributions from land- use change. Science 1999, 285, 574–578. [Google Scholar] [CrossRef]
- Kumar, J.I.N.; Patel, K.; Kumar, R.N. An assessment of carbon stock for various land use system in Aravally mountains, western India. Mitig. Adapt. Strateg. Glob. Change 2010, 15, 811–824. [Google Scholar] [CrossRef]
- Lu, W.K.; Li, M.; Cheng, J.X.; Dou, X.D. Spatio-temporal characteristics and applicability of carbon source/sink in Yunnan Province based on BEPS model. Acta Ecol. Sin. 2024, 44, 1441–1455. [Google Scholar]
- Tu, H.Y.; Jiapaer, G.; Yu, T.; Li, X.; Chen, B.J. Analysis of spatio-temporal variation characteristics and influencing factors of net primary productivity in terrestrial ecosystems of China. Acta Ecol. Sin. 2023, 43, 1219–1233. [Google Scholar]
- Zhao, N.; Zhou, L.; Zhuang, J.; Wang, Y.L.; Zhou, W.; Chen, J.J.; Song, J.; Ding, J.X.; Chi, Y.G. Integration analysis of the carbon sources and sinks in terrestrial ecosystems, China. Acta Ecol. Sin. 2021, 41, 7648–7658. [Google Scholar] [CrossRef]
- Chen, Z.; Yu, G.R.; Zhu, X.J.; Zhang, L.M.; Wang, Q.F. A dataset of carbon flux component of typical terrestrial ecosystems in Asian region (1990–2015). Sci. Data Bank 2021, 6, 123–130. [Google Scholar] [CrossRef]
- Hao, L.; Zhai, Y.G.; Qi, W.C.; Lan, Q.Q. Spatial-temporal Dynamics of Vegetation Carbon Sources/sinks in Inner Mongolia from 2001 to 2020 and Its Response to Climate Change. Ecol. Environ. 2023, 32, 825–834. [Google Scholar]
- Wang, F.; Cao, Y.Q.; Zhou, S.H.; Fan, S.B.; Jiang, X.M. Estimation of vegetation carbon sink in the Yellow River Basin ecological function area and analysis of its main meteorological elements. Acta Ecol. Sin. 2023, 43, 2501–2514. [Google Scholar] [CrossRef]
- Li, Y.Y.; Zhang, S. Spatio-temporal evolution of urban carbon emission intensity and spatiotemporal heterogeneity of influencing factors in China. China Environ. Sci. 2023, 43, 3244–3254. [Google Scholar]
- Zhan, S.Q.; Zhang, X.Y.; Chen, X.Y.; Zhou, Y.Z.; Long, L.L.; Xu, Y.F. Eeffects of landuse change on spatial and temporal patterns of carbon sources/sinks in Huainan mining area from 2000 to 2020. Bull. Soil. Water Conserv. 2023, 43, 310–319. [Google Scholar]
- Sharma, P.; Rai, S.C. Carbon sequestration with land-use cover change in a Himalayan watershed. Geoderma 2007, 139, 371–378. [Google Scholar] [CrossRef]
- Liu, Y.H.; Zhang, J.; Zhang, C.H.; Xiao, B.; Liu, L.; Cao, Y. Spatial and temporal variations of vegetation net primary productivity and its responses to climate change in Shandong Province from 2000 to 2015. Chin. J. Ecol. 2019, 38, 1464–1471. [Google Scholar]
- Xiao, L.; Zhao, X.G.; Xu, H.X. Dynamic changes and driving factors analysis of carbon source and carbon sink in Shandong province. J. Shaanxi Norm. Univ. (Nat. Sci. Ed.) 2013, 41, 82–87. [Google Scholar]
- Su, H.; Li, J.K.; Liu, K.; Chen, X.; Yang, Y.; Shao, Z.L. Relationship between net carbon sequestration change and cultivated land use benefit of cultivated land use in Shandong Province. Sci. Geogr. Sin. 2024, 44, 864–873. [Google Scholar]
- Department of Natural Resources of Shandong Province. Notice on Strengthening the Management of the Red Line of Ecological Protection. Available online: https://www.shanghai.gov.cn/202509bgtwj/20250508/6ec84d7ac84949e2bb471b967ac300d6.html (accessed on 6 January 2023).
- Pei, Z.Y.; Zhou, C.P.; Ouyang, H.; Yang, W.B. A carbon budget of alpine steppe area in the Tibetan Plateau. Geogr. Res. 2010, 29, 102–110. [Google Scholar]
- Wei, H.; Wu, L.H.; Yang, D.N.; Chen, D.; Xiong, L.S. Spatiotemporal dynamic characteristics and driving impact mechanisms of carbon sources and sinks in Chinese cropland ecosystem. Acta Ecol. Sin. 2025, 45, 7277–7296. [Google Scholar]
- Christopher, B.F.; Michael, J.B.; James, T.R.; Paul, F. Primary Production of the Biosphere: Integrating Terrestrial and Oceanic Components. Science 1998, 281, 237–240. [Google Scholar] [CrossRef]
- Jia, Y.Y.; Qi, X.X.; Huang, R.; Zhou, Y. Spatiotemporal variation and driving factors of vegetation coverage in Shanxi Province, China. Chin. J. Appl. Ecol. 2024, 35, 1073–1082. [Google Scholar]
- Li, D.Y.; Liu, C.Y. Study on the Universality of the Normal Cloud Model. Eng. Sci. 2004, 6, 28–34. [Google Scholar]
- Wang, Z.; Han, F.; Li, C.R.; Shen, W.X.; Yang, Z.J.; Li, K.; Yao, Q. Analysis of vertical differentiation of vegetation in Taishan World Heritage site based on cloud model. Sci. Rep. 2024, 14, 10948. [Google Scholar] [CrossRef]
- Mu, H.X.; Han, F.; Tang, X.M.; Wang, Z.Y.; Wang, Z. Comparison and analysis of timberline and treeline distribution height and influencing factors of Baima Snow Mountain and Bogda Mountain based on cloud model. Geogr. Res. 2023, 42, 1941–1956. [Google Scholar]
- Wang, Z.Y.; Han, F.; Li, C.R.; Li, K.; Mu, H.X.; Wang, Z. Distribution characteristics and geographical interpretation of the upper limit of montane deciduous broad-leaved forests in the eastern monsoon region of China. Acta Geogr. Sin. 2024, 79, 240–258. [Google Scholar]
- Elvidge, C.D.; Baugh, K.E.; Kihn, E.A.; Kroehl, H.W.; Davis, E.R.; Davis, C.W. Relation between satellite observed visible-near infrared emissions, population, economic activity and electric power consumption. Int. J. Remote Sens. 1997, 18, 1373–1379. [Google Scholar] [CrossRef]
- Du, H.B.; Yang, S.; Li, Z.Y.; Guo, Z.C.; Fan, Q.Y. Spatio-temporal Characteristics and Influencing Factors of Carbon Sources/Sinks in the Yangtze River Delta Under Carbon Neutrality Target. Environ. Sci. 2024, 45, 6848–6857. [Google Scholar]
- Zhang, X.Q.; Chen, Y.N.; Zhang, Q.F.; Xia, Z.H.; Hao, H.C.; Xia, Q.Q. Potential evapotranspiration determines changes in the carbon sequestration capacity of forest and grass ecosystems in Xinjiang, Northwest China. Glob. Ecol. Conserv. 2023, 48, 2351–9894. [Google Scholar] [CrossRef]
- Dai, E.F.; Huang, Y.; Wu, Z.; Zhao, D.S. Spatial-temporal features of carbon source-sink and its relationship with climate factors in Inner Mongolia grassland ecosystem. Acta Geogr. Sin. 2016, 71, 21–34. [Google Scholar]
- Yang, Z.L.; Feng, Y.S.; Zhang, T.B.; Wu, H.; Zhang, C.; Xie, H.J.; Li, J. Spatiotemporal Variation Characteristics of Vegetation Carbon Use Efficiency and Its Driving Factors in Southwest China over the Past 20 Years. Clim. Environ. Res. 2024, 29, 267–280. (In Chinese) [Google Scholar]
- Ma, X.Z.; Wang, Z. Progress in the study on the impact of land-use change on regional carbon sources and sinks. Acta Ecol. Sin. 2015, 35, 5898–5907. [Google Scholar]
- Yang, Y.H.; Shi, Y.; Sun, W.J. Terrestrial carbon sinks in China and around the world and their contribution to carbon neutrality. Sci. China Life Sci. 2022, 52, 534–574. [Google Scholar]
- Liu, C.G.; Sun, W.; Zhang, L.C. Spatio-temporal pattern of coupling coordination degree between carbon emissions and vegetation cover and its influencing factors of the Yangtze River Delta. Sci. Geogr. Sin. 2023, 43, 142–151. [Google Scholar]
- Zhao, Y.X.; Qie, X.; Yang, Q.F. Spatiotemporal Evolution of Ecosystem Carbon Sources/Sinks in Hebei Province from 2000 to 2020. J. Change River Sci. Res. Inst. 2025, 42, 77–85. [Google Scholar]
- Zhang, M.Y.; Wei, H.T.; Xu, Q.; Chai, Z.L. Spatio-temporal Evolution Characteristics and Driving Factors of Carbon Sources/Sinks in Henan Province. Geospat. Inf. 2025, 23, 51–56. [Google Scholar]
- Liu, H.; Wei, X.P. Spatial-temporal Evolution of Carbon Source/Sink and Its Influencing Factors in Chongqing Functional Area. Environ. Sci. 2025, 1–22. [Google Scholar] [CrossRef]
- Li, D.W.; Li, L. Driving factors and decoupling effects of agricultural carbon emission in Gansu Province under the background of ‘double carbon’. Anhui Agric. Sci. Bull. 2023, 29, 171–178. [Google Scholar]
- Wei, H.; Zhao, W.W.; Zhang, X.; Wang, X.Z. Regional ecosystem service value evaluation based on land use changes: A case study in Dezhou, Shandong Provience, China. Acta Ecol. Sin. 2017, 37, 3830–3839. [Google Scholar] [CrossRef][Green Version]
- Hu, Y.F.; Ming, T.; Chai, C.F. Effects of Land Use Change on Spatial and Temporal Evolution Pattern of Carbon Emissions in Shandong Province. China Transp. Rev. 2024, 46, 167–174. [Google Scholar][Green Version]
- Gong, W.F.; Qi, X.H.; Wang, Y. Effects of the Driving Factors of Carbon Emission in Shandong Province. J. Southwest Pet. Univ. (Soc. Sci. Ed.) 2020, 22, 11–20. [Google Scholar][Green Version]
- Wang, C.L.; Liu, H.F.; Wang, H.J.; Zhao, X.Q.; Cui, Y.J.; Wang, Z.H.; Zhan, J.C. Spatial and Temporal Changes in Soil Carbon Storage in the Lower Yellow River Basin, Shangdong Province. Earth Environ. 2014, 42, 228–237. [Google Scholar][Green Version]
- Department of Natural Resources of Shandong Province. Notice on the Issuance of the “14th Five-Year” Forestry Protection and Development Plan of Shandong Province. Available online: http://www.shandong.gov.cn/art/2022/1/5/art_98993_10331552.html (accessed on 31 December 2021).
- Zhu, J.H.; Tian, Y.; Li, Q.; Liu, H.Y.; Guo, X.Y.; Tian, H.L.; Liu, C.F.; Xiao, W.F. The current and potential carbon sink in forest ecosystem in China. Acta Ecol. Sin. 2023, 43, 3442–3457. [Google Scholar] [CrossRef]
- Yang, J.; Xie, B.P.; Zhang, D.G. Spatio-temporal evolution of carbon stocks in the Yellow River Basin based on InVEST and CA-Markov models. Chin. J. Eco-Agric. 2021, 29, 1018–1029. [Google Scholar]
- Zhang, Y.; Meng, N.; Jiang, Y.F. Coupling and long-term change characteristics analysis of forest carbon sequestration and forestry economic development in China. J. Beijing For. Univ. 2022, 44, 129–141. [Google Scholar]
- Wang, Y.Q.; Tan, D.M.; Zhang, J.T.; Meng, N.; Han, B.L.; Ouyang, Z.Y. The impact of urbanization on carbon emissions: Analysis of panel data from 158 cities in China. Acta Ecol. Sin. 2020, 40, 7897–7907. [Google Scholar] [CrossRef]
- Liu, J.J.; Jiang, T.L.; Yang, X.Y.; Sun, J.; Liu, G.F. Analysis of CO2 Column Concentration in Shandong Province Based on OCO-2/OCO-3 Data. J. Hebei Univ. Environ. Eng. 2023, 33, 74–78. [Google Scholar]
- Jiang, J.K.; Zhu, S.L.; Cao, J.C.; Li, X.D.; Xue, Y.W. Analysis of Coupling Coordination between New Urbanization and Carbon Emission Level: A Case Study of Shandong Province. Ecol. Econ. 2023, 39, 76–82. [Google Scholar]
- Song, G.; Han, F.; Xu, J.W.; Yang, Z.J.; Mu, H.X.; Wang, Z.Y.; Wang, Z. Distribution suitability analysis of the tree species of shelter forest in coastal area of Shandong based on LandUSEM model. J. Nanjing For. Univ. (Nat. Sci. Ed.) 2022, 47, 42–50. [Google Scholar]
- Roy, S.; Kapoor, R.; Mathur, P. Revisiting Changes in Growth, Physiology and Stress Responses of Plants under the Effect of Enhanced CO2 and Temperature. Plant Cell Physiol. 2024, 65, 4–19. [Google Scholar] [CrossRef]
- Zhao, L.; Zhang, C.; Wang, Q. Climate extremes and land use carbon emissions: Insight from the perspective of sustainable land use in the eastern coast of China. J. Clean. Prod. 2024, 452, 142219. [Google Scholar] [CrossRef]
- Liu, X.Y.; Zhao, Y.C.; Qin, F.L.; Shi, X.S. Study on uncertainty sources of century model for simulating soil organic carbon dynamics of typical cinnamon soil in Shandong province. Quat. Sci. 2014, 34, 865–872. [Google Scholar]

| Region | Genre | Paradigm | ||
|---|---|---|---|---|
| Carbon sink area | GPP strong master control | θNEP > 0 | θGPP > 0 | θRs < 0 |
| RS strong master control | θNEP > 0 | θGPP < 0 | θRs < 0 | |
| GPP weak master control | θNEP > 0 | θGPP > 0 | θRs > 0 | |
| Carbon source area | GPP strong master control | θNEP < 0 | θGPP < 0 | θRs < 0 |
| RS weak master control | θNEP < 0 | θGPP < 0 | θRs > 0 | |
| RS strong master control | θNEP < 0 | θGPP > 0 | θRs > 0 | |
| Driving Factor | Basis of Selection |
|---|---|
| Night Lights | Correlation between nighttime light levels and carbon emissions [28]. |
| Population Density | High population density distribution is a key factor contributing to the increasing disparity between carbon output and carbon absorption [29]. |
| Potential Evapotranspiration | Potential evapotranspiration is a key natural factor influencing ecosystem carbon use efficiency [30]. |
| Precipitation | Precipitation effects on plant metabolism are directly related [31]. |
| Daylight Hours | Significant correlation between sunshine duration and vegetation carbon utilization rate [32]. |
| Temperatures | The effect of temperature on plant metabolism is directly related [31]. |
| Land Use | The transformation of land use has a profound impact on the carbon cycle within continental ecosystems, functioning as both a carbon emitters/absorber [33]. |
| GDP | Rapid economic growth is a key factor in widening the gap between carbon emissions and carbon sinks [29]. |
| Atmospheric CO2 Concentration | Rising atmospheric CO2 concentration and other important factors affecting the strength of terrestrial carbon sinks [34]. |
| Fractional Vegetation Cover | Coupling harmonization is generally higher in areas where the combined vegetation cover rating is higher than the combined carbon emissions rating [35]. |
| Weights (%) | Driving Factors | ||||||||||
|---|---|---|---|---|---|---|---|---|---|---|---|
| NTLI | PEO | PET | PRE | DH | TEMP | LUCC | GDP | CO2 | FVC | ||
| Ex | GPP | 6.8 | 11.4 | 4.61 | 5.75 | 6.86 | 6.55 | 30.24 | 6.63 | 6.69 | 14.48 |
| NEP | 4.81 | 9.65 | 7.23 | 7.62 | 6.62 | 10.28 | 18.08 | 8.32 | 10.64 | 16.75 | |
| NPP | 6.07 | 9.11 | 6.61 | 7.41 | 7.09 | 9.67 | 18.60 | 8.63 | 10.86 | 15.94 | |
| Rs | 6.46 | 10.67 | 6.56 | 7.32 | 5.02 | 9.56 | 17.57 | 8.91 | 8.22 | 19.73 | |
| Ra | 6.47 | 10.86 | 7.43 | 6.38 | 5.00 | 9.28 | 16.42 | 7.91 | 7.90 | 22.35 | |
| En | GPP | 6.54 | 2.92 | 4.07 | 7.37 | 1.31 | 4.71 | 12.01 | 4.33 | 4.94 | 6.20 |
| NEP | 4.40 | 7.55 | 5.77 | 4.77 | 6.79 | 7.19 | 7.78 | 6.57 | 6.24 | 6.34 | |
| NPP | 4.80 | 7.02 | 5.55 | 4.22 | 6.56 | 8.04 | 8.29 | 6.60 | 6.43 | 7.77 | |
| Rs | 5.73 | 9.84 | 5.23 | 5.42 | 3.50 | 6.56 | 8.04 | 5.09 | 6.33 | 6.28 | |
| Ra | 5.49 | 9.94 | 6.44 | 4.74 | 3.57 | 6.41 | 7.57 | 4.65 | 6.91 | 7.26 | |
| Rh | 4.51 | 5.95 | 6.71 | 8.73 | 6.91 | 7.85 | 6.66 | 7.60 | 6.87 | 7.80 | |
| He | GPP | 2.37 | 4.42 | 1.91 | 2.38 | 0.37 | 2.43 | 2.58 | 2.38 | 0.94 | 1.58 |
| NEP | 1.05 | 2.56 | 1.51 | 3.27 | 2.71 | 2.61 | 2.99 | 3.71 | 2.30 | 2.62 | |
| NPP | 2.82 | 2.34 | 0.92 | 2.45 | 2.99 | 2.03 | 3.18 | 4.22 | 1.76 | 2.56 | |
| Rs | 0.77 | 4.18 | 1.89 | 1.58 | 0.96 | 0.81 | 2.82 | 2.37 | 4.68 | 2.37 | |
| Ra | 1.55 | 3.85 | 2.04 | 0.27 | 1.35 | 2.22 | 1.43 | 1.24 | 5.65 | 0.88 | |
| Rh | 1.18 | 1.50 | 1.25 | 2.39 | 1.75 | 1.99 | 0.66 | 1.57 | 1.28 | 3.66 | |
| Weights (%) | Absolute Carbon Sink Cities | Relative Carbon Source Cities | |||||||||||
|---|---|---|---|---|---|---|---|---|---|---|---|---|---|
| GPP | NEP | NPP | Rs | Ra | Rh | GPP | NEP | NPP | Rs | Ra | Rh | ||
| Ex | NTLI | 6.06 | 6.70 | 8.02 | 6.52 | 5.95 | 5.72 | 5.13 | 2.39 | 3.57 | 6.39 | 7.14 | 10.2 |
| POP | 12.17 | 10.28 | 9.00 | 11.37 | 11.71 | 7.09 | 8.83 | 8.85 | 9.24 | 9.76 | 9.76 | 6.33 | |
| PET | 7.32 | 8.19 | 7.73 | 6.84 | 7.58 | 7.47 | 7.40 | 6.00 | 5.16 | 6.19 | 7.25 | 9.48 | |
| PRE | 5.48 | 6.44 | 6.41 | 6.48 | 6.30 | 4.83 | 6.18 | 9.14 | 8.69 | 8.39 | 6.49 | 14.65 | |
| DH | 5.24 | 6.74 | 6.14 | 3.90 | 4.34 | 9.11 | 6.65 | 6.47 | 8.31 | 6.46 | 5.85 | 11.66 | |
| TEMP | 9.33 | 10.98 | 11.53 | 8.23 | 8.75 | 8.76 | 7.99 | 9.38 | 7.29 | 11.27 | 9.96 | 10.06 | |
| LUCC | 19.00 | 17.07 | 17.34 | 18.80 | 17.02 | 16.63 | 19.01 | 19.39 | 20.22 | 15.98 | 15.66 | 11.77 | |
| GDP | 6.90 | 9.22 | 10.66 | 9.35 | 7.96 | 11.08 | 8.54 | 7.16 | 6.01 | 8.34 | 7.84 | 7.51 | |
| CO2 | 9.74 | 10.72 | 10.63 | 10.18 | 9.38 | 17.02 | 6.53 | 10.53 | 11.16 | 5.69 | 6.00 | 9.60 | |
| FVC | 18.76 | 13.66 | 12.52 | 18.33 | 21.02 | 12.30 | 23.75 | 20.71 | 20.34 | 21.53 | 24.06 | 8.73 | |
| En | NTLI | 5.69 | 4.03 | 5.17 | 5.71 | 5.62 | 4.36 | 4.44 | 2.68 | 2.61 | 5.76 | 5.34 | 2.93 |
| POP | 8.62 | 9.22 | 7.02 | 9.30 | 9.02 | 5.19 | 5.29 | 5.38 | 7.07 | 6.38 | 5.75 | 6.87 | |
| PET | 5.01 | 6.27 | 6.27 | 5.11 | 4.75 | 6.83 | 6.43 | 5.07 | 4.22 | 5.24 | 8.48 | 6.28 | |
| PRE | 4.39 | 3.32 | 3.54 | 4.27 | 3.37 | 5.40 | 6.28 | 6.59 | 5.38 | 6.95 | 6.50 | 8.29 | |
| DH | 4.00 | 7.74 | 7.23 | 2.60 | 3.90 | 4.87 | 1.32 | 5.61 | 4.97 | 3.89 | 2.88 | 9.91 | |
| TEMP | 4.24 | 6.97 | 6.56 | 4.68 | 4.01 | 8.11 | 7.33 | 6.97 | 8.03 | 7.96 | 9.70 | 7.60 | |
| LUCC | 9.91 | 7.97 | 8.33 | 9.13 | 9.37 | 4.54 | 9.27 | 7.18 | 7.97 | 9.79 | 10.23 | 7.43 | |
| GDP | 4.70 | 8.67 | 9.46 | 6.01 | 5.00 | 8.44 | 2.07 | 4.32 | 4.07 | 4.01 | 4.22 | 6.06 | |
| CO2 | 10.24 | 5.87 | 6.46 | 8.16 | 9.86 | 6.17 | 5.57 | 6.76 | 6.19 | 3.71 | 4.08 | 5.51 | |
| FVC | 8.23 | 7.28 | 8.82 | 6.37 | 7.15 | 7.37 | 11.02 | 4.56 | 5.52 | 6.32 | 12.16 | 7.61 | |
| En | NTLI | 2.12 | 1.80 | 3.96 | 0.91 | 1.26 | 0.65 | 1.65 | 0.43 | 1.04 | 2.85 | 0.09 | 0.65 |
| POP | 1.59 | 3.35 | 1.94 | 2.84 | 2.00 | 1.57 | 1.04 | 0.63 | 1.06 | 0.84 | 0.72 | 2.70 | |
| PET | 2.09 | 1.41 | 1.01 | 1.44 | 2.17 | 3.00 | 2.99 | 1.08 | 1.33 | 0.59 | 4.26 | 2.75 | |
| PRE | 0.52 | 1.03 | 1.02 | 1.24 | 1.50 | 1.82 | 1.24 | 4.69 | 3.42 | 2.38 | 2.03 | 0.87 | |
| DH | 0.37 | 2.85 | 2.77 | 0.30 | 1.18 | 0.99 | 0.63 | 1.91 | 1.43 | 0.38 | 0.95 | 2.36 | |
| TEMP | 1.62 | 1.53 | 2.62 | 0.88 | 1.97 | 2.01 | 1.05 | 5.30 | 2.90 | 3.10 | 2.59 | 1.72 | |
| LUCC | 1.61 | 3.72 | 4.47 | 1.33 | 1.66 | 0.22 | 2.16 | 3.19 | 2.98 | 4.06 | 3.01 | 3.41 | |
| GDP | 2.20 | 3.18 | 2.09 | 3.53 | 2.54 | 2.50 | 0.67 | 2.66 | 1.50 | 1.66 | 1.36 | 1.53 | |
| CO2 | 6.37 | 2.64 | 2.01 | 5.30 | 5.95 | 2.03 | 0.88 | 3.12 | 3.40 | 1.26 | 1.52 | 0.68 | |
| FVC | 1.78 | 1.30 | 2.49 | 3.04 | 1.33 | 5.68 | 1.61 | 0.78 | 1.13 | 2.32 | 2.11 | 1.96 | |
Disclaimer/Publisher’s Note: The statements, opinions and data contained in all publications are solely those of the individual author(s) and contributor(s) and not of MDPI and/or the editor(s). MDPI and/or the editor(s) disclaim responsibility for any injury to people or property resulting from any ideas, methods, instructions or products referred to in the content. |
© 2025 by the authors. Published by MDPI on behalf of the International Society for Photogrammetry and Remote Sensing. Licensee MDPI, Basel, Switzerland. This article is an open access article distributed under the terms and conditions of the Creative Commons Attribution (CC BY) license (https://creativecommons.org/licenses/by/4.0/).
Share and Cite
Xu, X.; Han, F.; Zhao, J.; Li, Y.; Lei, Z.; Zhang, S.; Han, H. An Analysis of the Spatiotemporal Evolution, Key Control Features, and Driving Mechanisms of Carbon Source/Sink in the Continental Ecosystem of China’s Shandong Province from 2001 to 2020. ISPRS Int. J. Geo-Inf. 2025, 14, 329. https://doi.org/10.3390/ijgi14090329
Xu X, Han F, Zhao J, Li Y, Lei Z, Zhang S, Han H. An Analysis of the Spatiotemporal Evolution, Key Control Features, and Driving Mechanisms of Carbon Source/Sink in the Continental Ecosystem of China’s Shandong Province from 2001 to 2020. ISPRS International Journal of Geo-Information. 2025; 14(9):329. https://doi.org/10.3390/ijgi14090329
Chicago/Turabian StyleXu, Xiaolong, Fang Han, Junxin Zhao, Youheng Li, Ziqiang Lei, Shan Zhang, and Hui Han. 2025. "An Analysis of the Spatiotemporal Evolution, Key Control Features, and Driving Mechanisms of Carbon Source/Sink in the Continental Ecosystem of China’s Shandong Province from 2001 to 2020" ISPRS International Journal of Geo-Information 14, no. 9: 329. https://doi.org/10.3390/ijgi14090329
APA StyleXu, X., Han, F., Zhao, J., Li, Y., Lei, Z., Zhang, S., & Han, H. (2025). An Analysis of the Spatiotemporal Evolution, Key Control Features, and Driving Mechanisms of Carbon Source/Sink in the Continental Ecosystem of China’s Shandong Province from 2001 to 2020. ISPRS International Journal of Geo-Information, 14(9), 329. https://doi.org/10.3390/ijgi14090329


